MATERIALS CHARACTERIZATION OF ELECTRON BEAM MELTED … · MATERIALS CHARACTERIZATION OF ELECTRON...
6
MATERIALS CHARACTERIZATION OF ELECTRON BEAM MELTED Ti-6Al-4V Susan Draper 1 , Brad Lerch 1 , Richard Rogers 1 , Richard Martin 2 , Ivan Locci 3 , Anita Garg 3 1 NASA Glenn Research Center, Cleveland, OH 2 Cleveland State University, Cleveland, OH 3 University of Toledo, Toledo, OH Abstract An in-depth material characterization of Electron Beam Melted (EBM) Ti-6Al-4V material has been completed. Hot Isostatic Pressing (HIP) was utilized to close porosity from fabrication and also served as a material heat treatment to obtain the desired microstructure. The changes in the microstructure and chemistry from the powder to pre-HIP and post-HIP material have been analyzed. Computed tomography (CT) scans indicated porosity closure during HIP and high-density inclusions scattered throughout the specimens. The results of tensile and high cycle fatigue (HCF) testing are compared to conventional Ti-6Al-4V. The EBM Ti-6Al-4V had similar or superior mechanical properties compared to conventionally manufactured Ti-6Al-4V. Introduction In cooperation with the United States Air Force to advance technologies for in- space propulsion systems, NASA has generated a material database for EBM Ti- 6Al-4V. While Ti-6Al-4V has been manufactured by electron beam melting for a number of years, a database of microstructure and corresponding mechanical properties from cryogenic to elevated temperatures was needed for component design. A complete database, including low cycle fatigue, fatigue crack growth, fracture toughness and thermal properties has been generated [1]; however, this paper will include only the tensile and HCF properties. The ultimate goal is to use additive manufacturing to produce a Ti-6Al- 4V gimbal cone for the RL10 rocket engine. Additive manufacturing enables a reduction in component ordering lead-time and a reduction in cost compared to the currently forged and machined Al alloy component. Electron beam melting (EBM) was selected as the additive manufacturing technique as it has the advantages of operating in a vacuum to reduce oxygen pick-up and reduced residual stresses. Material and Test Procedure The EBM Ti-6Al-4V material was procured from the Department of Energy’s Kansas City Plant at the National Secure Manufacturing Center (NSMC). The specimens were fabricated by an Arcam A2X EBM machine using EBM Control Software Version 3.2.132 and the standard Arcam Ti6Al4V 50 μm Theme Version 3.2.121 [2]. The samples were fabricated under eight separate builds with the material divided into two lots for material testing purposes. The samples were fabricated oversized to allow for machining. Specimen cubes and cylindrical bars were fabricated vertically for the majority of the specimens but a small build of horizontal, cylindrical samples was also fabricated to check for orientation effects. Microstuctural features were measured on 5 micrographs per sample and the feature sizes were estimated using line lengths that do not account for three- dimensional shape. All error bars represent 95% confidence intervals. https://ntrs.nasa.gov/search.jsp?R=20150022121 2018-06-25T01:47:57+00:00Z
Transcript of MATERIALS CHARACTERIZATION OF ELECTRON BEAM MELTED … · MATERIALS CHARACTERIZATION OF ELECTRON...

MATERIALS CHARACTERIZATION OF ELECTRON BEAM MELTED Ti-6Al-4V
Susan Draper1, Brad Lerch1, Richard Rogers1, Richard Martin2, Ivan Locci3, Anita Garg3
1NASA Glenn Research Center, Cleveland, OH 2 Cleveland State University, Cleveland, OH
3University of Toledo, Toledo, OH
Abstract
An in-depth material characterization of Electron Beam Melted (EBM) Ti-6Al-4V material has been completed. Hot Isostatic Pressing (HIP) was utilized to close porosity from fabrication and also served as a material heat treatment to obtain the desired microstructure. The changes in the microstructure and chemistry from the powder to pre-HIP and post-HIP material have been analyzed. Computed tomography (CT) scans indicated porosity closure during HIP and high-density inclusions scattered throughout the specimens. The results of tensile and high cycle fatigue (HCF) testing are compared to conventional Ti-6Al-4V. The EBM Ti-6Al-4V had similar or superior mechanical properties compared to conventionally manufactured Ti-6Al-4V. Introduction
In cooperation with the United States Air Force to advance technologies for in-space propulsion systems, NASA has generated a material database for EBM Ti-6Al-4V. While Ti-6Al-4V has been manufactured by electron beam melting for a number of years, a database of microstructure and corresponding mechanical properties from cryogenic to elevated temperatures was needed for component design. A complete database, including low cycle fatigue, fatigue crack growth, fracture toughness and thermal properties has been generated [1]; however, this paper will include only the tensile and
HCF properties. The ultimate goal is to use additive manufacturing to produce a Ti-6Al-4V gimbal cone for the RL10 rocket engine. Additive manufacturing enables a reduction in component ordering lead-time and a reduction in cost compared to the currently forged and machined Al alloy component. Electron beam melting (EBM) was selected as the additive manufacturing technique as it has the advantages of operating in a vacuum to reduce oxygen pick-up and reduced residual stresses.
Material and Test Procedure
The EBM Ti-6Al-4V material was procured from the Department of Energy’s Kansas City Plant at the National Secure Manufacturing Center (NSMC). The specimens were fabricated by an Arcam A2X EBM machine using EBM Control Software Version 3.2.132 and the standard Arcam Ti6Al4V 50 µm Theme Version 3.2.121 [2]. The samples were fabricated under eight separate builds with the material divided into two lots for material testing purposes. The samples were fabricated oversized to allow for machining. Specimen cubes and cylindrical bars were fabricated vertically for the majority of the specimens but a small build of horizontal, cylindrical samples was also fabricated to check for orientation effects. Microstuctural features were measured on 5 micrographs per sample and the feature sizes were estimated using line lengths that do not account for three-dimensional shape. All error bars represent 95% confidence intervals.
https://ntrs.nasa.gov/search.jsp?R=20150022121 2018-06-25T01:47:57+00:00Z
All mechanical test samples were hot isostatically pressed (HIP) to close internal porosity at 899°C /103 MPa for 2 hours. Tensile tests were performed in strain control at a rate of .0001/sec. HCF tests were conducted in load control at a frequency of 20-30 Hz. Tests were performed using a sinusoidal waveform at three load ratios, Rσ , of -1, 0.1, and 0.5 and test temperatures of -196, 20, and 149ºC. Ten million cycles was the runout value for the long-term tests. The crack origin(s) on every sample was identified using optical microscopy and SEM.
Results and Discussion
The chemistry of the starting powder, taken from the Arcam machine after every build, and fabricated samples were analyzed, Table I. The powder composition was uniform from build to build so only one composition is given in Table I. The oxygen content of the starting powder was above the ASTM standard limit and remained there after fabrication and HIP. All other elements were within the specification range.
In the as-manufactured state, the sample contained a population of porosity that was detected by computed tomography (CT) and metallography. Pore size was measured on a metallographic sample and averaged 33 ± 4 µm, with pore size ranging from 7 to 106 µm. Following HIP, CT and
metallography confirmed full porosity closure. High-density indications were observed in the CT scans and these remained after HIP.
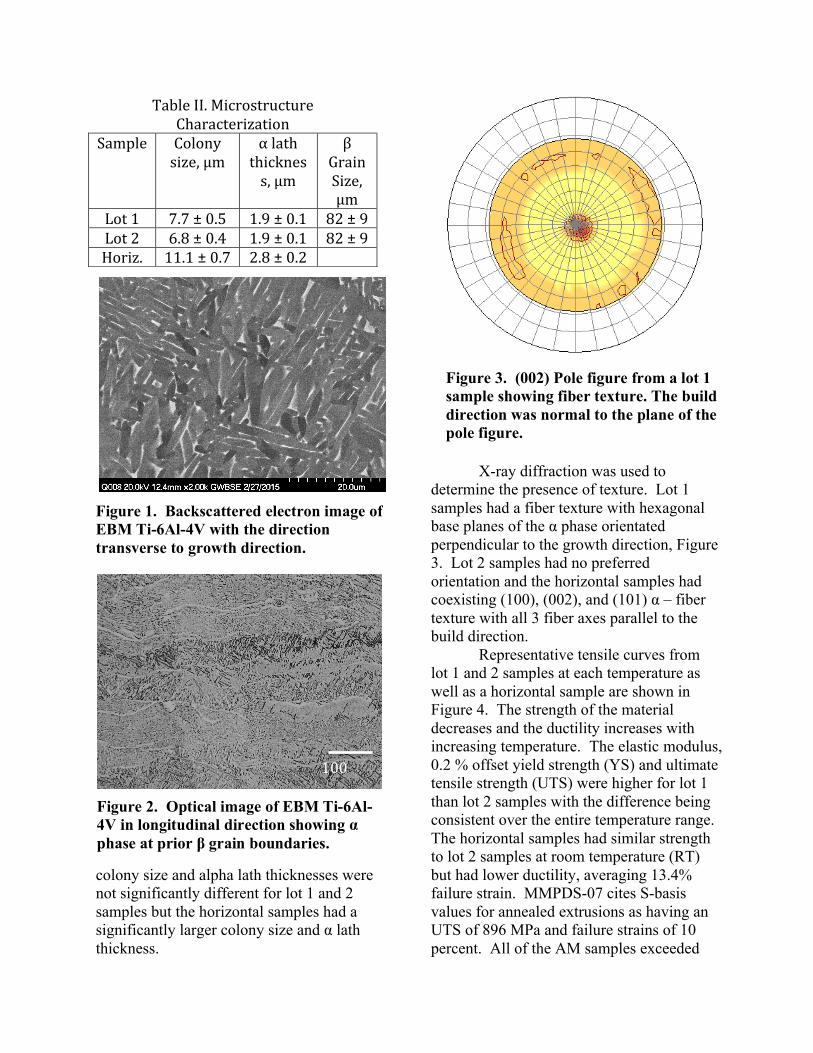
The hot isostatic pressure (HIP) temperature was below the β transus temperature for Ti-6Al-4V. The post HIP microstructure is made up of columnar prior β grains, a transformed α + β microstructure, Figure 1. The columnar microstructure is best observed in optical micrographs of longitudinal samples etched with Kroll’s, Figure 2. The EBM processing theme utilized 50 µm thick layers and the build layers are not visible in the microstructure. The prior β grains extend beyond several build layers. Transmission electron microscopy confirmed the presence of α and β phases.
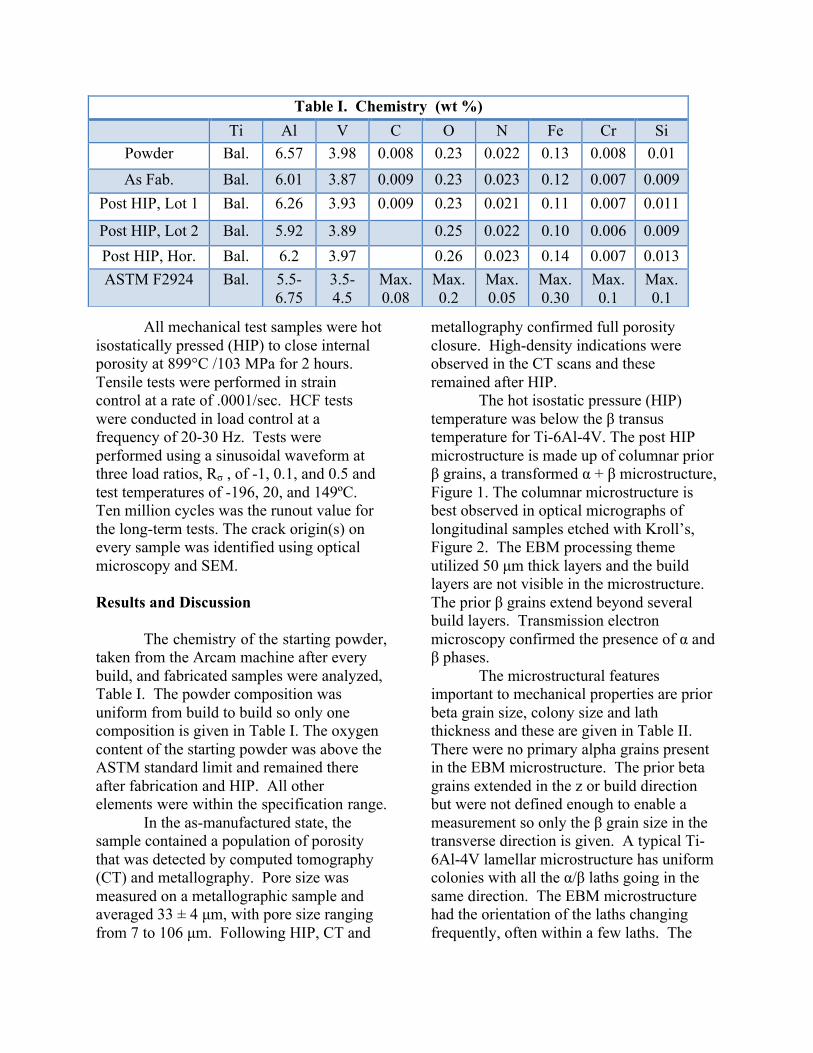
The microstructural features important to mechanical properties are prior beta grain size, colony size and lath thickness and these are given in Table II. There were no primary alpha grains present in the EBM microstructure. The prior beta grains extended in the z or build direction but were not defined enough to enable a measurement so only the β grain size in the transverse direction is given. A typical Ti-6Al-4V lamellar microstructure has uniform colonies with all the α/β laths going in the same direction. The EBM microstructure had the orientation of the laths changing frequently, often within a few laths. The
Table I. Chemistry (wt %) Ti Al V C O N Fe Cr Si
Powder Bal. 6.57 3.98 0.008 0.23 0.022 0.13 0.008 0.01 As Fab. Bal. 6.01 3.87 0.009 0.23 0.023 0.12 0.007 0.009
Post HIP, Lot 1 Bal. 6.26 3.93 0.009 0.23 0.021 0.11 0.007 0.011
Post HIP, Lot 2 Bal. 5.92 3.89 0.25 0.022 0.10 0.006 0.009 Post HIP, Hor. Bal. 6.2 3.97 0.26 0.023 0.14 0.007 0.013 ASTM F2924 Bal. 5.5-
6.75 3.5-4.5
Max. 0.08
Max. 0.2
Max. 0.05
Max. 0.30
Max. 0.1
Max. 0.1
colony size and alpha lath thicknesses were not significantly different for lot 1 and 2 samples but the horizontal samples had a significantly larger colony size and α lath thickness.
X-ray diffraction was used to determine the presence of texture. Lot 1 samples had a fiber texture with hexagonal base planes of the α phase orientated perpendicular to the growth direction, Figure 3. Lot 2 samples had no preferred orientation and the horizontal samples had coexisting (100), (002), and (101) α – fiber texture with all 3 fiber axes parallel to the build direction.
Representative tensile curves from lot 1 and 2 samples at each temperature as well as a horizontal sample are shown in Figure 4. The strength of the material decreases and the ductility increases with increasing temperature. The elastic modulus, 0.2 % offset yield strength (YS) and ultimate tensile strength (UTS) were higher for lot 1 than lot 2 samples with the difference being consistent over the entire temperature range. The horizontal samples had similar strength to lot 2 samples at room temperature (RT) but had lower ductility, averaging 13.4% failure strain. MMPDS-07 cites S-basis values for annealed extrusions as having an UTS of 896 MPa and failure strains of 10 percent. All of the AM samples exceeded
Table II. Microstructure Characterization
Sample Colony size, µm
α lath thickness, µm
β Grain Size, μm
Lot 1 7.7 ± 0.5 1.9 ± 0.1 82 ± 9 Lot 2 6.8 ± 0.4 1.9 ± 0.1 82 ± 9 Horiz. 11.1 ± 0.7 2.8 ± 0.2
100 µm
Figure 2. Optical image of EBM Ti-6Al-4V in longitudinal direction showing α phase at prior β grain boundaries.
Figure 1. Backscattered electron image of EBM Ti-6Al-4V with the direction transverse to growth direction.
Figure 3. (002) Pole figure from a lot 1 sample showing fiber texture. The build direction was normal to the plane of the pole figure.

these values with the exception of the failure strain for one sample that failed at a low-density inclusion containing Si, Al, O, and Ca.
The high strength of the EBM material is likely due to it’s refined lamellar microstructure with colony sizes on the order of 10 µm compared to 20 to 500 µm [3, 4, 6] for conventionally manufactured lamellar microstructures. The difference in strength between lots 1 and 2 can only be explained by the difference in texture. (002) fiber texture has been shown to increase the strength of Ti-6Al-4V [5]. The samples were fabricated within days of each other using the same build parameters; however, the builds were sectioned slightly differently. Lot 1 samples were built in quadrants and halves, with arrays of 4 x 5 samples fabricated per quadrant/half, whereas lot 2 was fabricated in sections with arrays of 3 x 3 samples in each section. Lot 1 thus had a longer scan length per section compared to Lot 2. Arcam has studied the effect of array size on tensile strength and found no difference in tensile strength between samples built in a 3x3 compared to a 5x5 array [2]. It’s not clear why lot 1 had a fiber texture and lot 2 had a random texture.
The difference in strength for the horizontal samples could be explained by the larger colony size and alpha lath thickness. Slip length is effectively controlled by the colony size [3, 6]. Larger colonies allow for longer slip and slightly lower strengths. Additionally, the alpha phase present at the prior beta grain boundaries was perpendicular to the tensile axis. The alpha phase exhibited a brittle appearance on the fracture surfaces of the horizontal samples and is likely the cause of the lower ductility.
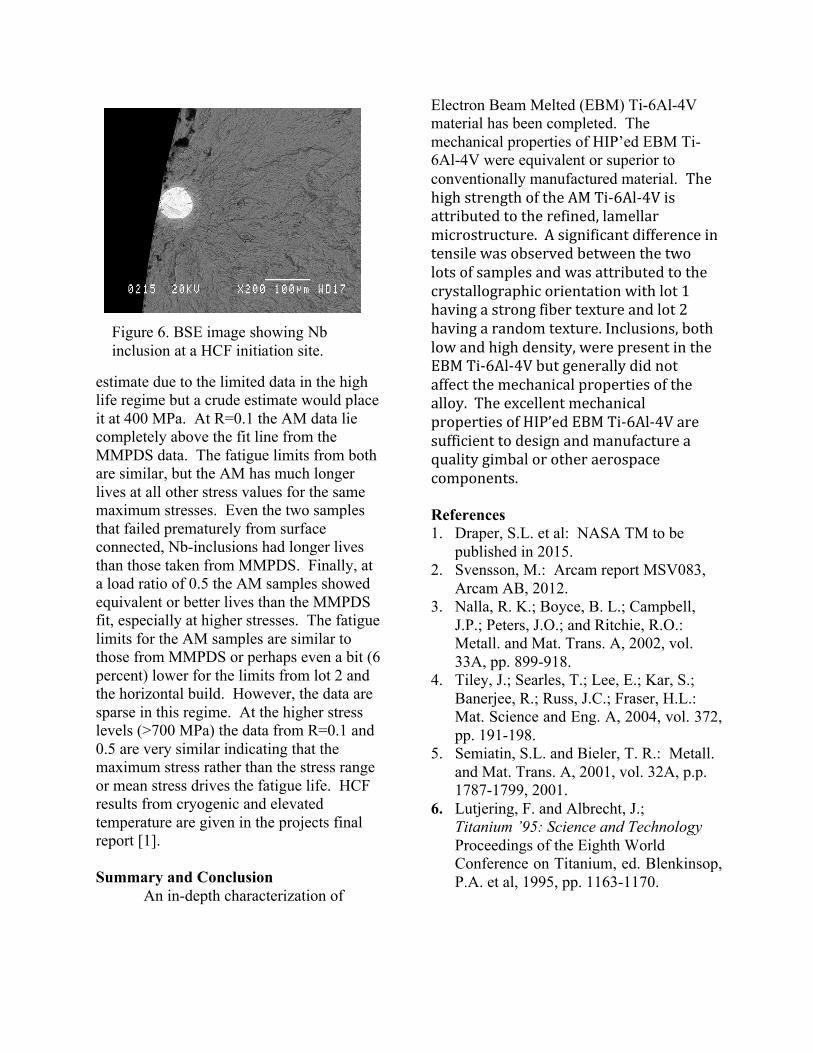
A summary of 20˚C high cycle fatigue results is given in Figure 5. Noted on this figure are samples that failed from Nb inclusions, Figure 6. These inclusions
were detected with NDE and noted as high-density inclusions scattered throughout all the samples. The inclusions appear to be round powder particles and contain only Nb. The Arcam system utilized was a dedicated Ti-6Al-4V system and no other alloy has ever been melted in this system. It is believed the Nb came from the starting powder.
HCF data on conventionally manufactured, annealed Ti-6-4 samples tested at NASA for an ASTM E466 round robin exercise is plotted in Figure 5 along with three curves, which were taken from MMPDS-07 for annealed Ti-6-4 at three equivalent mean stresses (0, 324, and 483 MPa). These mean stresses are similar to those used for the additive manufactured testing1. The UTS for this material was 945 MPa and is 100 MPa lower than the lowest ultimate strength value exhibited by the AM material. The lines in Figure 5 were reconstructed from the best-fit equations based on equivalent stresses in the MMPDS chapter on Ti-6-4. It is shown that the additive manufactured samples are superior to both the ASTM and MMPDS data. The exception is for the one AM sample, which failed at a surface connected, Nb-inclusion, and even that sample is well within the scatter from the MMPDS data.
Data for the three load ratios (Rσ = -1, 0.1, and 0.5) are plotted with specific colors; black for R=-1, orange for 0.1, and green for .5. At R=-1, the fatigue limit of the AM material is 550 MPa, significantly higher than the fatigue limit of approximately 350 MPa for MMPDS data. This trend is understandable since the UTS for the lot 1 material is 1130 MPa and for the MMPDS is only 945 MPa, a 185 MPa difference. The fatigue limit for the ASTM data is difficult
1 The tests from MMPDS were conducted using a constant mean stress, not a constant load ratio as was done with both the AM and ASTM E466 samples.
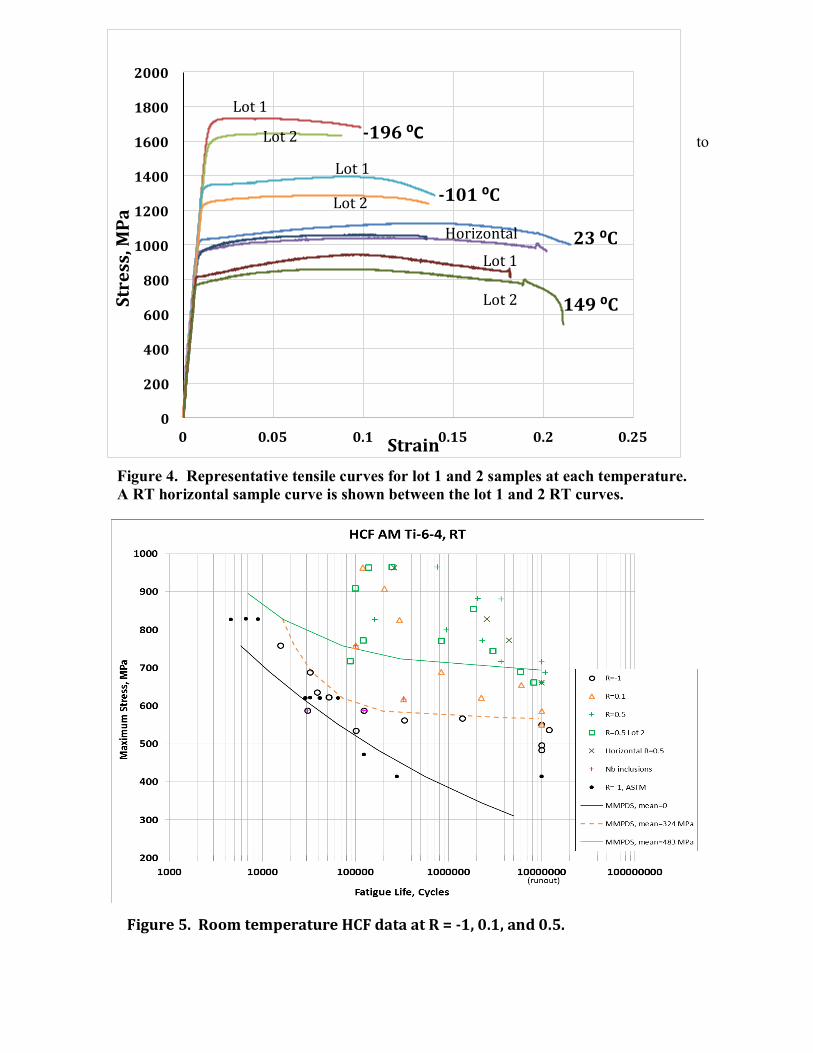
to
0
200
400
600
800
1000
1200
1400
1600
1800
2000
0 0.05 0.1 0.15 0.2 0.25
Stress, MPa
Strain
-‐196 ⁰C
-‐101 ⁰C
23 ⁰C
149 ⁰C
Lot 1
Lot 2
Lot 1
Lot 2
Lot 1
Horizontal
Lot 2
Figure 4. Representative tensile curves for lot 1 and 2 samples at each temperature. A RT horizontal sample curve is shown between the lot 1 and 2 RT curves.
Figure 5. Room temperature HCF data at R = -‐1, 0.1, and 0.5.
estimate due to the limited data in the high life regime but a crude estimate would place it at 400 MPa. At R=0.1 the AM data lie completely above the fit line from the MMPDS data. The fatigue limits from both are similar, but the AM has much longer lives at all other stress values for the same maximum stresses. Even the two samples that failed prematurely from surface connected, Nb-inclusions had longer lives than those taken from MMPDS. Finally, at a load ratio of 0.5 the AM samples showed equivalent or better lives than the MMPDS fit, especially at higher stresses. The fatigue limits for the AM samples are similar to those from MMPDS or perhaps even a bit (6 percent) lower for the limits from lot 2 and the horizontal build. However, the data are sparse in this regime. At the higher stress levels (>700 MPa) the data from R=0.1 and 0.5 are very similar indicating that the maximum stress rather than the stress range or mean stress drives the fatigue life. HCF results from cryogenic and elevated temperature are given in the projects final report [1].
Summary and Conclusion
An in-depth characterization of
Electron Beam Melted (EBM) Ti-6Al-4V material has been completed. The mechanical properties of HIP’ed EBM Ti-6Al-4V were equivalent or superior to conventionally manufactured material. The high strength of the AM Ti-‐6Al-‐4V is attributed to the refined, lamellar microstructure. A significant difference in tensile was observed between the two lots of samples and was attributed to the crystallographic orientation with lot 1 having a strong fiber texture and lot 2 having a random texture. Inclusions, both low and high density, were present in the EBM Ti-‐6Al-‐4V but generally did not affect the mechanical properties of the alloy. The excellent mechanical properties of HIP’ed EBM Ti-‐6Al-‐4V are sufficient to design and manufacture a quality gimbal or other aerospace components. References 1. Draper, S.L. et al: NASA TM to be
published in 2015. 2. Svensson, M.: Arcam report MSV083,
Arcam AB, 2012. 3. Nalla, R. K.; Boyce, B. L.; Campbell,
J.P.; Peters, J.O.; and Ritchie, R.O.: Metall. and Mat. Trans. A, 2002, vol. 33A, pp. 899-918.
4. Tiley, J.; Searles, T.; Lee, E.; Kar, S.; Banerjee, R.; Russ, J.C.; Fraser, H.L.: Mat. Science and Eng. A, 2004, vol. 372, pp. 191-198.
5. Semiatin, S.L. and Bieler, T. R.: Metall. and Mat. Trans. A, 2001, vol. 32A, p.p. 1787-1799, 2001.
6. Lutjering, F. and Albrecht, J.; Titanium ’95: Science and Technology Proceedings of the Eighth World Conference on Titanium, ed. Blenkinsop, P.A. et al, 1995, pp. 1163-1170.
Figure 6. BSE image showing Nb inclusion at a HCF initiation site.