Materials and Methods Animals Materials and Methods Animals Three mouse strains with different...
25
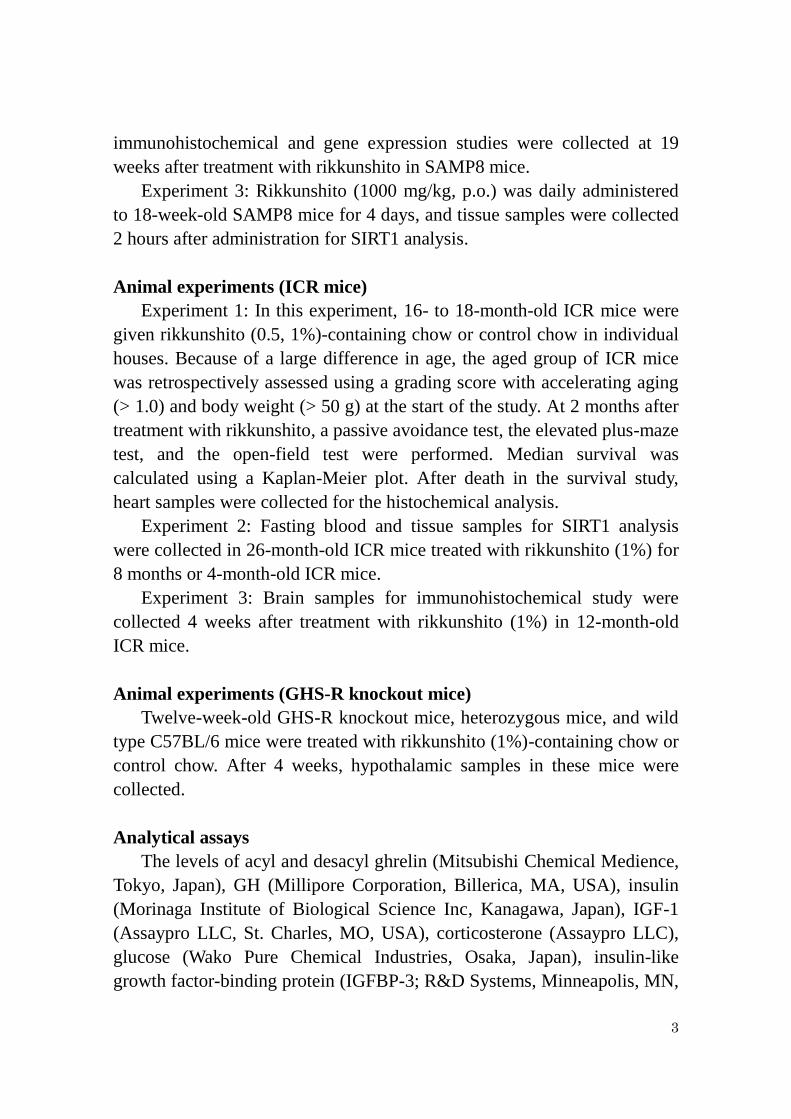
1 Materials and Methods Animals Three mouse strains with different genetic and biochemical backgrounds (klotho-deficient mice, SAMP8 mice, and ICR mice) were used as animal models of aging. Four-week-old male klotho-deficient mice and age-matched wild-type mice were obtained from Japan Clea (Tokyo, Japan). Male SAMP8 and the reference to the control strain, SAMR1 mice, were obtained from Japan SL (Shizuoka, Japan). Twelve-week-old male mice and 16- toC 18-month-old male ICR mice weighing 33-68 g were obtained from Charles River Japan (Yokohama, Japan). Mice were housed in a regulated environment and given free access to water and standard laboratory chow. All experimental procedures were performed according to the "Guidelines for the Care and Use of Laboratory Animals" approved by each laboratory committee. Reagent preparation Ghrelin (acyl ghrelin, Peptide Institute, Osaka, Japan) and GHS-R antagonist (D-Lys3)-GHRP-6 (Bachem California, CA, USA) were dissolved in saline. The Kampo medicine rikkunshito (Tsumura, Tokyo, Japan) is a dried powder from herbal extract composed of the following eight constituents: Atractylodes lancea rhizome (Atractylodis lanceae rhizoma), Ginseng (Ginseng radix), Pinellia Tuber (Pinelliae tuber), Poria Sclerotium (Poria), Jujube (Zizyphi fructus), Citrus Unshiu Peel (Aurantii nobilis pericarpium), Glycyrrhiza (Glycyrrhizae radix), and Ginger (Zingiberis rhizoma). This extract was suspended in distilled water at doses of 500 and 1000 mg/kg for p.o. administration. Atractylodin (Tsumura), an active component of rikkunshito, was dissolved in a 0.1% ethanol and 1% Tween-80 solution. Animal experiments (Klotho-deficient mice) Experiment 1: Briefly, 5-week-old klotho-deficient and wild-type mice were divided into an overnight food-deprived group and free-fed group. Under ether anesthesia, blood samples were collected using a syringe containing aprotinin and ethylenediaminetetraacetic acid (EDTA)-2Na and centrifuged for 3 min at 10,000 rpm. For the ghrelin assay, 10% 1 mol/L
Transcript of Materials and Methods Animals Materials and Methods Animals Three mouse strains with different...
1
Materials and Methods
Animals
Three mouse strains with different genetic and biochemical
backgrounds (klotho-deficient mice, SAMP8 mice, and ICR mice) were
used as animal models of aging. Four-week-old male klotho-deficient mice
and age-matched wild-type mice were obtained from Japan Clea (Tokyo,
Japan). Male SAMP8 and the reference to the control strain, SAMR1 mice,
were obtained from Japan SL (Shizuoka, Japan). Twelve-week-old male
mice and 16- toC 18-month-old male ICR mice weighing 33-68 g were
obtained from Charles River Japan (Yokohama, Japan). Mice were housed
in a regulated environment and given free access to water and standard
laboratory chow. All experimental procedures were performed according to
the "Guidelines for the Care and Use of Laboratory Animals" approved by
each laboratory committee.
Reagent preparation
Ghrelin (acyl ghrelin, Peptide Institute, Osaka, Japan) and GHS-R
antagonist (D-Lys3)-GHRP-6 (Bachem California, CA, USA) were
dissolved in saline. The Kampo medicine rikkunshito (Tsumura, Tokyo,
Japan) is a dried powder from herbal extract composed of the following
eight constituents: Atractylodes lancea rhizome (Atractylodis lanceae
rhizoma), Ginseng (Ginseng radix), Pinellia Tuber (Pinelliae tuber), Poria
Sclerotium (Poria), Jujube (Zizyphi fructus), Citrus Unshiu Peel (Aurantii
nobilis pericarpium), Glycyrrhiza (Glycyrrhizae radix), and Ginger
(Zingiberis rhizoma). This extract was suspended in distilled water at doses
of 500 and 1000 mg/kg for p.o. administration. Atractylodin (Tsumura), an
active component of rikkunshito, was dissolved in a 0.1% ethanol and 1%
Tween-80 solution.
Animal experiments (Klotho-deficient mice)
Experiment 1: Briefly, 5-week-old klotho-deficient and wild-type mice
were divided into an overnight food-deprived group and free-fed group.
Under ether anesthesia, blood samples were collected using a syringe
containing aprotinin and ethylenediaminetetraacetic acid (EDTA)-2Na and
centrifuged for 3 min at 10,000 rpm. For the ghrelin assay, 10% 1 mol/L

2
hydrochloric acid (HCl) was added to the plasma obtained. Tissue samples
were collected and immediately frozen in liquid nitrogen. After processing,
all sample aliquots were stored at -80ºC until measurement.
Experiment 2: Ghrelin (100 μg/kg) was intraperitoneally injected into
klotho-deficient and wild-type mice, and blood samples were collected at
10, 30, and 60 min after administration.
Experiment 3: Ghrelin (100 μg/kg, i.p.) was injected into
klotho-deficient and wild-type mice twice a day (morning and evening) for
4 days. On day 1, food intake in individual houses was measured at 1 and
24 hours after injection. Body weight was measured daily for 4 days.
Experiment 4: Ghrelin (30 and 100 μg/kg, i.p. twice a day),
(D-Lys3)-GHRP-6 (10 μmol/kg, i.p.), rikkunshito (500 and 1000 mg/kg,
p.o.), and atractylodin (1 mg/kg, p.o.) were administered daily to
5-week-old klotho-deficient mice until 100 days old. Body weight and food
intake were measured. The median survival was calculated using a
Kaplan-Meier plot. After death or euthanasia at the end of the survival
study, tissue samples (heart and brain) were collected for the histochemical
analysis.
Experiment 5: Rikkunshito (1000 mg/kg) was orally administered to
klotho-deficient mice for 4 days. On day 1, food intake in individual houses
was measured for 24 hours after administration. On day 4, blood and tissue
samples for SIRT1 analysis were collected 2 hours after administration.
Experiment 6: Rikkunshito (1000 mg/kg) and atractylodin (1 mg/kg,
p.o.) were orally administered to klotho-deficient mice for 11 days, and
hypothalamic samples were collected for cytokine assay and a microarray
analysis.
Animal experiments (SAMP8 mice)
Experiment 1: 23-week-old SAMP8 mice were given rikkunshito (0.5%,
1%)-containing chow or control chow in individual houses. Body weight
and food intake were measured. 24-hour locomotor activity was monitored,
and the open-field test and step-through passive-avoidance test were
performed at 16 and 17 weeks after treatment. Median survival was
calculated using Kaplan-Meier plots. After death in the survival study, heart
samples were collected for the histochemical analysis.
Experiment 2: Fasting blood and tissue samples (stomach and brain) for
3
immunohistochemical and gene expression studies were collected at 19
weeks after treatment with rikkunshito in SAMP8 mice.
Experiment 3: Rikkunshito (1000 mg/kg, p.o.) was daily administered
to 18-week-old SAMP8 mice for 4 days, and tissue samples were collected
2 hours after administration for SIRT1 analysis.
Animal experiments (ICR mice)
Experiment 1: In this experiment, 16- to 18-month-old ICR mice were
given rikkunshito (0.5, 1%)-containing chow or control chow in individual
houses. Because of a large difference in age, the aged group of ICR mice
was retrospectively assessed using a grading score with accelerating aging
(> 1.0) and body weight (> 50 g) at the start of the study. At 2 months after
treatment with rikkunshito, a passive avoidance test, the elevated plus-maze
test, and the open-field test were performed. Median survival was
calculated using a Kaplan-Meier plot. After death in the survival study,
heart samples were collected for the histochemical analysis.
Experiment 2: Fasting blood and tissue samples for SIRT1 analysis
were collected in 26-month-old ICR mice treated with rikkunshito (1%) for
8 months or 4-month-old ICR mice.
Experiment 3: Brain samples for immunohistochemical study were
collected 4 weeks after treatment with rikkunshito (1%) in 12-month-old
ICR mice.
Animal experiments (GHS-R knockout mice)
Twelve-week-old GHS-R knockout mice, heterozygous mice, and wild
type C57BL/6 mice were treated with rikkunshito (1%)-containing chow or
control chow. After 4 weeks, hypothalamic samples in these mice were
collected.
Analytical assays
The levels of acyl and desacyl ghrelin (Mitsubishi Chemical Medience,
Tokyo, Japan), GH (Millipore Corporation, Billerica, MA, USA), insulin
(Morinaga Institute of Biological Science Inc, Kanagawa, Japan), IGF-1
(Assaypro LLC, St. Charles, MO, USA), corticosterone (Assaypro LLC),
glucose (Wako Pure Chemical Industries, Osaka, Japan), insulin-like
growth factor-binding protein (IGFBP-3; R&D Systems, Minneapolis, MN,
4
USA), and leptin (BioVendor LLC, Candler, NC, USA) were measured
using an enzyme-linked immunosorbent assay (ELISA) or a colorimetric
assay. SIRT1 activity was measured using CycLex SIRT1/Sir2 Deacetylase
Fluorometric Assay kit (CycLex Co., Ltd, Ina, Nagano, Japan). Level of
mouse SIRT1 in tissue sample was measured using an ELISA (Cusabio,
Hubei, China). Total protein was measured using BCA Protein Assay
Reagent (Thermo Fisher Scientific K.K., Kanagawa, Japan).
Gene expression assay
Hypothalamic gene expression levels were measured using a
microarray analysis (Agilent Expression Array, Takara Bio Inc. Shiga,
Japan) and a real-time polymerase chain reaction system (ABI 7900HT,
Applied Biosystems, CA, USA). Total ribonucleic acid (RNA) was
extracted from the hypothalamic block using an RNeasy kit (Qiagen, CA,
USA), and DNA was removed from total RNA using RNase-Free DNase
(Qiagen). Reverse transcription reactions were performed using a TaqMan
reverse transcription kit (Applied Biosystems). All oligonucleotide primers
and fluorogenic probe sets for TaqMan real-time PCR were obtained from
Applied Biosystems: NPY (Mm00445771_m1), AgRP (Mm00475829_g1),
POMC (Mm00435874_m1), orexin A (Mm01964030_s1),
corticotropin-releasing factor (Mm01293920_s1), and prepro-ghrelin
(Mm00445450_m1), Interferon-γ (Mm01168134_m1), IL-1β
(Mm01336189_m1), IL-6 (Mm00446190_m1), and TNF-α
(Mm00443259_g1), Iba-1/Aif-1 (Mm00479862_g1), Peripheral-type
benzodiazepine receptor (Tspo) (Mm00437828_m1), and
Glyceraldehyde-3-phosphate dehydrogenase (GAPDH) (Mm99999915_g1)
was used as an endogenous control.
Food intake, body weight, and aging score
The rate of change in food intake, body weight, food efficiency
(calculated as body weight gain per food intake every five weeks), and
grading score with accelerating aging during the survival study were
obtained from least squares analysis.
Locomotor activity
The locomotor activity of mice in the home cage was measured during
5
a light–dark cycle with lights on from 7:00 to 19:00 with an infrared sensor
(NS-AS01; Neuroscience, Inc., Tokyo, Japan).
Step-through passive-avoidance test
The apparatus (Neuroscience, Inc.) for the step-through
passive-avoidance test consisted of two compartments, one illuminated
(100 mm x 120 mm x 145 mm) and the other dark (140 mm x 185 mm x
190 mm), which were separated by a guillotine door. A mouse was placed
in the illuminated compartment and stepped through the open guillotine
door into the dark compartment and was given a foot shock (0.3 mA) for
three seconds. Such trials were performed once a day, and the time spent in
the illuminated compartment was defined as the latency period.
Open-field test
The open-field test consisted of a square floor (50 cm × 50 cm)
enclosed by walls 25 cm high and divided into 25 areas of 10 cm intervals.
A mouse was placed in the center part of the open field, and the total
number of line crossings in areas and total number of entries into the
central part for 5 min were determined using the analysis software
LimeLight (Neuroscience, Inc.).
Elevated plus-maze test
The elevated plus-maze test consisted of two open arms and two
enclosed arms (20 cm × 5 cm each), arranged so that the arms of the same
type were opposite each other and elevated to a height of 50 cm. A mouse
was placed in the central square of the elevated plus-maze, and the number
of entries into the open arms and the time spent in the open arms in the
plus-maze in 5 min were measured using the analysis software LimeLight.
Histochemical study
After death or euthanasia at the end of the survival study, several tissue
samples including heart and gastrocnemius muscle were fixed in 10%
phosphate-buffered formalin, paraffin embedded, and stained with
hematoxylin and eosin for light microscopic examination. Scores were
obtained using a semi-quantitative pathological scoring system (None; 0,
Minimal; +1, Mild; +2, Moderate; +3).
6
For brain samples, serial sections of 10 μm thickness were mounted
onto MAS-coated glass slides, dewaxed with xylene and processed through
ethanols to water. The sections were subsequently incubated with anti-Iba-1
rabbit polyclonal antibody (Wako Pure Chemical Industries), and then
processed according to the peroxidase-labeled antibody method. The
products were visualized in a reaction with 3.3’-diamino-benzidine (DAB)
and H2O2. Stained sections were observed equipped under a light
microscope with a color-chilled 3CCD camera. The number of amoeboid
microglia positively stained with anti-Iba1 antibody was quantitatively
analyzed under a light microscope. The five 400 x 600 μm squares within
the identical brain area (2 mm square) beneath the corpus callosum of mice
were blindly captured, and the number of activated microglia with
amoeboid morphology were counted and analyzed statistically (Prism 6,
GraphPad Software Inc., La Jolla, CA).
Electrophysiologic study
The afferent activity of the gastric vagus nerve and the sympathetic
nerve activity of the brown adipose tissues in urethane anesthetized rats
were recorded via a pair of silver wire electrodes. A rate meter with a rest
time of 5 s was used to observe the time course of nerve activity. Ghrelin
(10 ng/rat) and rikkunshito (1000 mg/kg) or its constituents (400 mg/kg)
were administered through a catheter inserted into the inferior vena cava
and the duodenum, respectively. The mean numbers of impulses per 5 s
over 50 s before and after the injection were compared.
Cell culture and transfection
293-GHS-R cells and 293-Mock cells, which had been stably
transfected with the expression vector of C-terminal FLAG-tagged human
GHS-R1a or empty vector, respectively, were cultured in Dulbecco’s
modified Eagle’s medium (DMEM) (Wako Pure Chemical Industries)
supplemented with 10% fetal bovine serum (FBS) (Invitrogen, Carlsbad,
CA, USA) at 37ºC under 5% CO2 in air. Transfection was performed by
using PEI Max (Polysciences, Inc., Warrington, PA).
SIRT1 activity assay
293-GHS-R cells or 293-Mock cells were seeded in 24-well plates and
7
cultured for 24-hour. The media was changed to serum-free DMEM and
incubated overnight. After that, the cells were pretreated with rikkunshito
for 1 h, and then stimulated with ghrelin for an additional 6 h. SIRT1
activity in the cell lysates was measured using CycLex SIRT1/Sir2
Deacetylase Fluorometric Assay kit (CycLex Co., Ltd).
Ca2+
flux assay
A Ca2+
flux assay was performed using HEK293A cells that stably
expressed human GHS-R1a and mock cells. The cells were seeded in
96-well plates and treated with ghrelin (1-100 nmol/L), rikkunshito (100
g/mL), or vehicle. The intracellular Ca2+
was measured with the FLIPR
Calcium 5 Assay kit (R8185, Molecular Devices, LLC, Sunnyvale, CA,
USA) in accordance with the manufacturer’s instructions. The increase in
maximal response and the area under the curve (AUC) of Ca2+
were
evaluated.
cAMP assay
293-GHS-R cells were seeded in 24-well plates and cultured for
24-hour. The media was changed to serum-free DMEM and incubated
overnight. After that, the cells were pre-treated with 300μM IBMX for 30
min, followed by ghrelin for 30 min, and rikkunshito and SP-A for 90 min
in the presence of IBMX. The intracellular cAMP concentrations were
measured with a Direct cAMP ELISA kit (Enzo Life Sciences, Farmingdale,
NY, USA) in accordance with the manufacturer’s instructions.
Reporter gene assay
293-GHS-R or 293-Mock cells seeded in 24-well plate were transiently
transfected with pGL4.29 [luc2P/CRE/hygro] (Promega, Madison, WI)
(200 ng) and pGL4.75 [hRLuc-CMV] (Promega) (1 ng). Twenty-four hours
after transfection, the media was changed to serum-free DMEM and
incubated overnight. After that, the cells were pretreated with 100 μg/ml
rikkunshito for 1 h, and then stimulated with 100 nM ghrelin (Peptide
Institute Inc., Osaka, Japan) for an additional 6 h. Luciferase activities were
measured using Dual-Luciferase Reporter Assay System (Promega) and an
AB-2000 luminescencer-PSN (Atto, Tokyo, Japan).

8
Human umbilical vein endothelial cells (HUVECs)
HUVECs (Lonza, Walkersville, MD, USA) at 3-6 passages were used
in experiments. The cells were plated (3 x 10⁵ cells/well) into 6-multiwell
plates and cultured for 24 hours in EGM-2 medium (Lonza) at 37°C in a
humidified atmosphere of 95% air and 5% CO2. After 24 hours of
pre-incubation in serum-free culture medium, the cells were cultured for
another 24 hours in the presence of vehicle (0.1% dimethylsulfoxide) or the
test substances human acyl ghrelin, (D-Lys3)-GHRP-6, SP-A
(Sigma-Aldrich, St. Louis, MO, USA), rikkunshito, atractylodin,
5-Amino-4-imidazolecarboxamide-1-beta-D-ribofuranoside (AICAR;
Wako Pure Chemical Industries), and Compound C (Sigma-Aldrich).
After washing with phosphate-buffered saline, the cells were treated
with Lysis Buffer (AdipoGen International, Inc., San Diego, CA, USA) for
5 min. After processing, the obtained cell lysate was stored at -80°C until
measurement. Levels of SIRT1 protein (intracellular, human, AdipoGen
International, Inc.) and phosphorylated AMPK (AMPKALPHA PT172,
Invitrogen, Life Technologies, Grand Island, NY, USA) were measured
using an ELISA.
Impedance-based cell assay
The impedance-based cell assay was performed using the CellKeyTM
system (Molecular Devices, LLC). The CellKeyTM
assay system can detect
electrical impedance across monolayer cells embedded in electrical fields
in each well of 96-well dishes, and these changes indicate changes in
intracellular signaling. Ghrelin and rikkunshito were applied to 96-well
plates seeded with human GHS-R1a-expressing HEK293A cells, and
agonist-induced changes in cellular impedance were measured with the
system.
Caspase-3/7 activity assay
GHS-R1a-expressing HEK293A and mock cells were exposed to H2O2
(0.15 mmol/L) for 20 hours. Cell apoptosis was determined with a
caspase-3/7 activity assay using IncuCyte (Essen BioScience, Inc, Ann
Arbor, MI, USA). The data are expressed as the ratio of fluorescence
intensity in caspase-3/7-positive cells treated with 100 nmol/L ghrelin
and/or 100 g/mL rikkunshito.

9
Western blotting
293-GHS-R1a cells were pre-treated with 100 μg/mL rikkunshito for 60
min. After that, the cells were stimulated with 100 nmol/L ghrelin for an
additional 30 min in the presence of IBMX and rikkunshito. The cells were
washed with ice-cold Tris-buffered saline (TBS) and lysed with sodium
dodecyl sulfate (SDS)-sample buffer (25 mM Tris-HCl (pH 6.8), 4%
glycerol, 0.8 % SDS, 2% 2-mercaptoethanol, and 0.0002% bromophenol
blue). For western blotting, the lysates were fractionated by SDS–
polyacrylamide gel electrophoresis and transferred onto Immobilon-P
membranes (Millipore). The membranes were blocked with 5% nonfat dry
milk in TBS containing 0.05% Tween 20 (TBS-T) and incubated with the
following antibodies: anti-CREB, and anti-phospho CREB (Cell Signaling,
Danvers, MA, USA); anti-SIRT1 (Sigma); anti-actin (Millipore). After
washing with TBS-T, the membranes were incubated with horseradish
peroxidase-conjugated antibody against mouse or rabbit IgG (Jackson
Immuno Research Laboratories, West Grove, PA, USA). The blots were
detected by Immobilon Western HRP Substrate detection reagents
(Millipore) using a LAS 4010 system (GE Healthcare Life Sciences,
Buckinghamshire, UK).
Statistical analysis
Sample size was based on preliminary experiment. Animals were
randomly allocated to experimental groups to be no difference in the body
weight. Animal studies excluded aging score were not blinded. Values for
individual groups are shown as the mean ± standard error (SE). To assess
differences among groups, a Student t-test, a multi-group Dunnett test, a
Bonferroni test, or Chai-square test for independence was performed.
Mortality data were compared with log-rank tests and
Gehan-Breslow-Wilcoxon tests. Values of P < 0.05 were considered
statistically significant.
10
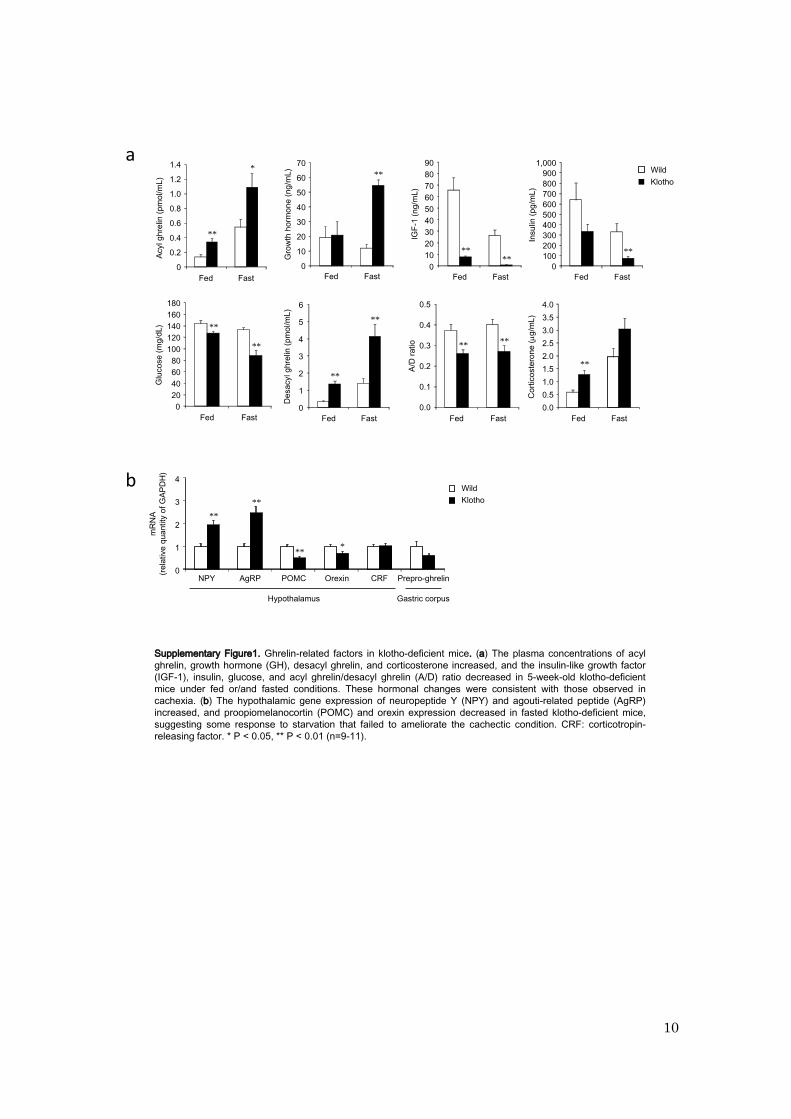
Supplementary Figure1. Ghrelin-related factors in klotho-deficient mice. (a) The plasma concentrations of acyl
ghrelin, growth hormone (GH), desacyl ghrelin, and corticosterone increased, and the insulin-like growth factor
(IGF-1), insulin, glucose, and acyl ghrelin/desacyl ghrelin (A/D) ratio decreased in 5-week-old klotho-deficient
mice under fed or/and fasted conditions. These hormonal changes were consistent with those observed in
cachexia. (b) The hypothalamic gene expression of neuropeptide Y (NPY) and agouti-related peptide (AgRP)
increased, and proopiomelanocortin (POMC) and orexin expression decreased in fasted klotho-deficient mice,
suggesting some response to starvation that failed to ameliorate the cachectic condition. CRF: corticotropin-
releasing factor. * P < 0.05, ** P < 0.01 (n=9-11).
0
10
20
30
40
50
60
70
Fed Fast
**
Gro
wth
horm
on
e (
ng/m
L)
0
1
2
3
4
5
6
Fed Fast
**
**
De
sa
cylg
hre
lin (
pm
ol/m
L)
0.0
0.1
0.2
0.3
0.4
0.5
Fed Fast
** **
A/D
ra
tio
0.0
0.5
1.0
1.5
2.0
2.5
3.0
3.5
4.0
Fed Fast
Cort
ico
ste
ron
e (g/m
L)
**
0
20
40
60
80
100
120
140
160
180
Fed Fast
**
**
Glu
co
se (
mg/d
L)
0
100
200
300
400
500
600
700
800
900
1,000
Fed Fast
Insu
lin (
pg
/mL)
**
0
10
20
30
40
50
60
70
80
90
Fed Fast
IGF
-1 (
ng/m
L)
****
Wild
Klotho
a
0
0.2
0.4
0.6
0.8
1.0
1.2
1.4
Fed Fast
Acyl ghre
lin (
pm
ol/m
L)
**
*
0
1
2
3
4
NPY AgRP POMC Orexin CRF Prepro-ghrelin
mR
NA
(re
lative
qua
ntity
of G
AP
DH
)
**
**
***
Hypothalamus Gastric corpus
Wild
Klotho
b

11
- 3- 2- 101 234567
1 2 3 4
Time after administration (day)
Klotho
Bo
dy w
eig
ht
gain
(g)
0 1 2 3 4 5 6 7 8 9
10
1 2 3 4
Time after administration (day)
Wild
Bo
dy w
eig
ht
gain
(g)
**
***
**
**
aG
row
th h
orm
on
e (
ng/m
L)
0
20
40
60
80
100
120
0 10 30 60
Time after ghrelin administration (min)
**
**Wild
Klotho
IGF
-1 (
ng/m
L)
0
20
40
60
80
100
120
140
0 10 30 60
Time after ghrelin administration (min)
Bo
dy w
eig
ht
ch
an
ge
(g
/week)
- 0.7
- 0.6
- 0.5
- 0.4
- 0.3
- 0.2
- 0.1
0.0
Saline
(i.p.)
Ghrelin
(30 g/kg, i.p.)
Ghrelin
(100 g/kg, i.p.)
Bo
dy w
eig
ht
ch
an
ge
(g
/wee
k)
-0.7
-0.6
-0.5
-0.4
-0.3
-0.2
-0.1
0.0
Saline (D-Lys3)-GHRP-6
(10 mol/kg, i.p.)
Supplementary Figure 2. Ghrelin resistance in klotho-deficient mice. (a) The plasma growth hormone (GH)
concentration increased immediately after ghrelin administration (100 g/kg, i.p.) in wild-type and klotho-deficient
mice. No significant effect of ghrelin on the levels of insulin-like growth factor (IGF-1) was observed in either
mouse model. ** P < 0.01 (n=6-8). (b) Ghrelin-induced increases in food intake and body weight were not
observed in klotho-deficient mice compared with wild-type mice. * P < 0.05, ** P < 0.01 (n=8-10). (c) No
significant effect of ghrelin or ghrelin receptor antagonist (D-Lys3)-GHRP-6 was observed on body weight
change in klotho-deficient mice during the survival study.
Saline (i.p. twice a day)
Ghrelin (30 g/kg, i.p. twice a day)
Ghrelin (100 g/kg, i.p. twice a day)
Wild Klotho
17:30 - 18:309:30 - 10:30
1-h
ou
r fo
od
in
take
(g
) **
* *
*
0.0
0.1
0.2
0.3
0.4
Wild Klotho0
1
2
3
4
Wild Klotho
*
24-h
our
food
in
take
(g
) 5 b
c

12
Supplementary Figure 3. Effect of rikkunshito (RKT) and atractylodin on aging in klotho-deficient mice. (a and b) No
significant effect of RKT (500 or 1000 mg/kg, p.o., n=18-20) or atractylodin (1 mg/kg, p.o., n=8-10) on body weight change
or aging score in klotho-deficient mice during the survival study was observed. ** P < 0.01. (c) Focal atrophy of myocardial
fiber of Klotho-deficient mice at the end of the survival study was not observed. (d) The plasma desacyl ghrelin and
corticosterone concentrations increased, and insulin-like growth factor (IGF-1), glucose, and acyl ghrelin/desacyl ghrelin
(A/D) ratio decreased in klotho-deficient mice compared with wild-type. The fed condition is used here because fasting is a
severe stress leading to death in this model. There was no significant effect of rikkunshito (RKT; 1000 mg/kg, p.o. for 4
days) treatment on these parameters, except for decreased insulin in the fed condition. * P < 0.05, ** P < 0.01 (n=8-10).
0
10
20
30
40
50
Wild Klotho Klotho
+ RKT
Gro
wth
ho
rmo
ne (
ng/m
L)
0
100
200
300
400
500
600
700
Wild Klotho Klotho
+ RKT
Insu
lin (
pg
/mL
)
0
20
40
60
80
100
120
Wild Klotho Klotho
+ RKT
IGF
-1 (
ng/m
L)
0
50
100
150
200
250
Wild Klotho Klotho
+ RKT
Glu
co
se
(m
g/d
L)
** ***
0
1
2
3
4
5
6
Wild Klotho Klotho
+ RKT
De
sa
cylg
hre
lin (
pm
ol/m
L) **
0.0
0.1
0.2
0.3
0.4
0.5
Wild Klotho Klotho
+ RKT
A/D
ra
tio
*
0.0
0.5
1.0
1.5
2.0
2.5
3.0
Wild Klotho Klotho
+ RKT
Co
rtic
oste
ron
e (g
/mL)
**
d
2.5 **
Bo
dy w
eig
ht
ch
an
ge
(g
/wee
k)
0.0
a
Ag
ing s
co
re (
co
un
t/w
ee
k)
0.0
0.5
1.0
1.5
2.0
Wild/
Distilled
water
(p.o.)
Klotho/
Distilled
water
(p.o.)
Klotho/
RKT
(500 mg/kg,
p.o.)
Klotho/
RKT
(1000 mg/kg,
p.o.)
- 0.7
- 0.6
- 0.5
- 0.4
- 0.3
- 0.2
- 0.1
Distilled
water
(p.o.)
RKT
(500 mg/kg,
p.o.)
RKT
(1000 mg/kg,
p.o.)
Ag
ing s
co
re (
co
un
t/w
ee
k)
0.0
0.5
1.0
1.5
2.0
2.5
Wild/
Vehicle
(p.o.)
Klotho/
Vehicle
(p.o.)
Klotho/
Atractylodin
(1 mg/kg,
p.o.)
**
Bo
dy w
eig
ht
ch
an
ge
(g
/wee
k)
- 0.7
- 0.6
- 0.5
- 0.4
- 0.3
- 0.2
- 0.1
0.0
Vehicle
(p.o.)
Atractylodin
(1 mg/kg,p.o.)
b cWild Klotho
Klotho + RKT
Bar = 100μm
Heart
13
b
x 3x 2x 1.5x 1/1.5x 1/2x 1/3
Ratio
Gene
symbol
Wild
Vehicle
Klotho
Vehicle
Klotho
RKT
Klotho
ATRBiological function
Gcm1 1.0 0.4 1.2 1.0 DNA demethylation
Peg3 1.0 0.6 1.0 1.4 Inhibition of apoptosis
Ttr 1.0 2.3 0.8 1.4 Induced amyloidosis
Clec4a2 1.0 1.6 0.5 0.4Negative signals into
dendritic cells expansion
srGAP2 1.0 1.4 0.5 0.4Negatively regulates
neuronal migration
Synergin 1.0 1.2 0.5 0.4 Induced apoptosis
Lst1 1.0 1.1 0.4 0.4 Inflammation
Trio 1.0 1.1 0.3 0.2 Neuronal cell death
Gene
symbolVehic le RKT ATR
Gene
symbolVehic le RKT ATR
Adcyap1 Nmb
Adcyap1r1 Npb
Agrp Npy
Apln Npy1r
Avp Npy2r
Avpi1 Nts
Calca Nucb1
Cartpt Nucb2
Cbln1 Nxph3
Cbln2 Oxt
Cck Oxtr
Chga Pdyn
Chgb Penk
Cort Pmch
Creb1 Pnoc
Creb3 Pomc
Crh Ramp1
Crhr1 Ramp2
Crhr2 Rln1
Dbi Scg2
Gal Scg3
Grp Scg5
Hcrt Sst
Hcrtr1 Tac1
Htr2c Tac2
Ifngr1 Trh
Igf1 Trhr
Igf2r Vgf
Igfbp2
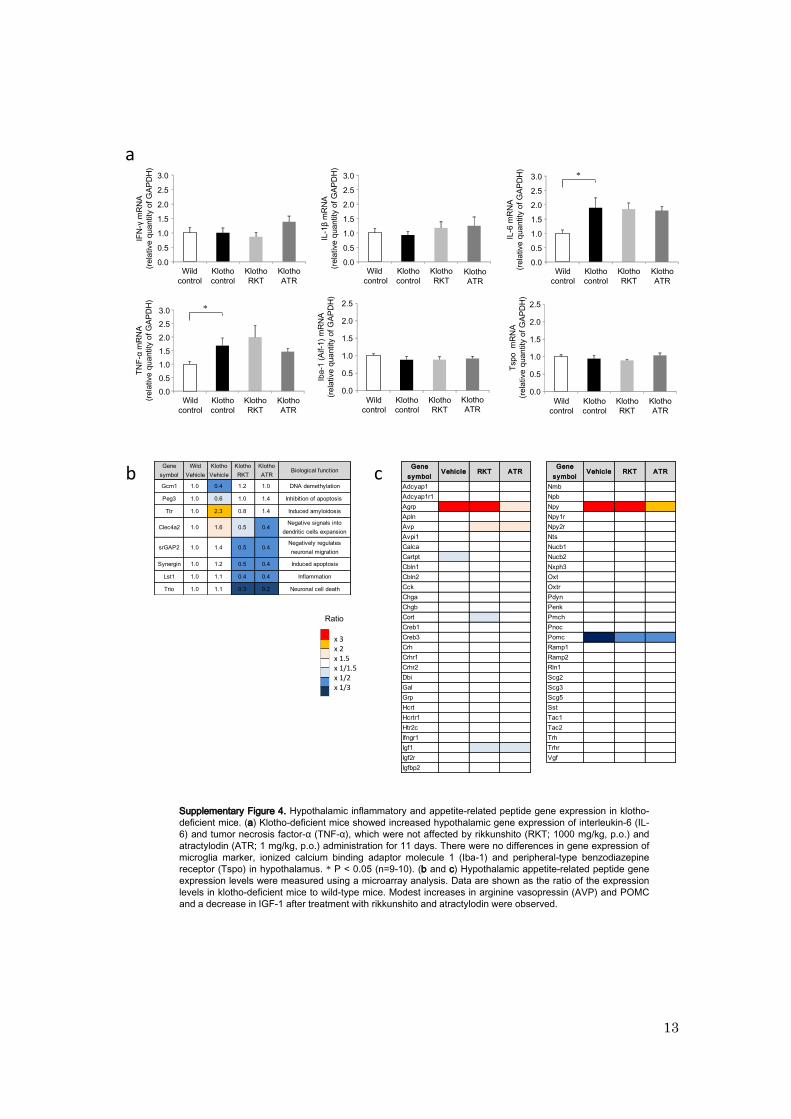
Supplementary Figure 4. Hypothalamic inflammatory and appetite-related peptide gene expression in klotho-
deficient mice. (a) Klotho-deficient mice showed increased hypothalamic gene expression of interleukin-6 (IL-
6) and tumor necrosis factor-α (TNF-α), which were not affected by rikkunshito (RKT; 1000 mg/kg, p.o.) and
atractylodin (ATR; 1 mg/kg, p.o.) administration for 11 days. There were no differences in gene expression of
microglia marker, ionized calcium binding adaptor molecule 1 (Iba-1) and peripheral-type benzodiazepine
receptor (Tspo) in hypothalamus. * P < 0.05 (n=9-10). (b and c) Hypothalamic appetite-related peptide gene
expression levels were measured using a microarray analysis. Data are shown as the ratio of the expression
levels in klotho-deficient mice to wild-type mice. Modest increases in arginine vasopressin (AVP) and POMC
and a decrease in IGF-1 after treatment with rikkunshito and atractylodin were observed.
0.0
0.5
1.0
1.5
2.0
2.5
3.0
Wild
control
Klotho
control
Klotho
RKT
Klotho
ATR
0.0
0.5
1.0
1.5
2.0
2.5
3.0
Wild
control
Klotho
control
Klotho
RKT
IFN
-γm
RN
A
(rela
tive q
uantity
of G
AP
DH
)
IL-1
β m
RN
A
(rela
tive q
uantity
of G
AP
DH
)
0.0
0.5
1.0
1.5
2.0
2.5
3.0
Wild
control
Klotho
control
Klotho
RKT
IL-6
mR
NA
(rela
tive q
uantity
of G
AP
DH
)
0.0
0.5
1.0
1.5
2.0
2.5
Wild
control
Klotho
control
Klotho
RKT
0.0
0.5
1.0
1.5
2.0
2.5
Wild
control
Klotho
control
Klotho
RKT
Iba-1
(A
if-1
) m
RN
A
(rela
tive q
uantity
of G
AP
DH
)
Tspo
mR
NA
(rela
tive q
uantity
of
GA
PD
H)
*
TN
F-α
mR
NA
(rela
tive q
uantity
of G
AP
DH
)
0.0
0.5
1.0
1.5
2.0
2.5
3.0
Wild
control
Klotho
control
Klotho
RKT
*
Klotho
ATR
Klotho
ATR
Klotho
ATRKlotho
ATR
Klotho
ATR
a
c

14
Supplementary Figure 5. Effect of rikkunshito on aging in SAMP8 mice. (a) No change in the aging score was observed. (b)
Twenty-three-week-old SAMP8 (P8) and SAMR1 (R1) mice were given rikkunshito (RKT)-containing chow or control chow. The
rates of change in body weight and food efficiency, which were calculated as body weight gain per food intake every five weeks,
decreased in SAMP8 mice. These were not affected by RKT treatment. (c and d) There were no differences in anxiety-like
behavior in an open-field test (c) or memory disturbance in a step-through passive-avoidance test (d), although the difference
between 39- or 40-week-old SAMP8 and SAMR1 mice failed to reach statistical significance. ** P < 0.01 (n=17-20).
0
50
100
150
200
250
300
0 1 2 3 4
Ste
p-t
hro
ugh late
ncy tim
e (
sec)
Trial (day)
R1P8 P8 + RKT (0.5%)P8 + RKT (1%)
Agin
g s
core
(count/m
onth
)
0.0
0.2
0.4
0.6
0.8
1.0
1.2
1.4
R1 P8 P8
+ RKT
(0.5%)
P8
+ RKT
(1%)
d
a
0
2
4
6
8C
ente
r cro
ssin
g (
count/5
min
)
R1 P8 P8
+ RKT
(0.5%)
P8
+ RKT
(1%)
0
50
100
150
200
Tota
l cro
ssin
g (
count/5
min
)
R1 P8 P8
+ RKT
(0.5%)
P8
+ RKT
(1%)
c 10250
R1 P8 P8
+ RKT
(0.5%)
P8
+ RKT
(1%)
**- 0.20
- 0.15
- 0.10
- 0.05
0.00
Food e
ffic
iency c
hange
(g/g
/5 w
eeks)
R1 P8 P8
+ RKT
(0.5%)
P8
+ RKT
(1%)
**
Body w
eig
ht
change
(g/5
weeks)
- 3.5
-3.0
-2.5
- 2.0
- 1.5
- 1.0
- 0.5
0.0 b
15
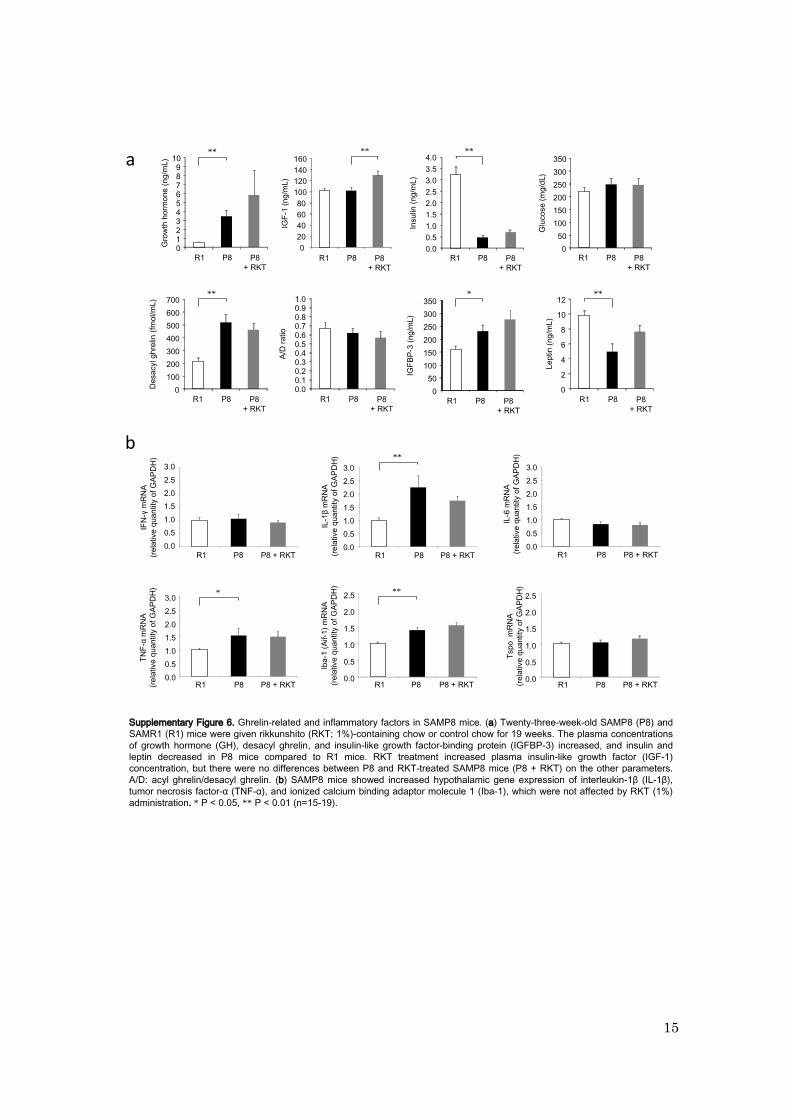
Supplementary Figure 6. Ghrelin-related and inflammatory factors in SAMP8 mice. (a) Twenty-three-week-old SAMP8 (P8) and
SAMR1 (R1) mice were given rikkunshito (RKT; 1%)-containing chow or control chow for 19 weeks. The plasma concentrations
of growth hormone (GH), desacyl ghrelin, and insulin-like growth factor-binding protein (IGFBP-3) increased, and insulin and
leptin decreased in P8 mice compared to R1 mice. RKT treatment increased plasma insulin-like growth factor (IGF-1)
concentration, but there were no differences between P8 and RKT-treated SAMP8 mice (P8 + RKT) on the other parameters.
A/D: acyl ghrelin/desacyl ghrelin. (b) SAMP8 mice showed increased hypothalamic gene expression of interleukin-1β (IL-1β),
tumor necrosis factor-α (TNF-α), and ionized calcium binding adaptor molecule 1 (Iba-1), which were not affected by RKT (1%)
administration. * P < 0.05, ** P < 0.01 (n=15-19).
a
b
0.0
0.5
1.0
1.5
2.0
2.5
3.0
R1 P8 P8 + RKT0.0
0.5
1.0
1.5
2.0
2.5
3.0
R1 P8 P8 + RKT
0.0
0.5
1.0
1.5
2.0
2.5
3.0
R1 P8 P8 + RKT
0.0
0.5
1.0
1.5
2.0
2.5
3.0
R1 P8 P8 + RKT
IL-6
mR
NA
(rela
tive q
uantity
of G
AP
DH
)
IFN
-γm
RN
A
(rela
tive q
uantity
of G
AP
DH
)
TN
F-α
mR
NA
(rela
tive q
uantity
of G
AP
DH
)
IL-1
β m
RN
A
(rela
tive q
uantity
of G
AP
DH
)
0.0
0.5
1.0
1.5
2.0
2.5
R1 P8 P8 + RKT
Iba-1
(A
if-1
) m
RN
A
(rela
tive q
uantity
of G
AP
DH
)
Tspo
mR
NA
(rela
tive q
uantity
of G
AP
DH
)
0.0
0.5
1.0
1.5
2.0
2.5
R1 P8 P8 + RKT
**
* **
P8R1 P8
+ RKT
0
100
200
300
400
500
600
700
Desacyl ghre
lin (
fmol/m
L)
**
P8R1 P8
+ RKT
0.00.10.20.30.40.50.60.70.80.91.0
A/D
ratio
P8R1 P8
+ RKTIG
FB
P-3
(ng/m
L)
0
50
100
150
200
250
300
350*
0
2
4
6
8
10
12
Leptin (
ng/m
L)
P8R1 P8
+ RKT
**
0
50
100
150
200
250
300
350
Glu
cose (
mg/d
L)
0123456789
10G
row
th h
orm
one (
ng/m
L)
P8R1 P8
+ RKT
**
IGF
-1 (
ng/m
L)
0
20
40
60
80
100
120
140
160**
Insulin
(ng/m
L)
0.0
0.5
1.0
1.5
2.0
2.5
3.0
3.5
4.0**
P8R1 P8
+ RKT
P8R1 P8
+ RKT
P8R1 P8
+ RKT

16
Supplementary Figure 7. Histopathological changes of gastric mucosa in SAMP8 mice. (a-c) Twenty-three-
week-old SAMP8 (P8) and SAMR1 (R1) mice were given rikkunshito (RKT; 1%)-containing chow or control
chow for 19 weeks. Treatment with RKT (1%) inhibited gastric mucosal atrophy (a) and the decrease in the
numbers of ghrelin-positive cells (b) in SAMP8 mice (n=15-19). Activated macrophages (Iba-1 positive cells)
in fundus gland of SAMP8 mice (c) were decreased by RKT (1%) administration (n=13-15). * P < 0.05, ** P
< 0.01.
aGastric pit
Mucosa
R1 P8 P8 + RKT
Bar = 100 μm
0
10
20
30
40
50
60
70
P8R1
Gastr
ic p
it/m
ucosa r
atio (
%)
P8
+ RKT
** **
R1 P8 P8 + RKT
c
b
R1 P8 P8 + RKT
Bar = 100 μm
0
20
40
60
80
100
P8R1 P8
+ RKT
Ghre
lin-p
ositiv
e c
ell
(cell)
** **

17
Supplementary Figure 8. Effect of rikkunshito on aging in ICR mice. ICR mice were given rikkunshito (RKT;
0.5% or 1%)-containing chow or control chow. (a) No significant effect of RKT on the aging score in ICR mice
was observed. (b and c) Behavioral analyses to evaluate anxiety in ICR mice. Two-month treatment with RKT
displayed no anxiolytic action, which was estimated with the open-field test (b) and the elevated plus-maze test
(c) (n=18-23).
Elevated plus-maze test
To
tal cro
ssin
g (
co
un
t/5
min
)
0
10
20
30
40
50
60
70
80
90
100
Control RKT (0.5%) RKT (1%)
Op
en
arm
s c
rossin
g (
co
un
t/5
min
)
0
5
10
15
20
25
30
Control RKT (0.5%) RKT (1%)
Tim
e in
ope
n a
rms (
se
c/5
min
)
0
20
40
60
80
100
120
140
Control RKT (0.5%) RKT (1%)
c
Open-field test
To
tal cro
ssin
g (
co
unt/5
min
)
0
50
100
150
200
250
300
350
Control RKT (0.5%) RKT (1%)
Cen
ter
cro
ssin
g (
co
un
t/5 m
in)
0
2
4
6
8
10
12
Control RKT (0.5%) RKT (1%)
b
0.0
0.2
0.4
0.6
0.8
1.0
1.2
1.4
Control RKT (0.5%) RKT (1%)
Ag
ing s
core
(co
un
t/m
on
th)
a

18
Supplementary Figure 9. Potentiation of the ghrelin receptor signal by rikkunshito (RKT) in GHS-R1a-expressing
cells. (a) An impedance-based cell assay was conducted using the CellKeyTM assay system. HEK293A cells
stably expressing human GHS-1a receptor were pretreated with RKT (5 and 50 g/mL) or vehicle. Then, ghrelin
(1 nmol/L) was applied to cells for 600 s, and electrical impedance, which is induced by a change of intracellular
signaling, was detected. (b) GHS-R1a-expressing HEK293A (293-GHS-R) cells and mock (293-Mock) cells were
exposed to H2O2 (0.15 mmol/L) and treated with 100 nmol/L ghrelin and/or 100 g/mL RKT for 20 hours. Cell
apoptosis was determined with a caspase-3/7 activity assay. Rikkunshito potentiated the cellular response to
ghrelin (a) and inhibited oxidative cell death (b). ** P < 0.01 (n=3).
1000 1500 2000 2500
-20
-10
0
10
20
30
40
Time after treatment (sec)
Vehicle
RKT (5 μg/mL)
RKT (50 μg/mL)
Ghrelin (1 nmol/L)
No
rmaliz
ed d
Zie
c(o
hm
s)
Buffer
1000 1500 2000 2500
-20
-10
0
10
20
30
40
No
rmaliz
ed d
Zie
c(o
hm
s)
Time after treatment (sec)
Vehicle
RKT (5 μg/mL)
RKT (50 μg/mL)
**
**
**
% o
f H
2O
2in
du
ce
d
ca
sp
ase
-3/7
positiv
e c
ells
(%
)
0
20
40
60
80
100
H2O2 Ghrelin
+
H2O2
RKT
+
H2O2
Ghrelin
+
RKT
+
H2O2
120
% o
f H
2O
2in
du
ce
d
ca
sp
ase
-3/7
positiv
e c
ells
(%
)
0
20
40
60
80
100
120
H2O2 Ghrelin
+
H2O2
RKT
+
H2O2
Ghrelin
+
RKT
+
H2O2
**
**
**
**
a
b293-GHS-R cells 293-Mock cells

19
Supplementary Figure 10. Autonomic nervous activity. (a) The electrophysiologic study demonstrated that the
afferent activities of the gastric vagus nerve were decreased with administration of 400 mg/kg rikkunshito’s
constituents (atractylodes lancea rhizome, poria sclerotium, and citrus unshiu peel) in urethane anesthetized rats.
(b) Ghrelin (10 ng) and rikkunshito (1000 mg/kg) decreased the sympathetic nerve activity to brown adipose
tissues in urethane anesthetized rats.
a
Vertical bars: 100 impulses/5 s, Horizontal bars: 30 min
Atractylodes Lancea Rhizome
Ginseng
Poria Sclerotium
Citrus Unshiu Peel
Pinellia Tuber
Jujube
Glycyrrhiza
Ginger
Gastric vagal afferent activity
Vertical bars: 100 impulses/5 s, Horizontal bars: 30 min
Rikkunshito 1000 mg/kg, i.d.Ghrelin 10 ng, i.v.
b Sympathetic nerve activity to brown adipose tissues
20
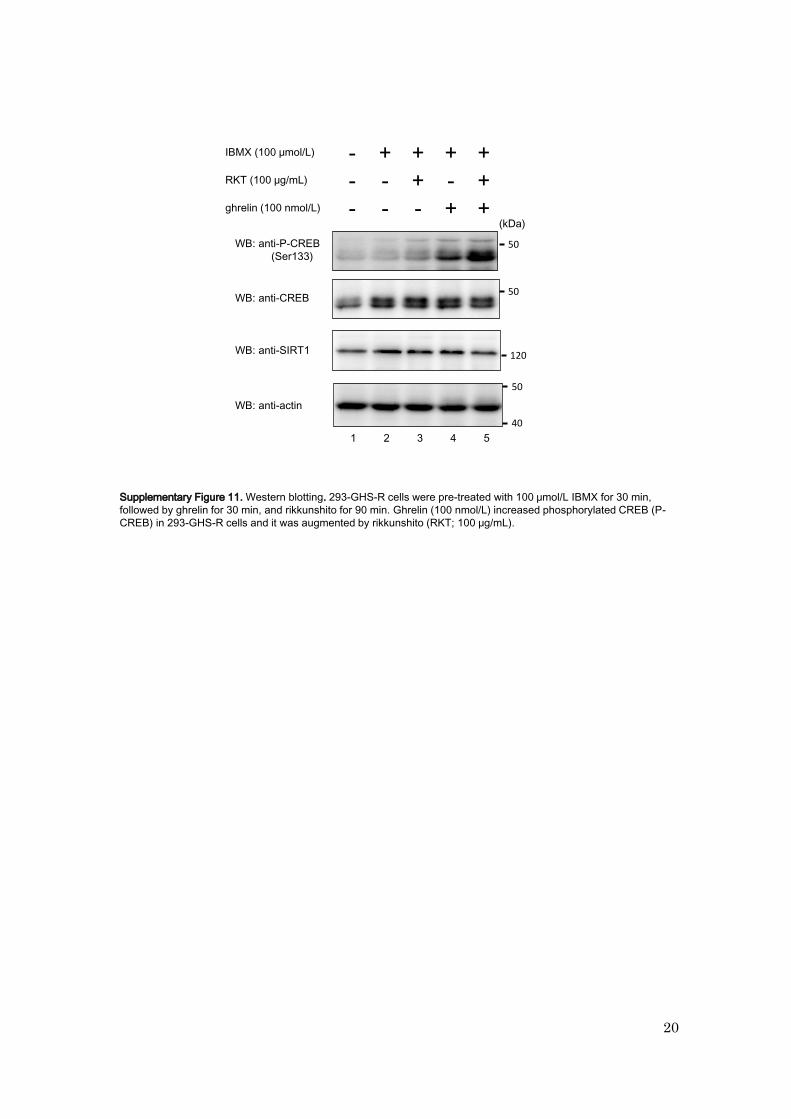
IBMX (100 μmol/L) - + + + +RKT (100 μg/mL) - - + - +ghrelin (100 nmol/L) - - - + +
1 2 3 4 5
50
50
50
40
120
(kDa)
WB: anti-P-CREB
(Ser133)
WB: anti-CREB
WB: anti-actin
WB: anti-SIRT1
Supplementary Figure 11. Western blotting. 293-GHS-R cells were pre-treated with 100 μmol/L IBMX for 30 min,
followed by ghrelin for 30 min, and rikkunshito for 90 min. Ghrelin (100 nmol/L) increased phosphorylated CREB (P-
CREB) in 293-GHS-R cells and it was augmented by rikkunshito (RKT; 100 μg/mL).
21
b
Atractylodin (μmol/L)
0
2
4
0 0.1 1
Ghrelin (nmol/L)
SIR
T1
(ng/m
g p
rote
in)
0
2
4
SIR
T1
(ng/m
g p
rote
in)
0 1 10
*
0
2
4
6
SIR
T1
(ng/m
g p
rote
in)
RKT (μg/mL)
0 10 100
**
*
*
0
4
8
12
16
p-A
MP
K(U
/mg p
rote
in)
(D-Lys3)-GHRP-6
(1 μmol/L)
RKT
(100 μg/mL)+ +--
+ +--
** **
c
d e
0
2
4
0 0.3 1 3 10
SIR
T1(n
g/m
g p
rote
in)
0
2
4
6
0 20 50 100 200
SIR
T1 (
ng/m
gpro
tein
)
AICAR (μmol/L) Compound C (μmol/L)
****
**
(D-Lys3)-GHRP-6
(10 μmol/L)
RKT
(100 μg/mL) + +--
+ +--
- + - +
- - + +
Atractylodin
(10 μmol/L)
SP-A
(10 μmol/L)
0
1
2
3
SIR
T1
(ng/m
g p
rote
in)
**
0
2
4
6
SIR
T1 (
ng/m
g p
rote
in)
****
- + - +
- - + +
RKT
(100 μg/mL)
SP-A
(10 μmol/L)
SIR
T1 (
ng/m
g p
rote
in)
0
2
4
6 **
* * *
0
5
10
15
20
25
30
35
SIR
T1 a
ctivity
(RF
U/m
in/μ
gpro
tein
)
(D-Lys3)-GHRP-6
(10 μmol/L)
RKT
(100 μg/mL) + +--
+ +--
***a
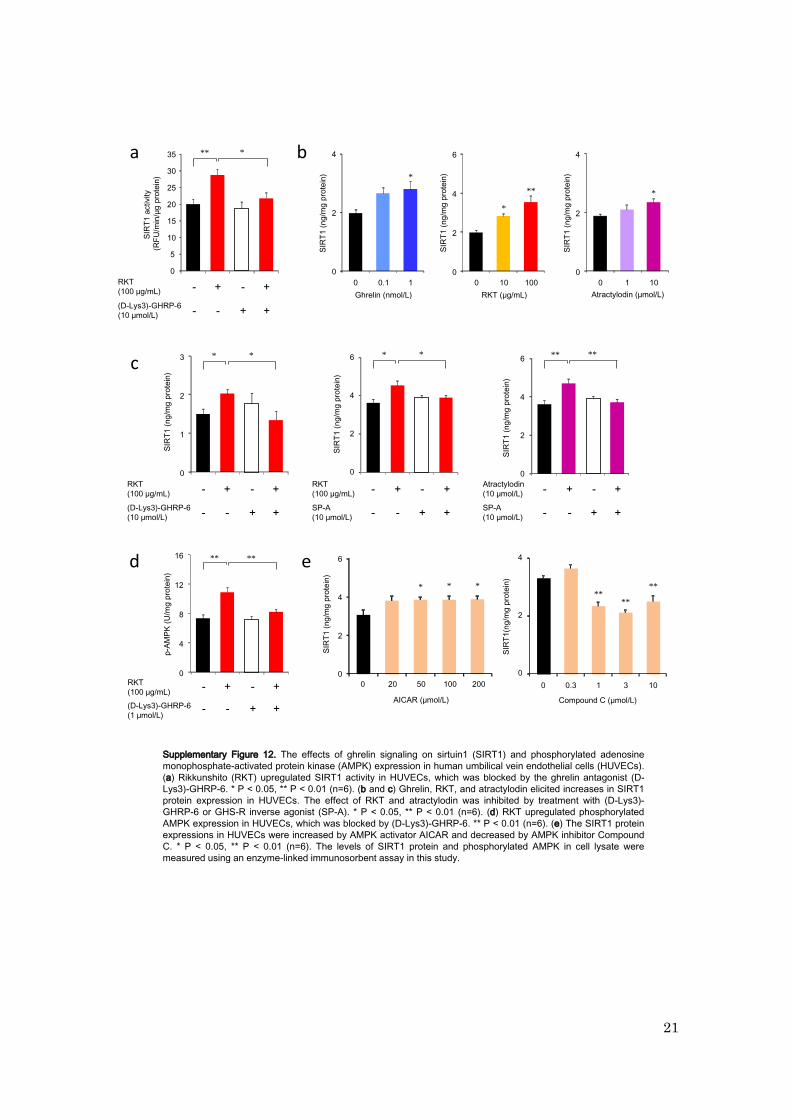
Supplementary Figure 12. The effects of ghrelin signaling on sirtuin1 (SIRT1) and phosphorylated adenosine
monophosphate-activated protein kinase (AMPK) expression in human umbilical vein endothelial cells (HUVECs).
(a) Rikkunshito (RKT) upregulated SIRT1 activity in HUVECs, which was blocked by the ghrelin antagonist (D-
Lys3)-GHRP-6. * P < 0.05, ** P < 0.01 (n=6). (b and c) Ghrelin, RKT, and atractylodin elicited increases in SIRT1
protein expression in HUVECs. The effect of RKT and atractylodin was inhibited by treatment with (D-Lys3)-
GHRP-6 or GHS-R inverse agonist (SP-A). * P < 0.05, ** P < 0.01 (n=6). (d) RKT upregulated phosphorylated
AMPK expression in HUVECs, which was blocked by (D-Lys3)-GHRP-6. ** P < 0.01 (n=6). (e) The SIRT1 protein
expressions in HUVECs were increased by AMPK activator AICAR and decreased by AMPK inhibitor Compound
C. * P < 0.05, ** P < 0.01 (n=6). The levels of SIRT1 protein and phosphorylated AMPK in cell lysate were
measured using an enzyme-linked immunosorbent assay in this study.
22
Inflammation
Apoptosis
Extension of health- and life-span
Klotho-deficient mice
Improved cardiac calcification
SAMP8 mice
Improved cardiac calcification and pericarditis
Improved atrophy of muscle (sarcopenia) and myocardial fiber
Improved locomotor activity and anorexia
Decreased leukemia incidence
Aged ICR mice
Improved learning and memory
Improved atrophy of myocardial fiber
Microglial
activation
cAMP
SIRT1
p-AMPKp-CREB
GHS-R1a
CRE reporter
activity
GhrelinRikkunshito
AtractylodinGhrelin
resistance
PKA
Caloric restrictionAging
SIRT1
acitivity
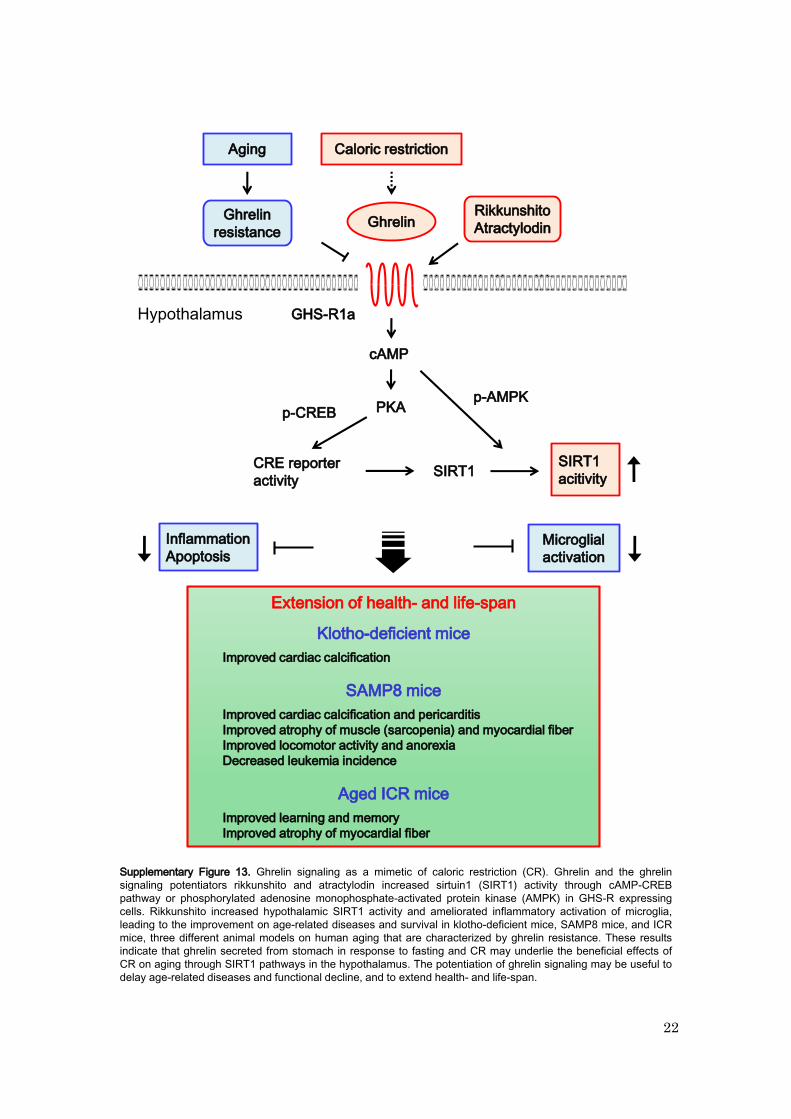
Supplementary Figure 13. Ghrelin signaling as a mimetic of caloric restriction (CR). Ghrelin and the ghrelin
signaling potentiators rikkunshito and atractylodin increased sirtuin1 (SIRT1) activity through cAMP-CREB
pathway or phosphorylated adenosine monophosphate-activated protein kinase (AMPK) in GHS-R expressing
cells. Rikkunshito increased hypothalamic SIRT1 activity and ameliorated inflammatory activation of microglia,
leading to the improvement on age-related diseases and survival in klotho-deficient mice, SAMP8 mice, and ICR
mice, three different animal models on human aging that are characterized by ghrelin resistance. These results
indicate that ghrelin secreted from stomach in response to fasting and CR may underlie the beneficial effects of
CR on aging through SIRT1 pathways in the hypothalamus. The potentiation of ghrelin signaling may be useful to
delay age-related diseases and functional decline, and to extend health- and life-span.
Hypothalamus
23
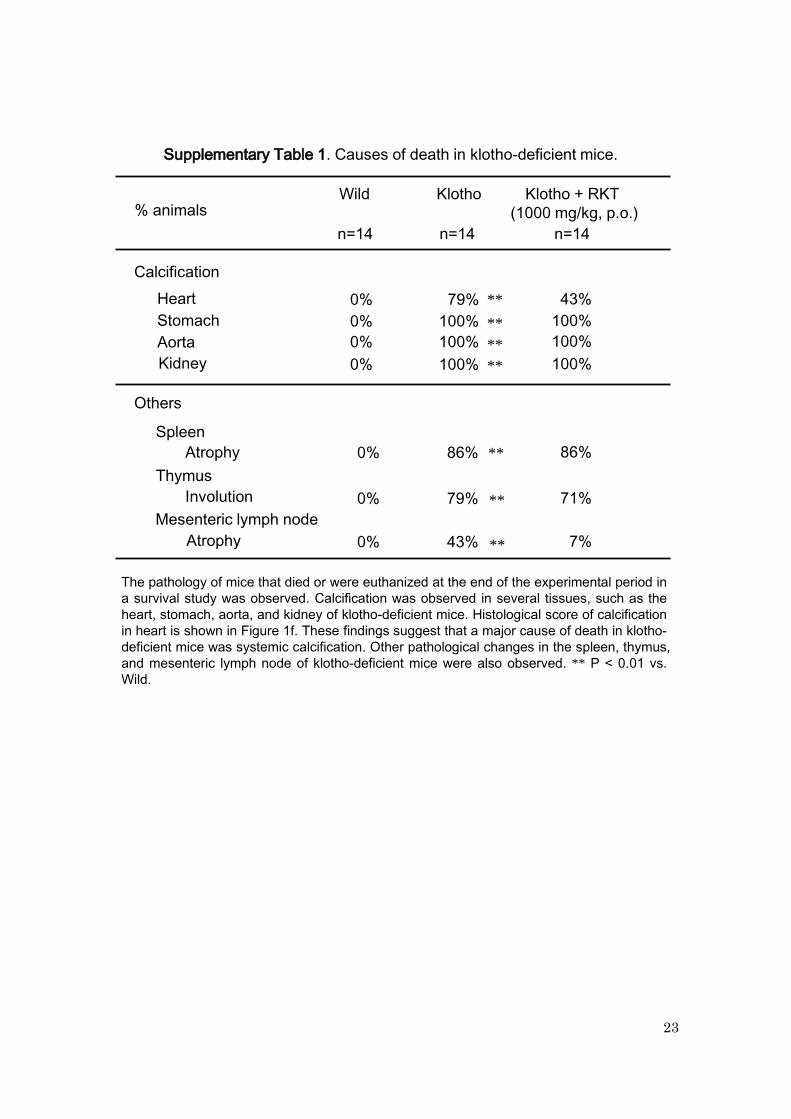
Supplementary Table 1. Causes of death in klotho-deficient mice.
Wild Klotho + RKT
(1000 mg/kg, p.o.)
Klotho
The pathology of mice that died or were euthanized at the end of the experimental period in
a survival study was observed. Calcification was observed in several tissues, such as the
heart, stomach, aorta, and kidney of klotho-deficient mice. Histological score of calcification
in heart is shown in Figure 1f. These findings suggest that a major cause of death in klotho-
deficient mice was systemic calcification. Other pathological changes in the spleen, thymus,
and mesenteric lymph node of klotho-deficient mice were also observed. ** P < 0.01 vs.
Wild.
0%Heart
Stomach
Spleen
Aorta
Thymus
0%
79%
100%
Atrophy 0% 86%
Involution 0% 79%
Others
43%
100%
86%
71%
Mesenteric lymph node
Atrophy 0% 43% 7%
Calcification
n=14 n=14 n=14
**
Kidney
0% 100% 100%
0% 100% 100%
**
**
**
**
**
**
% animals

24
P8R1 P8 + RKT (1%)
Others
Supplementary Table 2. Causes of death in SAMR1 and P8 mice.
Leukemia 71% 80% 40%
n=17 n=20 n=20
##
The observation of pathology after death in the survival study showed that the
main cause of death was leukemia in SAMR1 (R1) and SAMP8 (P8) mice.
Rikkunshito (RKT; 1%) treatment decreased the occurrence of leukemia in SAMP8
mice. ## P < 0.01 vs. P8.
Tumor 12% 5% 20%
Myocardial infarction
Others
6% 0% 0%
12% 15% 40%
% animals
25
ICR ICR + RKT (1%)
32%
Tumor
Liver
Hepatic cirrhosis
Myocardial infarction
32%
5%
0%
32%Others
52%
22%
0%
4%
22%
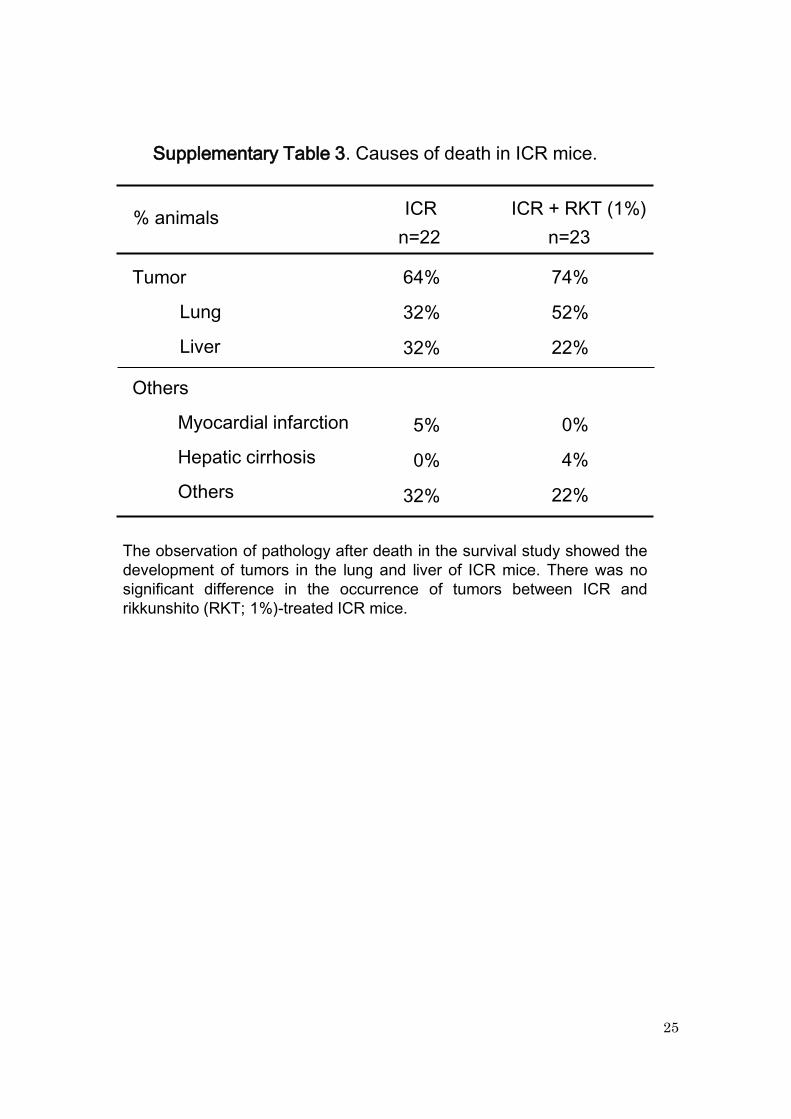
Supplementary Table 3. Causes of death in ICR mice.
Lung
Others
n=22 n=23
64% 74%
The observation of pathology after death in the survival study showed the
development of tumors in the lung and liver of ICR mice. There was no
significant difference in the occurrence of tumors between ICR and
rikkunshito (RKT; 1%)-treated ICR mice.
% animals