Case report of FFR for bifurcation Nanjing first hospital Nanjing heart center Yefei chenshaoliang.

Materials and Design 55 (2014) 482–491
Contents lists available at ScienceDirect
Materials and Design
journal homepage: www.elsevier .com/locate /matdes
Thermal behavior and densification mechanism during selective lasermelting of copper matrix composites: Simulation and experiments
0261-3069/$ - see front matter � 2013 Elsevier Ltd. All rights reserved.http://dx.doi.org/10.1016/j.matdes.2013.10.006
⇑ Corresponding author. Tel./fax: +86 25 52112626.E-mail address: [email protected] (D. Gu).
Donghua Dai, Dongdong Gu ⇑College of Materials Science and Technology, Nanjing University of Aeronautics and Astronautics (NUAA), Yudao Street 29, 210016 Nanjing, PR China
a r t i c l e i n f o
Article history:Received 11 August 2013Accepted 1 October 2013Available online 14 October 2013
Keywords:Numerical simulationAdditive manufacturingSelective laser meltingMetal matrix compositesMarangoni flow
a b s t r a c t
Simulation of temperature distribution and densification process of selective laser melting (SLM) WC/Cucomposite powder system has been performed, using a finite volume method (FVM). The transition frompowder to solid, the surface tension induced by temperature gradient, and the movement of laser beampower with a Gaussian energy distribution are taken into account in the physical model. The effect of theapplied linear energy density (LED) on the temperature distribution, melt pool dimensions, behaviors ofgaseous bubbles and resultant densification activity has been investigated. It shows that the temperaturedistribution is asymmetric with respect to the laser beam scanning area. The center of the melt pool doesnot locate at the center of the laser beam but slightly shifts towards the side of the decreasing X-axis. Thedimensions of the melt pool are in sizes of hundreds of micrometers and increase with the applied LED.For an optimized LED of 17.5 kJ/m, an enhanced efficiency of gas removal from the melt pool is realized,and the maximum relative density of laser processed powder reaches 96%. As the applied LED surpasses20 kJ/m, Marangoni flow tends to retain the entrapped gas bubbles. The flow pattern has a tendency todeposit the gas bubbles at the melt pool bottom or to agglomerate gas bubbles by the rotating flow inthe melt pool, resulting in a higher porosity in laser processed powder. The relative density and corre-sponding pore size and morphology are experimentally acquired, which are in a good agreement withthe results predicted by simulation.
� 2013 Elsevier Ltd. All rights reserved.
1. Introduction
In recent years, there have been a lot of focuses on the fabrica-tion of copper matrix composites (CMCs) due to their excellentelectrical properties, thermal conductivity and good resistance tooxidation [1–3]. WC, due to its high hardness, good wear resistanceand high elastic modulus, is regarded as a good reinforcementmaterial for Cu [1]. Thus WC/Cu composites are the suitable candi-dates for a typical use in high-voltage electrical applications [2].Generally, the WC/Cu parts are fabricated using common castingand powder metallurgy (PM) methods, which need expensiveand dedicated tools such as mould or dies [4,5]. However, therequirement of processing temperatures being significantly abovethe melting point of copper (1390 K) is the shortcoming of the con-ventional processes for WC/Cu composites [2], which may result inthe abnormal grain growth and accordingly produces the poormechanical properties. Therefore, it seems that the conventionalprocessing approaches have the limited capacity to meet the highindustrial requirements for CMCs parts. Meanwhile, parts withcomplex geometrical shapes cannot be fabricated easily via the
conventional methods. Therefore, both demands for obtainingcomplex features and high comprehensive mechanical propertiesare expected to be satisfied by using other novel processingtechnique.
Selective laser melting (SLM), as a newly developed additivemanufacturing (AM) technique, enables the quick fabrication ofthree-dimensional parts with any complex shapes directly frommetal powder [6–10]. The SLM process creates parts in a layer-by-layer fashion by selectively melting thin layers of loose powderwith a high energy laser beam [11,12]. This technique competeseffectively with other conventional manufacturing processes asthe part configuration is complex and the production run is notlarge. Although recent advances in SLM have considerably pro-moted this technology, this method essentially relies on empirical,experimental knowledge and still lacks a strong theoretical basis[13]. This may be attributed to the complex metallurgical processof SLM, which exhibits multiple modes of heat, mass and momen-tum transfer [14,15]. One of the uncontrollable defects of SLM pro-cess is high porosity, which is detrimental to the final mechanicalproperties of SLM parts [16,17]. Many investigations, aiming to ob-tain a high densification level for SLM parts, have been reported.Zhang et al. [18] studied the effects of processing parameters onproperties of SLM Mg–9%Al powder mixture. It was found thatporosity of samples was highly dependent on the energy density,

Nomenclature
A laser absorptivity of the powderCp specific heat at constant pressure, J/(kg K)Dp average diameter of the powder particles, mE total energy, J~F force vectorg gravitational acceleration, m/s2
h sensible enthalpy, J/kghc convective heat transfer coefficient, W/(m2 K)href reference enthalpy, J/kgH enthalpy of the material, J/kgDH latent heat of the phase change, J/kgp pressure, PaP laser power, WSh source item of the radiation and any other volumetric
heat sourcesSH source item of the energy conservation equationSx, Sy, Sz source item of the momentum conservation equationSai mass source for each phaset time, sT temperature, KT1 ambient temperature, KTp temperature of the powder particles, K
Tref reference temperature, Kvb velocity of the gaseous bubble, m/s~v overall velocity vector, m/su, v, w velocity magnitude, m/sx, y, z coordinates, ma volume fraction of the gas phaseai volume fraction of each phasec surface tension, N/me radiation emissivityj thermal conductivity of the powder bed, W/(m K)js thermal conductivity of the solid, W/(m K)jeff effective thermal conductivity of liquid–solid–gas mul-
ti-phases, W/(m K)jf thermal conductivity of the fluid, W/(m K)jr thermal conductivity due to the radiation among parti-
cles, W/(m K)l dynamic viscosity, Pa sq density, kg/m3
qi density of each phase, kg/m3
re Stefan–Boltzmann constantx radius of the Gaussian laser beam, m
Fig. 1. Schematic of SLM physical model.
D. Dai, D. Gu / Materials and Design 55 (2014) 482–491 483
and eventually the densification mechanism during SLM wasestablished by the authors. Hazlehurst and his coworkers [19] fo-cused on the design and fabrication of cobalt chrome molybdenumcellular structures with different porosities via SLM. It was shownthat mechanical properties were significantly influenced by thevolumetric porosity. Saha et al. [20] investigated the crack densityand wear performance of Al-based metal matrix composite fabri-cated by direct metal laser sintering (DMLS) AM process. The sizeand volume fraction of SiC reinforcing particles were varied to ana-lyze the density and wear behavior of laser processed composites.Ferrar et al. [21] studied the effect of inert gas flow during the SLMprocess on the mechanical performance of SLM parts, in order toenable the production of desired components with a greaterreproducibility.
Although the porosity rate can be decreased by optimizing laserparameters and improving scanning strategy during SLM, the innerporosity normally cannot be completely eliminated [22,23]. To date,little work has been focused on the effects of gas phase in the start-ing powder system on the densification behavior of powder undervarious SLM processing conditions. Furthermore, the unique metal-lurgical process of SLM, e.g. the presence of significant Marangonieffect and the super high undercooling degree, significantly impedesthe systematic investigation of the densification activity of the meltpool during SLM process. Therefore, it is of great importance andnecessity to find a feasible method to quantitatively reveal the den-sification behavior of SLM-processed powder and to predict theundesired porosity appeared in the finally solidified melt.
In this work, the numerical simulation regarding the influenceof the linear energy density (LED) of laser beam on the melt pooldynamics and densification mechanisms during SLM of WC/Cupowder system was presented, using Fluent 6.3.26 commercialfinite volume method (FVM) software. The fluid flow driven bysurface tension gradient and gravity forces was considered in thephysical model and the temperature distribution, melt pool dimen-sions, behaviors of bubbles and Marangoni convection were simu-lated. Furthermore, the relative densities of SLM parts obtained bynumerical simulation were compared with those acquired viaexperiments, in order to testify the accuracy of the developed sim-ulation model and obtain reasonable SLM processing conditions toproduce high density WC/Cu parts.
2. Model descriptions
Fluent 6.3.26 software, which enables simulation of processeswith molten metal flow and behavior of the gaseous bubbles, isintroduced to simulate SLM process. To simplify the problem, thefollowing assumptions are made in this study: (1) The melt inthe molten pool is assumed to be laminar and incompressiblehomogeneous Newtonian fluid; (2) Except thermal conductivity,surface tension and viscosity, some other thermal physical con-stants are considered to be temperature independent; and (3)The metal vaporization is ignored.
2.1. Physical model
The schematic of SLM physical model is depicted in Fig. 1. Insimulation the laser beam is defined as a heat flux, q(x, y, z, t), witha Gaussian power distribution as an incoming heat source, whichmoves at a constant rate along the X-axis. The geometry of thissource is assumed by the absorption phenomenon in the skin layer.

484 D. Dai, D. Gu / Materials and Design 55 (2014) 482–491
The laser radiation can penetrate into the powder layer but only upto a certain distance from the surface, which is called ‘‘penetrationdepth’’. The heat losses from the six surfaces of the model are as-sumed to result from the natural convection and radiation. Thepowder system consists of WC, Cu and gas with the volume ratioof 15:55:30. The three-dimensions of the numerical model are3 � 1 � 0.6 mm. The initial temperature of the powder layer, Ti, istreated as the room temperature. As the laser beam interacts withthe powder, a molten pool is formed under the laser beam and themelt infiltrates into the powder layer driven by the capillary andgravitational forces.
2.2. Governing equations
Based on the mass equation, momentum equation and energyequation, the governing equations in the Cartesian coordinatesystem are summarized as follows [24].
2.2.1. Mass conservation equation
@q@tþ @ðquÞ
@xþ @ðqvÞ
@yþ @ðqwÞ
@z¼ 0 ð1Þ
2.2.2. Momentum conservation equation
(1) Momentum conservation equation in the X direction:
@ðquÞ@tþ @ðquuÞ
@xþ @ðquvÞ
@yþ @ðquwÞ
@z
¼ � @p@xþ @
@xl 2
@u@x� 2
3r �~v
� �� �þ @
@yl @u
@yþ @v@x
� �� �
þ @
@zl @u
@zþ @w@x
� �� �þ Sx ð2Þ
(2) Momentum conservation equation in the Y direction:
@ðqvÞ@t
þ @ðquvÞ@x
þ @ðqvvÞ@y
þ @ðqvwÞ@z
¼ � @p@yþ @
@yl 2
@v@y� 2
3r �~v
� �� �
þ @
@xl @u
@yþ @v@x
� �� �þ @
@zl @v
@zþ @w@y
� �� �þ Sy ð3Þ
(3) Momentum conservation equation in the Z direction:
@ðqwÞ@t
þ @ðquwÞ@x
þ @ðqvwÞ@y
þ @ðqwwÞ@z
¼ � @p@zþ @
@zl 2
@w@z� 2
3r �~v
� �� �
þ @
@xl @w
@xþ @u@z
� �� �þ @
@yl @w
@yþ @v@z
� �� �þ Sz ð4Þ
2.2.3. Energy conservation equation
@ðqTÞ@tþ @ðquTÞ
@xþ @ðqvTÞ
@yþ @ðqwTÞ
@z
¼ @
@xj@T@x
� �þ @
@yj@T@y
� �þ @
@zj@T@z
� �þ SH ð5Þ
where q, j, l and p are the density, thermal conductivity, viscosityand pressure, respectively. Sx, Sy and Sz represent the source item ofthe momentum conservation equation in the X, Y and Z direction,respectively. SH is the source item of the energy conservation equa-tion in the X, Y and Z direction and can be defined by:
SH ¼ �@
@tðqDHÞ þ @
@xðquDHÞ þ @
@yðqvDHÞ þ @
@zðqwDHÞ
� �ð6Þ
where DH is the latent heat of phase change. The enthalpy of thematerial is computed as the sum of the sensible enthalpy, h, andthe latent heat, DH. The enthalpy of the material, H, can be definedby:
H ¼ hþ DH ð7Þ
where h ¼ href þR T
TrefCpdT.
2.2.4. Equations of volume of fluid (VOF) modelThe volume fraction equation for the i phase is [25]:
@ai
@tþ~v � rai ¼
Sai
qið8Þ
wherePn
i¼1ai ¼ 1, n represents the phase number.A single momentum equation is solved throughout the domain,
and the resulting velocity field is shared among the phases [25]:
@
@tðq~vÞ þ rðq~v~vÞ ¼ �rpþr½lðr~v þr~vTÞ� þ qg þ~F ð9Þ
The density q and dynamic viscosity l in the equation aredependent on the volume fraction of all phases:
q ¼X
aiqi ð10Þ
l ¼X
aili ð11Þ
The transport of mass and momentum for the laminar andincompressible homogeneous Newtonian fluid is expressed inEqs. (1)–(4). The governing equations are discretized on a stag-gered Cartesian grid system, including local mesh refinements atregions with larger gradients. The initially gaseous bubbles are dis-persed in the physical domain with a zero velocity, which will betracked when they accelerate under the effect of the Marangoniflow. The average bubble velocity located in a specific region ofthe melt pool is obtained using the summation over all cells [26]:
vaverage ¼P
vbaPa
ð12Þ
where a is the volume fraction of the gas phase during thenumerical simulation and vb is the velocity of the gaseousbubbles.
The energy equation is also shared among the phases [25]:
@
@tðqEÞ þ r½~vðqEÞ þ q� ¼ rðjeffrTÞ þ Sh ð13Þ
The VOF model treats energy, E, and temperature, T, as mass-averaged variables:
E ¼Pn
i¼1aiqiEiPni¼1aiqi
ð14Þ
where Ei for each phase is based on the specific heat of that phaseand the shared temperature. The effective thermal conductivity,jeff, is also shared by the phases. The source term, Sh, containscontributions from radiation as well as any other volumetric heatsources.
2.3. Boundary conditions
The boundary condition at the top surface (Z = 0) is given by[27]:

Fig. 2. Thermal physical properties of tungsten carbide (a) and copper (b).
Table 1The as-used material properties and SLM processing conditions.
Parameter Value
Ambient temperature, T1 300 KConvective heat transfer coefficient, hc 80 W/(m2 K)The Stefan–Boltzmann constant, re 5.67 � 10�8 W/(m2 K4)Radiation emissivity, e 0.36Laser absorptivity of the Cu powder 0.4Laser absorptivity of the WC powder 0.6Powder layer thickness, lp 250 lmLaser power, P 600–900 WRadius of laser beam, x 0.3 mm
D. Dai, D. Gu / Materials and Design 55 (2014) 482–491 485
�j@T@z
� �z¼0¼ 2AP
px2 exp �2r2
x2
� �� hcðT � T1Þ � reeðT4 � T4
1Þ
ð15Þ
where x is the radius of the Gaussian laser beam at which the heatflux value is e�2 times of that of the laser beam center, A is theabsorptance of the powder system, r is the distance of a point onthe surface of the powder bed measured from the laser beam centerat time t, T1 is the ambient temperature, hc is the heat transfer coef-ficient of natural thermal convection, re is the Stefan–Boltzmannconstant and e is the emissivity. To simulate the Marangoni flowdue to temperature gradient at the top surface, the surface tensionis given by [28]:
�l @l@z¼ @c@T
@T@x
ð16Þ
�l @l@z¼ @c@T
@T@y
ð17Þ
The temperature on the lateral surfaces is defined as the ambi-ent temperature and the mechanism of the heat loss is assumed tobe the radiation, with the mathematical expression shown by thelast item of Eq. (15). The bottom of the powder layer is connectedto the metal substrate with larger heat conductivity in comparisonwith the gas. As a result heat loss through interface between pow-der layer and substrate is faster.
2.4. Physical properties
Assuming that the particles are spheres and there is no flatten-ing of contact surfaces, the effective thermal conductivity of thepowder bed, j, is estimated by [29]:
jjf¼ ð1�
ffiffiffiffiffiffiffiffiffiffiffiffi1� ap
Þ 1þ ajr
jf
� �
þffiffiffiffiffiffiffiffiffiffiffiffi1� ap 2
1� jf
js
11� jf
js
lnjs
jf
� �� 1
!þ jr
jf
" #ð18Þ
where a is the fractional porosity of the powder bed, jf is the ther-mal conductivity of the fluid surrounding the powder particles, js isthe thermal conductivity of the solid, jr is the thermal conductivityin the powder bed due to the radiation among particles, which isfurther defined by:
jr ¼ 4BreT3pDp ð19Þ
where re is the Stefan–Boltzmann constant, Dp is the average diam-eter of the powder particles, Tp is the temperature of the powderparticles, and B is a view factor which is approximately taken as1/3.
The laser absorptivity of the powder system is determined byboth the physical properties of WC and Cu and the volume fractionof each phase, as defined by:
A ¼X
aiAi ð20Þ
wherePn
i¼1ai ¼ 1, n represents the phase number, Ai is the laserabsorptivity of i phase in the calculated system.
2.5. Numerical simulation
The simulation is carried out using the FLUENT commercial fi-nite volume method package (version 6.3.26) to simulate the ther-mal behavior, velocity field and the gaseous bubbles behavior. Thethermal physical properties of WC and Cu components are de-picted in Fig. 2 [30,31]. The as-used material properties and SLMprocessing parameters are shown in Table 1.
3. Experimental procedures
3.1. Powder materials
Electrolytic 99% purity Cu powder with a dendrite shape and anaverage particle size of 15 lm, and WC powder with an equiaxedshape and a mean particle size of 0.6 lm are used in this study.The two components are mixed according to the ratio mentionedin the simulation.
3.2. Processing and characterization
The SLM apparatus used in this experiment mainly consists of acontinuous wave Gaussian CO2 laser with a maximum power of2000 W and a spot size of 300 lm (supplier: Rofin-Sinar LaserGmbH), an automatic powder layering apparatus, an inert argon

486 D. Dai, D. Gu / Materials and Design 55 (2014) 482–491
gas protection system, and a computer system for process control.Details of the SLM process are summarized in [32,33]. The process-ing conditions investigated are the same as the data in the numer-ical simulation. The densities of SLM-processed specimens weredetermined based on the Archimedes principle. Samples for metal-lographic examinations were cut, ground and polished accordingto standard procedures. Microstructures were characterized usingan Olympus PMG3 optical microscopy (OM).
4. Results and discussion
4.1. Temperature distribution
Fig. 3a shows the temperature distribution along X-axis on thetop surface (Y = 0) with different LEDs during laser irradiation.The profiles of the temperature distribution depict that there isan enhancement in temperature with an increase in LED. For a rel-atively lower LED of 15 kJ/m, the maximum temperature is merely1420 K, which is close to the melting point of Cu (1390 K). Underthis condition, the inadequate energy input may give rise to poormetallurgical bonding ability between the currently processedlayer and the previously processed one [34]. Whereas, at a consid-erably elevated LED of 22.5 kJ/m, the maximum temperature in themelt pool is as high as 1834.8 K. In this situation, the melt tends tosplash, caused by a high capillary instability of the melt due to theoverheating of local regions. The ‘‘balling’’ effect, which is a typicalmetallurgical defect of SLM process, is likely to occur in this
Fig. 3. Temperature distribution at different linear energy densities (LEDs) on thescanning path along X-axis at Y = 0 and Z = 0 (a) and the temperature contour plot atthe LED of 17.5 kJ/m (b).
instance, thereby decreasing the densification level of the finalparts [35]. Meanwhile, the temperature gradient during this fabri-cation process is the highest with the value of 3.9 � 105 K/m, whichaccordingly contributes to the formation of a significantly highstress field. Consequently, the thermal cracks tend to be formedin the SLM-processed parts due to the release of the stresses[33,34,36]. In other two cases, the maximum temperatures are1588 K and 1695 K, respectively, at the LED of 17.5 kJ/m and20 kJ/m. From Fig. 3b, it is worth noting that the melt pool is asym-metric with respect to the laser beam area. The center of the melt
Fig. 4. The three-dimensions of melt pool at various LEDs (a); The melt pool lengthand width (b) and melt pool depth (c) at the LED of 15 kJ/m.

D. Dai, D. Gu / Materials and Design 55 (2014) 482–491 487
pool does not locate at the center of the laser beam (X = 0.0016 m;Y = 0), but slightly shifts towards the side of the decreasing X-axis(Fig. 3b). This phenomenon is attributed to the combination ofthermal accumulation effect and the change of thermal conductiv-ity owing to the transition from powder to solid [37]. The as-irradiated regions located behind the scanning laser beam aregetting heated frequently. Therefore, the center of melt pool alongX-axis is observed to be slightly towards the previous scannedzones (i.e., the decreasing X-axis).
4.2. Melt pool dimensions
Fig. 4 depicts that the melt pool length (along X-axis), width(along Y-axis) and depth (along Z-axis) are proportional to the ap-plied LED. The three-dimensions of the melt pool are extractedfrom the isotherms that are above the melting point of Cu. It canbe found that the melt pool dimensions change with applied LEDsand are in sizes of hundreds of micrometers. All of the simulatedmelt pool length, width and depth increase with the enhancementof LEDs, whereas there is a significant distinction in the incrementrate. Generally, the observation demonstrates that an increase inLED leads to an increase in the melt pool dimensions. Melt poollength at LED of 15 kJ/m is 270 lm and at LED of 22.5 kJ/m is950 lm, which indicates that the melt pool length has approxi-mately a linear relationship with the input LEDs. The same ruleis identified for the melt pool width and the width values at LEDsof 15 kJ/m and 22.5 kJ/m are 250 lm and 680 lm, respectively.Moreover, for a fixed LED (e.g. for LED of 17.5 kJ/m), the melt poollength (�450 lm) is larger than the melt pool width (�350 lm).This phenomenon can be explained that the laser beam is movingalong X-axis and the regions along the laser path are repeatedlyheated. Therefore, for the points at X-axis and Y-axis that havethe same distance from the center of the melt pool, the tempera-ture is higher at X-axis than that at Y-axis (Fig. 4b). On the otherhand, the laser penetration depth must be higher than the powderlayer thickness, in order to ensure that the neighboring layers arewell bonded [38]. The melt pool depth at LED of 15 kJ/m is230 lm (Fig. 4c), which is less than the starting powder layerthickness (250 lm). It indicates that the as-formed molten tracksare not bonded efficiently with the previously processed layers,due to the limited laser penetration depth. As LED increases to17.5 kJ/m, the melt pool depth is 270 lm. On further increasingthe LED from 20 kJ/m to 22.5 kJ/m, the melt pool depth increasesfrom 330 lm to 420 lm. It is accordingly concluded that anenhancement in LED leads to a deeper laser penetration depth.
Fig. 5. The velocity magnitude of gaseous bubbles floating up to the melt poolsurface at different LEDs.
As relative to the melt pool length and width, the increase rate ofthe melt pool depth with the applied LED is much slighter (Fig. 4a).
4.3. Motion of gaseous bubbles
In order to investigate the influence of applied LEDs on the mo-tion of gaseous bubbles, the velocity magnitude of gaseous bubblesfrom the bottom region to the top surface is studied, as depicted inFig. 5. It is clear that the speeds of gaseous bubbles continuouslyaccelerate from the bottom to the top surface. For a relativelylow LED of 15 kJ/m, the obtained speed at the depth of 250 lm is0.02 m/s, while at the top surface the speed increases to 0.18 m/s.As LED increases to 17.5 kJ/m, the speeds of gaseous bubbles atthe depth of 250 lm and top surface are 0.12 m/s and 0.26 m/s,respectively. Under this condition, it implies that gaseous bubbleshave a tendency to rise faster and escape from the melt pool.However, for a relatively high LED of 20 kJ/m, the speeds of gaseousbubbles decrease sharply and are almost similar as the speedsobtained at LED of 15 kJ/m. As LED further increases to 22.5 kJ/m,the curve of the speeds of gaseous bubbles along the melt pool
Fig. 6. The velocity vector plots of convection flow in the melt pool at various LEDs(cross-sectional view): (a) LED = 15 kJ/m, (b) LED = 17.5 kJ/m, (c) LED = 20 kJ/m, and(d) LED = 22.5 kJ/m.

488 D. Dai, D. Gu / Materials and Design 55 (2014) 482–491
depth becomes more complicated. Along the melt pool depthranging from 212 lm to 250 lm, the speeds are higher than thoseobtained at LEDs of 15 kJ/m and 20 kJ/m, but are lower than thoseobtained at LED of 17.5 kJ/m. Moreover, along the distance fromthe top surface to the melt pool depth of 180 lm, the speeds ofgaseous bubbles are lowest in this instance.
During SLM process, the thermocapillary flow (Marangoni con-vection) induced by surface tension variations along free surface isan important phenomenon [39], because it plays a crucial role indetermining the behaviors of gaseous bubbles [40,41]. Fig. 6 dis-plays the velocity vector plots of convection flow under variousLEDs. It is obvious that the intensity of the fluid flow increases withthe enhancement of input LEDs. For LEDs of 15 kJ/m and 17.5 kJ/m,the high-temperature melt near the central region floats up to thefree surface with the average velocity of 10 m/s and 26 m/s, respec-tively (Fig. 6a and b). Interestingly, as LED increases to 20 kJ/m, it isapparent to find a smaller scaled vortex in the bottom section ofthe melt pool (Fig. 6c). As LED further increases to 22.5 kJ/m, a lar-ger scaled vortex is found with the fluid flow velocity of 45 m/s(Fig. 6d). The influence of the fluid flow under various LEDs onthe bubbles movement is depicted in Fig. 7. For a relatively lowLED of 15 kJ/m, most of the bubbles are entrapped below the sur-face of the melt pool due to the lower speeds obtained by the bub-bles (Fig. 7a). As LED increases to 17.5 kJ/m, a majority of bubblesescape the melt pool easily with higher movement speeds (Figs. 5and 7b). Therefore, a more significant densification response of themelt pool is expected under this processing condition. However,for a relatively high LED of 20 kJ/m, although the bubbles in the
Fig. 7. The schematics of gaseous bubbles movement in the melt pool on increasing LED
upper section of the melt pool still have the capability to escapefrom the pool, the presence of the rotational pattern of the flowvortex (Fig. 6c) tends to entrap the gaseous bubbles at the bottomof the melt pool (Fig. 7c). As LED further increases to 22.5 kJ/m, thegaseous bubbles are entrapped easily by the larger scaled vortex(Fig. 7d) and the bubbles tend to be transported to the centre ofthe rotating flow due to the lower density of a gas/melt multiphasemixture. Meanwhile, the centrifugal forces act on the rotating flow,resulting in the formation of severe agglomeration of bubbles inthe middle section of melt pool. It is accordingly concluded thatas the dynamics of fluid flow increase with the elevated LEDs, thereis an enhanced possibility that the gas in the starting powder layerbecome trapped and dragged in the melt pool, thereby producingthe residual porosity in the finally solidified parts.
4.4. Densification behavior
Since SLM is a multi-line based scanning process in eachprocessing layer, the characteristics of single scanning track havean apparent effect on the resultant multi-line and multi-layerforming conditions. In this simulation of the densification behaviorduring SLM process, the starting powder system is irradiated bythe laser beam. A melt pool will be produced and resultantMarangoni convection tends to be formed due to the surfacetension [42]. Under the effect of different Marangoni flowprofiles, the gaseous bubbles have a tendency to show variousactivities in the melt pool (Figs. 6 and 7). The densificationbehavior during the SLM process, as investigated in this
s: (a) LED = 15 kJ/m, (b) LED = 17.5 kJ/m, (c) LED = 20 kJ/m, and (d) LED = 22.5 kJ/m.

D. Dai, D. Gu / Materials and Design 55 (2014) 482–491 489
established physical model, is identified by the combined effect ofthe Marangoni convection in the melt pool and the motion of thegaseous bubbles. Namely, as the gas bubbles escape from the meltpool, the volume fraction of the other phases in the solidified partwill be accordingly enhanced. Fig. 8 shows the contour plots ofrelative densities in the longitudinal sections of single scan tracksunder different LEDs. The areas within the melt pool of the similardensity can be identified in the similar shades. This method of datarepresentation makes it easier to identify the densification ratewith respect to position within the melt pool. It is noted that theinput LED has a significant effect on the distribution of the density(i.e., the densification behavior). For a relatively low LED of 15 kJ/m, the relative density is about 93% from the free surface of meltpool to the pool depth of 170 lm. While for the pool depth over170 lm, the relative density is approximately 90% (Fig. 8a). WhenLED increases to 17.5 kJ/m, the mean porosity is reduced, due tothe increased efficiency of gas removal from the melt pool (Figs. 5and 7b). The maximum relative density is 96% and from the freesurface to the depth of 200 lm the relative density is �93%
Fig. 8. The relative density contour plots of the melt pool at various LEDs (cross-sectional view): (a) LED = 15 kJ/m, (b) LED = 17.5 kJ/m, (c) LED = 20 kJ/m, and (d)LED = 22.5 kJ/m.
(Fig. 8b). However, for a relatively high LED of 20 kJ/m, the maxi-mum relative density decreases to �92% and the minimum is�90% in the bottom of the melt pool (Fig. 8c), due to the insuffi-ciency of gas removal from the melt pool (Fig. 7c). As LED furtherincreases to 22.5 kJ/m, the relative density further decreases to�90% in the whole melt pool. In comparison with the previousthree cases, the areas of the minimum density appear in the middleregions of the metal pool (Fig. 8d), other than in the bottom of thepool (Fig. 8a–c).
At a relatively low LED of 15 kJ/m, a lower operative tempera-ture (Fig. 3a) and attendant higher melt viscosity, l, are obtainedin the melt pool. As a result, the gaseous bubbles float up in alower speed (Fig. 5). It is rather difficult for the bubbles to escapefrom the melt pool, which subsequently induces a lower density(Fig. 8a). As LED increases to 17.5 kJ/m, the significantly de-creased viscosity contributes to the formation of lower viscousdrag forces, leading to an elevated speed of bubbles. Therefore,the gaseous bubbles escape from the melt pool easily, thusachieving a higher SLM densification (Fig. 8b). With a furtherenhancement of LED above 20 kJ/m, the sharply reduced surfacetension (r) in the melt pool can be the propulsion for the forma-tion of a higher Eötvös number (Eo), which is regarded as propor-tional to buoyancy force induced by surface tension force, asrevealed by Refs. [43,44]. In this situation, the gaseous bubblestend to undergo the significant deformation and, accordingly,break into bubbles with smaller radii, which exist in the wholeregion with the decreased speeds (Figs. 5 and 8c and d). Thereaf-ter, bubbles are easily trapped in the melt pool, resulting in theformation of the reduced density (Fig. 8c and d). Furthermore,there is also a position variation in porosity along Y-axis. The den-sification level in the center is higher than that in the boundaryarea. It is known that the solidification of the molten pool firstlybegins at edges because of (i) the lower operative temperaturethan that in the center and (ii) the faster heat loss through con-ductivity after removing the laser beam [45,46]. Consequently,the bubbles at the edges of the molten pool are not easy to escapefrom the pool and remained as the porosity in the solidifiedmaterials, resulting in a lower densification level at the edges ofthe solidified pool.
4.5. Experiment verification
The cross-sections of SLM-processed WC/Cu powder system un-der different LEDs are depicted in Fig. 9. At a relative low LED of15 kJ/m, a large amount of bubbles are entrapped within the meltpool and the irregular pores are present after SLM, with the aver-age size of 200 lm (Fig. 9a). As the applied LED increases to17.5 kJ/m, a small amount of residual pores in the solidified meltpool reduce their average size to 50 lm (Fig. 9b). However, for arelatively high LED of 20 kJ/m, bubbles have a tendency to be en-trapped and remained in the melt pool, accordingly resulting inthe formation of pores with the larger size of 300 lm (Fig. 9c). AsLED further increases to 22.5 kJ/m, clusters of pores are found inthe solidified melt pool due to the appearance of the larger scaledvortex (Fig. 6d), thereby resulting in the aggregation of pores(Fig. 9d). Fig. 10 shows the comparison of relative densities calcu-lated by numerical simulation with those obtained by experimentsat different LEDs. The quantitative measurement shows that therelative densities obtained by simulation have a good accordancewith those acquired by experiments. For instance, at the LED of17.5 kJ/m, the average relative density by simulation is 95% andthe result measured by experiments is (94 ± 2)%. Therefore, a closelook at the experiment and simulation results reveals that theformation and development behaviors of pores are in a good agree-ment with the simulation results.
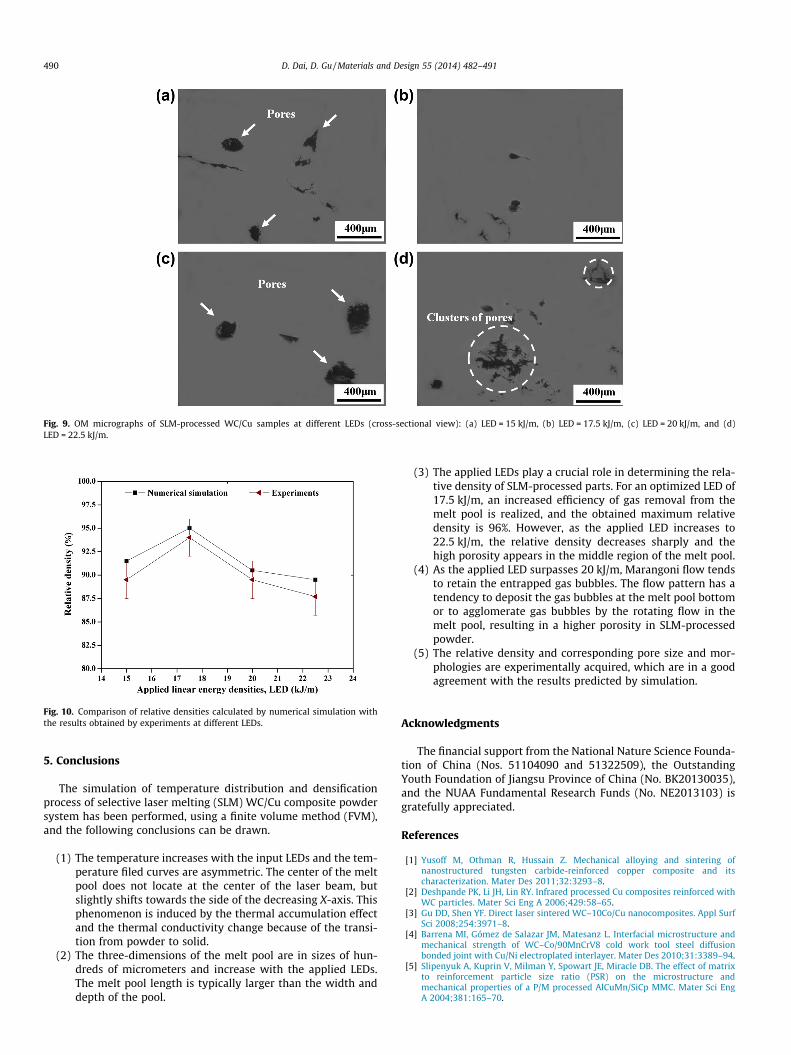
Fig. 9. OM micrographs of SLM-processed WC/Cu samples at different LEDs (cross-sectional view): (a) LED = 15 kJ/m, (b) LED = 17.5 kJ/m, (c) LED = 20 kJ/m, and (d)LED = 22.5 kJ/m.
Fig. 10. Comparison of relative densities calculated by numerical simulation withthe results obtained by experiments at different LEDs.
490 D. Dai, D. Gu / Materials and Design 55 (2014) 482–491
5. Conclusions
The simulation of temperature distribution and densificationprocess of selective laser melting (SLM) WC/Cu composite powdersystem has been performed, using a finite volume method (FVM),and the following conclusions can be drawn.
(1) The temperature increases with the input LEDs and the tem-perature filed curves are asymmetric. The center of the meltpool does not locate at the center of the laser beam, butslightly shifts towards the side of the decreasing X-axis. Thisphenomenon is induced by the thermal accumulation effectand the thermal conductivity change because of the transi-tion from powder to solid.
(2) The three-dimensions of the melt pool are in sizes of hun-dreds of micrometers and increase with the applied LEDs.The melt pool length is typically larger than the width anddepth of the pool.
(3) The applied LEDs play a crucial role in determining the rela-tive density of SLM-processed parts. For an optimized LED of17.5 kJ/m, an increased efficiency of gas removal from themelt pool is realized, and the obtained maximum relativedensity is 96%. However, as the applied LED increases to22.5 kJ/m, the relative density decreases sharply and thehigh porosity appears in the middle region of the melt pool.
(4) As the applied LED surpasses 20 kJ/m, Marangoni flow tendsto retain the entrapped gas bubbles. The flow pattern has atendency to deposit the gas bubbles at the melt pool bottomor to agglomerate gas bubbles by the rotating flow in themelt pool, resulting in a higher porosity in SLM-processedpowder.
(5) The relative density and corresponding pore size and mor-phologies are experimentally acquired, which are in a goodagreement with the results predicted by simulation.
Acknowledgments
The financial support from the National Nature Science Founda-tion of China (Nos. 51104090 and 51322509), the OutstandingYouth Foundation of Jiangsu Province of China (No. BK20130035),and the NUAA Fundamental Research Funds (No. NE2013103) isgratefully appreciated.
References
[1] Yusoff M, Othman R, Hussain Z. Mechanical alloying and sintering ofnanostructured tungsten carbide-reinforced copper composite and itscharacterization. Mater Des 2011;32:3293–8.
[2] Deshpande PK, Li JH, Lin RY. Infrared processed Cu composites reinforced withWC particles. Mater Sci Eng A 2006;429:58–65.
[3] Gu DD, Shen YF. Direct laser sintered WC–10Co/Cu nanocomposites. Appl SurfSci 2008;254:3971–8.
[4] Barrena MI, Gómez de Salazar JM, Matesanz L. Interfacial microstructure andmechanical strength of WC–Co/90MnCrV8 cold work tool steel diffusionbonded joint with Cu/Ni electroplated interlayer. Mater Des 2010;31:3389–94.
[5] Slipenyuk A, Kuprin V, Milman Y, Spowart JE, Miracle DB. The effect of matrixto reinforcement particle size ratio (PSR) on the microstructure andmechanical properties of a P/M processed AlCuMn/SiCp MMC. Mater Sci EngA 2004;381:165–70.

D. Dai, D. Gu / Materials and Design 55 (2014) 482–491 491
[6] Zhang BC, Fenineche NE, Liao HL, Coddet C. Microstructure and magneticproperties of Fe–Ni alloy fabricated by selective laser melting Fe/Ni mixedpowders. J Mater Sci Technol 2013;29:757–60.
[7] Li RD, Shi YS, Liu JH, Xie Z, Wang ZG. Selective laser melting W–10 wt% Cucomposite powders. Int J Adv Manuf Technol 2010;48:597–605.
[8] Gu DD, Hagedorn YC, Meiners W, Meng GB, Batista RJS, Wissenbach K, et al.Densification behavior, microstructure evolution, and wear performance ofselective laser melting processed commercially pure titanium. Acta Mater2012;60:3849–60.
[9] Song B, Dong SJ, Zhang BC, Liao HL, Coddet C. Effects of processing parameterson microstructure and mechanical property of selective laser melted Ti6Al4V.Mater Des 2012;35:120–5.
[10] Sun JF, Yang YQ, Wang D. Mechanical properties of a Ti6Al4V porous structureproduced by selective laser melting. Mater Des 2013;49:545–52.
[11] King D, Tansey T. Alternative materials for rapid tooling. J Mater ProcessTechnol 2002;121:313–7.
[12] Zhang BC, Fenineche NE, Zhu L, Liao HL, Coddet C. Studies of magneticproperties of permalloy (Fe–30% Ni) prepared by SLM technology. J MagnMagn Mater 2012;324:495–500.
[13] Gu DD, Shen YF. Balling phenomena in direct laser sintering of stainless steelpowder: metallurgical mechanisms and control methods. Mater Des2009;30:2903–10.
[14] Simchi A. Direct laser sintering of metal powders: mechanism, kinetics andmicrostructural features. Mater Sci Eng A 2006;428:148–58.
[15] Kruth JP, Levy G, Klocke F, Childs THC. Consolidation phenomena in laser andpowder-bed based layered manufacturing. CIRP Ann-Manuf Technol2007;56:730–59.
[16] Dadbakhsh S, Hao L, Sewell N. Effect of selective laser melting layout on thequality of stainless steel parts. Rapid Prototyping J 2012;18:241–9.
[17] Brandl E, Heckenberger U, Holzinger V, Buchbinder D. Additive manufacturedAlSi10Mg samples using selective laser melting (SLM): microstructure, highcycle fatigue, and fracture behavior. Mater Des 2012;34:159–69.
[18] Zhang BC, Liao HL, Coddet C. Effects of processing parameters on properties ofselective laser melting Mg–9% Al powder mixture. Mater Des 2012;34:753–8.
[19] Hazlehurst K, Wang CJ, Stanford M. Evaluation of the stiffness characteristicsof square pore CoCrMo cellular structures manufactured using laser meltingtechnology for potential orthopaedic applications. Mater Des 2013;51:949–55.
[20] Ghosh SK, Saha P. Crack and wear behavior of SiC particulate reinforcedaluminium based metal matrix composite fabricated by direct metal lasersintering process. Mater Des 2011;32:139–45.
[21] Ferrar B, Mullen L, Jones E, Stamp R, Sutcliffe CJ. Gas flow effects on selectivelaser melting (SLM) manufacturing performance. J Mater Process Technol2012;212:355–64.
[22] Simchi A, Pohl H. Effects of laser sintering processing parameters on themicrostructure and densification of iron powder. Mater Sci Eng A2003;359:119–28.
[23] Zhang BC, Liao H, Coddet C. Selective laser melting commercially pure Ti undervacuum. Vacuum 2013;95:25–9.
[24] Dong WC, Lu SP, Li DZ, Li YY. Numerical simulation of effects of the minoractive-element oxygen on the Marangoni convection and the weld shape. ActaMetall Sin 2008;44:249–56.
[25] Alhendal Y, Turan A, Aly WIA. VOF simulation of Marangoni flow of gasbubbles in 2D-axisymmetric column. Procedia Comput Sci 2010;1:673–80.
[26] Lörstad D, Fuchs L. High-order surface tension VOF-model for 3D bubble flowswith high density ratio. J Comput Phys 2004;200:153–76.
[27] Xiao B, Zhang YW. Marangoni and buoyancy effects on direct metal lasersintering with a moving laser beam. Numer Heat Tra-Appl 2007;51:715–33.
[28] Yang J, Wang F. 3D finite element temperature field modelling for direct laserfabrication. Int J Adv Manuf Technol 2009;43:1060–8.
[29] Dai K, Shaw L. Thermal and mechanical finite element modeling of laserforming from metal and ceramic powders. Acta Mater 2004;52:69–80.
[30] Reeber RR, Wang K. Thermophysical properties of a-tungsten carbide. J AmCeram Soc 1999;82:129–35.
[31] Zhang J, Li DY, Li JY, Zhao LZ. Numerical simulation of temperature field inselective laser sintering. Computer and computing technologies in agricultureIV, 347. Berlin, Heidelberg: Springer; 2011.
[32] Gu DD, Meng GB, Hong C. Densification, microstructure, and wear property ofin situ titanium nitride-reinforced titanium silicide matrix compositesprepared by a novel selective laser melting process. Metall Mater Trans A2012;43:697–708.
[33] Gu DD, Meiners W, Wissenbach K, Poprawe R. Laser additive manufacturing ofmetallic components: materials, processes and mechanisms. Int Mater Rev2012;57:133–64.
[34] Mumtaz KA, Erasenthiran P, Hopkinson N. High density selective laser meltingof Waspaloy�. J Mater Process Technol 2008;195:77–87.
[35] Zhang BC, Liao HL, Coddet C. Microstructure evolution and density behavior ofCP Ti parts elaborated by self-developed vacuum selective laser meltingsystem. Appl Surf Sci 2013;279:310–6.
[36] Song B, Dong SJ, Liu Q, Liao HL, Coddet C. Vacuum heat treatment of iron partsproduced by selective laser melting: microstructure, residual stress and tensilebehavior. Mater Des 2014;54:727–33.
[37] Hussein A, Hao L, Yan C, Everson R. Finite element simulation of thetemperature and stress fields in single layers built without-support inselective laser melting. Mater Des 2013;52:638–47.
[38] Song B, Dong SJ, Coddet P, Liao HL, Coddet C. Fabrication of NiCr alloy parts byselective laser melting: columnar microstructure and anisotropic mechanicalbehavior. Mater Des 2014;53:1–7.
[39] Guan YC, Zhou W, Li ZL, Zheng HY. Influence of overlapping tracks onmicrostructure evolution and corrosion behavior in laser-melt magnesiumalloy. Mater Des 2013;52:452–8.
[40] Tsotridis G, Rother H, Hondros ED. Marangoni flow and the shapes of laser-melted pools. Naturwissenschaften 1989;76:216–8.
[41] Zhang YW, Faghri A. Analysis of forced convection heat transfer inmicroencapsulated phase change material suspensions. J Thermophys HeatTransfer 1995;9:727–32.
[42] Gu DD, Shen YF, Lu ZJ. Microstructural characteristics and formationmechanism of direct laser-sintered Cu-based alloys reinforced with Niparticles. Mater Des 2009;30:2099–107.
[43] Dai GC, Chen MH. Chemical engineering fluid mechanics. Beijing: ChemicalIndustry Press; 1988.
[44] Drenchev L, Sobczak J, Asthana R, Malinov S. Mathematical modelling andnumerical simulation of ordered porosity metal materials formation. J ComputAided Mater Des 2003;10:35–54.
[45] Li CW, Wang Y, Zhan HX, Han T, Han B, Zhao WM. Three-dimensional finiteelement analysis of temperatures and stresses in wide-band laser surfacemelting processing. Mater Des 2010;31:3366–73.
[46] Han GM, Zhao J, L JQ. Dynamic simulation of the temperature field of stainlesssteel laser welding. Mater Des 2007;28:240–5.