Material Availability and the Supply Chain: Risks, Effects ...

OCTOBER 2014
MATERIAL RISKS: HOW PUBLIC ACCOUNTABILITY IS SLOWING TAR SANDS DEVELOPMENT
Material Risks: How public accountability is slowing tar sands development
This paper was conceived, written and researched collectively by Tom Sanzillo, Lorne Stockman,
Deborah Rogers, Hannah McKinnon, Elizabeth Bast, and Steve Kretzmann. With assistance and/or
additional contributions from Adam Wolfensohn, and Amin Asadollahi.
October 2014
This is the first of a series of collaborative papers on the tar sands industry in Canada. The paper is intended
to identify issues, data and trends, which will be developed in greater detail in the coming months.
Institute for Energy Efficiency and Financial Analysis
http://www.ieefa.org/
Oil Change International
http://priceofoil.org
The Institute for Energy Economics and Financial Analysis (IEEFA) conducts research and analyses on
financial and economic issues related to energy and the environment. The Institute’s mission is to accelerate
the transition to a diverse, sustainable and profitable energy economy and to reduce dependence on coal
and other non-renewable energy resources.
Oil Change International (OCI) exposes the true costs of fossil fuels and identifies and overcomes barriers
to the coming transition towards clean energy. Oil Change International works to achieve its mission by
producing strategic research and hard-hitting, campaign-relevant investigations; engaging in domestic
and international policy and media spaces; and providing leadership in and support for resistance to the
political influence of the fossil fuel industry, particularly in the United States.
Cover image: Protestors against the Keystone XL pipeline conducting a sit in outside the White House
during the Tar Sands Action, September 3, 2011. ©Josh Lopez.
CONTENTS
Executive Summary 4
Public Accountability Makes a Difference: Shifting Markets, Increased Scrutiny and Changing Opinion 6
Keystone XL: public accountability as an investment risk 7
Lessons in the public accountability risk factor from U.S. coal experience 7
Troubling Trends: Public Accountability Impacts to Date 8
Underperforming stocks 8
Spending more, making less 10
Additional impediments and risks 13
Transportationbyrail 13
Legalaccesstotheresourceandtransportationroutes 14
Canadianactiononforeignownership 15
Costinflation 15
Costcurves,carbonriskandstrandedassets 15
Environmentalandotherregulatoryrisks 15
Rising costs and cancelled projects 16
Capexisdeclininginthetarsands 16
Cancelledprojects 17
Revenuelossesandmarketaccess 18
Thecostofdelays 18
Forecast Model: Impact of Market Pressures and Public Accountability on Tar Sands Production 20
Increased pipeline capacity critical to achievement of production goals 20
Reduced netback and avoided production/emissions 20
Capex forecast suggests end to boom times 22
Estimating the barrels at risk from pipeline infrastructure campaigns and the carbon impact 22
Conclusion 25
Appendix: Tar Sands Production by Company 26
Thisreportisforinformationandeducationalpurposesonly.Itis
intendedsolelyasadiscussionpiecefocusedonthetopicofthetar
sandsindustryandtheimpactofpublicaccountabilityeffortsand
marketforcesandtheimplicationsforindustryprofitability.Under
nocircumstanceisittobeconsideredasafinancialpromotion.
Itisnotanoffertosellorasolicitationtobuyanyinvestment
referredtointhisdocument;norisitanoffertoprovideanyform
ofinvestmentservice.
Thisreportisnotmeantasageneralguidetoinvesting,orasa
sourceofanyspecificinvestmentrecommendation.Whilethe
informationcontainedinthisreportisfromsourcesbelieved
reliable,wedonotrepresentthatitisaccurateorcompleteand
itshouldnotberelieduponassuch.Unlessattributedtoothers,
anyopinionsexpressedarethecurrentopinionsofOilChange
International(OCI)andtheInstituteofEnergyEconomicsand
FinancialAnalysis(IEEFA)only.
Certaininformationpresentedmayhavebeenprovidedbythird
parties.OCIandIEEFAbelievethatsuchthird-partyinformation
isreliable,butdonotguaranteeitsaccuracy,timelinessor
completeness;anditissubjecttochangewithoutnotice.Ifthere
areconsideredtobematerialerrors,pleaseadvisetheauthors
andarevisedversioncanbepublished.
OCIhasenteredintoacontractwithRystadEnergyfortheuseof
itsUCubedatabase.ThedatabaserepresentsRystad’scompilation
ofindustrydataandtrends.Muchofthedatausedinthisreportis
derivedfromthatdatabaseand,whereappropriate,supplemented
withindependentsourcesfromthetarsandsindustry,individual
tarsandproducerfinancialfilings,governmentalpublicationsand
businesstradepublications.Thesummaryandconclusionsinthis
paperarethoseofOCIandIEEFA.Thesummaryandconclusions
arenottobeconstruedastheopinionofRystadEnergy.
IMPORTANT INFORMATION
4
TheKeystoneXLtarsandspipelineisoneofthemosttalked
aboutNorthAmericanenergyandpoliticalissuesoftheera.Once
thoughtinevitable,theprojectandCanada’splantoexpandtar
sandsproductionhavebeenconfrontedbyanaccumulationof
economicandpoliticalriskscreatingaveritable‘carbonblockade.’
AsCanadianleadersandcitizenswrestlewithanindustry
plantomorethandoublethedailyoutputoftarsandscrude,
stakeholdersinandoutsideofCanadahavecreatedadebateover
localenvironmentalandglobalclimatecosts.U.S.andCanadian
decisionmakershavetakenasecondlookasprojectdelaystake
afinancialandpoliticaltollonproposedprojects.Thedelaysand
cancellationshaveexposedthefactthattarsandsinvestments,
oncethoughttobehighlylucrative,areshowingsignsoffinancial
weakness.Withgrowingpublicawarenessandmarkethesitancy,
expansionoftarsandsproductioninCanadawillremaincontested
terrainfortheforeseeablefuture.
IfCanadianoilproducersareabletosucceedwiththeirlarge
scalebuildoutplans,over21billionbarrelsoftarsandscrudewill
beproducedoverthenextsixteenyears(to2030).Inthattime,
industryintendstoincreasedailyproductionfromcurrentlevels
of2millionbarrelsperday(mbpd)topossiblyashighas4.8mbpd
orevenmore.
Tarsandsproductionislandlocked.Expansionoftransport
infrastructureisessentialtoproductiongrowth.TheKeystoneXL
pipelinecampaignhas,todate,delayedthispipelineinfrastructure
projectforoverfiveyears.Additionalcampaignshaveeffectively
delayedeveryproposedexportpipelineproject,including
NorthernGateway,AlbertaClipper,andEnergyEast.Thedelays
havecostproducersmoneyandtime,reducingthepricethey
havereceivedfortarsandscrudeassupplyhasoutpacedthe
capacityoftransportinfrastructuretocarrytarsandscrudeto
newmarkets.
DuringthedebateoverKeystone,marketchangeshavetaken
placethatarealsoweakeningthefinancialviabilityoftarsands
projects.In2014alone,threesignificantprojectshavebeen
canceledandmoreareinsignificantfinancialdistress.Junior
tarsandproducersare,asagroupfacingcapitalmarketaccess
problems.Inaddition,theindustryfacesagrowingconstellation
ofrisksasprojecteconomicsbecomepressuredbylowoilprices
andshrinkingrevenues,risingcosts,smallerprofitmargins,
toughercapitalmarkets,transportconstraints,environmental
challengesandprotectionistlegislation.
Mostanalystsconsistentlycite“transportationandinfrastructure
constraints”and“lackofinternationalmarketaccess”asmajor
reasonsforconcern.Thesefactorsaredirectlylinkedtopublic
accountabilityeffortsaroundclimateandotherenvironmental
issuesthatappearcertaintoonlygrowstrongerinthecoming
years.Inaddition,therecentfallinoilpricesonlyreducesmargins,
thusfurtherunderminingtheviabilityofprojectfinance.Tarsands
producersneedpipelinestomovetheirproductascheaplyas
possibletothemostlucrativemarketsmorethaneverbefore.
ThisreportisajointeffortbytheInstituteforEnergyEfficiency
andFinancialAnalysisandOilChangeInternationaltodescribethe
changeshappeninginthetarsandsmarket,discernthereasons
forthesechanges,andforecasttheimpactsofcontinuingtrends.
Ourprincipalfindingsare:
f Lack of market access, caused in large part by public
accountability actions driven by pipeline campaigns, has
played a significant role in the cancellation of three major tar
sands projects in 2014 alone- Shell’s Pierre River, Total’s Joslyn
North, and Statoil’s Corner Project.
f Combined, these projects would have produced 4.7 billion
barrels of bitumen that would in turn have released 2.8 billion
metric tonnes of carbon dioxide (CO2) into the atmosphere.
Thisisequivalenttotheemissionsof735coalplantsinoneyear,
orbuilding18newcoalplantsthatwilllast40yearseach.
f After years of increased spending in the tar sands, capital
expenditure (Capex) has peaked and has begun to decline.
WeprojectthatthiserosionofCapexspendinglevelsfrom
currentplanswillcontinueastarsandproducersincreasingly
acknowledgetheconstellationofrisksdescribedinthisreport.
f Public accountability in the form of pipeline campaigns
has been a major factor in reducing revenues to tar sands
producers.Overall,tarsandsproducerslost$30.9billion
between2010-2013duetowiderpricedifferentialscausedby
transportationbottlenecksandthefloodofcrudecomingfrom
tightoilfields.Ofthat,$17.1billionor55percentcanbecredibly
attributedtotheimpactofpublicaccountabilitycampaigns.
f Tar sands producers are underperforming the stock market.
NineoftenleadingtarsandsproducersinCanadahave
underperformedthestockmarketinthelastfiveyears.
f Leading industry experts have recently downgraded their
outlook for future tar sands production.Thisdowngradetakes
placeastransportationconstraintspersist.
EXECUTIVE SUMMARY

5
Inadditiontoevaluatingcurrentimpactsofpublicaccountability
todate,wealsohaveconstructedaforecastmodeltoestimate
whatcontinuedpublicpressureonpipelineinfrastructuremaydo
totarsandsproduction.Ourforecastanalysisprojectstrendsout
to2030andfindsthat:
f Ifpipelinecampaignsandassociatedpublicaccountability
effortscontinuetodrivetransportationconstraints,upto
6.9billionbarrelsoftarsandsoilcouldbeleftunderground.
Inotherwords,ifnonewpipelinesarebuilt,ourforecast
predictsthatanadditional4.1billiontonnesofCO2willnotbe
releasedintotheatmosphere.Spreadoverthe16yearsofthis
forecast,theseemissionsaretheequivalentoftheemissions
from67averageU.S.coalplantsornearly54millionaverage
passengervehicles.
f Capitalexpenditure(Capex)isexpectedtodeclinesteadilyfor
yearsandourforecastdoesnotenvisionitreturningtocurrent
levelsforatleast15years,ifever.Increasedinvestmentinthe
tarsandsisonlylikelytotakeplaceifallormostmarketaccess
issuesaresolved.
Tarsandspipelinecampaignsarearecentexampleofhow
publicadvocacyeffortscanaltercapitalinvestmentdecision
making.TheKeystoneXLcampaignhasmanagedthusfarto
delayafinalgovernmentaldecisionontheprojectwhileraising
publicawarenessabouttheenvironmentalcostsoftarsands
development.Thesecitizeninterventionshaveresultedin
increaseddiligencebygovernmentagencieswithpublichealth
andenvironmentalmandates,impairedtheprojectdevelopment
processofthecapitalmarketsandmobilizedapermanent,political
constituencyinsupportofalternativestotarsandsexpansion.
“There is no way we could have ever predicted that we would become the lightning rod for a debate around fossil fuels and the development of the Canadian oil sands.”Russ Girling, CEO, TransCanada, 2011

6 PUBLIC ACCOUNTABILITY MAKES A DIFFERENCE: SHIFTING MARKETS, INCREASED SCRUTINY AND CHANGING OPINION
Tarsandsandpipelinecampaignsarea
recentexampleofhowpublicadvocacy
effortscanshapecapitalinvestment
decisionmaking.TheKeystoneXL
campaigntostoptheprojecthasmanaged
thusfartodelayfinalgovernmental
decisionsontheprojectwhileraising
publicawarenessabouttheenvironmental
costsoftarsandsdevelopment.These
activistinterventionshaveresultedin
increaseddiligencebygovernment
agencieswithpublichealthand
environmentalmandates,impairedthe
projectdevelopmentprocessofthecapital
marketsandmobilizedapermanent,
politicalconstituencyinsupportof
alternativestotarsandexpansion.This
reportdocumentsthedetailedinterplay
ofpublicadvocacyeffortsandmarket
forcesintheCanadiantarsands.
KEYSTONE XL: PUBLIC ACCOUNTABILITY AS AN INVESTMENT RISKWhentheTransCanadaKeystoneXL
pipelinewasoriginallyproposedin2008,
therewasanexpectationthatitwould
receivenecessaryapprovalsquicklyand
beupandrunningbylate2011.Public
policy,publicopinion,andcapitalmarket
allocationswereinalignmenttopromote
theKeystonestorylineofinvestment
growthandeconomicprogressinthe
tarsands.
Timeandeventschangedthisstoryline.By
2011RussGirling,theCEOofTransCanada,
said“There is no way we could have ever
predicted that we would become the
lightning rod for a debate around fossil
fuels and the development of the Canadian
oil sands.”1Publicadvocacyeffortswere
alreadydrivingsignificantshiftsinpublic
opinionandpoliticaldebatein2011.Today,
publicoppositiontothepipelinehas
continuedtogrowandsupportforthe
pipelinehasdeclined.2
InCanada,campaignstoraiseawareness
aroundtarsandsandpipelinesare
clearlyhavinganimpactonpublic
opinionaswell.Pollingcompletedfor
theCanadianAssociationofPetroleum
Producers(CAPP)inlate2013showed
thatthemajorityofCanadians(51%)
believethat,“whilethereisaneedfor
energyinCanada,itdoesnotoutweigh
theenvironmentalriskswithoilsands
development.”Thesamesurveyalso
indicatedthat80%ofCanadianswould
assignthetarsandsindustryagradeof
Corlesswhenitcomestoprotecting
theenvironment.3Finally,recentNanos
polling,alsoinCanada,showsthatsupport
fortheKeystoneXLpipelineinCanadahas
droppedfrom60%to47%betweenApril
of2013andJanuaryof2014.4
Itisexpectedthatsometimeduringlate
2014orearly2015theUnitedStates
governmentwillmakeacriticaldecision
thatcouldmovetheprojectforwardor
causeitscancellationorfurtherdelay.
Whateverthedecision,thestorylineof
unfetteredgrowthattachedtoKeystone
andothertarsandsprojectshasbeen
permanentlyaltered.Growingpublic
sentimenttofindalternativestofossil
fuelswilldrivemuchofthedialogue.
Futureinstitutionaldecisionsbethey:
internationalagreementsonclimate
change,shiftsofcapitalallocation,change
inlaworregulation,and/oradoptionof
newparadigmsbyelectedleadersand
1 Cattaneao,C.“TransCanadaineyeofthestorm.”The Financial Post.September8,2011.http://business.financialpost.com/2011/09/08/transcanada-in-eye-of-the-storm/?__lsa=bf5b-4bd4
2Droitsch,D.“NewpollonKeystoneXLtarsandspipelineindicatinggrowingopposition,waningsupport.The Energy Collective.January30,2014.http://theenergycollective.com/danielle-droitsch/334201/new-poll-keystone-xl-tar-sands-pipeline-indicating-growing-opposition-pipel
3“Here’swhatCanadiansthingoftheoilsandsindustry.”National Post.October30,2013.http://business.financialpost.com/2013/10/30/heres-what-canadians-think-about-the-oil-sands-industry/?__lsa=21a3-b64e
4“SupportforKeystoneXLpipelineonthedecline:Nanos.”CBC News.January16,2014.http://www.cbc.ca/news/politics/support-for-keystone-xl-pipeline-on-the-decline-nanos-1.2498835

7
thepublicaremovingtowardeconomic
modelsthatcombineprofitabilitywith
protectionofpublichealth,climate,and
theenvironment.
Thesefactorsarematerialriskstothe
currentalignmentofcapitalinvestment
andprojectdevelopment.Thispaper
assertsthattherisks,typicallyunderstood
aspoliticalrisks,areknown,permanent,
predictablewithinreasonablestandards
ofprobability,shapethebehavior
ofinvestmentstakeholdersand,are
ultimatelyquantifiable.
LESSONS IN THE PUBLIC ACCOUNTABILITY RISK FACTOR FROM U.S. COAL EXPERIENCEOneoftheclearestareaswherepopular
mobilizationhasdemonstratedsignificant
impactoninvestmentdecisionmaking
relatestocoalplantinvestmentsinthe
UnitedStates.In2007theUnitedStates
plannedfor150newcoalplantstoreplace
oldonesthatwereagingout.5Fromits
inceptionthenewplanranintofinancial
headwindsandpublicoppositionledby
theSierraClub.By2010itwasclearthat
mostofthecoalplantswerenotgoingto
bebuilt.
DanielYergin,theprominentoilindustry
consultant,emphasizesthatenergy
marketsaredriventoalargeextentbya
complexnexusbetweencapitalmarkets,
governmentsupport,andpolitical
interests.AccordingtoYergin,public
campaigningagainstcoalwasaprimary
driverinchallengingtheplansofthis
politicallyprotectedenergysourceinthe
U.S.intofinanciallytoxicandunbuildable
unprofitableprojects:
In2011about25coalfiredplantswere
underconstructionintheUnitedStates.
Butpoliticalandregulatoryopposition
tocoalongroundsofglobalwarming
hasmountedtoalevelthatmakesit
difficulttolaunchnewconventional
coalplants.6
Newcoalplantproposalsoriginallyhad
thebackingofelectedofficials,investment
banks,utilitycompanies,andpublic
servicecommissionsandenvironmental
regulators.Inmanycasesinvestment
wassunkandpermitsacquiredbefore
proposalsweredropped.Investorsandan
increasinglistofotherstakeholdersfound
themountingrisksofchangingmarket
conditions,increasedregulation7andanti-
coalcampaignstoonumeroustomanage.
Thecanceledplantsinvolvedanestimated
$273billioninnewcapitalinvestment
andtheterminationofsupportfornew
plantsbykeyenergystakeholdersacross
thenation.8
Mostofthesecoalplantcancellations
occurreddespiteutilityandcoal
industryeffortstohavethemapproved.
Acombinationofchallengingmarket
conditionsandpublicaccountability
advocacyovershadowedindustryefforts
toexpandcoalfiredgenerationinthe
UnitedStates.9,10Thecumulativeimpact
oftheseriskshaseffectivelymadenew
coalplantsunbankable.11
Withoutachievinganynoteworthypublic
policygoalduringthatperiod(infact
federalclimatelegislationwasdefeated),
theclimatemovementsuccessfully
initiatedactionsthatdirectlyandindirectly
contributedtoashiftinperceptionthat
newcoalplantswerenotprofitableand
drovethecancellationthesenewenergy
investments.Climateactivistsaretoday
engagedinasimilarefforttoshiftthe
perceptionofinevitability,whichcontinues
tosurroundtarsandsdevelopment.
WhattheU.S.coalplantexperience
suggestsisthatintheabsenceofan
internationalornationalresponsetothe
challengeofenergyandclimate,local
leadersandinvestorssteppedintofill
thepolicyvoidandadoptedstrategies
thatledtothedefeatofsignificantnew
levelsofcoalfiredgeneration.Theblunt,
frankmessageofthisuniformrejectionof
newcoalplantstopolicymakersandthe
capitalmarketswas:FindAnotherWay.
Theimpactoftheseadvocacyefforts
highlightedtodecisionmakerstheclimate
andenvironmentalcostsandincreasingly
broughttobearfinancialperspectives
thatshowedaweakeconomicoutlookfor
coal.Inasignificantnumberofinstances
itisapparentthatcoalandutilityinterests
wouldhavebuilthighlyriskycoalplantsif
notfortheadvocacychallenges.12Inthe
broadersensetheindustry’s183failed
coalplants13createditsownstorylineofa
downwardspiral–astorylinethatwould
hindertheirfutureefforts.
5 NationalEnergyTechnologyLaboratory(NETL).Trackingnewcoal-firedpowerplants,coal’sresurgenceinelectricpowergeneration.2007.6 Yergin,D.TheQuest:Energy,securityandtheremakingofthemodernworld.NewYork:PenguinBooks,2011.7 Barradale,MerrillJones,“TheLogicofCarbonRisk:APractitioners’PerspectiveonInvestmentUnderUncertainClimatePolicy.”June21,2013.USAEEWorkingPaperNo.09-037.
http://ssrn.com/abstract=1529471orhttp://dx.doi.org/10.2139/ssrn.15294718 NationalEnergyTechnologyLaboratory(NETL).Tracking new coal-fired power plants, coal’s resurgence in electric power generation.2007.NETL’splanwouldhavecreated90GW
ofelectricityandcostapproximately$145billion.Forthepurposesofthispaper,thecostofconstructionisassumedtobefora600MWcoalplantatacostof$2500kw.Thefullcostfortheoriginalportfolioof150newplantsisestimatedat$225billion.The183plantswouldconservativelybevaluedat$273billion.Notallplantsweresponsoredbyinvestorownedutilities.Someweresponsoredbypublicpowerauthorities,othersbyruralelectriccooperatives–allrequireaccesstocapitalmarketswherereturnoninvestmentsiscalculatedagainstrisk.
9 Hertsgaard,Mark.“HowaGrassrootsRebellionWontheNation’sBiggestClimateVictory.”.Mother Jones,April2,2012.http://www.motherjones.com/environment/2012/04/beyond-coal-plant-activism
10Ward,Beth.“Onlackofcoalbuild-up,envirostoutwins,industrylistsseveralfactors,”Platts Coal Outlook.April18,2011.11 EdisonElectricInstituteFinancial Review (of Investor Owned Utilities), Construction,2013.p.49.12 Sanzillo,Tom.“Power4GeorgiansPlantWashington:TooHighaPriceforConsumers.”TR Rose Associates,2011.pg.41-43.13 Inadditiontothe150originalplantsothercoalplantproposalswerealsoannouncedandcanceled.AccordingtotheSierraClubasofSeptember14.2014,183newcoalplantproposals
havebeendefeated.http://content.sierraclub.org/coal/environmentallaw/plant-tracker
8
ThedebateovertheKeystoneXLpipeline
hasbroughtincreasedinterestinthetar
sandsindustryandthecompaniesinvolved
withit.ThedelaysonKeystone,andother
tarsandsprojectsarearesponsetopublic
demandsforgreateraccountabilityand
marketforcesnowcallingforasecond
lookatCanada’saggressiveplansfor
expandedsupplyandshipmentoftar
sandsproducts.
Thissectionofthepaperidentifies
financialbenchmarksandriskstoindustry
anddemonstrateshowdeteriorating
corporateandprojectfinanceis
diminishingthelikelihoodthatCanadian
tarsandsproducer’splansforexpansion
willmaterialize.
GrantUkrainetzoftheKoreanstate-
ownedoilcompany,summarizedthe
marketperceptionoftarsandsproduction
inOctober,2013:
Capital cost pressures in the oil sands
have tripled, operating costs in the oil
sands at least doubled, we had a change
in the oil sands royalty regime, we had
greater environmental regulations,
costs of compliance have increased,
we had continued delays in pipelines
that allow us to move products out to
maximize revenue, (there is) negative
public sentiment toward the oil sands,
plus you have the emergence of other
opportunities in the U.S. and elsewhere.14
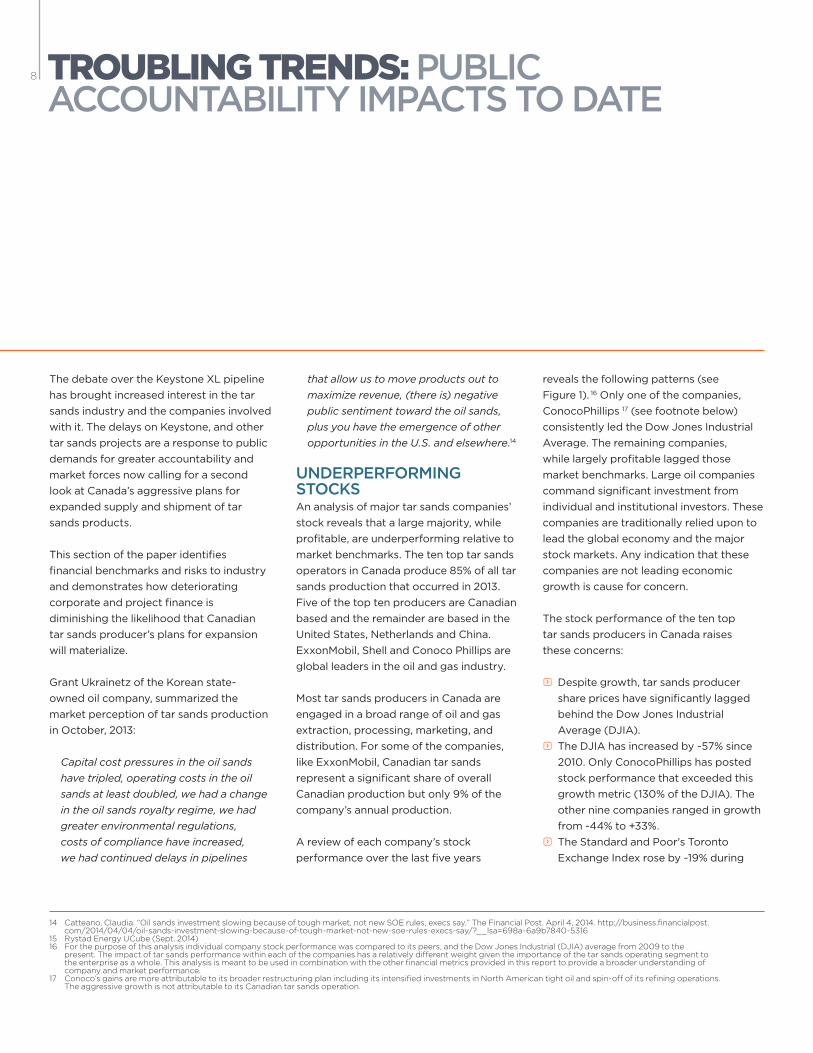
UNDERPERFORMING STOCKS Ananalysisofmajortarsandscompanies’
stockrevealsthatalargemajority,while
profitable,areunderperformingrelativeto
marketbenchmarks.Thetentoptarsands
operatorsinCanadaproduce85%ofalltar
sandsproductionthatoccurredin2013.
FiveofthetoptenproducersareCanadian
basedandtheremainderarebasedinthe
UnitedStates,NetherlandsandChina.
ExxonMobil,ShellandConocoPhillipsare
globalleadersintheoilandgasindustry.
MosttarsandsproducersinCanadaare
engagedinabroadrangeofoilandgas
extraction,processing,marketing,and
distribution.Forsomeofthecompanies,
likeExxonMobil,Canadiantarsands
representasignificantshareofoverall
Canadianproductionbutonly9%ofthe
company’sannualproduction.
Areviewofeachcompany’sstock
performanceoverthelastfiveyears
revealsthefollowingpatterns(see
Figure1).16Onlyoneofthecompanies,
ConocoPhillips17(seefootnotebelow)
consistentlyledtheDowJonesIndustrial
Average.Theremainingcompanies,
whilelargelyprofitablelaggedthose
marketbenchmarks.Largeoilcompanies
commandsignificantinvestmentfrom
individualandinstitutionalinvestors.These
companiesaretraditionallyrelieduponto
leadtheglobaleconomyandthemajor
stockmarkets.Anyindicationthatthese
companiesarenotleadingeconomic
growthiscauseforconcern.
Thestockperformanceofthetentop
tarsandsproducersinCanadaraises
theseconcerns:
f Despitegrowth,tarsandsproducer
sharepriceshavesignificantlylagged
behindtheDowJonesIndustrial
Average(DJIA).
f TheDJIAhasincreasedby~57%since
2010.OnlyConocoPhillipshasposted
stockperformancethatexceededthis
growthmetric(130%oftheDJIA).The
otherninecompaniesrangedingrowth
from-44%to+33%.
f TheStandardandPoor'sToronto
ExchangeIndexroseby~19%during
TROUBLING TRENDS: PUBLIC ACCOUNTABILITY IMPACTS TO DATE
14 Catteano,Claudia.“Oilsandsinvestmentslowingbecauseoftoughmarket,notnewSOErules,execssay.”TheFinancialPost.April4,2014.http://business.financialpost.com/2014/04/04/oil-sands-investment-slowing-because-of-tough-market-not-new-soe-rules-execs-say/?__lsa=698a-6a9b7840-5316
15 RystadEnergyUCube(Sept.2014)16 Forthepurposeofthisanalysisindividualcompanystockperformancewascomparedtoitspeers,andtheDowJonesIndustrial(DJIA)averagefrom2009tothe
present.Theimpactoftarsandsperformancewithineachofthecompanieshasarelativelydifferentweightgiventheimportanceofthetarsandsoperatingsegmenttotheenterpriseasawhole.Thisanalysisismeanttobeusedincombinationwiththeotherfinancialmetricsprovidedinthisreporttoprovideabroaderunderstandingofcompanyandmarketperformance.
17 Conoco’sgainsaremoreattributabletoitsbroaderrestructuringplanincludingitsintensifiedinvestmentsinNorthAmericantightoilandspin-offofitsrefiningoperations.TheaggressivegrowthisnotattributabletoitsCanadiantarsandsoperation.

9Company Country 2013 Production (thousands bb/day)
Suncor Canada 398
Canadian Natural Resources Canada 196
ExxonMobil U.S.A. 172
Shell Netherlands 145
ConocoPhillips U.S.A. 115
Cenovus Energy Canada 103
Canadian Oil sands Canada 98
Imperial Oil Canada 71
Devon Energy U.S.A. 57
CNOOC China 49
Top 10 2013 Production 1,403
Total 2013 Production (All) 1,656
Top Ten Percentage of Total 85
Table 1. Top 10 Tar Sands Producers in Canada15
Dow Jones Indust. Suncor Can. Nat Res. Can. Oil Sands Cenovus Imperial
-60
-40
-20
0
20
40
60
80
Jan-
10
Mar
-10
May
-10
Jul-1
0
Sep-10
Nov
-10
Jan-
11
Mar
-11
May
-11
Jul-1
1
Sep-11
Nov
-11
Jan-
12
Mar
-12
May
-12
Jul-1
2
Sep-12
Nov
-12
Jan-
13
Mar
-13
May
-13
Jul-1
3
Sep-13
Nov
-13
Jan-
14
Mar
-14
May
-14
Jul-1
4
Sep-14
Source:Companyfinancials,IEEFA
Figure 1: Stock Performance of Top 5 Tar Sands Companies between 2010 and 2014 Relative to the Dow Jones Industrial Average
10
thissameperiod.OfthefiveCanadian
basedcompaniesonlyImperialOil
surpassedthisIndex.
f IfConocoPhillipsisremovedfromthe
equation,theaverageofthetopnine
producersgrewbyonly~7%duringthe
period2010-2014,comparedtothe
DJIAat~57%.
f Suncor,Canada’sleadingtarsands
producergrewby~2.4%--just4%of
thegrowthleveloftheDJIAand12%
oftheTorontoIndex.
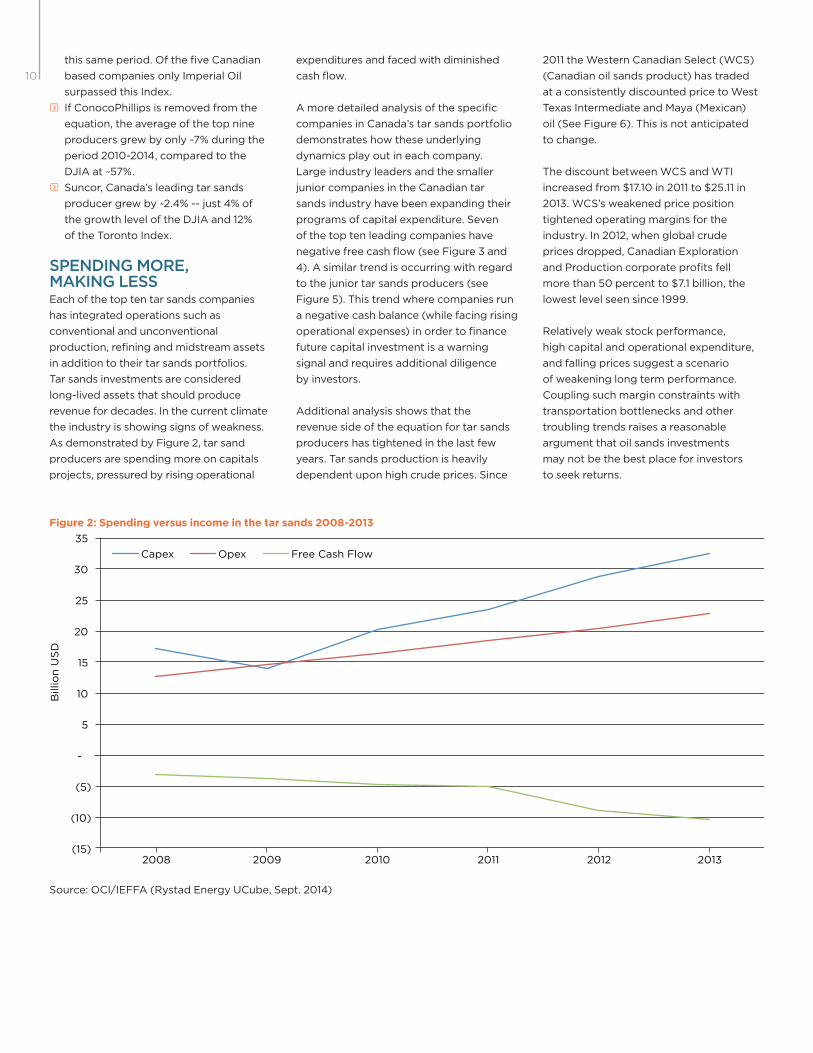
SPENDING MORE, MAKING LESS Eachofthetoptentarsandscompanies
hasintegratedoperationssuchas
conventionalandunconventional
production,refiningandmidstreamassets
inadditiontotheirtarsandsportfolios.
Tarsandsinvestmentsareconsidered
long-livedassetsthatshouldproduce
revenuefordecades.Inthecurrentclimate
theindustryisshowingsignsofweakness.
AsdemonstratedbyFigure2,tarsand
producersarespendingmoreoncapitals
projects,pressuredbyrisingoperational
expendituresandfacedwithdiminished
cashflow.
Amoredetailedanalysisofthespecific
companiesinCanada’starsandsportfolio
demonstrateshowtheseunderlying
dynamicsplayoutineachcompany.
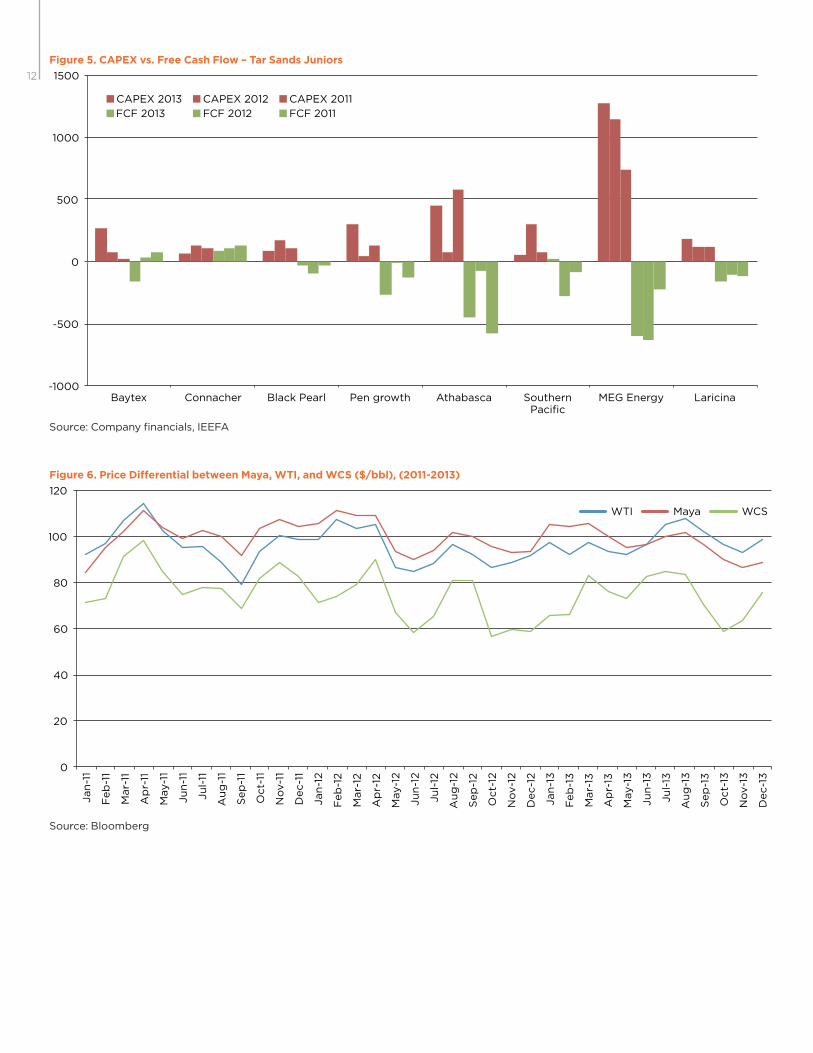
Largeindustryleadersandthesmaller
juniorcompaniesintheCanadiantar
sandsindustryhavebeenexpandingtheir
programsofcapitalexpenditure.Seven
ofthetoptenleadingcompanieshave
negativefreecashflow(seeFigure3and
4).Asimilartrendisoccurringwithregard
tothejuniortarsandsproducers(see
Figure5).Thistrendwherecompaniesrun
anegativecashbalance(whilefacingrising
operationalexpenses)inordertofinance
futurecapitalinvestmentisawarning
signalandrequiresadditionaldiligence
byinvestors.
Additionalanalysisshowsthatthe
revenuesideoftheequationfortarsands
producershastightenedinthelastfew
years.Tarsandsproductionisheavily
dependentuponhighcrudeprices.Since
2011theWesternCanadianSelect(WCS)
(Canadianoilsandsproduct)hastraded
ataconsistentlydiscountedpricetoWest
TexasIntermediateandMaya(Mexican)
oil(SeeFigure6).Thisisnotanticipated
tochange.
ThediscountbetweenWCSandWTI
increasedfrom$17.10in2011to$25.11in
2013.WCS’sweakenedpriceposition
tightenedoperatingmarginsforthe
industry.In2012,whenglobalcrude
pricesdropped,CanadianExploration
andProductioncorporateprofitsfell
morethan50percentto$7.1billion,the
lowestlevelseensince1999.
Relativelyweakstockperformance,
highcapitalandoperationalexpenditure,
andfallingpricessuggestascenario
ofweakeninglongtermperformance.
Couplingsuchmarginconstraintswith
transportationbottlenecksandother
troublingtrendsraisesareasonable
argumentthatoilsandsinvestments
maynotbethebestplaceforinvestors
toseekreturns.
Figure 2: Spending versus income in the tar sands 2008-2013
(15)
(10)
(5)
-
5
10
15
20
25
30
35
Bill
ion
US
D
2008 2009 2010 2011 2012 2013
Capex Opex Free Cash Flow
Source:OCI/IEFFA(RystadEnergyUCube,Sept.2014)

11
-6000
-4000
-2000
0
2000
4000
6000
8000
10000
12000
14000
16000
Suncor CanadianNat. Res.
Shell ExxonMobil
CanadianOil Sands
ConocoPhillips
Cenovus Imperial CNOOC Devon
Revenues 2013 FCF 2013
Source:Companyfinancials,IEEFA
Figure 3. Tar Sands Revenues vs. Free Cash Flow 2013
Figure 4. Tar Sands CAPEX vs. Free Cash Flow
Source:Companyfinancials,IEEFA
Suncor CNRL Can. Oil Sands
Cenovus Imperial Devon ExxonMobil Conoco Phillips
Shell CNOOC
CAPEX 2013 CAPEX 2012 CAPEX 2011
FCF 2013 FCF 2012 FCF 2011
-6000
-4000
-2000
0
2000
4000
6000
12
Figure 5. CAPEX vs. Free Cash Flow – Tar Sands Juniors
Source:Companyfinancials,IEEFA
CAPEX 2013 CAPEX 2012 CAPEX 2011
FCF 2013 FCF 2012 FCF 2011
-1000
-500
0
500
1000
1500
Baytex Connacher Black Pearl Pen growth Athabasca Southern Pacific
MEG Energy Laricina
Figure 6. Price Differential between Maya, WTI, and WCS ($/bbl), (2011-2013)
Source:Bloomberg
WTI Maya WCS
0
20
40
60
80
100
120
Jan
-11
Feb
-11
Mar-
11
Ap
r-11
May-1
1
Ju
n-1
1
Ju
l-11
Au
g-1
1
Sep
-11
Oct-
11
No
v-1
1
Dec-1
1
Jan
-12
Feb
-12
Mar-
12
Ap
r-12
May-1
2
Ju
n-1
2
Ju
l-12
Au
g-1
2
Sep
-12
Oct-
12
No
v-1
2
Dec-1
2
Jan
-13
Feb
-13
Mar-
13
Ap
r-13
May-1
3
Ju
n-1
3
Ju
l-13
Au
g-1
3
Sep
-13
Oct-
13
No
v-1
3
Dec-1
3
13
ADDITIONAL IMPEDIMENTS AND RISKSThefinancialperformanceoftarsands
companiesinthecurrentmarketraises
concernsaswell.Theforwardlooking
riskscenariocontainslogistical,financial,
economic,andpoliticalrisks.Taken
individuallyandcumulativelytherisks
suggestthatthecurrentsoftnessin
companyprofitabilityislikelytocontinue.
TarsandsCAPEXspendingisclearly
facingchangingconditions.
TransportationbyrailTransportationbottlenecksdrivenby
marketforcesandpipelinecampaigns
havehadsignificantmaterialcostsfor
theindustry.Asaresult,somecompanies
areplacinggreateremphasisonrail
transport.Railaddsconsiderablytothe
overallcostforbitumen,acommoditythat
alreadytradesatadiscountedpricedue
tolowerquality.Thereisgrowingconcern
withinindustrycirclesthattransportation
bottleneckswillnotresolvethemselves.
In2014,Deloittestates:
Falling Oil Price
Since July of 2014, the price of all crude oils has been dropping
quite sharply. The U.S. oil boom together with a slowing in
global oil demand growth has fueled a glut in global supply,
which has resulted in a sharp drop in prices. In October of 2014
the price of Western Canada Select was in the mid $70 range,
a level that if maintained would present serious problems for
many tar sands producers. Investment analysts at Raymond
James wrote the following to clients in early October:
“If there is one segment of the Canadian oil sector that we
believe has most felt the squeeze in recent months it is likely
oil sands producers. Not only are falling oil prices weighing on
one of the higher costs of oil supply globally, but we believe
producers are beginning to feel the effects of meaningful cost
inflation in the region once again.”18
And the Financial Times noted:
“…a drop in revenues amid weaker margins would add to
pressure on oil companies that have already been battling
higher costs and a drop in capital expenditure may impact future
growth. Other various deepwater, arctic, international shale and
tar sands projects could also be sidelined.”19
Depressed oil prices harm company balance sheets in the short
term. The persistence of low oil prices sends a market signal that
further capex investment is less profitable and requires constant
reevaluation. In a period of tight revenue and margins oil
companies are more likely to drop marginal, high cost projects.
Further delays and cancellations of tar sands projects is a likely
outcome of these new market realities.
“It’s also still possible that outstanding
transportation projects like the Keystone
XL and Northern Gateway pipelines will
never break ground. Indeed, the majority
of a group of industry experts we
surveyed in mid-2013 expect that neither
pipeline will be built.”21
Transportofbitumenbyrailalsofaces
ahostofrisksaspreparationcostsfor
transportarecomplicated.Weather,
routecongestionandsafetyregulations
alsocreateadditionalriskfactors
(SeeBox:WhyRailisNottheAnswer
forTransportingTarSands).22
“The oil sands are probably the one challenging (sector)... There are a couple of headwinds against that business overall. The first is really global perception … it’s not viewed as a favorable investment in lots of places.”Dan Barclay, head of BMO Capital Markets
18 RaymondJamesCanadaResearchCanadianEnergyMidweek:A Story Of Divergence Within A Broader Theme Of Fear October8,201419 http://www.ft.com/intl/cms/s/0/691032d4-5053-11e4-9822-00144feab7de.html#axzz3G2H9DSM820 Hussain,Y.“Foreigninvestors‘scaredoff’fromtheoilsands,M&Aexpertsays.”The Financial Post,2014.http://business.financialpost.com/2014/06/24/foreign-investors-
scared-off-from-the-oil-sands-ma-expert-says/?__lsa=ae6b-849221 Deloitte.Gaining ground in the sands 2014: Five rites of passage for an industry in pursuit of operational maturity.p.5.http://www2.deloitte.com/content/dam/Deloitte/ca/
Documents/international-business/ca-en-ib-gaining-ground-in-the-sands-2014.pdf22 Stockman,L.,Wrong side of the tracks: why rail is not the answer to the tar sands market access problem.OilChangeInternational,2014.http://priceofoil.org/content/
uploads/2014/09/OCI-Wrong-Side-of-the-Tracks_Final.pdf

14
LegalaccesstotheresourceandtransportationroutesCanadianFirstNationshaveaunique
setofconstitutionallyrecognizedlegal
rightsthathaveimportantimplications
forgovernmentsinrelationtotarsands
andtarsandsinfrastructuredevelopment.
Thisincludesrightsthatcanconstrain
accesstoboththeresourceitselfaswellas
transportationroutes.
Recently,asanexample,FirstNations
inCanadafilednofewerthanninelegal
challengestothefederalgovernment’s
decisiontoapprovetheNorthernGateway
pipelineproject.25FirstNationclaims
relatedtotheEnbridgeNorthernGateway
pipelinehavecreatedsufficientheadwinds
tothepointwhereitiswidelyregarded
asbeingunbuildable.26Inadditionto
this,theCanadianGovernmentisfacing
variousconstitutionalchallengesfromFirst
Nationsandcivilsocietyorganizations
relatedtotarsandsandinfrastructure
expansionandrestrictivelegislative
changestothepublichearingprocess.
FirstNationsarealsomountinglegal
challengestotarsandsdevelopmentand
expansionontraditionalterritory.For
example,theAthabascaChipewyanFirst
Nation,whosetraditionalterritoryisrichin
tarsandsdeposits,are,“activelyengaged
inamulti-pronglegalstrategytochallenge
publicpolicy,individualtarsandsprojects
andinadequateenvironmentalprotection
inAlberta’sAthabascatarsandsregion.”27
Theabovearejustafewexamplesof
variousFirstNationsleadlegalinitiatives
inCanada.IntheUnitedStates,Nebraskan
landownershavesuccessfullyasserted
landrightsclaimsinthefaceofthe
KeystoneXLpipeline.28,29
Why Rail is Not the Answer for Transporting Tar Sands23
Tar sands proponents claim that blocking pipelines will
not impact production because the bitumen can go by rail
instead. However, the idea that rail can profitably deliver the
roughly 4 million bpd capacity of currently proposed pipelines
is uncertain at best. Rail is beset with capacity limitations,
financial uncertainty, and political opposition.
Industry officials are also concerned that the promise of rail
as a pipeline alternative is overstated. When Steve Hanlon,
President and CEO of Gibson Energy Inc., a company that
operates a number of crude-by-rail terminals including one that
loads tar sands bitumen in Alberta, said, “Crude by rail is not a
panacea. It’s not going to replace pipe,” he was right.
In fact shipping bitumen to the Gulf Coast by rail has been
losing money for much of 2014 and only shipments tied to
long-term contracts have made the 3,000 mile journey. In the
first five months of 2014, only about 45,000 bpd arrived at the
Gulf Coast by rail. This is less than six percent of the capacity
of the proposed Keystone XL pipeline. While another 80,000
bpd went to other parts of the U.S. by rail, the industry needs
a profitable multi-million barrel per day pathway to coastal
markets and rail simply is not it.
A combination of high costs and poor returns is working
against bitumen-by-rail being much more than a niche activity.
These are summarized as follows:
Gulf Coast crude oil prices are being suppressed by the flood
of crude from fracked oil fields across America. Prices for tar
sands crude on the Gulf Coast do not cover the additional cost
of shipping dilbit 3,000 miles by rail.
Rail is an above ground mode of transport that is vulnerable to
weather and other unpredictable delays. Tar sands producers
must compete for access to capacity with oil producers in
North Dakota as well as shippers of commodities such as grain,
coal and manufactured and imported goods. Unlike pipelines,
price and service is not locked into decade long contracts
and is vulnerable to inflation and disruption. In addition rail
congestion in the United States is already having a negative
impact on coal producers.24
Large-scale terminals need to be built to handle the quantity
of crude and load multiple unit trains per day.
Transporting raw bitumen can save producers the cost of
shipping the diluent required for pipeline transport. However,
no unit train terminal currently possess the equipment to load
large volumes of raw bitumen.
The reduced profitability of shipping bitumen by rail means
that tar sands producers are less able to grow their production
capacity because they cannot profitably deliver bitumen to
distant markets.
While the transport of tar sands bitumen by rail may grow to
accommodate near-term production growth plans, weaknesses
in investment scenarios and rail capacity suggest U.S. rail
networks are insufficiently positioned to absorb 4 million bpd
of new oil sands product.
23 Formoredetailsandallreferences,pleaseseeStockman,L.Wrong side of the tracks: why rail is not the answer to the tar sands market access problem.OilChangeInternational,2014.http://priceofoil.org/content/uploads/2014/09/OCI-Wrong-Side-of-the-Tracks_Final.pdf,
24 Cox,CharlotteandDarrenEpps,“PRBcoaldeliveriestoupperMidwesthitagaininQ2asrailissuespersist.”SNL.September9,2014.25 Lanelaa,M.“NorthernGatewaypipeline:FirstNationsoutlineconstitutionalchallenges.”TheCanadianBroadcastingCorporation,2014.http://www.cbc.ca/m/touch/news/
story/1.270637626 Moore,D.“Despitefederalapproval,NorthernGatewayfaceslegalandpoliticalhurdles.”TheCanadianPress,2014.http://www.theprovince.com/business/waits+federal+decision+N
orthern+Gateway+pipeline+proposal/9947153/story.html27 AthabascaChipewyanFirstNations.HonourtheTreaties.http://www.honourtheacfn.ca/28 Stueck,W.“B.C.FirstNationschallengeNorthernGatewaypipelineinnewcourtaction.”TheGlobeandMail,2014.http://www.theglobeandmail.com/news/british-columbia/first-
nations-challenge-northern-gateway-pipeline-in-new-court-action/article19608617/29 “NebraskajudgeblocksKeystoneXLroute.”AlJazeeraAmerica.February19,2014.http://america.aljazeera.com/articles/2014/2/19/nebraska-law-thatallowedkeystonexlstruckdown.
html
15
CanadianactiononforeignownershipIn2012,theCanadiangovernment
introducednewforeignownership
regulationsregardinginvestmentin
Canadianoilresources.Thelaws,designed
toprotectCanadafromforeigninfluence
hadtheimpactofrestrictingcapital
investmentintothecountryatatime
whencompanieswerelookingtoexpand
investmentinoilsands.
Thischangeandthehostofotherissues
createaworrisomeinvestmentclimate.
WilliamQuinn,headofmergerand
acquisitionsatTDSecuritiesstated,“Five
yearsago,theoilsandshadthegreatest
scopefornon-Canadianinvestmentsin
Canada.That’schangeddramatically.”30
Quinnwasprimarilyreferringtothenew
regulatoryframeworkthatwasputin
placein2012toprotectCanadianassets
fromforeignownership.Eachtransaction
involvingforeigncapitalisvettedbythe
governmenttoassurethatCanadian
interestsareprotected.Consequently,
capitalexpenditureisprovingexceedingly
challengingparticularlyforthejuniorsas
theyhavelessabilitytoaccessthecapital
marketsthandotheirlargerpeers.31The
newCanadianprotectionistlegislation
driedupcapitalalmostimmediately
forthissegment.Giventhattarsands
productionisverycapitalintensive,a
readyaccesstolargesumsofmoneyis
needed.Canadiancapitalmarketsare
simplynotlargeenoughtofundsuch
production.Someforeigncapitalis
necessarytoexploittheseassetsmaking
thisathornyissueforgovernmentofficials.
Thejuniorpartofthetarsandsindustryin
Canadaproduceslessthan25percentof
totalannualproduction.Therearehowever
severaldozencompaniesinthebusiness.
Astructuralweaknessforasignificant
segmentoftheindustryonlyunderscores
theexpectationthatplannedproduction
willbeslowtomarket.Persistentmarket
accessproblemsincreasesthepotential
foramarketshakeoutwithmergers,
buyouts,bankruptciesandotherevents
thatsuggestalessthanrobustproduction
increase.
CostinflationThesinglegreatestfactorplacingupward
pressureonproductioncostsistheremote
locationofmostoftheproductionsites.
Remotelocationsplaceapremiumon
labor,steelandcementcostsonboththe
constructionandoperationsside.
Growingmarketuncertaintyinthetar
sandsisexacerbatedbycostinflation.32
JeffLyons,apartneratDeloitteCanada,
stated:
“Oil sands are economically challenging
in terms of returns...Cost escalation is
causing oil sands participants to rethink
the economics of projects. That’s why
you’re not seeing a lot of new capital
flowing into oil sands.”33
Costcurves,carbonriskandstrandedassetsTarsandsareconsideredhighcost,mega
projectsthatcouldconceivablyprovide
returnsfordecades.Thislongterm
investmentscenarioiscloudedbylong
termcostincreasesandcarbonrisk.The
InternationalEnergyAgencyestimates
thatcapitalcosts,inrealterms,havemore
thandoubledsince2000inoil,gas,and
coalextraction.34
Examiningacostcurveanalysisby
JPMorgan,35itbecomesapparentthat
thevarioustarsandsprojectsinAlberta
havehighbreakevencostsassociated
withthem.Forinstance,onlytwoprojects,
ChristinaLakeandFosterCreekhave
breakevencostsinthe$50-60/barrel
range.Theoverwhelmingmajorityoftar
sandprojectsfallinthebreakevenrangeof
$70-100/barrel.
RecentanalysisbytheCarbonTracker
Initiative(CTI)36confirmsthatthetarsands
arehometothehighestriskoilplaysin
theworld,withsomeprojectsrequiring
crudepricesashighas$150perbarrelto
breakeven.CTIstates,“Inordertosustain
shareholderreturns,companiesshould
focusonlow-costprojects,deferringor
cancellingprojectswithhighbreak-even
costs.”37
Moreandmoreanalystsareconcerned
aboutpotentialdowngradesbasedon
strandedassets.Shouldglobaltargetsbe
putintoplaceforGHGemissions,many
hydrocarbonassetscurrentlyonthe
booksofoilandgascompanieswillnotbe
burned.Thismakesthemstrandedassets.
Tarsandswouldmostlikelybeatthetop
ofthislistduetotheirinherentlyhighGHG
emissionprofile.Deloitteacknowledged
suchapossibilityinits2014reportontar
sandswhenitstated,“...someanalystsare
predictingcreditdowngradesasaresult
ofrisingcarbonconstraints.”38
InMarch,2013,Standard&Poor’s
suggestedthatrisingcarbonconstraints
wouldalterthecreditqualityofmany
smallercompanies..S&Ppredicted,
“adeteriorationinthefinancialriskprofiles
of[smaller]companiestoadegreethat
wouldpotentiallyleadtonegativeoutlook
revisionsandthendowngradesover
2014-2017.”39
CarbonTrackerInitiativehasidentified
1.2trillionUSDofglobaloilinvestment
thatwillbecomestrandedassetsif
governmentsacttotackleclimatechange
accordingtoatwodegreeCentigrade
commitment.Ofthis1.2trillion,over
40percentisconcentratedinthe
Albertatarsands.40
30 Haggett,S.“Canadaenergydealsreboundasshaleplaystrumpoilsandsininvestors’eyes.”Reuters,July2,2014.http://business.financialpost.com/2014/07/02/canada-energy-deals-rebound-as-shale-plays-trump-oil-sands/?__lsa=ae6b-8492
31 “Junioroilsandsproducersremainblockedfromaccesstoproject-makingequitymarkets,whilenearly1.5millionbarrelsperdayofcapacityhangsinthebalance,”Oil Sands Review,August,2014.
32 Gutscher,Cecile.“OilSanddreamevaporateswithbondholdersfacing40%loss.”Bloomberg News,August25,2014.http://business.financialpost.com/2014/08/25/oil-sands-dream-evaporates-with-bondholders-facing-40-loss/?__lsa=ae6b-8492
33 YadullahHussain“Cost-cuttingfevergripsoilsandsplayersaseconomicscalledintoquestion”The National Post,August22,2014http://business.financialpost.com/2014/08/22/fp-energy-aug-22-cost-cutting-fever/?__lsa=6b9e-9dfe
34 InternationalEnergyAgency.World energy investment outlook 2014 factsheet overview.2014.http://www.iea.org/media/140603_WEOinvestment_Factsheets.pdf35 CarbonTrackerInstitute,“CarbonSupplyCostCurves:Evaluatingfinancialrisksofoilcapitalexpenditures”,CTI,May2014,p.2136 CarbonTrackerInitiative.“Oil&gasmajors:FactSheets.”2014http://www.carbontracker.org/site/wp-content/uploads/2014/08/CTI_Oil_Gas_Majors_Company_Factsheets_
August_2014_FULL.pdf37 CarbonTrackerInitiative.“Oil&gasmajors:FactSheets.”2014http://www.carbontracker.org/site/wp-content/uploads/2014/08/CTI_Oil_Gas_Majors_Company_Factsheets_
August_2014_FULL.pdf38 Deloitte.Gaining ground in the sands 2014: Five rites of passage for an industry in pursuit of operational maturity.39 Standard&Poor’sRatingsServices.“WhatACarbon-ConstrainedFutureCouldMeanForOilCompanies’Creditworthiness.”March1,2013.40 CarbonTrackerInitiative.Carbon supply cost curves: Evaluating financial risk to oil capital expenditures.May2014.http://www.carbontracker.org/wp-content/uploads/2014/09/CTI-
Oil-Report-Oil-May-2014-13-05.pdf

16
Strandedassetsareofincreasingconcern
toinvestors,arecentinitiativesawover70
institutionalinvestorsrepresenting3trillion
USDinassetsrequest45companiesto
calculatetherisksofextractingso-called
unburnablecarbon.41Whilecompanies
areslowtorespondtoacknowledgethese
risks,thepressureisclearlygrowing.42
Themediumandlongterminstitutional
actionsthatcloudlongtermoiland
gasinvestmentscenariosstemfrom:
internationalagreementstorestrict
carbon,nationalgovernmentactions
respondingtoclimatechange,broad
privatesectorconsensustoshift
capitaltolowcarboninvestmentsand
continuedtargetingofcompanies,
lendinginstitutionsandgovernmentsby
demandingrestrictionsoncarbonuse.43
EnvironmentalandotherregulatoryrisksInadditiontoclimateandcarbon
law,increasedregulationrelatedto
environmentalandpublichealthprotection
aswellasenforcementrepresentadditional
constraintsonthefutureoftarsands
profitabilitygoingforward.Although
Canadianlawandenforcementhas
historicallysoughttoprovidealowcost
environmentforinvestment,heightened
scrutinyandpressurestemmingfrom
increasedpublicawarenessfornew
lawsandenforcementofexistinglaws
isgrowing.Somenotableareaswhere
increasedregulations,stringency,and
enforcementshouldbeexpectedare:
fWateruseandadversewaterquality
impacts;44
fLanduseandminingreclamation;45
fLackofcompliancewithlocalair
pollutionstandards,particularlyfor
sulfurdioxide,nitrogendioxideand
particulates;46
fHumanhealthimpactsfromtarsands
chemicalsleakingfromtailingslakes,as
wellasairbornechemicals;47
fLackofcompliancewithtailings
managementagreements;48,49
fIncreasedregulationandstringencyto
preventrailspillsandotheraccidents.50
Amorerobustandstringentregulatory
environmentwillalsoraisecostsand
reducetarsand’scompanies’profit
margins.
RISING COSTS AND CANCELLED PROJECTS Thehurdlestogrowthoutlinedinthe
abovesectionsarealteringtheoutlook
regardingfutureproduction.Recently
theCanadianAssociationofPetroleum
Producershasrevisitedits2030
productionforecast,downgradingits
tarsandsforecastfrom5.2millionbpd
by2030to4.8millionbpd.51Therevised
forecaststillassumesmediumterm
resolutionoftransportationbottlenecks,
butthedownwardforecastadjustment
fromCanada’sleadingoilandgastrade
associationandindustryadvocateisa
significantconcessiontomountingmarket
realities.Interestedreaderswillnotethat
thisrevisionwaspublishedonemonthprior
tothecurrentdeclineinoilprices.
Chineseoilcompaniesarealsoreviewing
theirinvestments.Manyoftheirprojects
havemetwithsignificantdelays,soaring
operationalexpenses,andweakreturns
–withexpertsconfirmingthatthereare
strongfeelingsof,“buyer’sremorse”
followingover$30billionininvestmentsin
recentyears.52Twomajorminingprojects
andoneinsituprojecthavebeencanceled
(formally“putonhold”)thisyearand
anothermajorminingprojectremains
unsanctionedamidskepticismthatitcan
bemadeviable.Dozensofotherplanned
tarsandsprojectshanginthebalance
asproducersstruggletocontainrising
costswhilewaitingtoseeiftransportation
constraintswilleverbesolved.
CapexisdeclininginthetarsandsInthecurrentmarketcontextCapital
Expenditure(Capex)inthetarsandsis
anindicatorofnotonlyinvestmentbut
alsoconfidenceinthefutureofthesector.
From2000Capexinthesectorgrew
steadilyuntil2006whenittailedoffand
thendippedsharplyduringthefirstfull
yearoftherecessionin2009.Since2010,
Capexhasgrownvigorouslyagain,partly
duetotheconfidenceinfutureproject
profitabilityandpartlyduetotherisingper
barrelcostofproduction.However,inthe
lastyeartherapidriseintarsandsCapex
ofrecentyearshasplateauedandbegun
todecline.
AccordingtotheAlbertaEnergyRegulator
(AER)oilsandscapitalexpenditurepeaked
in2012at$27.2billionCAD,decreasedto
$24.2billionCADin2013,andispredicted
todecreasefurtherto$23.7billionCAD
in2014.53
Recently,themarketpriceforoilhas
declinedtoalevelthatisbelowthe
breakevenpriceofmanyproposedtar
sandsprojects.TheAERreportedinMay
2014thattheaverageWTIoilpriceneeded
fortarsandscommercialityin2013wasup
$5perbarrelforin-situproductionandup
to$20perbarrelhigherforminingover
2012.54AccordingtotheAER,theWTI
pricenowneededforatarsandsmining
projecttoturnaprofitis$105/bbl.WTI
41 Douglass,Elizabeth.“Investorgrouppressescompanieson‘unburnablecarbon’.”Inside Climate News. October24,2013.http://www.bloomberg.com/news/2013-10-24/investor-group-presses-oil-companies-on-unburnable-carbon-.html
42 ThemostimportantdiscussioninthisareaisoccurringbetweenCarbonTrackerInitiativeandShellOil,See:http://s02.static-shell.com/content/dam/shell-new/local/corporate/corporate/downloads/pdf/investor/presentations/2014/sri-web-response-climate-change-may14.pdfandtheCarbonTrackerresponse:http://www.carbontracker.org/wp-content/uploads/2014/07/CTI_Shell_Response_Final_030714_Full2.pdf
43 Fenton,Cameron.“Howstudentsareleadingthefightagainstclimatechange.”The Huffington Post.March28,2013.http://www.huffingtonpost.ca/cameron-fenton/student-climate-change_b_2967164.html
44 EnvironmentalDefence.“Realitycheck:waterandthetarsands.”AccessedonOctober6,2014:http://environmentaldefence.ca/realitycheck45 OilSandsRealityCheck,Oil Sands Reality Check Website.AccessedonOctober6,2014:http://oilsandsrealitycheck.org/factcategory/land-species/46 EnvironmentalDefence.“Realitycheck:waterandthetarsands.”AccessedonOctober6,2014:http://environmentaldefence.ca/realitycheck47 Cotter,John.“EnvironmentalhealthrisksofAlbertaoilsandslikelyunderestimated:study.”The Globe and Mail,February3,2014.http://www.theglobeandmail.com/news/national/
environmental-health-risks-of-alberta-oilsands-probably-underestimated-study/article16667569/48 Cryderman,Kelly.“Oilsandsfirmswarnedontailingsponds.”The Globe and Mail,June12,2013.http://www.theglobeandmail.com/report-on-business/industry-news/energy-and-
resources/oil-sands-firms-warned-on-tailings-ponds/article12485574/49 McKinnon,Hannah.“Failingontailings–again.”Environmental Defence,February21,2014.http://environmentaldefence.ca/blog/failing-tailings-%E2%80%93-again50 Philips,Matthew.“Trainsthatgoboom.”Bloomberg Businessweek,February13,2014.http://www.businessweek.com/articles/2014-02-13/oil-train-explosions-u-dot-s-dot-regulators-
slow-to-react51 Howell,David.“CAPPtripsoilsandsproductionnumbersinlatestcrudeforecast.”Edmonton Journal,June9,2014.http://www.edmontonjournal.com/CAPP+trims+oilsands+producti
on+numbers+latest+crude+forecast/9922760/story.html52 Jones,Jeffrey.“ChinafacesbuyersremorseinCanada’soilpatch.”TheGlobeandMailAugust17,2014.http://www.bnn.ca/News/2014/8/17/China-faces-buyers-remorse-in-Canadas-
oil-patch.aspx53 http://www.aer.ca/documents/sts/ST98/ST98-2014.pdfp1-16AERforeseesaCapexrecoveryin2016,butthatisbasedonoptimismregardingtheresolutionofmarketaccessissues
andahigheroilprice.54 AlbertaEnergyRegulator.ST98-2014:Alberta’sEnergyReserves2013andSupply/DemandOutlook2014–2023.2014.Pg.3-26.http://www.aer.ca/documents/sts/ST98/ST98-2014.
17
hasbeenbelow$100/bblsinceAugust1,
2014andattimeofwriting(mid-October)
istradingat$85/bbl.Inthelast18months
WTIhasbeenover$105/bblforroughlya
monthtotal.
InlateJulyof2014,Suncor,thetoptar
sandsproducer,announcedanadditional
reductionof$1billioninplannedCapex
for2014.55SimilarlyCanadianOilSands
droppeditsfirsthalf2014capital
expenditureby$99millioncomparedwith
thefirsthalfof2013.56
Whilefallingoilpricesandrisksfor
increasedcostsonavarietyoffronts
clearlyplayarole,it’salsoclearthatdelays
insolvingthemarketaccessproblem–
completingpipelines–hascausedachillin
theinvestmentclimateinAlberta.InMayof
2014theCEOofURS,aconstructionand
engineeringfirmheavilyinvolvedinthetar
sandsnotedonanearningscallthat:
“In the first quarter, Oil & Gas revenues
were $758 million, a 6% decrease from
the same period last year. Uncertainty of
a takeaway capacity and the decision of
the -- uncertainty of the decision with the
Keystone XL pipeline is causing some of
our Canadian customers to delay capital
expenditure programs.”57
Themostconcretesignofthechangein
weatherfortarsandsproducersisthe
waveofprojectcancellationsthathasjust
started.
CancelledprojectsLackofmarketaccess,causedinlarge
partbypublicaccountabilityactions
drivenbypipelinecampaigns,hasplayeda
significantroleinthecancellationofthree
majortarsandsprojectsin2014alone-
Shell’sPierreRiver,Total’sJoslynNorth,
andStatoil’sCornerProject.
Twoofthesearelargetarsandsmines
thathavebeenplannedforyears-Royal
DutchShell’sPierreRiverMineandTotal
SA’sJoslynMine.Inaddition,oneof
Statoil’sinsituprojectswasalsocanceled
inSeptember.Thislastisofparticularnote
becauseofthegenerallymorefavorable
economicsenjoyedbyin-situprojects.
Whiletheindustryreferstoallthree
technicallyas“onhold”,wedonotforesee
marketconditionschangingtothedegree
necessarytorestartthesehugeprojects.
Inannouncingthecancellationofthe
CornerProject,aStatoilspokesman
notedthat:
“Costs for labour and materials have
continued to rise in recent years and are
working against the economics of new
projects. Market access issues also play
a role - including limited pipeline access
which weighs on prices for Alberta oil,
squeezing margins and making it difficult
for sustainable financial returns.”58
InFebruary2014,Shellannouncedthat
ithadwithdrawnitsongoingapplication
forapermitforthe200,000bpdPierre
RiverMine.Theproject’sapplicationhad
beeninprocesssincelate2007.Themine
wouldhavedisturbedover10,000hectares
andislocatedacrosstheAthabascaRiver
fromShell’songoingMuskegRiverand
Jackpineminingoperations.Chevronand
MarathonOilareminoritypartnersinall
threeprojects.
PierreRiverproductionwasestimated
topeakinthe2030sand40sataround
120,000bpdwithatotalofalmost1.5
billionbarrelsofbitumenproducedduring
itslifetime.59Producing,processingand
consumingthatbitumenwouldhavesent
anestimatedtotalof~900milliontonnesof
CO2intotheatmosphere.
55 http://www.suncor.com/en/newsroom/5441.aspx?id=186374056 http://www.marketwatch.com/story/canadian-oil-sands-announces-second-quarter-results-and-a-035-per-share-dividend-2014-07-31-16173531357 URSCEOMartinKoffelonQ12014Results-EarningsCallTranscript
May.13,2014http://seekingalpha.com/article/2216113-urss-urs-ceo-martin-koffel-on-q1-2014-results-earnings-call-transcript?page=258 http://www.statoil.com/en/NewsAndMedia/News/2014/Pages/25Sept_CornerPostponement.aspx59 RystadEnergy.UCube Database.(Sept.2014).60 Lewis,Jeff.“TotalSAsuspends$11BJoslynoilsandsmineinAlberta,laysoffupto150staff.”The National Post.May29,2014.http://business.financialpost.com/2014/05/29/total-sa-
suspends-11b-joslyn-oil-sands-mine-in-alberta-lays-off-up-to-150-staff/?__lsa=6798-9b3361 RystadEnergy.UCube Database.(Sept.2014).62 Tait,Carrie.“Totalshelves$11billionAlbertatarsandsmine.”The Globe and Mail.May29,2014.http://www.theglobeandmail.com/report-on-business/joslyn/article18914681/63 RystadEnergy.UCube Database.(Sept.2014).64 Lewis,Jeff.“SinopecmaybackawayfromNorthernLightstarsandslease:source.”The National Post,July9,2014.http://business.financialpost.com/2014/07/09/sinopec-may-back-
away-from-northern-lights-oil-sands-lease-source/?__lsa=6798-9b3365 SynencoEnergyInc.“NorthernLights,OilsandsMiningandExtractionProject:PublicDisclosureDocument,ProjectUpdate.”October2005.http://environment.alberta.ca/
documents/Synenco_Energy_Northern-Lights-Oil-Sands-Mine_PDD.pdf66 Lewis,Jeff.“SinopecmaybackawayfromNorthernLightstarsandslease:source.”The National Post,July9,2014.http://business.financialpost.com/2014/07/09/sinopec-may-back-
away-from-northern-lights-oil-sands-lease-source/?__lsa=6798-9b3367 RystadEnergy.UCube Database.(Sept.2014).NotethatRystadEnergymetricscategorizetheseprojectsasUncommercial.
InMay2014,Totalannouncedthatitwas
puttingtheCAD11billionJoslynMineon
indefinitehold.Theprojectwasapproved
bytheAlbertaregulatorin2011andwas
expectedtobeginproducing100,000bpd
in2020.60Totalwastheleadoperatorwith
partnersSuncor,OccidentalandInpex
Canada.OverUSD400millionhasbeen
spentontheminesofar.61AndreGoffart,
headofTotal’sCanadiandivisionstatedin
apressconferencethat:
“Joslyn is facing the same challenge
most of the industry world-wide [is],
in the sense that costs are continuing
to inflate when the oil price and
specifically the netbacks for the tar
sands are remaining stable at best –
squeezing the margins”.62
Theproject’sproductionwouldhave
peakedinthe2040sataround155,000
bpd.63By2100,theprojectcouldhave
producedover1.9billionbarrelsof
bitumen.Producing,processingand
consumingthatbitumenwouldhavesent
atotalof1.1billiontonnesofCO2intothe
atmosphere.
SinopecandTotal’sNorthernLightsproject
isanotherprojectatriskofcancellation.64
Themineboastsover1billionbarrelsof
recoverablebitumenandwasinitially
scheduledtostartoperationsin2010witha
capacityof100,000bpd.65Ananalysttold
Canada’sNationalPostinJuly2014that
Sinopec“ishavingtroublewithNorthern
Lightslikeeverybodyelse,”[…]“Youcan’t
throwmoneyintoablackholeforever.”66
Independentestimatesoftheproject
financesshowitfailstomeetprofitability
standards.67Projectviabilitycouldbe
enhancedifcostsdecreaseoralong-term
turnaroundinoilpricesoccurs.Thereis
nosignofeitherdevelopmentinthenear
future.
18
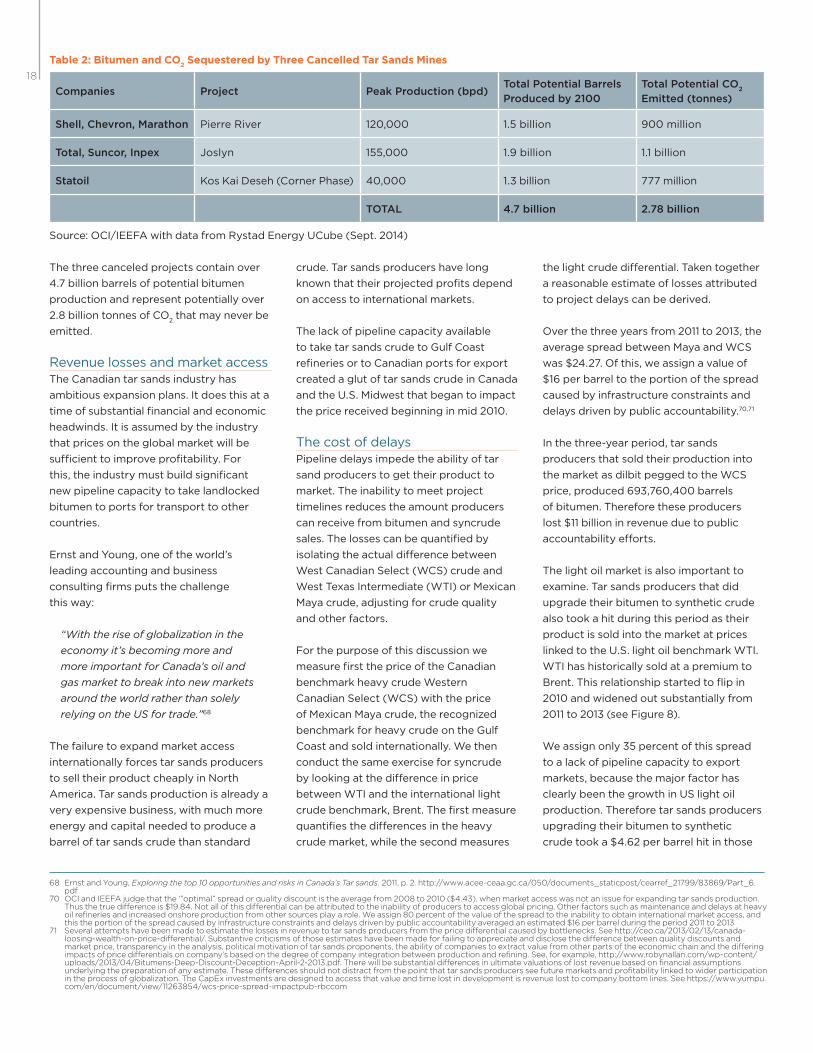
Thethreecanceledprojectscontainover
4.7billionbarrelsofpotentialbitumen
productionandrepresentpotentiallyover
2.8billiontonnesofCO2thatmayneverbe
emitted.
RevenuelossesandmarketaccessTheCanadiantarsandsindustryhas
ambitiousexpansionplans.Itdoesthisata
timeofsubstantialfinancialandeconomic
headwinds.Itisassumedbytheindustry
thatpricesontheglobalmarketwillbe
sufficienttoimproveprofitability.For
this,theindustrymustbuildsignificant
newpipelinecapacitytotakelandlocked
bitumentoportsfortransporttoother
countries.
ErnstandYoung,oneoftheworld’s
leadingaccountingandbusiness
consultingfirmsputsthechallenge
thisway:
“With the rise of globalization in the
economy it’s becoming more and
more important for Canada’s oil and
gas market to break into new markets
around the world rather than solely
relying on the US for trade.”68
Thefailuretoexpandmarketaccess
internationallyforcestarsandsproducers
toselltheirproductcheaplyinNorth
America.Tarsandsproductionisalreadya
veryexpensivebusiness,withmuchmore
energyandcapitalneededtoproducea
barreloftarsandscrudethanstandard
Companies Project Peak Production (bpd)Total Potential Barrels
Produced by 2100
Total Potential CO2
Emitted (tonnes)
Shell, Chevron, Marathon PierreRiver 120,000 1.5billion 900million
Total, Suncor, Inpex Joslyn 155,000 1.9billion 1.1billion
Statoil KosKaiDeseh(CornerPhase) 40,000 1.3billion 777million
TOTAL 4.7 billion 2.78 billion
crude.Tarsandsproducershavelong
knownthattheirprojectedprofitsdepend
onaccesstointernationalmarkets.
Thelackofpipelinecapacityavailable
totaketarsandscrudetoGulfCoast
refineriesortoCanadianportsforexport
createdaglutoftarsandscrudeinCanada
andtheU.S.Midwestthatbegantoimpact
thepricereceivedbeginninginmid2010.
ThecostofdelaysPipelinedelaysimpedetheabilityoftar
sandproducerstogettheirproductto
market.Theinabilitytomeetproject
timelinesreducestheamountproducers
canreceivefrombitumenandsyncrude
sales.Thelossescanbequantifiedby
isolatingtheactualdifferencebetween
WestCanadianSelect(WCS)crudeand
WestTexasIntermediate(WTI)orMexican
Mayacrude,adjustingforcrudequality
andotherfactors.
Forthepurposeofthisdiscussionwe
measurefirstthepriceoftheCanadian
benchmarkheavycrudeWestern
CanadianSelect(WCS)withtheprice
ofMexicanMayacrude,therecognized
benchmarkforheavycrudeontheGulf
Coastandsoldinternationally.Wethen
conductthesameexerciseforsyncrude
bylookingatthedifferenceinprice
betweenWTIandtheinternationallight
crudebenchmark,Brent.Thefirstmeasure
quantifiesthedifferencesintheheavy
crudemarket,whilethesecondmeasures
thelightcrudedifferential.Takentogether
areasonableestimateoflossesattributed
toprojectdelayscanbederived.
Overthethreeyearsfrom2011to2013,the
averagespreadbetweenMayaandWCS
was$24.27.Ofthis,weassignavalueof
$16perbarreltotheportionofthespread
causedbyinfrastructureconstraintsand
delaysdrivenbypublicaccountability.70,71
Inthethree-yearperiod,tarsands
producersthatsoldtheirproductioninto
themarketasdilbitpeggedtotheWCS
price,produced693,760,400barrels
ofbitumen.Thereforetheseproducers
lost$11billioninrevenueduetopublic
accountabilityefforts.
Thelightoilmarketisalsoimportantto
examine.Tarsandsproducersthatdid
upgradetheirbitumentosyntheticcrude
alsotookahitduringthisperiodastheir
productissoldintothemarketatprices
linkedtotheU.S.lightoilbenchmarkWTI.
WTIhashistoricallysoldatapremiumto
Brent.Thisrelationshipstartedtoflipin
2010andwidenedoutsubstantiallyfrom
2011to2013(seeFigure8).
Weassignonly35percentofthisspread
toalackofpipelinecapacitytoexport
markets,becausethemajorfactorhas
clearlybeenthegrowthinUSlightoil
production.Thereforetarsandsproducers
upgradingtheirbitumentosynthetic
crudetooka$4.62perbarrelhitinthose
Table 2: Bitumen and CO2 Sequestered by Three Cancelled Tar Sands Mines
Source:OCI/IEEFAwithdatafromRystadEnergyUCube(Sept.2014)
68 ErnstandYoung,Exploring the top 10 opportunities and risks in Canada’s Tar sands.2011,p.2.http://www.acee-ceaa.gc.ca/050/documents_staticpost/cearref_21799/83869/Part_6.pdf
70 OCIandIEEFAjudgethatthe‘”optimal”spreadorqualitydiscountistheaveragefrom2008to2010($4.43),whenmarketaccesswasnotanissueforexpandingtarsandsproduction.Thusthetruedifferenceis$19.84.Notallofthisdifferentialcanbeattributedtotheinabilityofproducerstoaccessglobalpricing.Otherfactorssuchasmaintenanceanddelaysatheavyoilrefineriesandincreasedonshoreproductionfromothersourcesplayarole.Weassign80percentofthevalueofthespreadtotheinabilitytoobtaininternationalmarketaccess,andthistheportionofthespreadcausedbyinfrastructureconstraintsanddelaysdrivenbypublicaccountabilityaveragedanestimated$16perbarrelduringtheperiod2011to2013
71 Severalattemptshavebeenmadetoestimatethelossesinrevenuetotarsandsproducersfromthepricedifferentialcausedbybottlenecks.Seehttp://ceo.ca/2013/02/13/canada-loosing-wealth-on-price-differential/.Substantivecriticismsofthoseestimateshavebeenmadeforfailingtoappreciateanddisclosethedifferencebetweenqualitydiscountsandmarketprice,transparencyintheanalysis,politicalmotivationoftarsandsproponents,theabilityofcompaniestoextractvaluefromotherpartsoftheeconomicchainandthedifferingimpactsofpricedifferentialsoncompany’sbasedonthedegreeofcompanyintegrationbetweenproductionandrefining.See,forexample,http://www.robynallan.com/wp-content/uploads/2013/04/Bitumens-Deep-Discount-Deception-April-2-2013.pdf.Therewillbesubstantialdifferencesinultimatevaluationsoflostrevenuebasedonfinancialassumptionsunderlyingthepreparationofanyestimate.Thesedifferencesshouldnotdistractfromthepointthattarsandsproducersseefuturemarketsandprofitabilitylinkedtowiderparticipationintheprocessofglobalization.TheCapExinvestmentsaredesignedtoaccessthatvalueandtimelostindevelopmentisrevenuelosttocompanybottomlines.Seehttps://www.yumpu.com/en/document/view/11263854/wcs-price-spread-impactpub-rbccom

19
Jan 03 Jan 04 Jan 05 Jan 06 Jan 07 Jan 08 Jan 09 Jan 10 Jan 11 Jan 12 Jan 13 Jan 14 Jan 15
20
10
0
(10)
(20)
(30)
(40)
(50)
US
$/b
bl
Maya - WTI WCS - WTI
Transportation bottlenecks led to inland crude price discounts relative to waterborn crude
Source:BaytexEnergyCorp.69
Figure 7. Price Differential between Maya, WTI, and WCS ($/bbl), Over Preceding Decade
69 BaytexEnergyCorp,Presentation“EnerCom’sTheOil&GasConference.”August17-21,2014,Slide25.http://www.enercominc.com/downloads_TOGC_2014/Baytex-Energy.pdf72 Theaveragespreadbetween2000and2009was$2.15perbarrelinfavorofWTI.From2010to2013itwas$11.05infavorofBrent.Thedifferenceis$13.19.
fouryears.Inthatperiodtheyproduced
1.3billionbarrelsofsyntheticcrude.The
lossduetopublicaccountabilityfrom
2010-2013amountsto$6.1billion.Public
accountabilityintheformofpipeline
campaignshasbeenamajorfactorin
reducingrevenuestotarsandsproducers.
Overall,tarsandsproducerslost$30.9
billionbetween2010-2013duetowider
pricedifferentialscausedbytransportation
bottlenecksandthefloodofcrudecoming
fromtightoilfields.Ofthat,$17.1billion
or55percentcanbecrediblyattributed
totheimpactofpublicaccountability
campaigns.
0
20
40
60
80
100
120
2000 2001 2002 2003 2004 2005 2006 2007 2008 2009 2010 2011 2012 2013
Brent WTI
Thisisasignificantimpact,andithas
causedcancelledprojects,slowed
expansion,andavoidedemissions.As
concernoverclimatecontinuestogrow,
thesepublicaccountabilitycampaigns,
andtheirimpactsontarsandsexpansion,
willalsogrow.
Figure 8: Brent-WTI Spread 2000 – 201372
Source:Bloomberg
20
Tarsandsproductionislandlocked.
Expansionoftransportinfrastructure
isessentialtoproductiongrowth.The
KeystoneXLcampaignhas,todate,
delayedthispipelineprojectforoverfive
years.AdditionalpipelinestoCanadian
portsarealsodelayed.Thedelayshave
costproducersmoneyandtime,reducing
thepricetheyhavereceivedfortarsands
crudeassupplyhasoutpacedthecapacity
oftransportinfrastructuretocarrytar
sandscrudetonewmarkets.
Tarsandsindustryestimatesarefocused
onalargebuildoutofprojectsinthe
faceofdeterioratingfinancialconditions.
Variousforecastsexpecttarsands
productiontomorethandoubleby2030
andtheindustryplansfurtheraggressive
growthinthedecadesthatfollow.
Butpublicquestioningofthislevelof
growthwillcertainlycontinue.Ifopposition
totarsandsinfrastructurecontinuesto
besuccessful,itcouldleadtodozensof
projectcancellations,severalbillionbarrels
ofbitumenleftinthegroundandbillions
oftonnesofcarbondioxideaverted.
Thissectionusesindustrydatamodels
toestimatewhattheimpactofcontinued
campaignsuccessmightbe.The
conclusionsshouldbothtriggerserious
questionsforinvestorsandencourage
thoseopposingthetarsandsthattheir
effortswillleadtosignificantcarbon
savings.
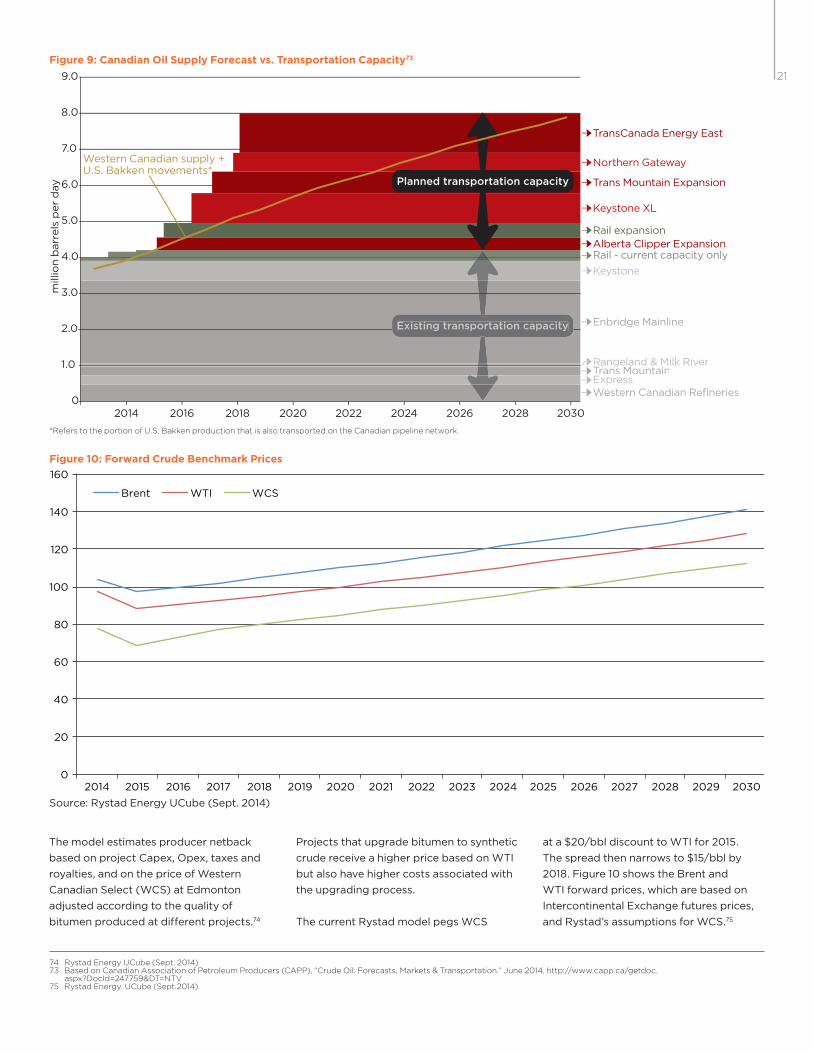
INCREASED PIPELINE CAPACITY CRITICAL TO ACHIEVEMENT OF PRODUCTION GOALS Inorderfortheindustrytoachieveits
productiongoalsitmustdevelopnew
transportationcapacity.
Figure9showstheimportanceofnew
pipelinesforexpansionandillustratesa
gapofroughly4millionbpdbetween
today’spipelinecapacityandthe
projectedtransportrequirementin2030
accordingtotheCanadianAssociationof
PetroleumProducers(CAPP).
Whileonecouldsimplycompareprojected
productionwithpipelinecapacityto
ascertainhowmuchtarsandscrudecould
bestrandedbythefailureofpipeline
projects,itisreasonabletoassumethat
somelesseramountofproductionwill
findotherwaystomarket.Thiswouldbe
primarilyviarailorpotentiallythrough
somedegreeofdevelopmentoflocal
markets,i.e.increasedupgradingand
refininginwesternCanada.
However,theseoptionsaddcostandcapital
risktooperatingtarsandsprojects.OCI’s
analysisoftheeconomicsofbitumen-by-rail
showsthatrailisnotonlymoreexpensive
thanpipelinebutalsofacesnumerous
logisticalhurdlesthatindicateitcannot
provideenoughreliableandaffordable
capacitytosatisfythefutureproduction
ambitionsoflarge-scaletarsandsproducers
(seeBox:WhyRailisNottheAnswerfor
TransportingTarSands).
Continuedpipelinedelayswillfurther
erodetheprojectedpricetobereceived
byproducers(netback)ontarsands
investmentsaspricediscountsand/or
increasedcoststoaccessundiscounted
marketscontinuetopressurethebottom
line.Asshownearlier,pricediscountsof
thelastfewyearshavereducednetbackto
producerscostingthembillionsofdollars
inlostprofits.
Ourforecastmodelseekstoanswerthe
followingquestions:Whathappensto
tarsandsproductioniftransportation
bottleneckscontinue,pricesfortarsands
cruderemaindiscounted,andnetbacksto
producersremainsuppressed?Howmuch
tarsandsbitumen–andconsequently
howmuchcarbon–couldpotentiallybe
leftintheground?Andforinvestors,how
vulnerablearetheseprojectstocontinued
transportationconstraintsandassociated
netbackreductions?
REDUCED NETBACK AND AVOIDED PRODUCTION/EMISSIONSOurforecastmodelreliesuponindustry
modelsandsupplementalindependent
dataandanalysistoarriveatits
conclusions.Iftheprojectedpricetobe
receivedbyproducers(netback)falls
belowtheprojectedcostsforagiven
project,itisassumedthattheprojectwill
eithercease,reduceproductionornotbe
developed.Inthiswayweestimatehow
muchtarsandsbitumenwouldpotentially
beleftinthegroundifnetbacksare
reducedbeyondcurrenttrends.
FORECAST MODEL: IMPACT OF MARKET PRESSURES AND PUBLIC ACCOUNTABILITY ON TAR SANDS PRODUCTION
21
74 RystadEnergyUCube(Sept.2014)73 BasedonCanadianAssociationofPetroleumProducers(CAPP),“CrudeOil:Forecasts,Markets&Transportation.”June2014.http://www.capp.ca/getdoc.
aspx?DocId=247759&DT=NTV75 RystadEnergy.UCube(Sept.2014).
Themodelestimatesproducernetback
basedonprojectCapex,Opex,taxesand
royalties,andonthepriceofWestern
CanadianSelect(WCS)atEdmonton
adjustedaccordingtothequalityof
bitumenproducedatdifferentprojects.74
Projectsthatupgradebitumentosynthetic
crudereceiveahigherpricebasedonWTI
butalsohavehighercostsassociatedwith
theupgradingprocess.
ThecurrentRystadmodelpegsWCS
ata$20/bbldiscounttoWTIfor2015.
Thespreadthennarrowsto$15/bblby
2018.Figure10showstheBrentand
WTIforwardprices,whicharebasedon
IntercontinentalExchangefuturesprices,
andRystad’sassumptionsforWCS.75
Existing transportation capacity
Planned transportation capacity
0
1.0
2.0
3.0
4.0
5.0
6.0
7.0
8.0
9.0
Western Canadian supply + U.S. Bakken movements*
202420222020201820162014
mill
ion b
arr
els
per
day
203020282026
TransCanada Energy East
Trans Mountain Expansion
Northern Gateway
Alberta Clipper Expansion
Keystone XL
Rail expansion
Western Canadian RefineriesExpressTrans Mountain
Enbridge Mainline
Keystone
Rail - current capacity only
Rangeland & Milk RiverT M t i
Figure 9: Canadian Oil Supply Forecast vs. Transportation Capacity73
0
20
40
60
80
100
120
140
160
2014 2015 2016 2017 2018 2019 2020 2021 2022 2023 2024 2025 2026 2027 2028 2029 2030
Brent WTI WCS
Figure 10: Forward Crude Benchmark Prices
Source:RystadEnergyUCube(Sept.2014)
*ReferstotheportionofU.S.BakkenproductionthatisalsotransportedontheCanadianpipelinenetwork.

22
CAPEX FORECAST SUGGESTS END TO BOOM TIMESIndustryforecastsandourownanalysis
concludethattherobustcapexexpansion
plannedbytarsandproducersisonthe
wane.Rystad’sforecastforcapexinthe
tarsandsexpectsapeakin2014atjust
lessthanUSD$34billion.Capexfalls
considerablyin2015tounderUSD$29
billionandcontinuestofallthrough2018to
lessthanUSD$26billion.By2030,Capex
isyettorecoverto2014levelsreaching
onlyUSD$29.8billion(seeFigure11).76
Rystad’smodelisbasedonanassumption
ofa$15differentialbetweentheCanadian
heavyoilbenchmarkWCSandthe
U.S.lightoilbenchmarkWTIfrom2018
onwards.However,itisclearthatif
pipelinescontinuetobedelayedamuch
steeperdeclineinCapexislikely.
TherecentstatementsbyCAPPoffered
lessprecisedetailsofitsbasisfor
estimatingaslowerrateofgrowthof
production,butthetrajectoryisconsistent.
Ourconclusionisthatcancellationof
proposedpipelinesandmineprojects
createsitsowninvestmentmomentum
towardstillgreaterdiligenceonprojectsin
development,increasingthelikelihoodof
furtherdelaysandcancellations.Without
newpipelines,Capexlevelsacrossthe
boardwillfall.Weconcludethatshort-
term,Capexspendingislikelytobeless
thanforecastedascompany’srecognize
thatweakenedprojectfundamentals
duringthisperiodofdecliningoilprices
requiresareevaluationofinvestment
priorities.Inshort,theindustryismoving
fromamarketandresourcemaximization
periodtooneofdiminishedconfidencein
projectprofitability.
ESTIMATING THE BARRELS AT RISK FROM PIPELINE INFRASTRUCTURE CAMPAIGNS AND THE CARBON IMPACTTheoutcomeoftheKeystonepipeline
issueislikelytohaveanimpactonmarket
perceptionsofcurrentandfuturetarsands
development.IftheKeystonepipeline,
orotherpipelinesindevelopment,are
definitivelycancelledorsubjectedto
prolongeddelaysitisreasonableto
assumepricedifferentialsforCanadiantar
sandsproductswillwiden.Theforecast
modelexploresscenariosthatpointto
apricedifferentialbeyondthecurrent
Rystadforecastof$20to$15perbarrel
discounttoWTI.
Toexpandthemodel,weaddedan
incremental$5/bbldiscounttothemodel
downtoamaximumadditionaldiscount
of$30/bbl.Thisresultsinamaximum
of$45/bblbelowWTI,adjustedforthe
bitumenqualityofindividualprojects.
Whilethediscounthasinthepastfew
yearsaveragedmorethan$20/bbl,the
monthlyaveragehasonsomeoccasions
risenabove$30/bbl,reachingamaximum
of$37.50inOctober2013.
ItisfeasibleforWCStotradeforatimeat
verysteepdiscountstoWTI.Thisoccurs
whensupplyexceedseitherdemandand/
ortransportationcapacity.Whetherthe
discountwouldactuallywidenasfaras
$45/bblforaprolongedperiodifpipeline
projectsarestoppeddependsonwhether
producerscontinuetogrowproduction
inthefaceofconstrainedtransportation
capacity.Doingsowouldclearlyfloodthe
accessiblemarketfortarsandscrudeand
crashprices.Becauserailcannotcopewith
theleveloftarsandsproductiongrowth
76 NotethattheRystadnumbersaresubstantiallyhigherthanthoseprovidedbytheAER.
2014 2015 2016 2017 2018 2019 2020 2021 2022 2023 2024 2025 2026 2027 2028 2029 2030 -
5
10
15
20
25
30
35
40
Bill
ion
US
D
Figure 11: Rystad Tar Sands Capex Baseline Forecast: 2014 – 2030
Source:RystadEnergyUCube(Sept.2014)

23
77 ThismaynotbeRystad’sintentionbutisourinterpretationofRystad’sWCSpricingassumption.78 RystadEnergyUCube,OCI,IEEFA
thattarsandsproducersareplanning,and
whatsmalladditionalproductionitcan
handleincurssignificantadditionalcosts,
thismodelalsodemonstratestheimpact
ofagreaterswitchtorail.Themodel
thereforeprovidesavalidestimateofthe
impactofcontinuedsuccessfulopposition
totarsandspipelineswitheachincrement
approximatingthefailureofoneormore
proposedpipelineprojects.
Theimpactontarsandsproductionof
each$5/bbldiscounttotheforecast
modelisillustratedinFigure12.Inthis
2015 2016 2017 2018 2019 2020 2021 2022 2023 2024 2025 2026 2027 2028 2029 2030 -
1,000
2,000
3,000
4,000
5,000
6,000
Th
ou
san
d B
PD
CAPP Rystad -$5 -$10 -$15 -$20 -$25 -$30
analysis,theCAPPforecastservesas
businessasusual(BAU)oramaximum
possibleleveloftarsandsproductionthat
assumesthattransportationbottlenecks
areresolved.WeusetheRystadforecast
asanalternativeBAUscenarioinwhich
Figure 12: Tar Sands Production Forecast under a Reduced Netback Scenario78
Source:OCI/IEFFA
0
1
2
3
4
5
6
7
8
CAPP Rystad -$5 -$10 -$15 -$20 -$25 -$30
Bill
ion
Barr
els
Source:OCI/IEEFA
Figure 13: Barrels of Bitumen Not Produced Under Reduced Netback Scenario
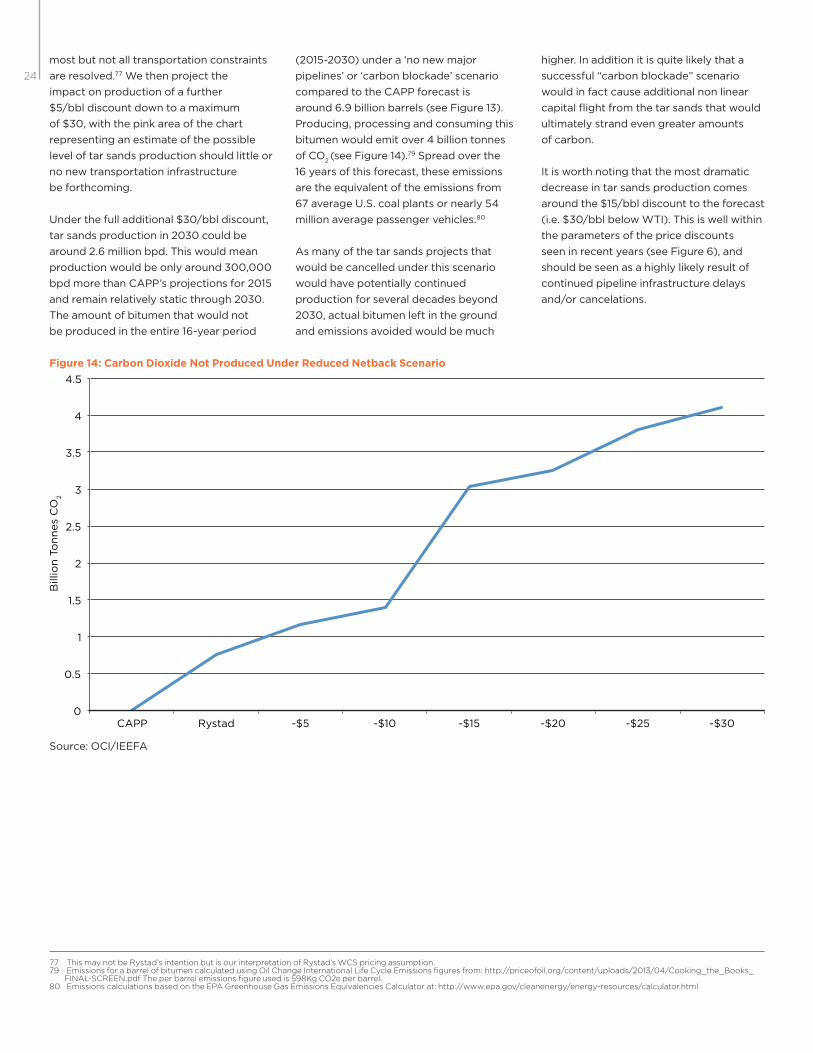
24
mostbutnotalltransportationconstraints
areresolved.77Wethenprojectthe
impactonproductionofafurther
$5/bbldiscountdowntoamaximum
of$30,withthepinkareaofthechart
representinganestimateofthepossible
leveloftarsandsproductionshouldlittleor
nonewtransportationinfrastructure
beforthcoming.
Underthefulladditional$30/bbldiscount,
tarsandsproductionin2030couldbe
around2.6millionbpd.Thiswouldmean
productionwouldbeonlyaround300,000
bpdmorethanCAPP’sprojectionsfor2015
andremainrelativelystaticthrough2030.
Theamountofbitumenthatwouldnot
beproducedintheentire16-yearperiod
(2015-2030)undera‘nonewmajor
pipelines’or‘carbonblockade’scenario
comparedtotheCAPPforecastis
around6.9billionbarrels(seeFigure13).
Producing,processingandconsumingthis
bitumenwouldemitover4billiontonnes
ofCO2(seeFigure14).79Spreadoverthe
16yearsofthisforecast,theseemissions
aretheequivalentoftheemissionsfrom
67averageU.S.coalplantsornearly54
millionaveragepassengervehicles.80
Asmanyofthetarsandsprojectsthat
wouldbecancelledunderthisscenario
wouldhavepotentiallycontinued
productionforseveraldecadesbeyond
2030,actualbitumenleftintheground
andemissionsavoidedwouldbemuch
higher.Inadditionitisquitelikelythata
successful“carbonblockade”scenario
wouldinfactcauseadditionalnonlinear
capitalflightfromthetarsandsthatwould
ultimatelystrandevengreateramounts
ofcarbon.
Itisworthnotingthatthemostdramatic
decreaseintarsandsproductioncomes
aroundthe$15/bbldiscounttotheforecast
(i.e.$30/bblbelowWTI).Thisiswellwithin
theparametersofthepricediscounts
seeninrecentyears(seeFigure6),and
shouldbeseenasahighlylikelyresultof
continuedpipelineinfrastructuredelays
and/orcancelations.
Figure 14: Carbon Dioxide Not Produced Under Reduced Netback Scenario
Source:OCI/IEEFA
77 ThismaynotbeRystad’sintentionbutisourinterpretationofRystad’sWCSpricingassumption.79 EmissionsforabarrelofbitumencalculatedusingOilChangeInternationalLifeCycleEmissionsfiguresfrom:http://priceofoil.org/content/uploads/2013/04/Cooking_the_Books_
FINAL-SCREEN.pdfTheperbarrelemissionsfigureusedis598KgCO2eperbarrel.80 EmissionscalculationsbasedontheEPAGreenhouseGasEmissionsEquivalenciesCalculatorat:http://www.epa.gov/cleanenergy/energy-resources/calculator.html
0
0.5
1
1.5
2
2.5
3
3.5
4
4.5
CAPP Rystad -$5 -$10 -$15 -$20 -$25 -$30
Bill
ion
To
nn
es
CO
2

25CONCLUSION
Thisreportcapturesthetarsandsindustry
duringaperiodofstumble.Whetheror
nottherisksweoutlinewillresultinafall
isanopenquestion.Publicaccountability
campaignsagainsttarsandsproduction
andtarsandspipelineshaveswayedpublic
opinionatatimewheneconomicforces
arepressuringtheviabilityoftarsands
investment.
Significantpricediscountsfortarsands
crudehaveevolvedasproductionhas
overwhelmeddemandinthemarketsthat
canbereachedwithexistinginfrastructure.
Sharesinmanymajortarsandsproducers
areunderperformingthemarket.
Compoundedbyadecreasingwider
crudeoilpricingenvironmentasaresult
ofabundantlightoilproductioninthe
UnitedStatesandslowingdemand,major
tarsandsprojectshavebeencancelled
andfurthercancellationsseemlikely.
Investorsneedtobeawarethatthis
constellationofriskisself-reinforcingand
likelytocontinuetofosteranenvironment
ofcancelledprojects.
AtarsandsmineinAlberta.
©Jen
nifer
Gra
nt.h
ttp
://t
inyu
rl.c
om
/kvj
dp
th
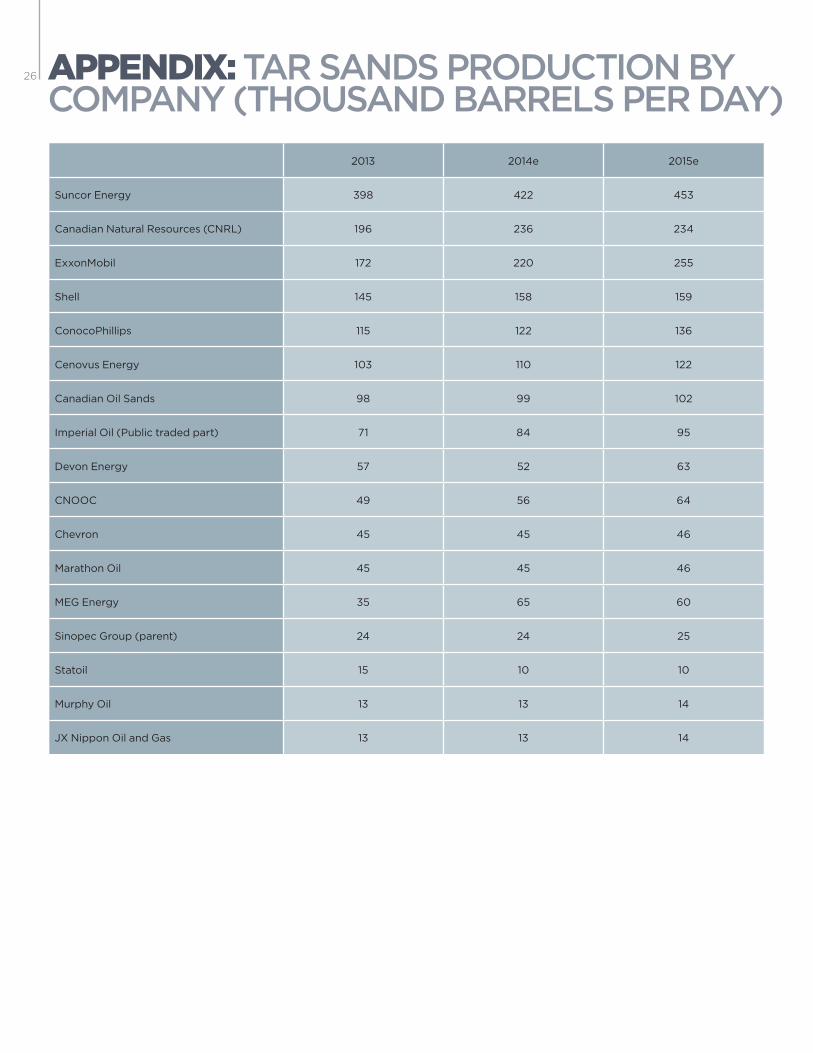
26 APPENDIX: TAR SANDS PRODUCTION BY COMPANY (THOUSAND BARRELS PER DAY)
2013 2014e 2015e
SuncorEnergy 398 422 453
CanadianNaturalResources(CNRL) 196 236 234
ExxonMobil 172 220 255
Shell 145 158 159
ConocoPhillips 115 122 136
CenovusEnergy 103 110 122
CanadianOilSands 98 99 102
ImperialOil(Publictradedpart) 71 84 95
DevonEnergy 57 52 63
CNOOC 49 56 64
Chevron 45 45 46
MarathonOil 45 45 46
MEGEnergy 35 65 60
SinopecGroup(parent) 24 24 25
Statoil 15 10 10
MurphyOil 13 13 14
JXNipponOilandGas 13 13 14

27
2013 2014e 2015e
Total 13 13 15
ConnacherOilandGas 12 18 20
Otherpartner(s)CA 11 12 12
SouthernPacificResource 7 9 12
Japex 7 7 7
HuskyEnergy 6 6 11
PengrowthEnergyCorporation 2 1 3
PennWestExploration 1 1 1
BaytexEnergy 1 2 2
LaricinaEnergy 1 2 4
OSUM 0 1 1
BlackPearlResources 0 0 0
KNOC(S.Korea) 0 1 3
SunshineOilsands 0 0 2
BP 0 0 5
AthabascaOilSandsCorporation 0 0 3
TouchstoneExplorationInc. 0 0 2
Source:RystadEnergyUCube(Sept.2014)

Oil Change International714 G Street SE, Suite 202Washington, DC 20003www.priceofoil.org
October 2014
Institute For Energy Economics And Financial AnalysisRiver’s Edge3430 Rocky River DriveCleveland, OH 44111http://www.ieefa.org