MATERIAL REMOVAL RATE AND SURFACE …umpir.ump.edu.my/9886/7/fkm-2015-mmnoor-material... ·...
13
International Journal of Automotive and Mechanical Engineering (IJAME) ISSN: 2229-8649 (Print); ISSN: 2180-1606 (Online); Volume 11, pp. 2471-2483, January-June 2015 ©Universiti Malaysia Pahang DOI: http://dx.doi.org/10.15282/ijame.11.2015.27.0208 2471 MATERIAL REMOVAL RATE AND SURFACE ROUGHNESS ON GRINDING OF DUCTILE CAST IRON USING MINIMUM QUANTITY LUBRICATION M.M. Rahman 1,2* , K. Kadirgama 1 and M.M. Noor 1 1 Faculty of Mechanical Engineering, Universiti Malaysia Pahang 26600 Pekan, Kuantan, Pahang, Malaysia *Email: [email protected] Phone: +6094246239; Fax: +6094246222 2 Automotive Engineering Centre Universiti Malaysia Pahang, 26600 Pekan, Pahang, Malaysia ABSTRACT A promising alternative to conventional fluid coolant application is minimum quantity lubrication (MQL). Despite much research, there have been few investigations about the influence of MQL parameters on the process results, such as oil flow rate, workpiece speed and depth of cut. The objective of this project is to develop a mathematical model of the material removal rate and surface roughness on grinding of ductile cast iron using minimum quantity lubrication. The experiment was carried out according to the design of experiment principle, prepared based on central composite design. The experimental data was utilized to develop the mathematical model for first- and second-order models. The second order gives acceptable performance of the grinding. The result shows that the highest value of the grinding ratio is with single-pass MQL, and the lowest value is with multiple-pass conventional coolants. The model fit was adequate and acceptable for sustainable grinding using a 0.15% volume concentration of ethylene glycol. This paper quantifies the impact of water-based ethylene glycol on the surface quality achieved. It is concluded that the surface quality is most influenced by the depth of cut and table speed. It is recommended that future research is also conducted using another parameter such as the speed of the grinding wheel or the distance from the wheel–workpiece contact zone. Besides that, further research can be conducted using different nozzle angles and different types of grinding wheel to see how these affect the surface of the material. Keywords: Minimum quantity lubrication; grinding; material removal rate; surface roughness; cast iron. INTRODUCTION Grinding is one of the material removal processes that is widely used in industry, and is used in order to get a better surface quality and very close tolerance, which is very strict for design components[1]. When the tools make contact with the workpiece surface, the heat rises in the latter [2]. Coolant is used to enhance the performance of grinding in terms of giving a better surface finish, reducing the temperature between the surface contacts and also cleaning the surface from the chips generated during the grinding process [3]. Large quantities of emulsion-based cooling fluids for machining are still widely used in the metal-working industry, generating high consumption and disposal costs and having an impact on the environment [4]. The increasing need for environmentally friendly production techniques and the rapid growth of cutting fluid disposal costs have led to
-
Upload
phamnguyet -
Category
Documents
-
view
227 -
download
0
Transcript of MATERIAL REMOVAL RATE AND SURFACE …umpir.ump.edu.my/9886/7/fkm-2015-mmnoor-material... ·...

International Journal of Automotive and Mechanical Engineering (IJAME) ISSN: 2229-8649 (Print); ISSN: 2180-1606 (Online); Volume 11, pp. 2471-2483, January-June 2015 ©Universiti Malaysia Pahang DOI: http://dx.doi.org/10.15282/ijame.11.2015.27.0208
2471
MATERIAL REMOVAL RATE AND SURFACE ROUGHNESS ON GRINDING
OF DUCTILE CAST IRON USING MINIMUM QUANTITY LUBRICATION
M.M. Rahman1,2*, K. Kadirgama1 and M.M. Noor1
1Faculty of Mechanical Engineering, Universiti Malaysia Pahang
26600 Pekan, Kuantan, Pahang, Malaysia
*Email: [email protected]
Phone: +6094246239; Fax: +6094246222 2Automotive Engineering Centre
Universiti Malaysia Pahang, 26600 Pekan, Pahang, Malaysia
ABSTRACT
A promising alternative to conventional fluid coolant application is minimum quantity
lubrication (MQL). Despite much research, there have been few investigations about the
influence of MQL parameters on the process results, such as oil flow rate, workpiece
speed and depth of cut. The objective of this project is to develop a mathematical model
of the material removal rate and surface roughness on grinding of ductile cast iron using
minimum quantity lubrication. The experiment was carried out according to the design of
experiment principle, prepared based on central composite design. The experimental data
was utilized to develop the mathematical model for first- and second-order models. The
second order gives acceptable performance of the grinding. The result shows that the
highest value of the grinding ratio is with single-pass MQL, and the lowest value is with
multiple-pass conventional coolants. The model fit was adequate and acceptable for
sustainable grinding using a 0.15% volume concentration of ethylene glycol. This paper
quantifies the impact of water-based ethylene glycol on the surface quality achieved. It is
concluded that the surface quality is most influenced by the depth of cut and table speed.
It is recommended that future research is also conducted using another parameter such as
the speed of the grinding wheel or the distance from the wheel–workpiece contact zone.
Besides that, further research can be conducted using different nozzle angles and different
types of grinding wheel to see how these affect the surface of the material.
Keywords: Minimum quantity lubrication; grinding; material removal rate; surface
roughness; cast iron.
INTRODUCTION
Grinding is one of the material removal processes that is widely used in industry, and is
used in order to get a better surface quality and very close tolerance, which is very strict
for design components[1]. When the tools make contact with the workpiece surface, the
heat rises in the latter [2]. Coolant is used to enhance the performance of grinding in terms
of giving a better surface finish, reducing the temperature between the surface contacts
and also cleaning the surface from the chips generated during the grinding process [3].
Large quantities of emulsion-based cooling fluids for machining are still widely used in
the metal-working industry, generating high consumption and disposal costs and having
an impact on the environment [4]. The increasing need for environmentally friendly
production techniques and the rapid growth of cutting fluid disposal costs have led to

Rahman and Kadirgama /International Journal of Automotive and Mechanical Engineering 11 (2015) 2471-2483
2472
demand for an alternative to the machining processes currently used. The introduction of
Minimum Quantity Lubrication (MQL) makes use of a lubricant that replaces the
conventional coolant in order to overcome the temperature and surface finish problems
[5-8]. The use of coolant or cutting fluids is the most common strategy to solve this
problem. However, the introduction of cutting fluids often produces air-borne mist,
smoke and other particulates that affect the shop floor air quality. These products bring
environmental, health and safety concerns. In addition, the cost of using cutting fluids is
several times higher than the tool costs themselves. Environmental concerns have become
increasingly important to productive processes, allied with their economic and
technological aspects.
Green engineering is used to indicate environmental concerns in engineering.
Green manufacturing is a subset of green engineering. Environmentally friendly
machining is a part of green manufacturing. It is included in the concept of sustainable
manufacturing, which considers economic and social concerns in addition to
environmental concerns [9-12]. Environmentally friendly machining attempts to
minimize the consumption of cutting fluid, cutting tools and energy. Green engineering
is a modern manufacturing strategy, which has become popular as a sustainable
development strategy in industrial processes and production. Dry machining and
minimum quantity lubricant (MQL) machining have become the focus of attention of
researchers and technicians in the field of machining as an alternative to traditional
fluids[13, 14]. Silva, Bianchi [15] investigated the effects of grinding parameters on
ABTN 4340 steel using the MQL technique. They found that the surface roughness,
grinding force, diameter wear and residual stress improved with the use of the MQL
system in the grinding process due to better lubrication of the grinding zone, and provided
better slipping of grains at the contact zone. The concept of MQL is fundamentally
different from that of flood coolant and this can be a large stumbling block to machinists
who are new to MQL. MQL is an alternative intended to save money, while eliminating
the mess, disposal and negative aspects of coolant use[11]. Ethylene glycol is one of the
base fluids for nanofluid beside water, engine oil and cutting fluid. Ethylene glycol is also
a chemical commonly used in many commercial and industrial applications including
antifreeze and coolant. The major use of ethylene glycol is as a medium for convective
heat transfer in, for example, car radiators, liquid-cooled computers, chilled water air
conditioning systems, and the like [16]. The response surface method [17] is a statistical
method that uses quantitative data from appropriate experiments to determine and
simultaneously solve multivariant equations. It is useful for analyzing and modeling
problems to obtain a response of interest that is influenced by several variables [18]. The
objective of this study is to evaluate the performance of MQL on surface grinding in terms
of MRR and surface roughness and to develop a mathematical model based on the
response surface method, and additionally to optimize the process parameters using RSM.
METHODS AND MATERIALS
The response surface method uses quantitative data from experimental results to
determine and simultaneously solve multivariant equations. The main objective of RSM
is to get the response of interest, which is the material removal rate for each different
coolant condition. To find the value of the MRR, the mass difference of the workpiece
and also the time taken is used. Table 1 shows the design of the central composite design
method.
Material removal rate and surface roughness on grinding of ductile cast iron using minimum quantity lubrication
2473
aken Time
difference MassMRR (1)
Table 1. Central composite design method for MRR.
Workpiece Workpiece speed (rpm) Depth of cut (µm)
A 25.2 2
B 25.2 4
C 25.2 6
D 12.5 2
E 12.5 4
F 12.5 6
G 8.7 2
H 8.7 4
I 8.7 6
Response surface methodology explores the relationships between several
explanatory variables and one or more response variables. The main idea of RSM is to
use a set of designed experiments to obtain an optimal response. In this study, RSM is
utilized for establishing the relations between the different grinding coolant parameters
with a variety of machining criteria and exploring their effects on the response as the
MRR. The response of surface roughness and material removal rate is described by
Eq. (2):
ijij
n
j
n
i
iii
n
i
i
n
i
xCxCxCCY
2
1
1
2
11
0 (2)
where Y is the corresponding response, SR or MRR, yielded by the various grinding
process variables, and xi (1, 2, ……, n) are coded levels of n quantitative process
variables, while the terms C0, Ci, Cii and Cij are the second-order regression coefficients.
The second term under the summation sign of this polynomial equation is attributable to
the linear effect, whereas the third term corresponds to the higher-order effects; the fourth
term of the equation includes the interactive effects of the process parameters. In this
research, the equation can be written as Eq. [19]:
2
2
1
231322110 CxCxxxCxCxCCY (3)
where X1 and X2, are the workpiece speed and depth of cut respectively.
G-Ratio
The G-ratio is the value of the material removal rate and the value of the tool wear. The
workpiece material and the grinding wheel are important to find the G-ratio value. This
value is shown as the interaction between the MRR and the tool wear. The higher the
value of the G-ratio, the better the method of grinding. To find the value of the G-ratio,
Eq. (4) is used.

Rahman and Kadirgama /International Journal of Automotive and Mechanical Engineering 11 (2015) 2471-2483
2474
wearTool
rate removal MaterialratioG (4)
RESULTS AND DISCUSSION
The material removal rate is the rate at which material is removed per unit time, and the
unit is grams per second (g/s). The material removal rates for ethylene glycol with MQL
and conventional coolant for the single-pass and multiple-pass grinding processes are
represented in Table 2. The experiment was conducted nine times with various
combinations of workpiece speed and depth of cut. A 5% volume concentration of soluble
oil coolant and a 15% volume concentration of ethylene glycol were used. It can be
observed that the minimum MRR in single-pass grinding using the conventional coolant
was 0.00370 g/s. However, the minimum material removal rate was 0.00420 g/s for the
ethylene glycol with the combination of the table speed and depth of cut. On the other
hand, the maximum value is 0.01420 g/s and 0.00910 g/s for the conventional coolant and
the ethylene glycol respectively. It is slightly different in multiple-pass grinding. The
minimum MRR in multiple-pass grinding using a conventional coolant was 0.01560 g/s.
However, the minimum MRR was 0.02090 g/s for ethylene glycol. The result for
multiple-pass grinding shows that the depth of cut affects the MRR value. Besides that,
multiple-pass grinding also gives higher values of MRR than single-pass. This is because
in multiple-pass the grinding wheel passes the specimen ten times.
Table 2. Material removal rate for each coolant in different grinding conditions.
Specimen
Workpiece
speed
(rpm)
Depth
of cut
(µm)
Material removal rate (g/s)
Single-pass Multiple-pass
Conventional
coolants
Ethylene
glycol
with
MQL
Conventional
coolants
Ethylene
glycol
with
MQL
1 8.7 2 0.00370 0.00530 0.04780 0.02670
2 8.7 4 0.00970 0.00700 0.01560 0.02670
3 8.7 6 0.01200 0.00720 0.04080 0.02400
4 12.5 2 0.00400 0.00420 0.01750 0.02340
5 12.5 4 0.00790 0.00700 0.02110 0.02630
6 12.5 6 0.01200 0.00910 0.08250 0.03000
7 25.2 2 0.00700 0.00530 0.06620 0.02090
8 25.2 4 0.00900 0.00720 0.08190 0.02510
9 25.2 6 0.01420 0.00700 0.15670 0.02901
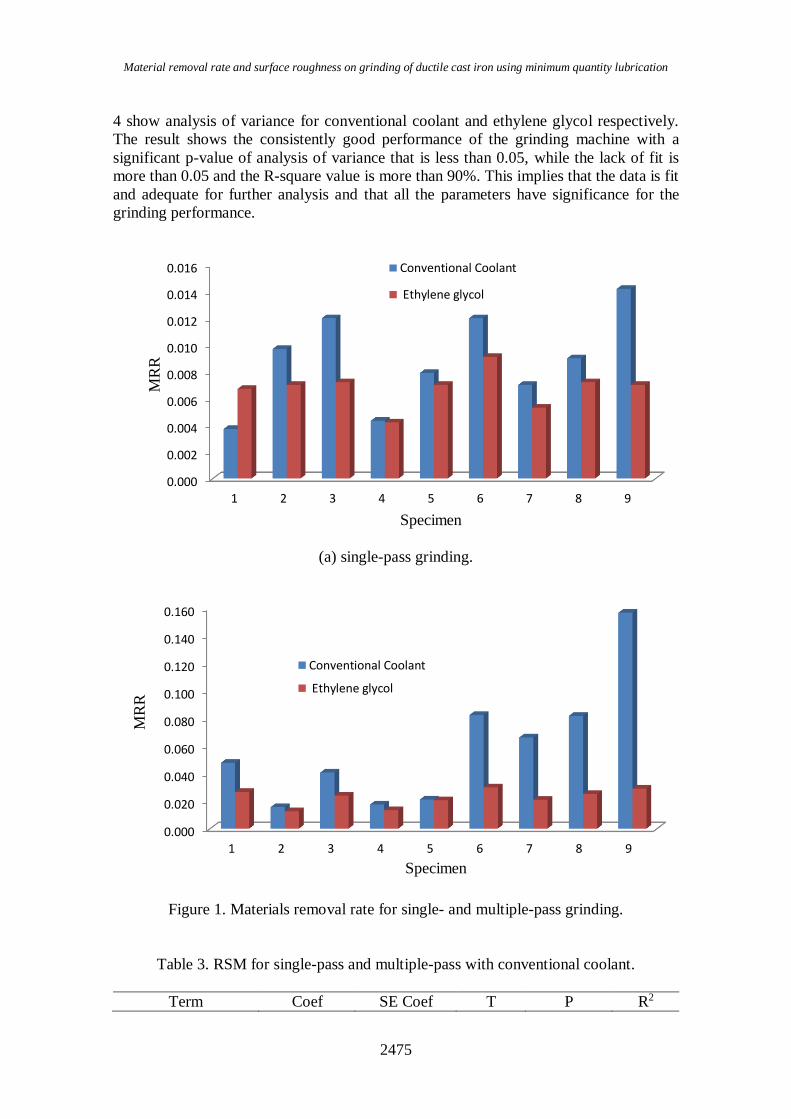
Figure 1 shows the comparison between the conventional coolant and ethylene
glycol with MQL for single- and multiple-pass grinding processes. Multiple-pass gives a
higher MRR value compared to the single-pass. The MRR is slightly lower when using
ethylene glycol (MQL) but the MRR value is higher when using conventional coolant.
This is due to the effect of the nanoparticles that lubricate the two surfaces that slide over
each other. Besides that, RSM is used to obtain the performance measure for the response
of interest that is the material removal rate from the surface of the material. Tables 3 and
Material removal rate and surface roughness on grinding of ductile cast iron using minimum quantity lubrication
2475
4 show analysis of variance for conventional coolant and ethylene glycol respectively.
The result shows the consistently good performance of the grinding machine with a
significant p-value of analysis of variance that is less than 0.05, while the lack of fit is
more than 0.05 and the R-square value is more than 90%. This implies that the data is fit
and adequate for further analysis and that all the parameters have significance for the
grinding performance.
(a) single-pass grinding.
Figure 1. Materials removal rate for single- and multiple-pass grinding.
Table 3. RSM for single-pass and multiple-pass with conventional coolant.
Term Coef SE Coef T P R2
0.000
0.002
0.004
0.006
0.008
0.010
0.012
0.014
0.016
1 2 3 4 5 6 7 8 9
MR
R
Specimen
Conventional Coolant
Ethylene glycol
0.000
0.020
0.040
0.060
0.080
0.100
0.120
0.140
0.160
1 2 3 4 5 6 7 8 9
MR
R
Specimen
Conventional Coolant
Ethylene glycol
Rahman and Kadirgama /International Journal of Automotive and Mechanical Engineering 11 (2015) 2471-2483
2476
Single-pass
Constant 0.027384 0.000506 54.114 0.000 91.77%
Workpiece speed 0.000027 0.000206 0.132 0.001
DOC 0.001784 0.000210 8.493 0.000
Workpiece speed ×
Workpiece speed
-0.001704 0.000526 -3.240 0.004
DOC ×DOC -0.000227 0.000356 -0.638 0.530
Workpiece speed ×
DOC
-0.002593 0.000240 -10.787 0.000
Lack of fit 0.197
Multiple-pass
Constant 0.007428 0.000181 41.290 0.000 92.85%
Workpiece speed 0.000217 0.000074 2.943 0.008
DOC -0.0001859 0.000075 -11.418 0.000
Workpiece speed ×
Workpiece speed
-0.0000784 0.000188 -4.161 0.000
DOC × DOC -0.000289 0.000128 -2..266 0.034
Workpiece speed ×
DOC
-0.001626 0.000086 -18.886 0.000
Lack of fit 0.115
Table 4. RSM for single-pass and multiple-pass of ethylene glycol.
Term Coef SE Coef T P R2
Single-pass
Constant -0.01529 0.000534 -28.653 0.000 99.94
% Workpiece speed -0.003331 0.000217 -153.663 0.000
DOC 0.02055 0.000222 92.791 0.000
Workpiece speed ×
Workpiece speed 0.06449 0.000555 116.267 0.000
DOC × DOC 0.02859 0.000375 76.141 0.000
Workpiece speed ×
DOC -0.02398 0.000253 -94.601 0.000
Lack of fit 0.153
Multiple-pass
Constant 0.007992 0.000196 40.842 0.000 98.65%
Workpiece speed 0.000378 0.000080 4.752 0.000
DOC 0.003571 0.000081 43.951 0.000
Workpiece speed ×
Workpiece speed 0.001496 0.000203 7.354 0.000
DOC × DOC -0.0000182 0.000138 -1.323 0.200
Workpiece speed ×
DOC -0.0001301 0.000093 -13.991 0.000
Lack of fit 0.211
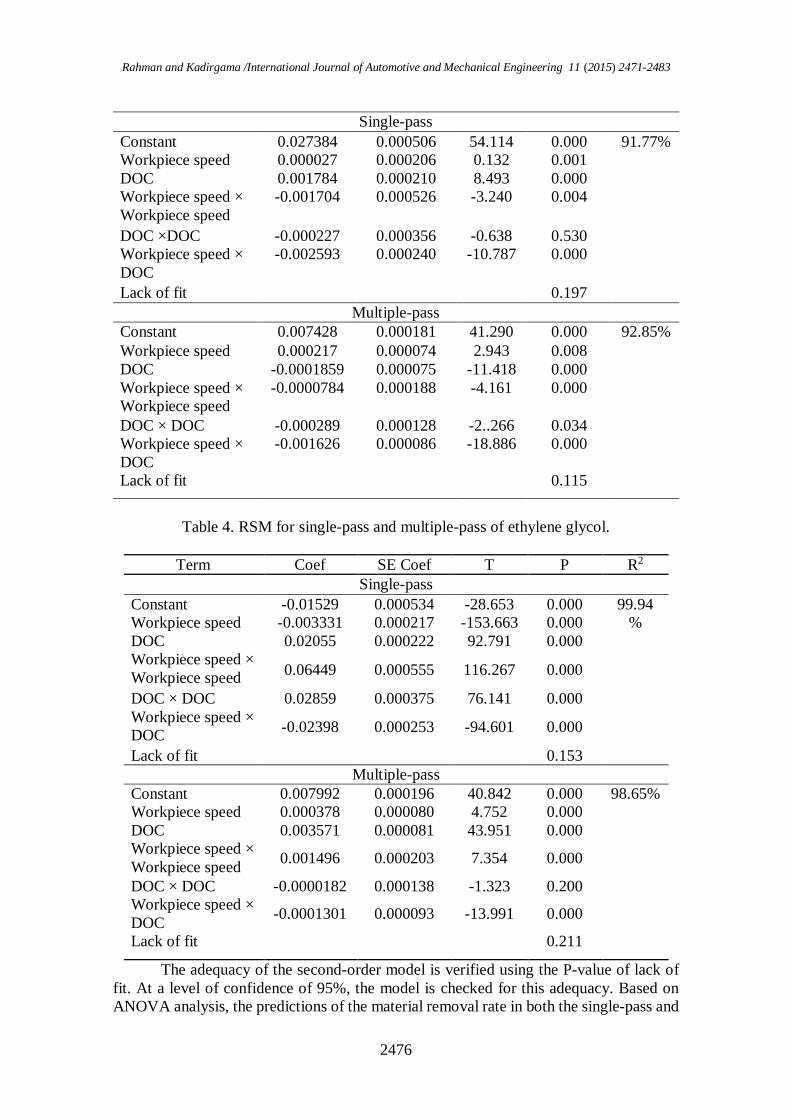
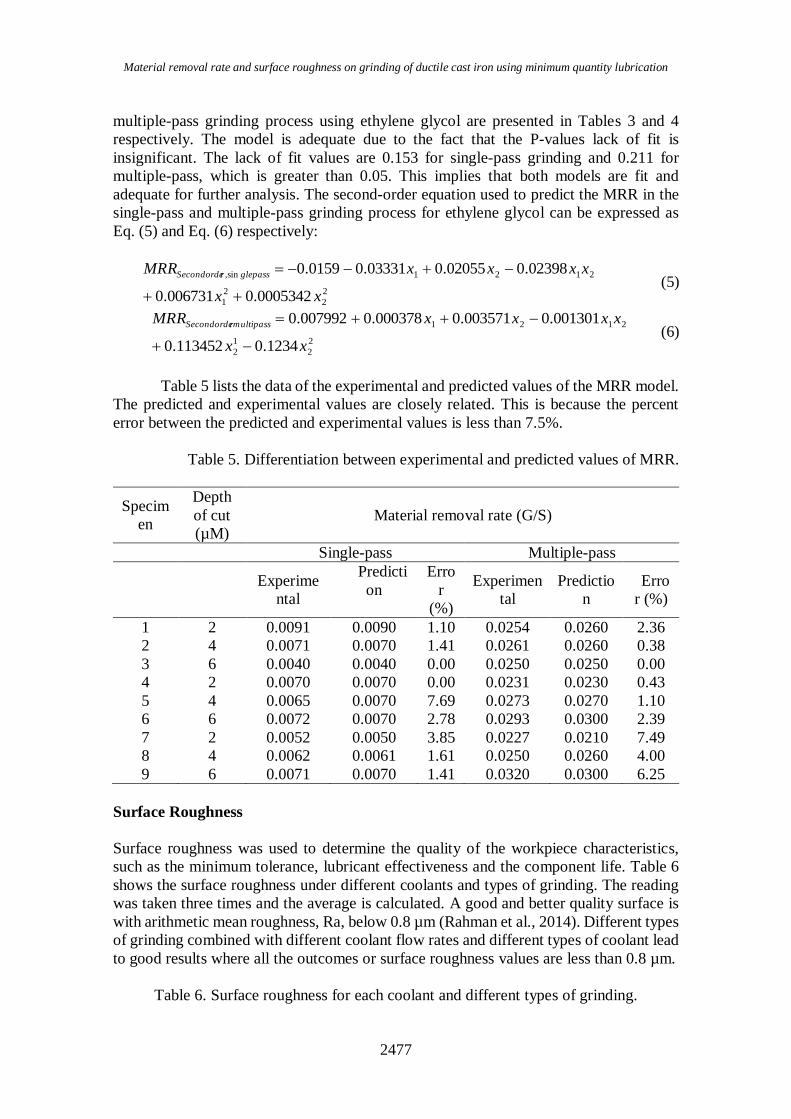
The adequacy of the second-order model is verified using the P-value of lack of
fit. At a level of confidence of 95%, the model is checked for this adequacy. Based on
ANOVA analysis, the predictions of the material removal rate in both the single-pass and
Material removal rate and surface roughness on grinding of ductile cast iron using minimum quantity lubrication
2477
multiple-pass grinding process using ethylene glycol are presented in Tables 3 and 4
respectively. The model is adequate due to the fact that the P-values lack of fit is
insignificant. The lack of fit values are 0.153 for single-pass grinding and 0.211 for
multiple-pass, which is greater than 0.05. This implies that both models are fit and
adequate for further analysis. The second-order equation used to predict the MRR in the
single-pass and multiple-pass grinding process for ethylene glycol can be expressed as
Eq. (5) and Eq. (6) respectively:
2
2
2
1
2121sin,
0005342.0006731.0
02398.002055.003331.00159.0
xx
xxxxMRR glepassrSecondorde
(5)
2
2
1
2
2121
1234.0113452.0
001301.0003571.0000378.0007992.0
xx
xxxxMRR rmultipassSecondorde
(6)
Table 5 lists the data of the experimental and predicted values of the MRR model.
The predicted and experimental values are closely related. This is because the percent
error between the predicted and experimental values is less than 7.5%.
Table 5. Differentiation between experimental and predicted values of MRR.
Specim
en
Depth
of cut
(µM)
Material removal rate (G/S)
Single-pass Multiple-pass
Experime
ntal
Predicti
on
Erro
r
(%)
Experimen
tal
Predictio
n
Erro
r (%)
1 2 0.0091 0.0090 1.10 0.0254 0.0260 2.36
2 4 0.0071 0.0070 1.41 0.0261 0.0260 0.38
3 6 0.0040 0.0040 0.00 0.0250 0.0250 0.00
4 2 0.0070 0.0070 0.00 0.0231 0.0230 0.43
5 4 0.0065 0.0070 7.69 0.0273 0.0270 1.10
6 6 0.0072 0.0070 2.78 0.0293 0.0300 2.39
7 2 0.0052 0.0050 3.85 0.0227 0.0210 7.49
8 4 0.0062 0.0061 1.61 0.0250 0.0260 4.00
9 6 0.0071 0.0070 1.41 0.0320 0.0300 6.25
Surface Roughness
Surface roughness was used to determine the quality of the workpiece characteristics,
such as the minimum tolerance, lubricant effectiveness and the component life. Table 6
shows the surface roughness under different coolants and types of grinding. The reading
was taken three times and the average is calculated. A good and better quality surface is
with arithmetic mean roughness, Ra, below 0.8 µm (Rahman et al., 2014). Different types
of grinding combined with different coolant flow rates and different types of coolant lead
to good results where all the outcomes or surface roughness values are less than 0.8 µm.
Table 6. Surface roughness for each coolant and different types of grinding.

Rahman and Kadirgama /International Journal of Automotive and Mechanical Engineering 11 (2015) 2471-2483
2478
Specimen
Workpiece
speed
(rpm)
Depth
of cut
(µm)
Surface roughness (µm)
Single-pass Multiple-pass
Conventional
coolants
Ethylene
glycol
(MQL)
Conventional
coolants
Ethylene
glycol
(MQL)
1 8.7 2 0.21400 0.44100 0.29110 0.37900
2 8.7 4 0.16430 0.35900 0.33730 0.421100
3 8.7 6 0.25760 0.43200 0.54720 0.53300
4 12.5 2 0.24300 0.46300 0.38300 0.39800
5 12.5 4 0.17300 0.33300 0.41820 0.36100
6 12.5 6 0.23400 0.34700 0.53200 0.40600
7 25.2 2 0.35600 0.55000 0.36720 0.41100
8 25.2 4 0.25300 0.41700 0.38420 0.37700
9 25.2 6 0.31900 0.41900 0.48250 0.40800
The RSM for surface roughness shows the good performance of the grinding
machine with a significant p-value of analysis of variance that is below 0.05, with lack of
fit more than 0.005 and the R-square value more than 90%. This implies that all the data
is fit and adequate. This shows that all the parameters have significance for the grinding
performance and surface roughness. The second-order linear equations used to predict the
surface roughness in the single- and multiple-pass grinding processes of ethylene glycol
are Eq. (7) and Eq. [19] respectively:
2
2
1
2
2121sin,
1053.004762.0
03042.004041.002428.028592.0
xx
xxxxSR glepassFirstorder
(7)
2
2
1
2
2121,
023.0135.0
03940.003681.001456.036273.0
xx
xxxxSR multipassFirstorder
(8)
(a) Grinding using ethylene glycol. (b) Grinding using conventional coolant.
Figure 2. Scanning 2D microscope.
Table 7 lists the experimental and predicted results for surface roughness. The
predicted and experimental values are closely related. The error between the predicted
and experimental results is within 10%, which is reasonable and acceptable. Figure 2
shows the surfaces of the specimens for ethylene glycol and conventional coolant. No
cavities, peaks or valleys are seen on grinding using ethylene glycol. This shows that
Cavity
Grinding mark
Peak and
valley
Grinding mark

Material removal rate and surface roughness on grinding of ductile cast iron using minimum quantity lubrication
2479
ethylene glycol removed the heat and reduced friction better than the conventional
coolant.
Table 7. Differentiation between experimental and predicted results for surface
roughness.
Specimen
Depth
of cut (µm)
Surface roughness (Ra), µm
Single-pass Multiple-pass
Experimental Prediction Error
(%) Experimental Prediction
Error
(%)
1 2 0.4410 0.4510 2.27 0.3790 0.3760 0.79
2 4 0.3590 0.3680 2.51 0.4210 0.4130 1.90
3 6 0.4320 0.4320 0.00 0.5330 0.5280 0.94
4 2 0.4360 0.4600 5.50 0.3980 0.3890 2.26
5 4 0.3330 0.3300 0.90 0.3610 0.3650 1.11
6 6 0.3470 0.3470 0.00 0.4060 0.4200 3.45
7 2 0.5500 0.5610 2.00 0.4110 0.3760 8.52
8 4 0.4170 0.4160 0.24 0.3770 0.4130 9.55
9 6 0.4190 0.4200 0.24 0.4080 0.4280 4.90
Tool Wear and G-Ratio
The G-ratio is the value of material removal rate per value of tool wear. This value shows
the interaction between the MRR and tool wear. The higher the value of the G-ratio, the
better the grinding method is. Tool wear occurs when there is metal-to-metal contact
between the chip and workpiece, especially under very high stress at high temperature.
This situation is further aggravated due to the existence of extreme stress and temperature
gradients near the surface of the tool. For this experiment, the tool wear was measured.
The measurement was taken three times. During grinding, cutting wheels remove material
from the workpiece to achieve the required shape, dimension, and surface roughness.
However, tool wear occurs during the grinding action and will ultimately result in the
failure of the cutting wheel. When the tool wear reaches a certain level (0.3 mm), the tool
has to be replaced to guarantee the desired cutting action. The tool wear was measured in
mm using a Taylorsurf profilometer. Several readings were taken and the average was
calculated. Table 8 illustrates the tool wear for ethylene glycol and conventional coolant.
In industry, tool wear should be minimized to ensure a good quality finish, precision, and
cost. It can be seen that the pattern of the wear increases as the depth of cut and table
speed increase for multiple-pass grinding. The ethylene glycol reduces the wear by almost
50% compared to the conventional coolant. This is due to the ethylene glycol reducing
the friction between the two contact surfaces.
Table 8. Tool wear for each coolant and type of grinding.
Specimen Tool wear (cm)
Single-pass Multiple-pass

Rahman and Kadirgama /International Journal of Automotive and Mechanical Engineering 11 (2015) 2471-2483
2480
Workpiece
speed
(rpm)
Depth
of cut
(µm)
Conventional
coolants
Ethylene
glycol
(MQL)
Conventional
coolants
Ethylene
glycol
(MQL)
1 8.7 2 0.10 0.05 0.10 0.05
2 8.7 4 0.10 0.05 0.15 0.05
3 8.7 6 0.15 0.05 0.15 0.05
4 12.5 2 0.15 0.05 0.25 0.05
5 12.5 4 0.15 0.10 0.30 0.10
6 12.5 6 0.25 0.10 0.30 0.10
7 25.2 2 0.25 0.10 0.35 0.15
8 25.2 4 0.30 0.10 0.40 0.15
9 25.2 6 0.35 0.15 0.45 0.20
(a) Single-pass grinding
(b) Multiple-pass grinding
Figure 3. G-ratio of single- and multiple-pass grinding with different coolants.
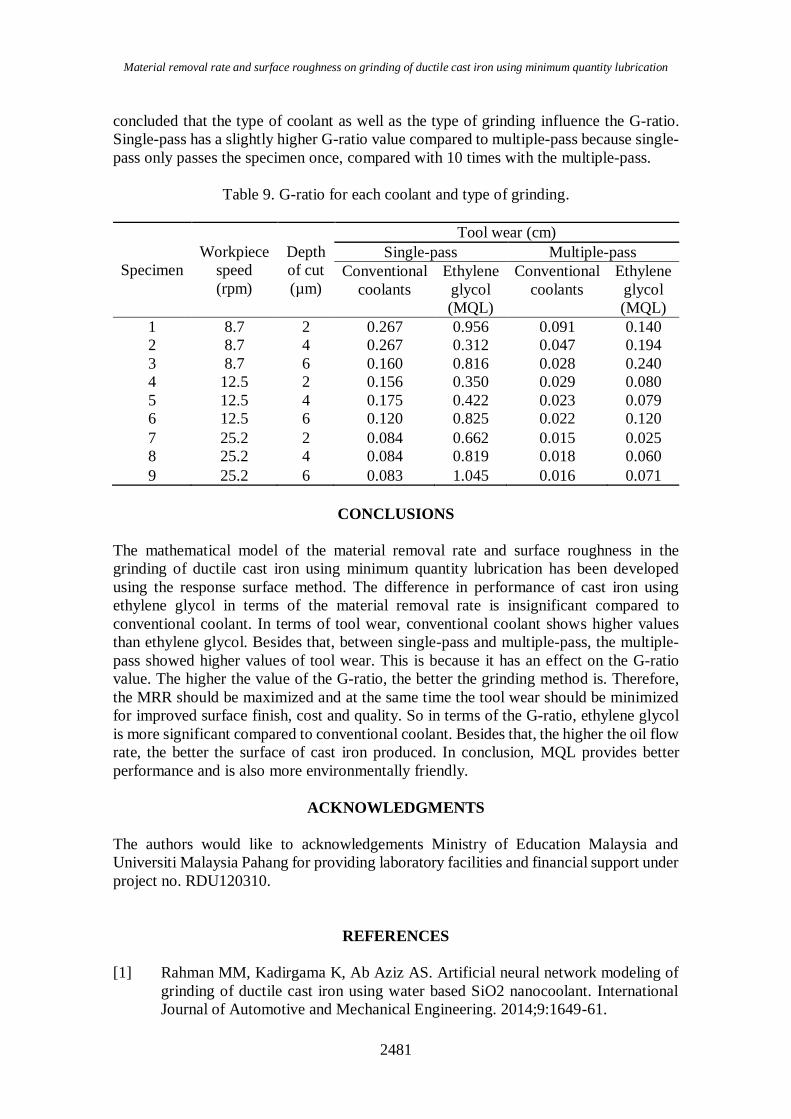
From Table 9 and Figure 3, it can be concluded that single-pass grinding with
ethylene glycol has the highest value of G-ratio, followed by single-pass conventional
coolant, multiple-pass ethylene glycol and lastly multiple-pass conventional coolant. As
stated before, a higher value of G-ratio means that the method of grinding is better. It is
0.00
0.20
0.40
0.60
0.80
1.00
1.20
1 2 3 4 5 6 7 8 9
G-ratio
Specimen
ConventionalCoolant
0.00
0.05
0.10
0.15
0.20
0.25
1 2 3 4 5 6 7 8 9
G-r
ati
o
Specimen
ConventionalCoolant
Material removal rate and surface roughness on grinding of ductile cast iron using minimum quantity lubrication
2481
concluded that the type of coolant as well as the type of grinding influence the G-ratio.
Single-pass has a slightly higher G-ratio value compared to multiple-pass because single-
pass only passes the specimen once, compared with 10 times with the multiple-pass.
Table 9. G-ratio for each coolant and type of grinding.
Specimen
Workpiece
speed
(rpm)
Depth
of cut
(µm)
Tool wear (cm)
Single-pass Multiple-pass
Conventional
coolants
Ethylene
glycol
(MQL)
Conventional
coolants
Ethylene
glycol
(MQL)
1 8.7 2 0.267 0.956 0.091 0.140
2 8.7 4 0.267 0.312 0.047 0.194
3 8.7 6 0.160 0.816 0.028 0.240
4 12.5 2 0.156 0.350 0.029 0.080
5 12.5 4 0.175 0.422 0.023 0.079
6 12.5 6 0.120 0.825 0.022 0.120
7 25.2 2 0.084 0.662 0.015 0.025
8 25.2 4 0.084 0.819 0.018 0.060
9 25.2 6 0.083 1.045 0.016 0.071
CONCLUSIONS
The mathematical model of the material removal rate and surface roughness in the
grinding of ductile cast iron using minimum quantity lubrication has been developed
using the response surface method. The difference in performance of cast iron using
ethylene glycol in terms of the material removal rate is insignificant compared to
conventional coolant. In terms of tool wear, conventional coolant shows higher values
than ethylene glycol. Besides that, between single-pass and multiple-pass, the multiple-
pass showed higher values of tool wear. This is because it has an effect on the G-ratio
value. The higher the value of the G-ratio, the better the grinding method is. Therefore,
the MRR should be maximized and at the same time the tool wear should be minimized
for improved surface finish, cost and quality. So in terms of the G-ratio, ethylene glycol
is more significant compared to conventional coolant. Besides that, the higher the oil flow
rate, the better the surface of cast iron produced. In conclusion, MQL provides better
performance and is also more environmentally friendly.
ACKNOWLEDGMENTS
The authors would like to acknowledgements Ministry of Education Malaysia and
Universiti Malaysia Pahang for providing laboratory facilities and financial support under
project no. RDU120310.
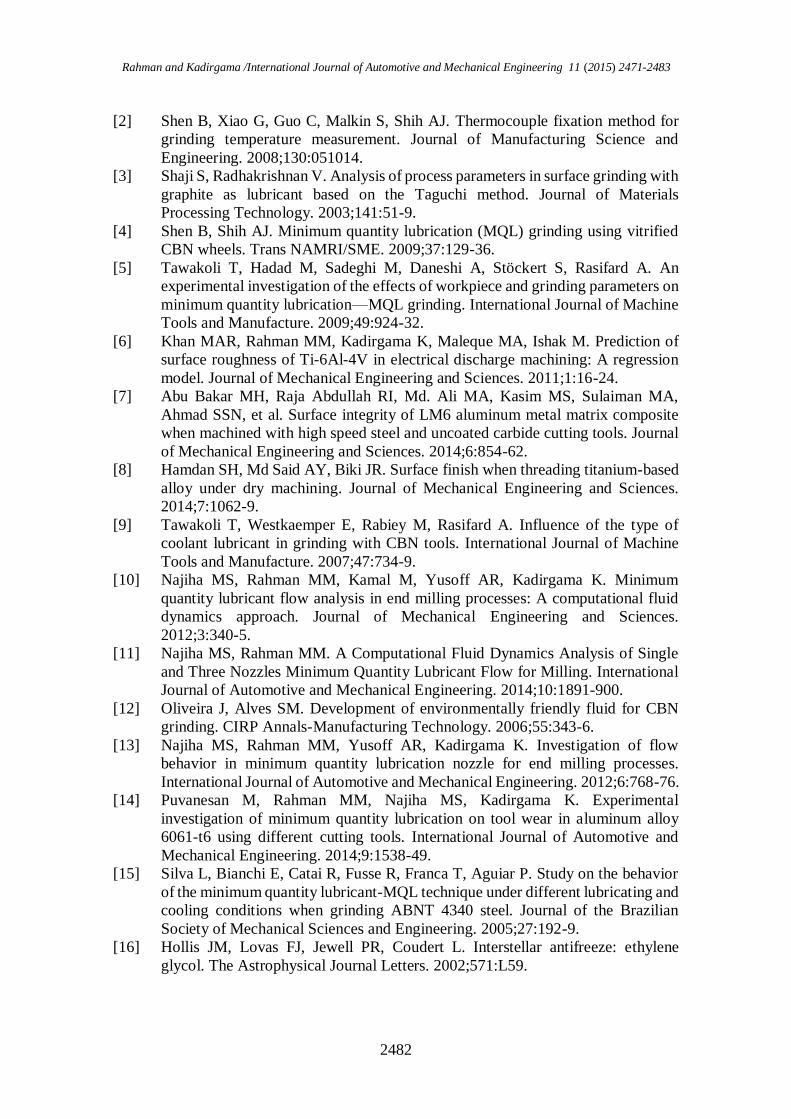
REFERENCES
[1] Rahman MM, Kadirgama K, Ab Aziz AS. Artificial neural network modeling of
grinding of ductile cast iron using water based SiO2 nanocoolant. International
Journal of Automotive and Mechanical Engineering. 2014;9:1649-61.
Rahman and Kadirgama /International Journal of Automotive and Mechanical Engineering 11 (2015) 2471-2483
2482
[2] Shen B, Xiao G, Guo C, Malkin S, Shih AJ. Thermocouple fixation method for
grinding temperature measurement. Journal of Manufacturing Science and
Engineering. 2008;130:051014.
[3] Shaji S, Radhakrishnan V. Analysis of process parameters in surface grinding with
graphite as lubricant based on the Taguchi method. Journal of Materials
Processing Technology. 2003;141:51-9.
[4] Shen B, Shih AJ. Minimum quantity lubrication (MQL) grinding using vitrified
CBN wheels. Trans NAMRI/SME. 2009;37:129-36.
[5] Tawakoli T, Hadad M, Sadeghi M, Daneshi A, Stöckert S, Rasifard A. An
experimental investigation of the effects of workpiece and grinding parameters on
minimum quantity lubrication—MQL grinding. International Journal of Machine
Tools and Manufacture. 2009;49:924-32.
[6] Khan MAR, Rahman MM, Kadirgama K, Maleque MA, Ishak M. Prediction of
surface roughness of Ti-6Al-4V in electrical discharge machining: A regression
model. Journal of Mechanical Engineering and Sciences. 2011;1:16-24.
[7] Abu Bakar MH, Raja Abdullah RI, Md. Ali MA, Kasim MS, Sulaiman MA,
Ahmad SSN, et al. Surface integrity of LM6 aluminum metal matrix composite
when machined with high speed steel and uncoated carbide cutting tools. Journal
of Mechanical Engineering and Sciences. 2014;6:854-62.
[8] Hamdan SH, Md Said AY, Biki JR. Surface finish when threading titanium-based
alloy under dry machining. Journal of Mechanical Engineering and Sciences.
2014;7:1062-9.
[9] Tawakoli T, Westkaemper E, Rabiey M, Rasifard A. Influence of the type of
coolant lubricant in grinding with CBN tools. International Journal of Machine
Tools and Manufacture. 2007;47:734-9.
[10] Najiha MS, Rahman MM, Kamal M, Yusoff AR, Kadirgama K. Minimum
quantity lubricant flow analysis in end milling processes: A computational fluid
dynamics approach. Journal of Mechanical Engineering and Sciences.
2012;3:340-5.
[11] Najiha MS, Rahman MM. A Computational Fluid Dynamics Analysis of Single
and Three Nozzles Minimum Quantity Lubricant Flow for Milling. International
Journal of Automotive and Mechanical Engineering. 2014;10:1891-900.
[12] Oliveira J, Alves SM. Development of environmentally friendly fluid for CBN
grinding. CIRP Annals-Manufacturing Technology. 2006;55:343-6.
[13] Najiha MS, Rahman MM, Yusoff AR, Kadirgama K. Investigation of flow
behavior in minimum quantity lubrication nozzle for end milling processes.
International Journal of Automotive and Mechanical Engineering. 2012;6:768-76.
[14] Puvanesan M, Rahman MM, Najiha MS, Kadirgama K. Experimental
investigation of minimum quantity lubrication on tool wear in aluminum alloy
6061-t6 using different cutting tools. International Journal of Automotive and
Mechanical Engineering. 2014;9:1538-49.
[15] Silva L, Bianchi E, Catai R, Fusse R, Franca T, Aguiar P. Study on the behavior
of the minimum quantity lubricant-MQL technique under different lubricating and
cooling conditions when grinding ABNT 4340 steel. Journal of the Brazilian
Society of Mechanical Sciences and Engineering. 2005;27:192-9.
[16] Hollis JM, Lovas FJ, Jewell PR, Coudert L. Interstellar antifreeze: ethylene
glycol. The Astrophysical Journal Letters. 2002;571:L59.
Material removal rate and surface roughness on grinding of ductile cast iron using minimum quantity lubrication
2483
[17] Boersma BJ. A 6th order staggered compact finite difference method for the
incompressible Navier–Stokes and scalar transport equations. Journal of
Computational Physics. 2011;230:4940-54.
[18] Myers RH, Montgomery DC, Anderson-Cook CM. Response surface
methodology: process and product optimization using designed experiments: John
Wiley & Sons; 2009.