Microstructure, mechanical properties and fractography of ...

Mr
JA
a
A
R
R
2
A
K
C
R
M
S
H
I
F
F
F
F
R
1
Rtai
b
0d
d e n t a l m a t e r i a l s 2 6 ( 2 0 1 0 ) 589–599
avai lab le at www.sc iencedi rec t .com
journa l homepage: www. int l .e lsev ierhea l th .com/ journa ls /dema
aterial properties and fractography of an indirect dentalesin composite
anet B. Quinn, George D. Quinn ∗
DAF Paffenbarger Research Center, NIST, Gaithersburg, MD, USA
r t i c l e i n f o
rticle history:
eceived 3 September 2009
eceived in revised form
December 2009
ccepted 23 February 2010
eywords:
omposite
esin
aterial properties
trength
ardness
ndentation size effect
ractography
racture mirror
racture origin
a b s t r a c t
Objectives. Determination of material and fractographic properties of a dental indirect resin
composite material.
Methods. A resin composite (Paradigm, 3M-ESPE, MN) was characterized by strength, static
elastic modulus, Knoop hardness, fracture toughness and edge toughness. Fractographic
analyses of the broken bar surfaces was accomplished with a combination of optical and
SEM techniques, and included determination of the type and size of the failure origins, and
fracture mirror and branching constants.
Results. The flexure test mean strength ± standard deviation was 145 ± 17 MPa, and edge
toughness, Te, was 172 ± 12 N/mm. Knoop hardness was load dependent, with a plateau
at 0.99 ± 0.02 GPa. Mirrors in the bar specimens were measured with difficulty, resulting in
a mirror constant of approximately 2.6 MPa m1/2. Fracture in the bar specimens initiated
at equiaxed material flaws that had different filler concentrations that sometimes were
accompanied by partial microcracks. Using the measured flaw sizes, which ranged from
35 to 100 �m in size, and using estimates of the stress intensity shape factors, fracture
toughness was estimated to be 1.1 ± 0.2 MPa m1/2.
Significance. Coupling the flexure tests with fractographic examination enabled identification
of the intrinsic strength limiting flaws. The same techniques could be useful in determin-
ailure analysis
-Curve
ing if clinical restorations of similar materials fail from the same causes. The existence
of a strong load-dependence of the Knoop hardness of the resin composite is not generally
mentioned in the literature, and is important for material comparisons and wear evaluation
studies. Finally, the edge toughness test was found promising as a quantitative measure of
resistance to edge chipping, an important failure mode in this class of materials.
emy
associated fractographic analysis. This is important, as mea-
© 2010 Acad
. Introduction
esin composites are becoming increasingly important in den-
istry, with expanding application resulting from processingnd material innovations [1,2]. Many of the improvementsn this class of materials, particularly those stemming∗ Corresponding author at: ADAF Paffenbarger Research Center, Mailstourg, MD 20878, USA. Tel.: +1 301 975 5765; fax: +1 301 963 9143.
E-mail address: [email protected] (G.D. Quinn).109-5641/$ – see front matter © 2010 Academy of Dental Materials. Puoi:10.1016/j.dental.2010.02.008
of Dental Materials. Published by Elsevier Ltd. All rights reserved.
from filler particle type and loading increases, are basedon material property measurements. Among the publisheddental composite strength values, however, there is little
p 8546, National Institute of Standards and Technology, Gaithers-
sured material strength alone is not necessarily indicativeof the causes of restoration failure or clinical longevity[3].
blished by Elsevier Ltd. All rights reserved.

l s 2
590 d e n t a l m a t e r i aFor brittle materials outside the dental field, systematiccorrelations of strength test values and component perfor-mance commonly use fractographic analyses [4]. A studyof commercial glass-ceramics, a class of materials widelyused in dentistry, determined that different batches hadidentical elastic moduli, fracture toughnesses, densities andmicrostructures, but very different failure loads due to avariation in flaw type [5]. Similar examples can be foundfor alumina-based ceramics [6,7]. Fractographic examinationis essential for critical flaw determination and componentstrength predictions for brittle materials.
Among brittle materials, highly filled resin compositesare somewhat neglected in fractographic analyses [8]. Thisclass of materials falls “in between” polymers and ceramics.Fractographic specialists in either field find features difficultto discern when they are masked by rough microstructuresthat are often typical in failed composite components [9]. Animportant but overlooked resource is a 1989 book on fractogra-phy of polymers and composites by Roulin-Moloney [10] whichincludes a chapter on unfilled and filled epoxy resins.
In this study, mechanical property testing and frac-tographic analysis was applied to a commercial dentalcomposite. The well-characterized stress configuration ofa simple bend bar can be very helpful in relating fracto-graphic markings to behavior, especially in an unfamiliar“fractographically difficult” material. The translucency of thematerial evaluated in the present study initially made exam-ination difficult, but with proper illumination, the relevantfeatures became easy to detect and interpret. Once the cor-rect fracture origin areas were identified by optical microcopy,then scanning electron microscopy was used to characterizethe fracture origins. The very fine size of the filler particles alsohelped since the fracture surface was not too rough. Coarse-or medium-sized fillers lead to very rough fracture surfacesthat can mask critical fractographic markings. Property testsalso included edge chipping characterization, an importantfailure mechanism for composite dental restorations [11]. Theemphasis of the resin composite property tests and fractogra-phy of this study is on practical analyses that could be relevantto failure investigations of resin composite restorations. Ournull hypothesis is that fractographic analysis can be used toidentify key features associated with the mechanical proper-ties.
2. Materials and methods
2.1. Material
Dental resin composite mill blocks (Paradigm, 3 M ESPE, St.1
Paul, MN) were donated by the manufacturer for the propertytests. The company literature [e.g., [12,13]] lists the mate-rial as containing 0.85 mass fraction spherical sol gel derivedparticles comprising nanocrystalline zirconia in silica. The
1 Commercial products and equipment are identified only tospecify adequately experimental procedures and does not implyendorsement by the authors, institutions or organizations sup-porting this work, nor does it imply that they are necessarily thebest for the purpose.
6 ( 2 0 1 0 ) 589–599
spherical particles averaged 0.6 �m in size, but had a broad sizedistribution, within a highly cross-linked polymeric matrix ofbis-GMA and TEGDMA. A silane aided bonding to the filler. Theflexural strength, �f, is reported to be 145 ± 15 MPa; fracturetoughness, KIc is 1.3 ± 0.1 MPa m1/2; and a Young’s modulus incompression of about 7 GPa and a flexural modulus of about12 GPa. The company literature does not include a statementof uncertainty with the material description.
2.2. Strength
Bars (n = 18) were professionally machined (BOMAS,Somerville, MA) and finished according to the recom-mendations in ASTM C1161 [14], which is intended for usewith brittle ceramics, but is also useful for brittle filledcomposites. Because of limitations in the length of the orig-inal resin composite cylinder blanks, the final bar sizes of3 mm × 4 mm × 18 mm were much shorter than the > 40 mmspecimen size B specimen lengths in the referenced standard.Small bevels were applied to all four long edges to elimi-nate any edge damage. Short, stubby bend bars should notbe tested in 4-point bending because excessive errors canresult [15], (e.g., from tiny fixture misalignments or wedgingstresses at the contact points) so in this instance 3-point waspreferred, albeit at the cost of exposing only a tiny portion ofthe bar to the full tensile stresses. The bars were broken on anInstron Universal Testing Machine (Model 1122, Canton, MA)in 3-point flexure with a crosshead speed of 0.5 mm/min. Thesemi-articulating, self-aligning fixture had a 16 mm outsideroller span and the rollers were free to roll to eliminate frictionerrors. The fracture stress, �f, was calculated by the formula:
�f = 3PL
2(width × height2) (1)
where P is the break load and L is the 16 mm span. The spec-imen widths and heights were measured with a micrometerwith a resolution of 0.001 mm. The Weibull parameters wereestimated by maximum likelihood estimation (MLE)2 in accor-dance with ASTM C 1239 [16].
2.3. Elastic modulus
This property was evaluated by measuring the deflectionof the flexural strength bars. The machine compliance wasobtained by inserting a large alumina block in the fixtures andrepeatedly loading to 100 N. The resulting displacement mea-surement was assumed to be due entirely to the machine, loadcell and fixtures, and was subtracted from the displacement
measured in the flexural tests for the same load increment, �P,to obtain the displacement solely due to specimen flexure. Thestatic elastic modulus, E, of the resin composite could then be2 MLE analysis is favored by many and used in many interna-tional standards since the confidence band intervals on Weibullparameter estimates are tighter than those from linear regressionanalysis.
2 6
c
E
wm
2
KsHiiftH0nsithcaww
2
ErcndffsalpaicfeiCiartt
2
FwP
d e n t a l m a t e r i a l s
alculated by:
= �P × L3
4(width × height3 × specimen displacement) (2)
here �P is the load differential for a finite specimen displace-ent taken at midspan.
.4. Hardness
noop hardness values (HK) were obtained using a Wil-on/Instron Tukon Model 300 Hardness Machine (Canton, MA).ardness values of brittle materials generally increase as
ndentation forces decrease, a phenomenon known as thendentation size effect (ISE) [17]. Because of the ISE, a specifiedorce or functional relationship over a test range is necessaryo accurately compare the hardness of brittle dental materials.ardness measurements were made at forces ranging from.25 to 9.8 N, with ten indentations at each force. The hard-ess at the three highest forces (4.9, 6.9 and 9.8 N) showed noignificant difference using Tukey’s multiple pairwise compar-son at 99% family confidence level. The combined data fromhese three loads constitute the reported load-independentardness. The hardness readings were made in air under roomonditions, but ten indentations at 9.8 N were also made on
specimen surface wet with distilled water to determinehether the surface environment and short time exposure toater had any influence on hardness.
.5. Edge toughness
dge toughness (also known as edge strength or edge flakingesistance) measures the susceptibility of a material to edgehipping [18–25]. In this test, an increasing force is appliedear the edge of a specimen until a chip is formed. At greateristances from the specimen edge, higher forces are requiredor chip formation. A plot can be constructed by plotting theorce necessary to form a chip against the distance from thepecimen edge. The slope of a straight line resulting from suchplot constitutes the edge toughness, Te, although a power
aw often better fits the edge toughness plot for glasses andorcelains [23,24]. High values of Te, or steep plots, indicatematerial is highly resistant to edge chipping. Low Te values
ndicate that large chips form at low loads, and the materialhips easily. Other indenter shapes are now in use, but we pre-er to use a sharp conical indenter since they are inexpensive,asy to replace, and the indentation shape is self similar asndentation load is increased. An Engineering Systems ModelK 10 edge-chip machine (Nottingham, UK), fitted with a con-
cal 120◦ diamond scribe indenter, was used to form chipsnd measure forces in this study. The tip was sharp, with aadius of less than 10 �m. More detailed descriptions and pho-ographs of the equipment that was used in the edge chippingest are included in Ref. [25].
.6. Fractography
ractographic examination and measurements were madeith a scanning electron microscope (SEM) (JEOL 5300,
eabody, MA) at up to 1500× and a stereoptical microscope
( 2 0 1 0 ) 589–599 591
(Leica MZ16, Wetzlar, Germany) at up to 92×. The translu-cency and internal light scattering hampered conventionalreflected light optical observation of fracture surface markingsso special illumination procedures were required. For opticalexaminations of the bar specimen fracture surfaces, tran-sillumination was particularly helpful in identifying fractureorigins, and oblique lighting on gold-coated surfaces aidedfracture mirror boundary delineation. It was critical to havedirected illumination from one or two fiber optic light guides(as opposed to a ring light) for these examinations. The opticalmicroscope was equipped with a traveling stage enabling sizemeasurements with a resolution of 1 �m. Additional informa-tion about the fractographic techniques and equipment maybe found in Ref. [26].
Fracture mirrors were detected and their sizes measuredafter the specimen surfaces were gold coated to make the frac-ture surface easier to interpret. Mirror sizes are related to thefracture stress by Orr’s equation [26,27]:
�f = A(R)−1/2 (3)
where R is the mirror radius and A is a materials propertyknown as the mirror constant which has units of MPa m1/2.Ref. [26] has detailed tabulations of A values for glasses andceramics. A similar relationship exists for fracture branching,where the crack first splits into two or more cracks. Branchingdistances were measured along the tension surface.
2.7. Fracture toughness
Attempts were made to measure fracture toughness by thesurface crack in flexure (SCF) method in accordance withASTM C 1421 [28]. This method has been successfully appliedto dental porcelains [29], but was unsuccessful with the com-posite resin in this study. The SCF method uses a Knoopindentation to create a median crack in a bend bar. The inden-tation residual stress damage zone is removed by polishing,the bar is broken in four-point bending, the fracture strengthcomputed, the median crack size is measured on the frac-ture surface, and appropriate formulas for the stress intensity[28] used to compute fracture toughness. Although this den-tal composite resin is brittle, indentation loads up to 4.9 N didnot create large median type cracks beneath the indentation.Large indentations, nearly a millimeter in length, were createdbut the material was too soft to form subsurface semiellipticalcracks. Fracture toughness estimates were instead obtainedfrom the intrinsic flaws in the eighteen flexural strength testspecimens. The flaws were modeled by simple elliptical orsemi-elliptical cracks located at the specimen surface or inthe interior. In the latter case, which occurred for three flexuraltest specimens, the stresses were corrected for the origin loca-tion beneath the surface. Fracture toughness was computedby:
KIc = Y�f√
a (4)
where Y is geometric stress intensity shape factor, �f is thefracture stress, and a is the flaw size. Y factors were calculatedin accordance with the Newman–Raju stress intensity equa-tions in Refs. [28,30,31] for shallow semielliptical surface flaws

592 d e n t a l m a t e r i a l s 2 6 ( 2 0 1 0 ) 589–599
Fig. 1 – Material properties of the resin composite specimens: (a) Weibull graph of composite strengths, (b) Knoop hardnesspingto th
plot illustrating the hardness/load dependence, (c) edge chipThe small, barely visible darker area (black arrow) is similar
and Refs. [30,31] for deep semielliptical surface flaws or fullyelliptical flaws in the interior. The flaw sizes were measured onscanning electron microscope images at 500× to 1500× mag-nification so that the flaw covered at least half the field ofview. Additional measurements were made with the travers-ing stage and stereoptical microscope at 92× magnification.
3. Results
3.1. Material properties
The average fracture strength, �f, was 145 MPa and the stan-dard deviation was 17 MPa.3 The load displacement traceswere linear to fracture. Fig. 1a shows a Weibull graph for the
3 Unless otherwise stated, all uncertainties are one standarddeviation.
plot and (d) top optical view of an edge chip (white arrow).ose found at the resin composite fracture origins.
18 data points. The unbiased maximum likelihood estimation(MLE) fit gave a Weibull modulus of 8.0 (90% confidence limitsas per [16]: 6.8–12.9) and a characteristic strength of 153 MPa(90% confidence limits: 145–161 MPa). The wiggles in the curveare not unusual for a small sample set of only 18 specimens.The two weakest specimens hint that there may be a thresholdstrength of the order of 100–120 MPa, but more testing wouldbe necessary to make any definitive conclusions. The staticflexural elastic modulus was 12.2 ± 0.8 GPa.
The Knoop hardness exhibited a strong indentation sizeeffect at low loads, as shown in Fig. 1b. There is no significantdifference (as defined in Section 2) among the hardness valuescollected after 4 N, and for loads greater than this, the load-independent Knoop hardness is 0.99 ± 0.02 GPa. The measured
Knoop hardness of the specimens indented under distilledwater was not significantly different at 0.98 ± 0.01 GPa.The edge toughness plot for the resin composite comprisesFig. 1c. Two curve fits are shown for comparison: one is a lin-

d e n t a l m a t e r i a l s 2 6 ( 2 0 1 0 ) 589–599 593
Fig. 2 – Side view of typical broken flexure bars, showingthe compression curls. The tensile surface is on the bottom.T
easRtfiotatprd
3
Mcfbstmhscm
Fig. 3 – A flexure bar fracture surface. (a) Opticaltransillumination shows the fracture origin from whichfracture originated (arrow). A second similar feature iscircled, indicating this feature type is volume distributed.(b) The SEM photo of the origin flaw (arrows) shows thealuminum inclusion origin with partial microcracking
he white labels indicate the flexure strength of each bar.
ar and the other a power law fit. As in many glass-ceramics,power law fits the data well [23,24], as shown by the least
quares fitted dotted line, with a coefficient of determination,2, of 0.95. The power law fit is: chip force (N) = 366 × (edge dis-ance in mm)1.72. The plot also shows a solid linear regressiont that does not go through zero. The linear fit has the same R2
f 0.95 and the relationship is: chip force (N) = 171.5 × (edge dis-ance in mm) − 10.5 mm. The slope of the linear fit is defineds the edge toughness: Te = 171.5 ± 11.5 N/mm. Fig. 1d is a pho-omicrograph of a typical edge chip. The black arrow in thehoto points to a small dark inhomogeneity within the mate-ial. Such inhomogeneites were the strength limiting flaws asiscussed in the next section.
.2. Fractography
any fractographic features similar to those found in failederamic components (compression curl, branching, hackle,racture mirror) were found in the dental composite flexurears. Fig. 2 shows side views of typical broken specimens. Thepecimen compression zones at the top of the bars exhibithe compression curl that results from flexure tests of brittle
aterials [26]. The specimens that broke at higher stresses
ave rougher surfaces and more crack branching. Highertrength specimens have greater stored elastic energy thatan be converted to specimen surface energy, thereby creatingore cracks and rougher surfaces.around its periphery.
Fig. 3 shows an optical (a) and a higher magnification SEM(b) micrograph of a specimen fracture surface. In Fig. 3a, tran-sillumination reveals a small dark area at the fracture origin(arrow). This finding was typical of all but three of the fracturedspecimens and the origin areas were sometimes discernableon only one specimen half. When the light is adjusted at dif-ferent angles, these small areas can easily be made to appeareither lighter or darker than the surrounding material. Withpatience, other similar small areas could be found away fromthe origins on or beneath the specimen machined surfaces aswell as on fracture surfaces. Examples are circled in the Fig. 3aphoto and indicated by the arrow in Fig. 1d. Such discontinu-ities were sometimes difficult to discern in the SEM and optical
photos were essential to facilitate finding the fracture originsin the SEM.The flaws ranged from elongated spheres to ellipticalregions with aspect ratios up to 2:1. The flaw diameters ranged

594 d e n t a l m a t e r i a l s 2 6 ( 2 0 1 0 ) 589–599
Fig. 4 – Optical images of an origin flaw in a flexure bar (138 MPa). Depending upon the lighting, the aluminum richt (a)
inclusion flaw (marked by arrows) may appear as a dark spofrom as low as 35 �m to as large as 100 �m. Initially it wasthought that the flaws were filler agglomerates or regions ofnonuniform mixing in the composite, but x-ray energy disper-sive analysis in the SEM revealed that 16 of the 18 fractureorigins were chemical heterogeneities or inclusions. Many ofthe origin sites had evidence of debonding around the flawperiphery. The debonding caused light to reflect at the flawperiphery, causing the flaws to stand out quite clearly as darkareas or bright spots if they reflected light back to the viewer.The majority of the flaws, such as those shown in Figs. 3–5,were aluminum rich, but two were calcium rich such as shownin Fig. 6.
Fig. 5a and b shows a fracture origin whereby transillu-mination was very effective. Hackle lines emanate from afracture mirror centered on the fracture origin which was adark spot at the edge chamfer. These first two images areincluded since, although they not entirely clear due to theinternal reflections and translucency, they nonetheless illus-trate what type of markings can be detected optically withthe right lighting. The SEM images of the mating half inFig. 5c and d reveal more about the character of the flaw. Thebackscattered electron mode (Fig. 5c) reveals the very differ-ent microstructure of the flaw compared to the surroundingmaterial. The secondary electron image (Fig. 5d) gives better
topographical information showing how the flaw has micro-cracking and partial detachment around its periphery. X-rayenergy dispersive analysis revealed this flaw was an alu-minum rich inclusion.or a bright spot (b). (c) shows the bar tilted at an angle.
Fig. 6 shows an internal fracture origin with an altogetherdifferent appearance than the surrounding material. The flawis a calcium rich inclusion which has very few filler particleswithin the flaw. There is also some porosity in the flaw.
The flaw sizes and shapes were used to estimate frac-ture toughness. The origins were often equiaxed in shape, butmany had elliptical or semielliptical cross sections. In everycase, the flaw width (2c) and depth (a or 2a, depending uponwhether the flaw was at the tensile surface or in the inte-rior) was measured and the appropriate dimensions used tocompute the Y factors and the fracture toughness in accor-dance with Eq. (4). The fracture toughness was calculated as1.1 ± 0.2 MPa m1/2.
3.3. Fracture mirror and branching constants
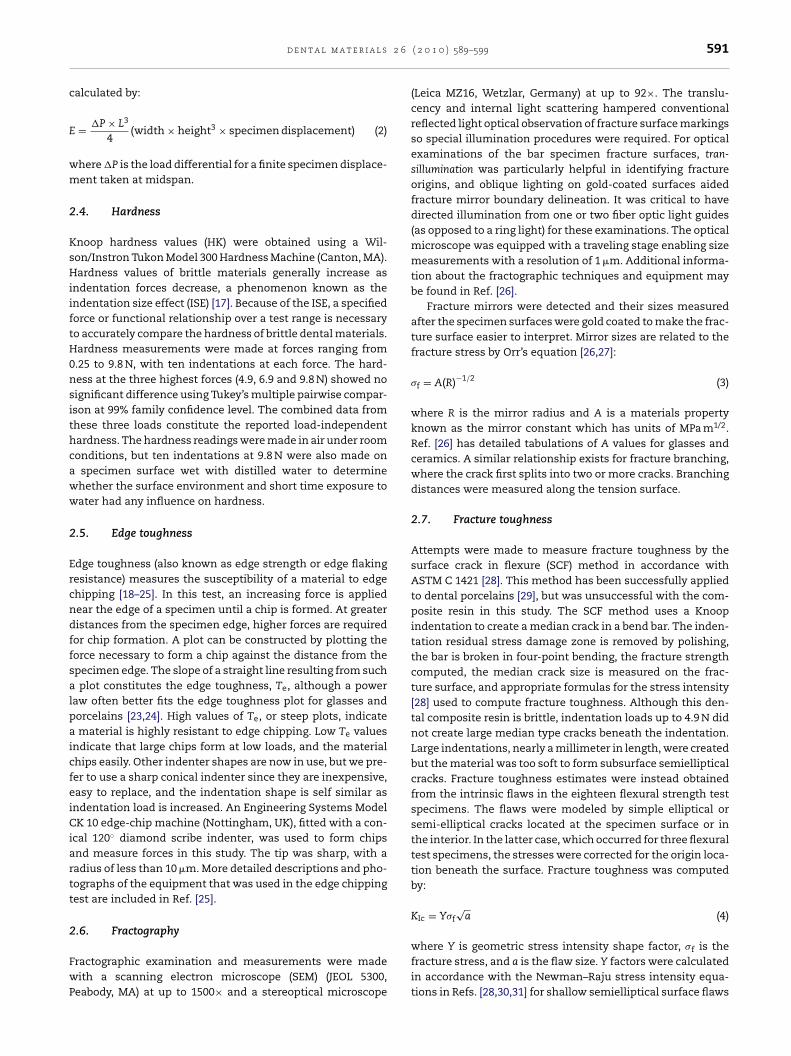
The same specimen surface that is shown in Fig. 3 is shownin the Fig. 7a optical photomicrograph. The specimen is nowgold coated and viewed with oblique lighting to better reflectfracture surface features and eliminate light scattering frombeneath the fracture surface. The smooth area surroundingthe origin is the fracture mirror. Mirrors were visually obvi-ous in all the resin composite specimens of this study, but itwas difficult to define the mirror boundaries. The white arrows
in Fig. 7a represent subjective judgment of the mirror size,measured by the traveling stage attached to the optical micro-scope. Fig. 7b is a plot of the strength vs. (mirror radius)−1/2.The slope is the mirror constant, A0, where the subscript
d e n t a l m a t e r i a l s 2 6 ( 2 0 1 0 ) 589–599 595
Fig. 5 – Fracture origin in a flexure bar (�f = 139 MPa). (a) and (b) are optical images using transillumination. The origin is thedark round spot at the chamfer marked by the arrows. (c) and (d) are backscattered and secondary electron mode SEM closeu
dio2bps
4
NsSstc
ps of the aluminum inclusion flaw, respectively.
enotes “outer” or the mirror-hackle boundary [26]. The slopes force-fit through the origin, with a correlation coefficient R2
f 0.998. From the graph, an approximate mirror constant of.6 ± 0.1 MPa m1/2 is obtained. A similar analysis for the crackranching distance (where a crack first split into two or moreropagating cracks) gave an estimate of the branching con-tant, Ab, of 2.9 ± 0.1 MPa m1/2.
. Discussion
ot surprisingly, the mechanical properties were generallyimilar to those reported in the manufacturer’s literature.
everal points, however, are of interest. First, every flexuraltrength specimen broke from an intrinsic flaw and the frac-ure surface markings were remarkably similar to those oferamic test pieces, once the lighting or viewing mode wasoptimized. The similarity to glasses and ceramics should notbe surprising due to the high filler content which increasedthe elastic modulus and strength well above values for thepolymer matrix. Once a critical stress intensity level wasachieved at a fracture origin, brittle fracture occurred. Allloading curves were linear to fracture. There was sufficientstored elastic energy to generate the classical brittle mate-rial fracture patterns such as hackle, fracture mirrors, andcrack branches as described in [9,26,27]. The fracture ori-gin of every flexural strength bar was easily found with thestereoptical microscope with transillumination and/or vici-nal (low angle grazing) illumination. The precise nature ofthe flaws could not be identified by optical microscopy, but
it served to quickly identify an area for close-up SEM exami-nation.The dominant flaw type in this study was an aluminuminclusion. Two calcium rich inclusions were also detected.

596 d e n t a l m a t e r i a l s 2 6 ( 2 0 1 0 ) 589–599
Fig. 6 – Fracture origin in a flexure bar (�f = 148 MPa). (a) and (b) are uncoated and gold coated optical images, respectively.sec
The arrows mark the origin. (c) and (d) are backscattered andinclusion flaw, respectively.
Some flaws exhibited traces of chlorine. Two of the frac-ture origins in the dental composite were volume-distributedspherical flaws that had a chemical composition identical tothe matrix. These flaws were probably agglomerates associ-ated with problems in mixing, wetting, or in the distribution ofthe filler phases in the composite. This is a common outcomefor many composite materials, whether they have polymer[1], glass [26], or ceramic matrices [26]. The filler particles inthe dental composite were very fine, averaging 0.6 �m. Weobserved some regions near the origins that were clusters ofvery fine (<0.2 �m) particles, or debonded regions, or locallyporous regions. Some of the flaws may also have had resin richareas, or regions of incomplete polymerization. Nonuniformdistribution of the silane agent commonly used to enhanceparticle to resin adhesion could also have contributed to someflaws.
Roulin-Moloney [10] identified a number of possible frac-ture origins in filled resins including air bubbles, resin richareas, mould lines, foreign matter inadvertently added duringmoulding, or even the filler particles themselves if they are
larger than 100 �m or the particles are inherently weak. Poorlybonded particles can also link up to create a critical flaw thatcan initiate fracture. Roulin-Moloney [10] showed examples ofparticle-resin adhesion variability similar to those observedondary electron mode SEM images of the calcium rich
in the present study, albeit with much larger filler particulatesizes.
The variability in the flaw character and size in the dentalcomposite accounts for the modest Weibull modulus (8.0). Itshould be noted that we did not detect any severe flaws orbubbles in our study and the flaws that were detected werequite small, of the order of 35–100 �m.
The similarity of the calculated KIc value in this study(1.1 ± 0.2 MPa m1/2) based on the flaw size analysis tothe company value determined by chevron notch tests(1.3 ± 0.1 MPa m1/2, with an unknown number of trials) sug-gests three possibilities. One possibility is that the fracturetoughnesses are the same (within experimental error).Another is that the estimates based on the flaw size analy-sis may be in error since they were simplistically modeled assharp cracks, whereas in reality they were three-dimensionalflaws. These may have been able to transmit some localizedtensile loading across the flaw cross section, unlike a crack.Alternatively, the flaws may have degraded the local frac-ture toughness. A third possibility is that there is a slightly
rising R curve (whereby fracture resistance increases withcrack extension) for the material. Shah et al. [32,33] recentlyreported that rising R-curve behavior can occur in similardental filled resin composites. The slightly greater fracture
d e n t a l m a t e r i a l s 2 6
Fig. 7 – Smooth regions surrounding the origin (fracturemirrors) were present in all the specimens: (a) arrowsdelineate the mirror boundary of the specimen shown inFig. 3 and (b) graph showing the fracture stress/mirror sizer2
tepirrt0tmtsetsp
elationship. The slope is the mirror constant, A, of.6 MPa m1/2.
oughness from the chevron notch tests is what one mightxpect for the larger cracks (of the order of a millimeter) com-ared to the tens of micrometer-sized intrinsic flaws activated
n the strength tests. Shah et al. [32,33] showed the fractureesistance in microhybrid and nanofilled resin compositesose only by about 0.1–0.2 MPa m1/2 with crack extensions ofhe order of 1–3 mm. Fracture toughness values ranged from.8 to 1.2 MPa m1/2 depending upon the composite system andhe amount of crack extension. The filler particles for their
icrohybrid composite were very similar (and possibly iden-ical) to those in our study. The fracture surfaces in our studyhowed considerable roughness on the microscopic level with
vidence of crack redirection and undercutting along the frac-ure plane, similar to what Shah et al. [32,33] observed. Futuretudies could assess whether a rising R-curve exists for thisarticular material, but our results suggest that it may be( 2 0 1 0 ) 589–599 597
inconsequential since the fracture toughness differential isvery small. Furthermore, the intrinsic flaws probably becomecritical before much crack extension has occurred. We couldnot detect fractographic evidence of local stable crack exten-sion around the critical flaws, but it would appear that theflaws did go critical leading to sudden brittle fracture whenthey were of the order of tens of micrometers in size. Thecritical flaw size (radius) was certainly smaller by a factorof five or more than the fracture mirror sizes, the largest ofwhich was about 400 �m in size. As noted above, the R-curvesshown by Shah et al. [32] are quite shallow and the full ben-efit of toughening is not realized until cracks have extendedmore than 1 mm. In practical terms, it is not likely that clin-ical restorations with cracks of that size would survive verylong to benefit from the meager toughening. So simple esti-mates of flaw sizes assuming a set value of fracture toughnessmay be adequate for making approximations in compositeswith shallow rising R-curves. Nevertheless, Shah et al. [32]did show meaningfully different values of fracture resistanceand strength between the two filled composites in their study.Finally, the SCF method probably will not be suitable for otherresin composites since precracks do not form underneath theindentation.
A practical consideration is that in vivo resin compositeclinical restorations are expected to have the same strengthsas the in vitro test specimens if they fracture from similarcauses. Accordingly, for indirect restorations of this materialtype, before installation it might be prudent to examine stressbearing areas for such discontinuities using transillumination.However, if clinical restorations of this material fracture fromdifferent causes, such as tool marks, large pores or contactstresses, then the in vitro strength tests would not be a prac-tical predictor of clinical performance, particularly longevity,but only supply an estimated upper limit.
Fracture mirrors were easily detected in this material,which is not surprising in view of its brittle behavior, buttheir size measurement was more problematic. Although sim-ple in concept and easy to detect, the judgment of a mirror“boundary” to measure can be difficult. Guidelines [26,27] andeven a formal standard for ceramics and glasses ASTM C1678[34] have been adopted, but it is not known whether theseprocedures are appropriate for resin composites. There is apaucity of data for mirror size constants in such materials.Roulin-Moloney [10] lists only values of 0.82–1.04 MPa m1/2 foran unfilled epoxy resin. Nevertheless, our measured value of2.6 MPa m1/2 is 2.4 times the value of the fracture toughness,similar to the relationship observed for some ceramics andglasses. Future work could investigate whether a set of mirrormeasurement criteria could be established, similar to thosefor ceramics and glasses.
The load dependence of the hardness tests has particularsignificance in material comparisons and wear evaluations. Adifferent material is likely to have a different load dependence,and it is difficult to characterize relative hardness without datafor the entire force range of importance. If nano-indentationsare used to characterize hardness, it can be seen from Fig. 1b
that a very small load results in both a higher hardness anda higher variability in measurement. The uncertainty canresult from greater difficulties in measuring small indenta-tion sizes, the large change of hardness with small deviations
l s 2
r
598 d e n t a l m a t e r i a
in force, and most importantly for composite materials, devia-tions within the microstructure itself. Small indentation areasare more sensitive to the distribution of particles in the resinmatrix. Ideally, the indentation area should be large enoughto contain a representative distribution of filler particles. Themean size measurement of the 0.25 N indentations in Fig. 1bis only 0.051 ± 0.003 mm. Although the Knoop hardness mea-surements taken under distilled water were not significantlydifferent from those taken under room conditions, this doesnot mean that the resin composite hardness is not eventuallyaffected by water. Studies have shown that hardness reductiondoes occur in resin composites stored in water [35,36]. The cur-rent study merely shows that the short-term environmentaltest conditions have little effect on the measurements.
The edge chipping test was easy to perform, utilized onlysmall amounts of material and edge chipping is a clinicallyrelevant failure mode in resin composites [11,37]. The testresults are complicated by a nonlinear relationship, or a linethat does not pass through zero. Such a line has no physi-cal meaning, as chips obviously do not form at zero force.A likely explanation for the nonlinearity is material densi-fication before fracture, for similar nonlinear edge-chippingrelationships are found for dental glasses, which also den-sify under force [23]. Densification may possibly play a rolein the indentation size effect of the hardness results, as well.A recent model has been developed that does suggest a powerlaw dependence, but with a fixed exponent of 1.5 [38]. Ref.[23] also lists edge toughness values and power law fittingparameters (with exponents ranging from 1.3 to 1.6) for otherdental materials. The calculated Te of the resin composite of172 N/mm falls about halfway between feldspathic porcelainand glass-infused alumina.
To the best of our knowledge, the fracture origins, frac-ture mirror and branching constants presented in this workare some of the first such findings for an indirect compositematerial. The null hypothesis that fractographic analysis canbe applied to indirect filled composite is accepted.
5. Conclusions
Fractography can be performed on resin composites, withfruitful results, as an aid in characterizing the materialand determining the fracture origins of flexure bars. Tran-sillumination and vicinal illumination are effective with astereoptical microscope, but the SEM is needed to character-ize the nature of the fracture origins. Fractographic techniquesmay be helpful in determining the strength limiting featuresof resin composite clinical restorations as well. Also promis-ing is the edge chipping test, which quantifies a material’sresistance to a failure mode that is clinically relevant. Finally,hardness was found to be very load-dependent and compar-isons of resin composites should be made over a clinicallyrelevant load range, rather than at a single load.
Acknowledgements
The authors appreciate the support of the American DentalAssociation Foundation, NIST, and NIH Grant R01-DE17983,which made this work possible. We thank 3M-ESPE for fur-
6 ( 2 0 1 0 ) 589–599
nishing the materials evaluated in this study and appreciatetechnical discussions with Dr. Richard Rusin.
e f e r e n c e s
[1] Roeters JJM, Shortall ACC, Opdam NJM. Can a singlecomposite resin serve all purposes? Brit Dent J 2005;199:73–9.
[2] Ferracane JL. Current trends in dental composites. Crit RevOral Biol Med 1995;6(4):302–18.
[3] Kelly JR. Approaching clinical relevance in failure testing ofrestorations. J Prosthet Dent 1999;81:652–61.
[4] Quinn GD, Morrell R. Design data for engineering ceramics:A review of the flexure test. J Am Ceram Soc1991;74(9):2039–65.
[5] Lewis III D. Observations on the strength of a commercialglass-ceramic. Am Ceram Soc Bull 1982;61(11):1208–14.
[6] Taylor D. Strength-component size relationship forhigh-tension insulator whiteware. Br Ceram Trans J1989;88:209–12.
[7] Lewis III D, Oyler SM. An experimental test of Weibullscaling theory. J Am Ceram Soc 1976;59(11–12):507–10.
[8] Parrington RJ. Fractography of metals and plastics. PractFailure Anal 2002;2, 16–19, 44–46.
[9] Rice RW. Ceramic fracture features, observations,mechanisms, and uses. in Mecholsky JJ, Jr., Powell SR, Jr.,eds., Fractography of ceramic and metal failures. ASTM STP827; 1984: p. 5–103.
[10] Roulin-Moloney AC. Fractography and failure mechanisms ofpolymers and composites. London/New York: Elsevier; 1989.
[11] Lambrecht P, Ameye C, Vanherle G. Conventional andmicrofilled composite resins. Part II. Chip fractures. JProsthet Dent 1982;489(5):527–38.
[12] Rusin RP. Properties and applications of a new compositeblock for CAD/CAM. Compendium 2001;22(Suppl. 6):35–41.
[13] 3M Paradigm, MZ100 Block for CEREC, technical productprofile, 3M Center, St Paul, MN; 2000.
[14] ASTM C1161-02. Standard test method for flexural strengthof advanced ceramics at ambient temperature. in AnnualBook of Standards Vol. 15.01, ASTM, West Conshohocken,PA; 2002.
[15] Baratta FI, Quinn GD, Matthews WT. Errors associated withflexure testing of brittle materials, U.S. Army MaterialsTechnology Laboratory Technical Report, TR 87-35, July; 1987.
[16] ASTM C 1239-06A. Standard practice for reporting uniaxialstrength data and estimating Weibull distributionparameters for advanced ceramics; 2006.
[17] Quinn JB, Quinn GD. Indentation brittleness of ceramics: afresh approach. J Mater Sci 1997;32:4331–46.
[18] McCormick NJ, Almond EA. Edge flaking of brittle materials.J Hard Mater 1990;1(1):25–51.
[19] Watts DC, Issa M, Ibrahim A, Wakiaga J, Al-Samadani,Al-Azraqi M, et al. Edge strength of resin-compositemargins. Dent Mater 2008;24(1):129–33.
[20] Baroudi K, Silikas N, Watts DC. Edge-strength of flowableresin-composites. J Dent 2008;36(1):63–8.
[21] Morrell R, Gant AJ. Edge chipping of hard materials. Int JRefract Met Hard Mater 2001;19:293–301.
[22] Gogotsi GA, Mudrik SP. Fracture barrier estimation by theedge fracture test method. Ceram Int 2009;35:1871–5.
[23] Quinn JB, Su L, Flanders L, Lloyd I. Edge toughness” and
material properties related to the machining of dentalceramics. Mach Sci and Tech 2000;4:291–304.[24] Quinn JB, Sundar V, Parry EE, Quinn GD. Comparison of edgechip resistance of PFM and veneered zirconia specimens.Dent Mater 2010;26:13–20.

2 6
d e n t a l m a t e r i a l s[25] Quinn JB, Vaderhobli RM. Geometry of edge chips formed atdifferent angles. Ceram Eng Sci Proc 2005;26(2):85–92.
[26] Quinn GD. Guide to practice for fractography of ceramicsand glasses, NIST Special Publication SP 960-16, May; 2007.
[27] Quinn GD. Guidelines for measuring fracture mirrors. In:Varner JR, Quinn GD, Wightman M, editors. Fractography ofglasses and ceramics, vol. 5. Westerville, OH: AmericanCeramic Society; 2007. p. 163–90.
[28] ASTM C 1421-99. Standard test method for thedetermination of fracture toughness of advanced ceramics.Annual Book of ASTM Standards, Vol. 15.01. ASTM, WestConshohocken, PA; 1999.
[29] Scherrer SS, Kelly JR, Quinn GD, Xu K. Fracture toughness ofa dental porcelain determined by fractographic analysis.Dent Mater 1999;15(5):342–8.
[30] Newman JC, Raju IS. Stress intensity factor equations forcracks in three-dimensional finite bodies subjected totension and bending loads. In: NASA Technical
Memorandum 85793, NASA Langley Res. Ctr. 1984.[31] Anderson TL. Fracture mechanics, fundamentals andapplications. 2nd ed. New York: CRC Press; 1995.
[32] Shah MB, Ferracane JL, Kruzic JJ. R-curve behavior andmicromechanisms of fracture in resin based dental
( 2 0 1 0 ) 589–599 599
restorative composites. J Mech Behav Biomed Mater2009;2(5):502–11.
[33] Shah MB, Ferracane JL, Kruzic JJ. R-curve behavior andtoughening mechanisms of resin-based dental composites:effects of hydration and post-cure heat treatment. DentMater 2009;25(6):760–70.
[34] ASTM C 1678. Standard practice for fractographic analysis offracture mirror sizes in ceramics and glasses. Annual Book ofStandards Vol. 15.01, ASTM, West Conshohocken, PA; 2007.
[35] Da Fonte Porto Carreiro A, Dos Santos Cruz CA, Vergani CE.Hardness and compressive strength of indirect compositeresins: effects of immersion in distilled water. J Oral Rehab2004;31(11):1085–9.
[36] Ferracane JL, Berge HX, Condon JR. In vitro aging of dentalcomposites in water—effect of degree of conversion, fillervolume, and filler/matrix coupling. J Biomed Mater Res1998;42(3):465–72.
[37] Tsitrou EA, Northeast SE, Van Noort R. Brittleness index of
machinable dental materials and its relation to the marginalchipping factor. J Dent 2007;35(12):897–902.[38] Chai H, Lawn BR. A universal relation for edge chipping fromsharp contacts in brittle materials: a simple means oftoughness evaluation. Acta Mater 2007;55:2555–61.