Material and Design Optimization for an Aluminum Bike Frame
101
Material and Design Optimization for an Aluminum Bike Frame A Major Qualifying Project Submitted to the Faculty Of the WORCESTER POLYTECHNIC INSTITUTE In Partial Fulfillment of the Requirements for the Degree of Bachelor of Science By _________________________ Forrest Dwyer _________________________ Adrian Shaw _________________________ Richard Tombarelli April 26 th , 2012 ____________________________ ___ Professor Diana A. Lados
Transcript of Material and Design Optimization for an Aluminum Bike Frame

8/15/2019 Material and Design Optimization for an Aluminum Bike Frame
http://slidepdf.com/reader/full/material-and-design-optimization-for-an-aluminum-bike-frame 1/101
Material and Design Optimization for an Aluminum Bike Frame
A Major Qualifying Project
Submitted to the Faculty
Of the
WORCESTER POLYTECHNIC INSTITUTE
In Partial Fulfillment of the Requirements for the
Degree of Bachelor of Science
By
_______________________________
Forrest Dwyer
_______________________________
Adrian Shaw
_______________________________
Richard Tombarelli
April 26th, 2012
_______________________________
Professor Diana A. Lados

8/15/2019 Material and Design Optimization for an Aluminum Bike Frame
http://slidepdf.com/reader/full/material-and-design-optimization-for-an-aluminum-bike-frame 2/101
ii
Abstract
Fatigue is a prominent failure mechanism for mountain bike frames, and can lead
to serious accidents, costly recalls, and poor product image for bicycle frame
manufacturers. The team collaborated with a local bike company, in the process of
developing a new 6061-T6 aluminum mountain bike, to investigate the fatigue behavior
of the new frame and optimize the material/heat treatment and frame design. The fatigue
testing was done in-house using a test rig specifically built for this project according to
the ASTM standard F2711-08 for horizontal loading. A solid model of the frame was
created and a finite element analysis (FEA) was conducted using the ASTM standard as a
guide, with appropriate mechanical properties for various sections of the bike and the
joining welds. The FEA model enabled the team to predict fatigue failure locations and
cycles to failure, and was further validated using the experimental fatigue testing results
obtained from the prototype frames. On the physical frames tested, thorough
fractographic examinations were conducted to identify the fatigue crack initiation
locations and crack propagation mechanisms using optical and scanning electron
microscopy. To complete the project, systematic studies were performed to optimize the
frame’s design, materials and heat treatment for improved fatigue resistance.

8/15/2019 Material and Design Optimization for an Aluminum Bike Frame
http://slidepdf.com/reader/full/material-and-design-optimization-for-an-aluminum-bike-frame 3/101
iii
Table of Contents
Abstract .............................................................................................................................. ii
Glossary of Acronyms....................................................................................................... 1
1.0 Introduction ........................................................................................................... 2
1.1 Problem Statement .......................................................................................... 2
1.2 Project Objectives ........................................................................................... 3
1.3 Methodology Overview ................................................................................... 3
2.0 Characterization of Donated Frames .................................................................. 6
2.1 Frame Tubing Characterization .................................................................... 6
2.2 Material Properties Characterization ........................................................... 7
2.2.1 6061-T6 Aluminum ...................................................................................... 9
2.2.2 Aluminum 6061 Compared to Other Frame Materials ............................... 10
2.2.3 Aluminum 4043 – Filler Rod ...................................................................... 13
2.3 Manufacturing 6061 Aluminum Bicycle Frames ....................................... 14
2.3.1 Creation of Blank Tubes ............................................................................. 14
2.3.2 Altering the Tubes ...................................................................................... 15
2.3.3 Joining the Tubes: TIG Welding ................................................................ 16
2.3.4 T6 Heat Treatment of 6061 Aluminum ...................................................... 19
3.0 Frame Analysis and Testing ............................................................................... 21
3.1 ASTM Frame Testing Standards ................................................................. 21
3.1.1 Horizontal Loading Durability Fatigue Test ............................................... 22
3.2 FEA Methodology ......................................................................................... 25
3.2.1 Tube Measurements and Solid Model Creation ......................................... 26
3.2.2 FEA ............................................................................................................. 36
3.3 Frame Testing................................................................................................ 41
3.3.1 Test Rig Structure Development ................................................................ 42
3.3.2 Test Rig Controls Development ................................................................. 50
3.3.3 Complete Testing System ........................................................................... 55
3.3.4 Testing Procedure ....................................................................................... 56
3.3.5 Test Rig Performance Investigation ........................................................... 57

8/15/2019 Material and Design Optimization for an Aluminum Bike Frame
http://slidepdf.com/reader/full/material-and-design-optimization-for-an-aluminum-bike-frame 4/101
iv
4.0 Frame Testing: Results, Comparison, and Analysis ........................................ 61
4.1 Results and Comparison ............................................................................... 61
4.1.1 Calculating Equivalent Cycles .................................................................... 62
4.2 Physical Frame Failure Analysis ................................................................. 64
4.2.1 Observed Crack Propagation during Testing .............................................. 65
4.2.2 Crack Growth Analysis .............................................................................. 66
4.2.3 Fractographic Analysis ............................................................................... 70
5.0 Frame Optimization and Recommendations.................................................... 76
5.1 Material Modifications ................................................................................. 76
5.1.1 7005-T6 Aluminum .................................................................................... 76
5.1.2 6013-T6 Aluminum .................................................................................... 77
5.1.3 Heat Treat Modifications ............................................................................ 79
5.2 Geometry Modifications ............................................................................... 81
6.0 Conclusions and Future Work ........................................................................... 84
7.0 Acknowledgements ............................................................................................. 85
Appendix A – T6 Heat Treatment Parameters ............................................................ 86
Appendix B – Solenoid Controller LabVIEW VI ........................................................ 87
Appendix C – Strain Measurement LabVIEW VI ...................................................... 88
Appendix D – Air Cylinder Force Output Graphs ...................................................... 89
Appendix E – ASM Material Hardness Reference ...................................................... 90
References ........................................................................................................................ 91

8/15/2019 Material and Design Optimization for an Aluminum Bike Frame
http://slidepdf.com/reader/full/material-and-design-optimization-for-an-aluminum-bike-frame 5/101
v
List of Figures
Figure 1: Donated mountain bike frame. ............................................................................ 6
Figure 2: Tubing diagram of the donated bicycle frames. .................................................. 7
Figure 3: Common bicycle frame materials [20],[37],[21],[43]. ........................................ 8
Figure 4: 3D grain models showing top tube (left) and down tube (right). ...................... 10
Figure 5: Fatigue limit of aluminum vs. steel [19]. .......................................................... 12
Figure 6: Manufacturing process for an aluminum bicycle frame. ................................... 14
Figure 7: Hydroforming a blank tube using a die and high pressure fluid [25]. ............... 15
Figure 8: A bicycle tube which has been miter cut [22]. .................................................. 16
Figure 9: TIG welding the head tube of an aluminum bicycle frame [38]. ...................... 17
Figure 10: Zones of a TIG weld showing parent material, HAZ, and filler material. ...... 18
Figure 11: FSW diagram showing parent material, HAZ, TMAZ and weld nugget. ....... 18
Figure 12: T6 heat treatment process steps [17]. .............................................................. 19
Figure 13: Test setup for the Horizontal Loading Durability Fatigue Test [6]. ................ 22
Figure 14: Integrated FEA methodology overview. ......................................................... 25
Figure 15: Bicycle frame solid modeling strategy. ........................................................... 26
Figure 16: ProEngineer sketch of solid model geometry.................................................. 27
Figure 17: Sectioning of the down tube for cross section measurements. ........................ 28
Figure 18: Solid model of down tube with accurate geometry. ........................................ 29
Figure 19: Sectioned top tube for cross section measurements. ....................................... 30
Figure 20: Top tube dimensional data from sectioning. ................................................... 31
Figure 21: Example of a solid model mitered tube. .......................................................... 32
Figure 22: UTS measurements obtained from Rockwell hardness test. ........................... 34
Figure 23: Solid model showing TIG welding zones. ...................................................... 35
Figure 24: Completed solid model of physical frame. ...................................................... 36
Figure 25: Solid model of bike frame after applying the mesh. ....................................... 37
Figure 26: FEA output showing tensile stress and correlation to fatigue failure location.38
Figure 27: FEA output of entire frame showing von Mises stress. .................................. 40
Figure 28: Aluminum 6061-T6 S-N curve showing predicted failure at 490,000 cycles. 41
Figure 29: Structural components of test rig..................................................................... 43
8/15/2019 Material and Design Optimization for an Aluminum Bike Frame
http://slidepdf.com/reader/full/material-and-design-optimization-for-an-aluminum-bike-frame 6/101
vi
Figure 30: Solid model and fabricated 80/20 test rig frame. ............................................ 44
Figure 31: Air cylinder used to exert forces onto tested bike frame. ................................ 45
Figure 32: Rear dropout base plate fixtured to test rig frame. .......................................... 46
Figure 33: Exploded view of rear dropout assembly. ....................................................... 47
Figure 34: Threaded rod of air cylinder screwed into front dropout. ............................... 48
Figure 35: Solid model of test fork and fabricated test fork. ............................................ 49
Figure 36: Operation diagram for test rig control system. ................................................ 51
Figure 37: Solenoid air flow path diagram. ...................................................................... 52
Figure 38: Solenoid valve connected to air cylinder. ....................................................... 52
Figure 39: Circuit including SSRs to control solenoid valves. ......................................... 54
Figure 40: Solenoid controller front panel developed in LabVIEW................................. 55
Figure 41: Testing rig with structure and controls. ........................................................... 56
Figure 42: FEA strain levels (left) and strain gage placement (right). ............................. 58
Figure 43: Wheatstone bridge schematic (left) and physical layout (right)...................... 59
Figure 44: Strain measurement front panel developed in LabVIEW. .............................. 60
Figure 45: FEA (left) and tested (right) fatigue failure locations showing agreement. .... 62
Figure 46: Fracture origin observed during testing........................................................... 65
Figure 47: Extent of crack propagation on front side. ...................................................... 66
Figure 48: Crack lengths for front and back side at N cycles. .......................................... 67
Figure 49: Combined crack length at N cycles. ................................................................ 68
Figure 50: Combined crack growth rate at N cycles......................................................... 69
Figure 51: Results from optical microscope and SEM analysis. ...................................... 71
Figure 52: Predicted (left) and measured (right) striation distance. ................................. 75
Figure 53: Aluminum 6013-T6 S-N curve showing extended fatigue life. ...................... 78
Figure 54: Frame geometry modification showing extended weld. ................................. 81

8/15/2019 Material and Design Optimization for an Aluminum Bike Frame
http://slidepdf.com/reader/full/material-and-design-optimization-for-an-aluminum-bike-frame 7/101
vii
List of Tables
Table 1: Bicycle frame recalls between 1995 and 2010 ..................................................... 2
Table 2: Mechanical properties of common bicycle frame materials [16], [26] ................ 8
Table 3: Approximate chemical composition of 6061 by wt% [16] ................................... 9
Table 4: Approximate chemical composition of 4043 filler rod by wt% [16].................. 13
Table 5: ASTM bicycle conditions and F2711-08 test parameters [4],[8],[7],[9],[5] ...... 24
Table 6: Geometry values for the solid model of the bicycle frame [37] ......................... 27
Table 7: Data obtained from sectioning down tube .......................................................... 29
Table 8: Solid modeling strategy for rear triangle tubes ................................................... 31
Table 9: UTS summary for different weld regions ........................................................... 34
Table 10: Equivalent cycles for physical frame testing .................................................... 63
Table 11: Fracture data and calculations .......................................................................... 74
Table 12: Approximate chemical composition of 6013 by wt% [16] ............................... 77
Table 13: Comparison of mechanical properties between 6061-T6 and 6013-T6 [16] .... 78
Table 14: Material and heat treatment optimization results.............................................. 80
Table 15: Geometry optimization results .......................................................................... 82
Table 16: Modification summary for optimal fatigue behavior........................................ 83
8/15/2019 Material and Design Optimization for an Aluminum Bike Frame
http://slidepdf.com/reader/full/material-and-design-optimization-for-an-aluminum-bike-frame 8/101
1
Glossary of Acronyms
Below is a list of all the acronyms used in the report.
FEA – Finite Element Analysis
FSW – Friction Stir Welding
HAZ – Heat Affected Zone
HRE – Rockwell Hardness (E-Scale)
SEM – Scanning Electron Microscope
SSR – Solid State Relay
TIG – Tungsten Inert Gas Welding
TMAZ – Thermo-mechanically Affected Zone
UTS – Ultimate Tensile Strength
VI – Virtual Instrument

8/15/2019 Material and Design Optimization for an Aluminum Bike Frame
http://slidepdf.com/reader/full/material-and-design-optimization-for-an-aluminum-bike-frame 9/101
2
1.0 Introduction
1.1 Problem Statement
With the abusive conditions of mountain biking, bicycle riders require frames that
can withstand significant forces, and have high fatigue lives. Aluminum is the material
of choice for most bicycle companies when it comes to mountain bicycle frames, with
other common materials being steel, titanium and carbon fiber. Aluminum has a
favorable strength to weight ratio, and a lower cost compared to other materials used for
bicycles. However, when compared to these other materials, aluminum is more
susceptible to fatigue failure at lower cycle counts and has a finite fatigue life. Fatigue
failures that occur during typical usage of mountain bikes can have devastating effects for
bicycle manufacturers, resulting in expensive recalls, legal liabilities, and loss in product
image [30]. Table 1 outlines the major recalls in aluminum bicycle frames from 1995-
2010 due to fatigue failure.
Table 1: Bicycle frame recalls between 1995 and 2010
Year Company Failure Result Ref.
2010 Niner BikesCracks in welds in front triangle offrame
Recall of750 frames
[31]
2010RedlineBikes
Cracking in head tube weld joints ofaluminum frame, separation of headtube
Recalls [36]
2009 NorcoBicycles
Cracking in head tube area ofaluminum frame, head tube separation
Recall of3600 frames
[32]
2005 Novara Fatigue failure in head tube regionRecall of2800 frames
[13]
1995 Cannondale Cracks in head tube regionSafetyinspections
[12]

8/15/2019 Material and Design Optimization for an Aluminum Bike Frame
http://slidepdf.com/reader/full/material-and-design-optimization-for-an-aluminum-bike-frame 10/101
3
Based on the many recalls summarized in Table 1, the group decided to
investigate fatigue failures occurring in the front triangle of aluminum mountain bike
frames.
1.2 Project Objectives
Three main objectives were followed to investigate fatigue failures in the front
triangle of bicycle frames. These objectives work towards investigating the fatigue life
and failures of aluminum bicycle frames. The first main objective involved using finite
element analysis (FEA) to develop an integrated methodology to predict fatigue failure
locations and fatigue lives at those locations. Fatigue failure locations and fatigue lives
are critical considerations for bicycle frame design.
The second objective of the project was to validate the FEA methodology using
physical frame testing. Validating the FEA methodology with physical testing allows for
determining whether the predicted fatigue failure locations and cycles to failure are
accurate. The last main objective involved optimizing material, heat treatment and
geometry to improve fatigue life. The material selection, heat treatment and geometry of
a bicycle frame all have a significant impact on the fatigue failure locations, and cycles to
failure.
1.3 Methodology Overview
After defining the main objectives to investigate fatigue failures, the group
determined it was necessary to obtain a physical bicycle frame to analyze and optimize.

8/15/2019 Material and Design Optimization for an Aluminum Bike Frame
http://slidepdf.com/reader/full/material-and-design-optimization-for-an-aluminum-bike-frame 11/101
4
The group found a local bicycle company willing to donate two identical 6061-T6
aluminum prototype mountain bike frames for a fatigue investigation. The investigation
not only met the objectives of the group, but also provided value for the local bicycle
company by testing and validating the fatigue life of the prototype.
The group devised an integrated FEA methodology to understand the fatigue
behavior of the bicycle frame. The FEA methodology was based on the bicycle specific
ASTM F2711-08 test standard. The methodology allowed the group to use computer
simulation to predict the fatigue failure locations of the donated frames, and the cycles to
failure in those locations. The FEA methodology was then validated using physical
frame testing. A fatigue testing rig was built in-house to test one of the donated frames
until failure. The second frame was sent out to an external testing facility to ensure the
group obtained accurate fatigue testing data. The results between the physical frame
testing were compared to the FEA methodology results to determine how well the FEA
methodology agreed with actual testing.
The fatigue crack on the tested frame at WPI was then fractographically analyzed
to obtain an understanding of the crack propagation. An optical microscope and a
scanning electron microscope (SEM) were used to analyze the fracture. The analysis was
compared and correlated to the observed crack growth rate. A point of origin was found
using the SEM to determine exactly where and why the crack originated.
After developing the FEA methodology, validating the methodology, and
conducting the fractographic analysis, the group worked to optimize the material, heat
treatment and geometry design of the frame. Changes were made to each of these
characteristics of the frame to work to optimize the fatigue life. Alternative aluminum

8/15/2019 Material and Design Optimization for an Aluminum Bike Frame
http://slidepdf.com/reader/full/material-and-design-optimization-for-an-aluminum-bike-frame 12/101
5
alloys were investigated as well as alternative heat treatments of 6061 aluminum for the
bicycle frame. Finally, modifications to the frame geometry were made to work to
improve the fatigue life of the frame. The material, heat treatment and geometry
modifications were then combined to result in a bike frame optimized for fatigue
resistance.

8/15/2019 Material and Design Optimization for an Aluminum Bike Frame
http://slidepdf.com/reader/full/material-and-design-optimization-for-an-aluminum-bike-frame 13/101
6
2.0 Characterization of Donated Frames
This project involved an investigation into fatigue failures of aluminum mountain
bike frames. As discussed in Chapter 1, two 6061-T6 aluminum mountain bike frames
were donated from a local bicycle manufacturer for an investigation into fatigue failure
locations and fatigue life. The donated frames can be seen in Figure 1. This chapter
provides a characterization of the frame tubes of the donated frames, an overview of the
material properties of the frames and a characterization of the process for manufacturing
the donated frames.
Figure 1: Donated mountain bike frame.
2.1 Frame Tubing Characterization
The bicycle frames donated for fatigue investigation feature a traditional diamond
frame design, consisting of a front and rear triangle. This design has been the industry
standard for bicycle frame design for over one hundred years [10]. The frame consists of
a top tube, down tube, head tube, seat tube, seat stays, and chain stays as seen in Figure 2.
The head tube of the frame holds the steerer tube of the fork, which in turn holds the front
wheel. The top tube and down tube connect the head tube to the seat tube and bottom

8/15/2019 Material and Design Optimization for an Aluminum Bike Frame
http://slidepdf.com/reader/full/material-and-design-optimization-for-an-aluminum-bike-frame 14/101
7
bracket. The seat tube holds the seat post, which holds the saddle. The bottom bracket
holds the cranks, which hold the pedals. The seat stays and chain stays hold the rear
dropouts, which connect the rear wheel to the frame [40].
Figure 2: Tubing diagram of the donated bicycle frames.
2.2 Material Properties Characterization
The bicycle frames donated for investigation are made from 6061 aluminum with
a T6 heat treatment. This section covers the material properties of 6061-T6 aluminum in
comparison to other common bicycle frame materials.
There are a wide variety of materials used in bicycle frames. Bike frames were
originally made from wood, but modern frames are made primarily from aluminum, steel,
titanium and carbon fiber. Some of the less common materials used in creating frames

8/15/2019 Material and Design Optimization for an Aluminum Bike Frame
http://slidepdf.com/reader/full/material-and-design-optimization-for-an-aluminum-bike-frame 15/101
8
include bamboo, thermoplastics and magnesium. Bicycle frames constructed from the
more common frame materials can be seen in Figure 3.
Figure 3: Common bicycle frame materials [20],[37],[21],[43].
The materials used for mountain bicycle frames have a wide range of mechanical
properties. These properties can be seen in Table 2. There is not one material in the table
that has advantageous properties in each category, which explains why manufacturers
continue to fabricate frames from several different materials.
Table 2: Mechanical properties of common bicycle frame materials [16], [26]
Modulus ofElasticity(GPa)
YieldStrength(MPa)
TensileStrength(MPa)
Fatigue Strengthat 50,000 Cycles(MPa)
Density(kg/m3)
WeldabilityandMachinability
Cost(USD pekg)
Aluminum –6061-T6
72 193-290 241-320 75 2,700 Excellent $2.42
Aluminum –7005-T6
72 290 350 ~75 2,780 Excellent $2.87
Steel - 4130 205 800-1,000 650 250 7,800 Excellent $0.95
Titanium –Grade 9
91-95 483-620 621-750 250 4,480 Fair $57.40
CarbonFiber 275-415 Varies Varies Varies 1,800 Fair Varies

8/15/2019 Material and Design Optimization for an Aluminum Bike Frame
http://slidepdf.com/reader/full/material-and-design-optimization-for-an-aluminum-bike-frame 16/101
9
2.2.1 6061-T6 Aluminum
The 6061 aluminum alloy is an alloy commonly used for a wide variety of
applications. This material is used for bicycle frames, aircraft structures, automotive
parts, and much more [18]. The two main alloying elements in 6061 are silicon and
magnesium. The complete composition of 6061 can be seen below in Table 3.
Table 3: Approximate chemical composition of 6061 by wt% [16]
Al Mg Cr Cu Si Fe Mn Zi Ti
~96.5 1.0 0.2 0.4 0.6 0.7 0.15 0.25 0.15
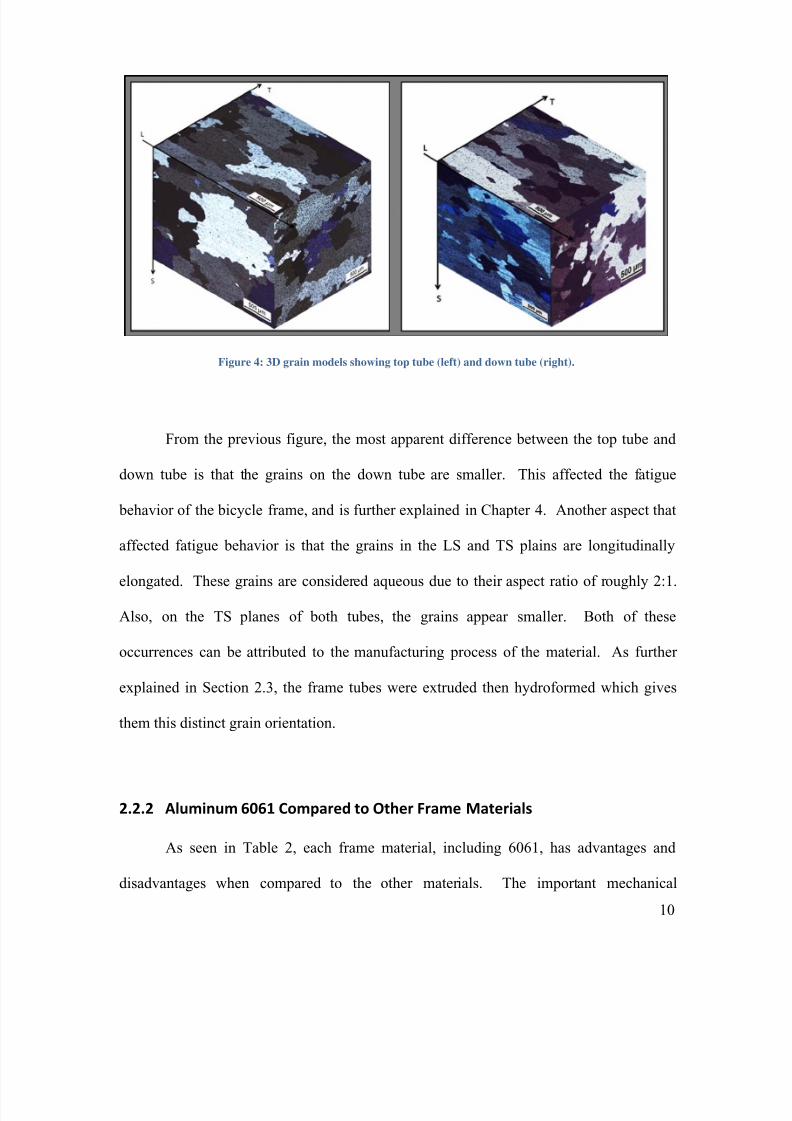
The 3D models of the grain structure of 6061-T6 aluminum can be seen in Figure
4. The models show the grain structure of the top and down tubes respectively. The two
models allow for an understanding of the orientation of the grains with respect to the
crack propagation. The T, L, and S directions refer to the transverse, longitudinal and
short-transverse directions of the tube respectively. As can be seen in the figure, the
down tube features smaller grains, which contributes to higher material yield strength in
the down tube [27].
8/15/2019 Material and Design Optimization for an Aluminum Bike Frame
http://slidepdf.com/reader/full/material-and-design-optimization-for-an-aluminum-bike-frame 17/101
10
Figure 4: 3D grain models showing top tube (left) and down tube (right).
From the previous figure, the most apparent difference between the top tube and
down tube is that the grains on the down tube are smaller. This affected the fatigue
behavior of the bicycle frame, and is further explained in Chapter 4. Another aspect that
affected fatigue behavior is that the grains in the LS and TS plains are longitudinally
elongated. These grains are considered aqueous due to their aspect ratio of roughly 2:1.
Also, on the TS planes of both tubes, the grains appear smaller. Both of these
occurrences can be attributed to the manufacturing process of the material. As further
explained in Section 2.3, the frame tubes were extruded then hydroformed which gives
them this distinct grain orientation.
2.2.2 Aluminum 6061 Compared to Other Frame Materials
As seen in Table 2, each frame material, including 6061, has advantages and
disadvantages when compared to the other materials. The important mechanical

8/15/2019 Material and Design Optimization for an Aluminum Bike Frame
http://slidepdf.com/reader/full/material-and-design-optimization-for-an-aluminum-bike-frame 18/101
11
properties for comparing bike frame materials include the material’s density, tensile
strength, fatigue strength, weldability and cost. Aluminum 6061 has the second lowest
density compared to the other materials, with a density that is 60% that of titanium, and
35% of 4130 steel. The tensile strength of 6061 is less than 7005, and around 43% of
4130 steel and titanium. The low density of aluminum allows larger tube diameters to be
used to increase frame strength making it to be competitive and even advantageous when
compared to steel. The main drawback to titanium, as shown by Table 2, is the
tremendously high cost, making the material less common for bicycle frames. Aluminum
6061 is more expensive than steel, but is relatively inexpensive at around $2.43 a
kilogram, making it affordable for manufacturing a frame. The main drawback to
aluminum is the low fatigue strength compared to the other frame materials.
Fatigue Comparison
Fatigue strength and resistance to fatigue failure is a highly important property
when comparing common bicycle frame materials. Fatigue failure is defined as the
progressive, localized, and permanent structural change that occurs in a material
subjected to fluctuating stresses below the yield strength. Riding a bicycle produces
fluctuating stresses on the frame that in some cases, cause fatigue failures to occur. As
seen in Table 2, the aluminum alloys have much lower fatigue strengths when compared
to 4130-steel and titanium, and are thus much more susceptible to fatigue failure. This
means that 6061 requires much lower stresses and cycles to induce a fatigue failure. Both
steel and titanium have fatigue strengths of 250 MPa at 50,000 cycles while the
aluminum alloys have fatigue strengths of only about 75 MPa at 50,000 cycles.

8/15/2019 Material and Design Optimization for an Aluminum Bike Frame
http://slidepdf.com/reader/full/material-and-design-optimization-for-an-aluminum-bike-frame 19/101
12
The 4130 steel alloy and titanium also have a fatigue limit which aluminum does
not. Fatigue limit is defined as the range of cyclic stresses that a material can undergo
without the material experiencing fatigue failure. From the data in Figure 5, it is clear
that after 10
5
cycles, the theoretical endurance limit of steel is 300 MPa. This means that,
as long as the steel is not stressed past 300 MPa, it will never suffer fatigue failure. From
this graph it can also be seen that the strength of aluminum falls continuously and has no
fatigue limit. Ideally bicycle frames would be designed to operate with stress levels
below the endurance limit; since aluminum does not have an endurance limit, fatigue
failure is prevalent issue as failure is guaranteed to happen after a finite number of cycles
[16].
Figure 5: Fatigue limit of aluminum vs. steel [19].
Aluminum has a number of properties that make it more desirable when compared
to other materials such as low density, ease of welding, good strength when heat-treated
8/15/2019 Material and Design Optimization for an Aluminum Bike Frame
http://slidepdf.com/reader/full/material-and-design-optimization-for-an-aluminum-bike-frame 20/101
13
and high corrosion properties as described above. As shown above, the main drawback
to 6061 frames is the susceptibility to fatigue failures.
2.2.3 Aluminum 4043 – Filler Rod
The 4043 aluminum alloy was used as the filler rod for welding the donated
frames. The ASM recommends 4043 filler material when welding 6061, and it accounts
for a large portion of the weld material [45]. The higher silicon content in 4043 weld
wire (5% vs. 0.6% in 6061) makes welds less sensitive to weld cracking which is why
4043 is so widely used. The high silicon content also leads to excellent wetting during
welding. Wetting is the process in welding where the liquefied filler material flows over
the base metal. The complete chemical composition of 4043 can be seen in Table 4.
Important mechanical properties of 4043 include a tensile strength of 140 MPa and yield
strength of 55.2 MPa. Furthermore, 4043’s relatively low solidification temperature of
575°C is ideal for welding 6061 as it reduces the occurrence of liquidation cracking
during welding [16].
Table 4: Approximate chemical composition of 4043 filler rod by wt% [16]
Al Si Fe Cu Ti Zn Mn Mg Others
~93 5 0.80 0.30 0.20 0.10 0.05 0.05 0.15

8/15/2019 Material and Design Optimization for an Aluminum Bike Frame
http://slidepdf.com/reader/full/material-and-design-optimization-for-an-aluminum-bike-frame 21/101
14
2.3 Manufacturing 6061 Aluminum Bicycle Frames
There are four main steps in manufacturing the aluminum bicycle frames donated
for the project which are shown in Figure 6. As seen in the figure, extruded aluminum
tubes are hydroformed, miter cut, tungsten inert gas (TIG) welded then T6 heat treated.
Figure 6: Manufacturing process for an aluminum bicycle frame.
2.3.1 Creation of Blank Tubes
The first step in creating a bicycle frame out of 6061 aluminum is to create the
individual tubes that make up the frame. Aluminum tubes are created through a process
known as extrusion. The first step in extrusion is to obtain an aluminum slug. An
aluminum slug is a small, circular piece of aluminum that looks similar to a coin. This
slug is pushed into a die which forces the slug to take the shape and diameters of the
desired tube. After a sufficient amount of material is through the die, the end that is
through is threaded so that it can be further pulled through. Once a sufficient enough
amount of tube is created it is cut both at the die as well as at the cap where the threading
is to create a tube of desired dimensions. After the tubes are cut to the correct length,
they must then be further altered before assembly to ensure proper fit and proper strength
properties [3].

8/15/2019 Material and Design Optimization for an Aluminum Bike Frame
http://slidepdf.com/reader/full/material-and-design-optimization-for-an-aluminum-bike-frame 22/101
15
2.3.2 Altering the Tubes
The most common methods for altering blank bicycle tubes are hydroforming and
mitering the tubes. For hydroforming, the blank tubes with circular cross sections are
altered to yield a more complex and stronger geometry. The concept of the hydroforming
process is simple, and requires only a steel die and a fluid. The blank tube is placed in
the die and the ends of the tube are sealed off. Fluid, usually water, with an anti-
corrosive additive is then pumped into the tube at high pressure. This forces the tube to
expand and thereby conform to the shape of the die. With hydroforming, fluid pressures
can often exceed 135 MPa [25]. A diagram of the tube hydroforming process is shown in
Figure 7.
Figure 7: Hydroforming a blank tube using a die and high pressure fluid [25].
In order for tubes to easily and securely connect to one another in the shape of a
frame, they must be miter cut. By mitering the end of a tube, two tubes can be joined
together in a seamless fashion, making the joint stronger. A machine specifically

8/15/2019 Material and Design Optimization for an Aluminum Bike Frame
http://slidepdf.com/reader/full/material-and-design-optimization-for-an-aluminum-bike-frame 23/101
16
designed for tube mitering is used most often which produces a clean and accurate cut.
Mitering also allows the ends of tubes to sit flush with the sides of the tubes that it will
eventually be joined to [22]. An example of a miter cut tube is shown in Figure 8.
Figure 8: A bicycle tube which has been miter cut [22].
After mitering, the tubes must be joined together. When fabricating an aluminum
bicycle frame, there are a number of different options for joining tubes. The three most
common joining processes are welding, adhesive bonding, and mechanical fastening.
The frames that were tested by the group utilized TIG welding for construction.
2.3.3 Joining the Tubes: TIG Welding
Welding is the method of choice for most manufacturers to join frame tubes, as it
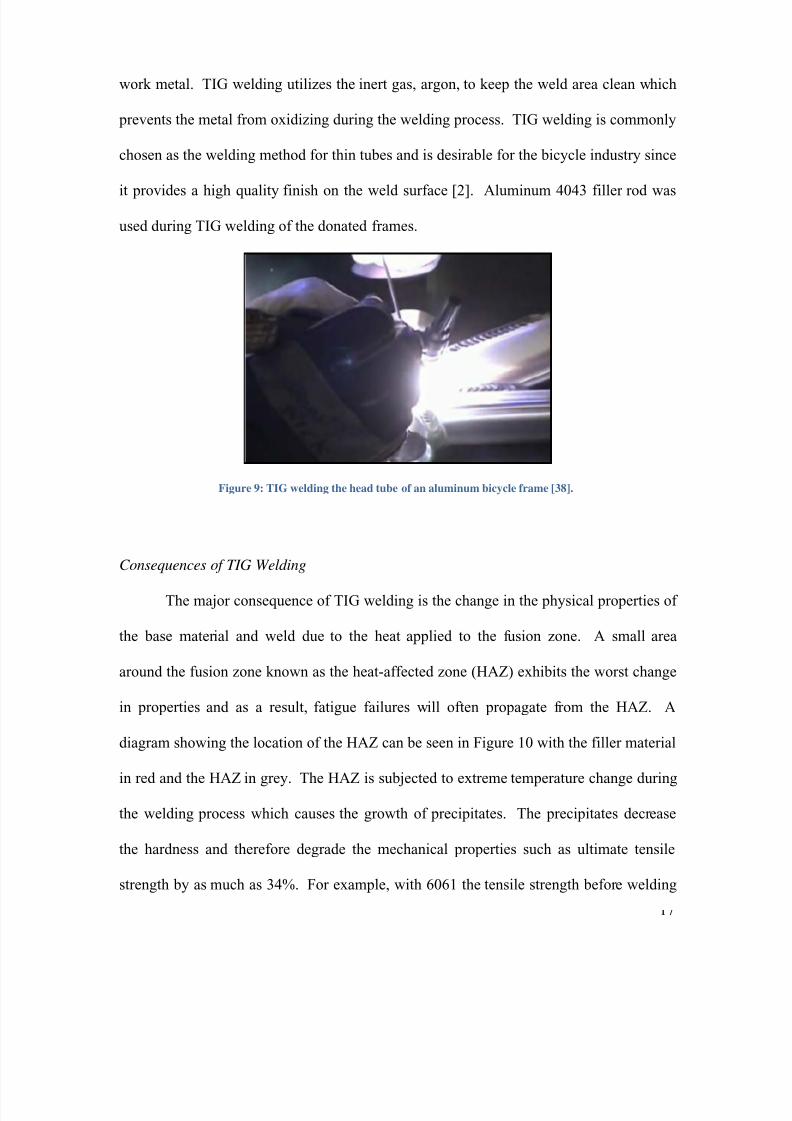
provides high joint strength and is also affordable. TIG welding is the most common
type of welding for 6061 bicycle frames, and was the joining method used for the donated
frames. A photo of this process can be seen in Figure 9. TIG Welding is an arc welding
process in which heat is produced between a non-consumable tungsten electrode and the
8/15/2019 Material and Design Optimization for an Aluminum Bike Frame
http://slidepdf.com/reader/full/material-and-design-optimization-for-an-aluminum-bike-frame 24/101
17
work metal. TIG welding utilizes the inert gas, argon, to keep the weld area clean which
prevents the metal from oxidizing during the welding process. TIG welding is commonly
chosen as the welding method for thin tubes and is desirable for the bicycle industry since
it provides a high quality finish on the weld surface [2]. Aluminum 4043 filler rod was
used during TIG welding of the donated frames.
Figure 9: TIG welding the head tube of an aluminum bicycle frame [38].
Consequences of TIG Welding
The major consequence of TIG welding is the change in the physical properties of
the base material and weld due to the heat applied to the fusion zone. A small area
around the fusion zone known as the heat-affected zone (HAZ) exhibits the worst change
in properties and as a result, fatigue failures will often propagate from the HAZ. A
diagram showing the location of the HAZ can be seen in Figure 10 with the filler material
in red and the HAZ in grey. The HAZ is subjected to extreme temperature change during
the welding process which causes the growth of precipitates. The precipitates decrease
the hardness and therefore degrade the mechanical properties such as ultimate tensile
strength by as much as 34%. For example, with 6061 the tensile strength before welding

8/15/2019 Material and Design Optimization for an Aluminum Bike Frame
http://slidepdf.com/reader/full/material-and-design-optimization-for-an-aluminum-bike-frame 25/101
18
is 310.3 MPa. After welding, the HAZ has a tensile strength of 186.2 MPa. This drastic
loss in strength due to the welding process can seriously affect the life of an aluminum
bike frame [23].
Figure 10: Zones of a TIG weld showing parent material, HAZ, and filler material.
However, there are alternative welding techniques to TIG welding that produce
welds with less substantial heat affected zones. One of these welding methods is Friction
Stir Welding (FSW). FSW involves using a non-consumable tool with downward
pressure to produce the weld, avoiding melting the base material and using lower heat
compared to TIG welding. This process creates a number of zones including the weld
zone, thermo-mechanically affected zone (TMAZ) and a HAZ as seen in Figure 11.
These zones exhibit mechanical properties that are generally poorer than the parent
material, but are better than the properties produced using conventional TIG welding.
Although FSW welding may be practical for use on 6061 bicycle frames, the technology
has not been explored for this application yet, and thus the HAZ created by TIG welding
is still an issue for aluminum bicycle frames [42].
Figure 11: FSW diagram showing parent material, HAZ, TMAZ and weld nugget.
8/15/2019 Material and Design Optimization for an Aluminum Bike Frame
http://slidepdf.com/reader/full/material-and-design-optimization-for-an-aluminum-bike-frame 26/101
19
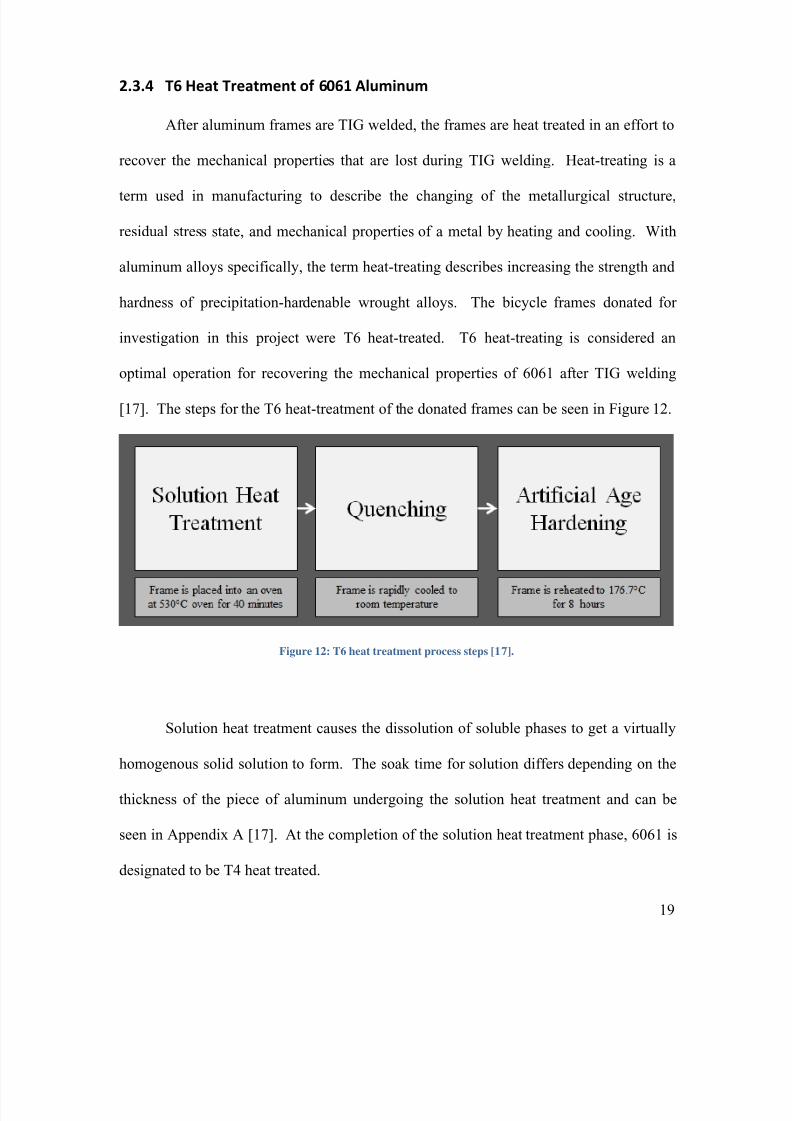
2.3.4 T6 Heat Treatment of 6061 Aluminum
After aluminum frames are TIG welded, the frames are heat treated in an effort to
recover the mechanical properties that are lost during TIG welding. Heat-treating is a
term used in manufacturing to describe the changing of the metallurgical structure,
residual stress state, and mechanical properties of a metal by heating and cooling. With
aluminum alloys specifically, the term heat-treating describes increasing the strength and
hardness of precipitation-hardenable wrought alloys. The bicycle frames donated for
investigation in this project were T6 heat-treated. T6 heat-treating is considered an
optimal operation for recovering the mechanical properties of 6061 after TIG welding
[17]. The steps for the T6 heat-treatment of the donated frames can be seen in Figure 12.
Figure 12: T6 heat treatment process steps [17].
Solution heat treatment causes the dissolution of soluble phases to get a virtually
homogenous solid solution to form. The soak time for solution differs depending on the
thickness of the piece of aluminum undergoing the solution heat treatment and can be
seen in Appendix A [17]. At the completion of the solution heat treatment phase, 6061 is
designated to be T4 heat treated.

8/15/2019 Material and Design Optimization for an Aluminum Bike Frame
http://slidepdf.com/reader/full/material-and-design-optimization-for-an-aluminum-bike-frame 27/101
20
In order to raise the temper designation from T4, quenching, which is considered
to be the most important step in the entire process, is utilized. The purpose of quenching
is to ensure the preservation of the solid solution formed at the high temperatures of the
solution heat treating process. In general, the higher the quenching rate, the higher the
material strength will be. This process must be started with a delay of only a few
seconds, since as the alloy leaves the furnace it begins to lose the strengthening properties
gained in the solution heat treating phase [17].
The last step in completing the T6 heat treat process is known as artificial aging.
This process achieves the precipitation of solute atoms and serves to relieve residual
stresses in the material up to 35%. Without both solution heat treating, and quenching,
this process would not be possible. The two prior processes allow for the precipitates to
form during the artificial aging phase. These precipitates are what add to the final
strength of the alloy and are the key to the T6 heat treat process. The size of these
precipitates can be adjusted by changing both the temperature and time of the aging. For
6061-T6 the optimum precipitate size and thus optimum final strength is achieved by
placing the alloy into a furnace for 8 hours at 176.7°C. The entire heat treating process
allows 6061 to recover 30% of the pre-weld tensile strength [17].
A thorough understanding of the frame design, materials, and manufacturing
processes provided the group with the necessary background to conduct an analysis on
the bike frames, with a specific focus on fatigue behavior.

8/15/2019 Material and Design Optimization for an Aluminum Bike Frame
http://slidepdf.com/reader/full/material-and-design-optimization-for-an-aluminum-bike-frame 28/101
21
3.0 Frame Analysis and Testing
The group developed an integrated FEA methodology to predict the fatigue
failure locations and cycles to failure for those locations. The FEA outputs were then
validated using physical frame testing. This ensured that accurate results could be
predicted with the FEA model. The ASTM F2711-08 test standard was chosen as the
basis for both the FEA model and physical frame testing due to the likelihood of fatigue
failures in the upper front triangle region. This test standard, followed by the FEA
methodology and the physical testing, is described below.
3.1 ASTM Frame Testing Standards
The ASTM F2711-08 test standard was chosen as the standard to follow for the
FEA and physical frame testing. This test standard allows for accurate simulation of real
world frame use to investigate failures. The test standard is comprised of the following
tests.
Horizontal Loading Durability Fatigue Test: This test involves loading the bike
frame at the bottom of the front fork along the x-axis in a cyclic manner with a pre-
determined load. The rear dropouts of the frame are restrained, and the front is mounted
to a test fork in place of an actual fork. The test standard stipulates that the test fork must
not exhibit failure before the tested frame. This test simulates fatigue loading of the
frame to produce fatigue failures. This test is further discussed in Section 3.1.1.
Vertical Loading Durability Fatigue Test: This test involves loading a bicycle
frame vertically just behind the seat post in a cyclic manner with a pre-determined load.

8/15/2019 Material and Design Optimization for an Aluminum Bike Frame
http://slidepdf.com/reader/full/material-and-design-optimization-for-an-aluminum-bike-frame 29/101
22
In this test the rear dropouts are restrained, and the front fork is allowed to roll. This test
simulates fatigue loading of the frame to produce fatigue failures [6].
Impact Strength Test: This test involves mounting the bicycle frame vertically
with a 22.5 kg striker on a test fork attached to the bicycle frame. The frame is rigidly
mounted at the rear axle, and the front axle is allowed to roll. This test simulates an
impact occurring on the front fork of the bicycle [6].
3.1.1 Horizontal Loading Durability Fatigue Test
The horizontal loading durability fatigue test was chosen as the test standard to
follow for frame analysis. This test standard was chosen as it allows for investigation of
fatigue failures in the front triangle of bicycle frames which as described in the problem
statement was the area of focus for this project. The setup and positioning of the frame
for this test are shown in Figure 13 [6].
Figure 13: Test setup for the Horizontal Loading Durability Fatigue Test [6].

8/15/2019 Material and Design Optimization for an Aluminum Bike Frame
http://slidepdf.com/reader/full/material-and-design-optimization-for-an-aluminum-bike-frame 30/101
23
F2614-09 Fatigue Test Requirements
Although the ASTM F2711-08 test standard discusses how to conduct the
Horizontal Loading Durability Test, it does not specify any of the testing parameters such
as the loading and the number of cycles required for a frame to pass. This is because
ASTM testing parameters are based on the classification of use that the bicycle frame
falls under. The F2043-09 ASTM standard classifies bicycle usage into five classes of
use. These classes of use can be seen in Table 5. The F2843-10a, F2802-09, F2868-10,
and F2614-09 ASTM standards define the required cyclic loading for the Horizontal
Loading Durability Test for classes 0-3 respectively. The standards also discuss the
number of cycles that a frame must withstand in order to pass the test. Of note, condition
4 frames do not have their own standard as they are considered extreme off road bicycles,
and as such there is no expectation of the forces that they will be able to withstand. A
complete list of the loading for all of the conditions can be seen in Table 5.
The bicycle frame being investigated by the group falls under the Condition 3
category. As a Condition 3 bicycle, the frame is required to withstand 1,200 N of tensile
force and 600 N of compressive force for at least 50,000 cycles.

8/15/2019 Material and Design Optimization for an Aluminum Bike Frame
http://slidepdf.com/reader/full/material-and-design-optimization-for-an-aluminum-bike-frame 31/101
24
Table 5: ASTM bicycle conditions and F2711-08 test parameters [4],[8],[7],[9],[5]
Condition Intended UseCyclic Tensile
Load (N)
CyclicCompressive
Load (N)Cycles
Condition 0 Children's bikes 600 300 50,000
Condition 1 Paved roads andsmooth surfaces
600 600 100,000
Condition 2Unpaved and gravelroads
800 600 50,000
Condition 3Rough technicalareas, unimprovedtrails, small jumps
1,200 600 50,000
Condition 4Extreme off roadriding
Undefined
The F2843-10a, F2802-09, F2868-10, and F2614-09 ASTM standards also define
the rate at which the loads are cycled during testing. Fatigue failures can be broken down
into two categories: high cycle fatigue and low cycle fatigue. High cycle fatigue is
defined as a failure that occurs from 105 to 108 cycles. High cycle fatigue tests are
generally conducted at frequencies greater than 1,000 Hz, making them unsuitable for
bicycle testing. Low cycle fatigue failures on the other hand are failures that occur from
10 to 105 cycles. These cycles generally occur at a rate of 1 Hz or lower [24]. By the
previous definition, the Horizontal Loading Durability Test is a low cycle fatigue test
with a specified rate of 1 Hz. This test frequency is an accurate representation of the
fatigue loading that a bicycle sees in real world conditions.

8/15/2019 Material and Design Optimization for an Aluminum Bike Frame
http://slidepdf.com/reader/full/material-and-design-optimization-for-an-aluminum-bike-frame 32/101
25
3.2 FEA Methodology
In order to determine fatigue behavior, an FEA methodology was developed to
predict fatigue failure locations and cycles to failure. The methodology is comprised of
taking accurate dimensions from the donated frames, using the dimensions to build a
solid model, gathering accurate material properties off of the donated frames, and then
building a FEA model, with localized meshing control. The methodology for building
the FEA model is overviewed in Figure 14.
Figure 14: Integrated FEA methodology overview.
8/15/2019 Material and Design Optimization for an Aluminum Bike Frame
http://slidepdf.com/reader/full/material-and-design-optimization-for-an-aluminum-bike-frame 33/101
26
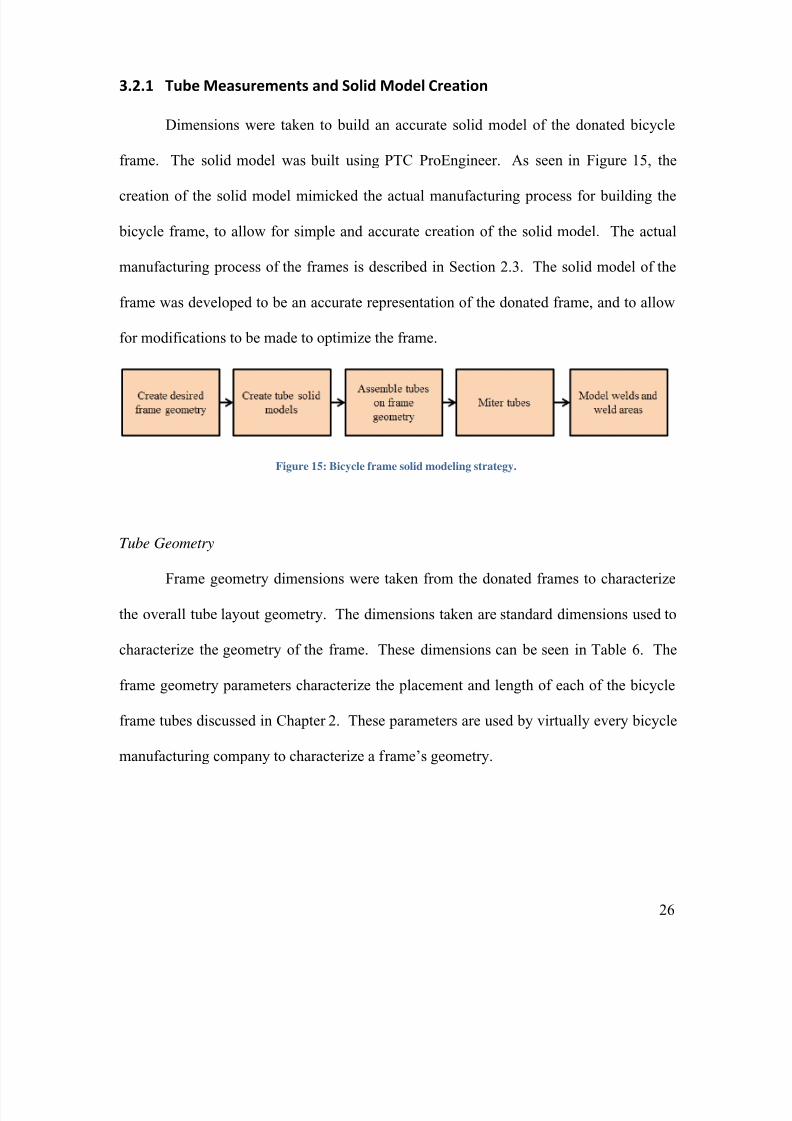
3.2.1 Tube Measurements and Solid Model Creation
Dimensions were taken to build an accurate solid model of the donated bicycle
frame. The solid model was built using PTC ProEngineer. As seen in Figure 15, the
creation of the solid model mimicked the actual manufacturing process for building the
bicycle frame, to allow for simple and accurate creation of the solid model. The actual
manufacturing process of the frames is described in Section 2.3. The solid model of the
frame was developed to be an accurate representation of the donated frame, and to allow
for modifications to be made to optimize the frame.
Figure 15: Bicycle frame solid modeling strategy.
Tube Geometry
Frame geometry dimensions were taken from the donated frames to characterize
the overall tube layout geometry. The dimensions taken are standard dimensions used to
characterize the geometry of the frame. These dimensions can be seen in Table 6. The
frame geometry parameters characterize the placement and length of each of the bicycle
frame tubes discussed in Chapter 2. These parameters are used by virtually every bicycle
manufacturing company to characterize a frame’s geometry.

8/15/2019 Material and Design Optimization for an Aluminum Bike Frame
http://slidepdf.com/reader/full/material-and-design-optimization-for-an-aluminum-bike-frame 34/101
27
Table 6: Geometry values for the solid model of the bicycle frame [37]
Parameter Value
Head tube angle 68.5 degrees
Seat tube angle 72 degrees
Seat tube length 44.5 cm
Top tube length 59.7 cm
Chain stay length 42.4 cm
Head tube length 12.7 cm
Using these parameters, the geometry base sketch was made in ProEngineer. This
sketch, shown in Figure 16, represents a side view of the frame. As seen in Table 6, all
of the parameters are included in the sketch of the frame, with the addition of two
parameters on the head tube. The additional parameters define where the top and down
tubes contact the head tube, as well as length of the head tube above the top tube. Since
these parameters were not given by the sponsor they had to be obtained by physically
measuring the frame where the top tube and down tube mate to the head tube.
Figure 16: ProEngineer sketch of solid model geometry.

8/15/2019 Material and Design Optimization for an Aluminum Bike Frame
http://slidepdf.com/reader/full/material-and-design-optimization-for-an-aluminum-bike-frame 35/101
28
After creating the geometry, the eight individual tubes were created. The creation
of each of the tubes can be seen in the following sections.
Down Tube
The down tube of the donated frames features a complex geometry including both
a variable cross section and wall thickness. As seen in Figure 17, the down tube was
sectioned into 10 total pieces to accurately model the tube. Vernier calipers were used to
take measurements of the cross section and wall thickness of the 10 different sections.
Figure 17: Sectioning of the down tube for cross section measurements.
Table 7 summarizes the measurements taken from the frame. There were several
sections of the frame that had a linear change in dimension, allowing for 4 total modeling
sections to be used. The 4 sections consisted of a sweep with a uniform wall thickness,
an extrusion with a variable wall thickness, another sweep with a uniform wall thickness,
and finally an extrusion with a variable wall thickness.

8/15/2019 Material and Design Optimization for an Aluminum Bike Frame
http://slidepdf.com/reader/full/material-and-design-optimization-for-an-aluminum-bike-frame 36/101
29
Table 7: Data obtained from sectioning down tube
Distance fromHead Tube (cm)
Thickness(cm)
Overall Height(cm)
Max. Width(cm)
0 .29 5.08 4.06Sweep
10.2 .29 4.75 4.25Extrude
20.3 .15 4.75 4.25 Sweep45.7 .15 4.01 5.74
Extrude64.9 .10 4.01 5.74
The 4 sections of the frame defined by the dimensions in Table 7 can be seen in
Figure 18. As seen in the figure, the cross sections were defined at each of the specified
distances, and the cross sections were swept in-between.
Figure 18: Solid model of down tube with accurate geometry.

8/15/2019 Material and Design Optimization for an Aluminum Bike Frame
http://slidepdf.com/reader/full/material-and-design-optimization-for-an-aluminum-bike-frame 37/101
30
Top Tube
The top tube also featured a complex geometry with variable cross sections.
Similar to the down tube, the top tube was cut into 9 sections to analyze the cross section
dimensional characteristics. The sectioned top tube can be seen in Figure 19.
Figure 19: Sectioned top tube for cross section measurements.
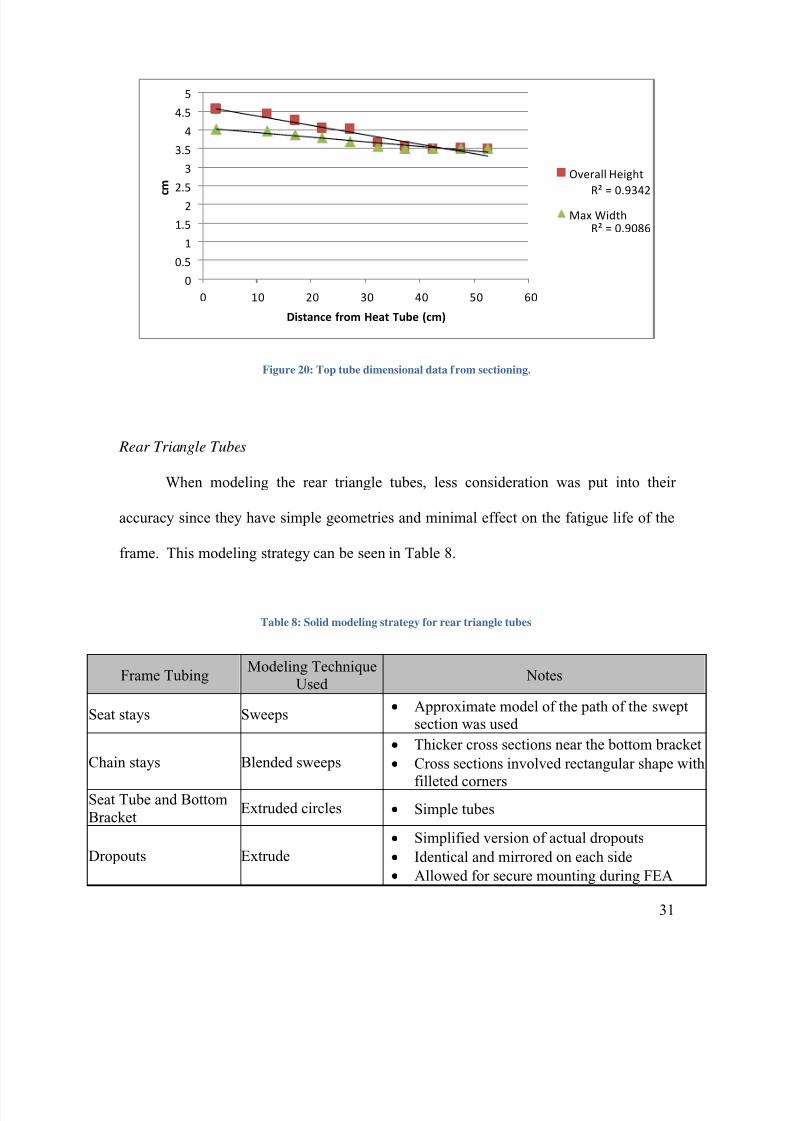
Once dimensions were taken from the frame sections they were plotted. As
shown in Figure 20 the top tube dimensions change linearly, allowing for a simple swept
blend to be used to model the tube. The correlation coefficients, as seen in Figure 20,
were close to 1 which justifies the decision to use swept blend with linear dimension
change.
8/15/2019 Material and Design Optimization for an Aluminum Bike Frame
http://slidepdf.com/reader/full/material-and-design-optimization-for-an-aluminum-bike-frame 38/101
31
R² = 0.9342
R² = 0.9086
0
0.5
1
1.5
2
2.5
3
3.5
4
4.5
5
0 10 20 30 40 50 60
c m
Distance from Heat Tube (cm)
Overall Height
Max Width
Figure 20: Top tube dimensional data from sectioning.
Rear Triangle Tubes
When modeling the rear triangle tubes, less consideration was put into their
accuracy since they have simple geometries and minimal effect on the fatigue life of the
frame. This modeling strategy can be seen in Table 8.
Table 8: Solid modeling strategy for rear triangle tubes
Frame TubingModeling Technique
Used Notes
Seat stays Sweeps• Approximate model of the path of the swept
section was used
Chain stays Blended sweeps• Thicker cross sections near the bottom bracket
• Cross sections involved rectangular shape with
filleted cornersSeat Tube and BottomBracket
Extruded circles • Simple tubes
Dropouts Extrude
• Simplified version of actual dropouts
• Identical and mirrored on each side
• Allowed for secure mounting during FEA

8/15/2019 Material and Design Optimization for an Aluminum Bike Frame
http://slidepdf.com/reader/full/material-and-design-optimization-for-an-aluminum-bike-frame 39/101
32
Tube Assembly and Mitering
The created tubes were then assembled together over the frame geometry sketch.
The tubes were fixed to the appropriate locations based on the geometry sketch. For
example, the bottom end of the seat tube was fixed at the connection point to the down
tube. Once all the tubes were assembled, they were miter cut so that they did not
intersect through the tubes they were mated with. A solid model of a miter cut tube can
be seen in Figure 21. This process mimics how frames are actually manufactured. The
mitering was accomplished by copying the geometry from the mated tube, then using this
geometry to cut the correct portion of the mitered tube.
Figure 21: Example of a solid model mitered tube.
Accurate Material Properties
After the solid model was assembled, material properties were taken off of the
donated frames, with specific focus on the material properties of the weld areas. The
weld areas on the tubes were divided into three zones. These zones represented the weld,

8/15/2019 Material and Design Optimization for an Aluminum Bike Frame
http://slidepdf.com/reader/full/material-and-design-optimization-for-an-aluminum-bike-frame 40/101
33
the HAZ, and the unaffected parent material. By dividing the tube into these three zones,
different properties were able to be applied to each area.
The sizing of the three different zones was determined by taking Rockwell
hardness measurements on samples from each respective zone. Once the samples had
been prepared, they were tested on a Rockwell indenter using the Rockwell E scale
(HRE). The HRE utilizes a 1/8” diameter ball to indent the material with a minor load of
10kg and major load of 100 kg. By doing this test, the hardness values of the material
moving away from the weld were determined. Using this information, the zone sizes
were established to best represent the changing properties.
The HRE scale was chosen specifically for this application due to the ability to
correlate hardness values to ultimate tensile strength (UTS). In this case, a simple
equation = 10.66− 19.42 ∗ ln(1− 109 ) was used to derive the variation in UTS
across each zone [49]. Figure 22 shows the variation in UTS.

8/15/2019 Material and Design Optimization for an Aluminum Bike Frame
http://slidepdf.com/reader/full/material-and-design-optimization-for-an-aluminum-bike-frame 41/101
34
Figure 22: UTS measurements obtained from Rockwell hardness test.
Once these measurements were completed, the average UTS for each zone was
calculated and inputted into the solid model to complete the modeling of the three zones.
The final data used to model each zone is shown in Table 9.
Table 9: UTS summary for different weld regions
Weld HAZ Parent Material
UTS (MPa) 289.7 239.3 307.6
Length (cm) 0.95 0.63 Part length

8/15/2019 Material and Design Optimization for an Aluminum Bike Frame
http://slidepdf.com/reader/full/material-and-design-optimization-for-an-aluminum-bike-frame 42/101
35
As can be seen in the previous table, the parent material and weld exhibited a
higher UTS than the HAZ. This result was expected, as the ASM Handbook defines a
similar variation in UTS across a 6061-T6 weldment as seen in Appendix E.
The data for the HAZ and weld sizing was used to modify the solid model to
include these areas. Figure 23 shows the front triangle area with the weld zones marked.
The red color represents the weld, the yellow represents the HAZ, and the grey represents
the parent material.
Figure 23: Solid model showing TIG welding zones.
The entire frame solid model can be seen in Figure 24. This includes all of the
assembled tubes and the weld zones.

8/15/2019 Material and Design Optimization for an Aluminum Bike Frame
http://slidepdf.com/reader/full/material-and-design-optimization-for-an-aluminum-bike-frame 43/101
36
Figure 24: Completed solid model of physical frame.
Test Fork Solid Model
A test fork solid model was created based on the ASTM F2711-08 test
requirements to allow for the FEA to be conducted. The test standard defines two
parameters for the fork, length of the fork, and rake of the front dropout connection. The
design of the test fork was representative of the design of a fork manufactured by the
group for testing discussed in Section 3.3.1.
3.2.2 FEA
Once the solid model of the donated frame and the test fork were created, an FEA
was conducted with ANSYS Workbench 13.0 using the solid model. An FEA is a
computer based numerical method which models an object with a mesh of separate
elements connected by nodes to determine stress, strain and a number of other properties
8/15/2019 Material and Design Optimization for an Aluminum Bike Frame
http://slidepdf.com/reader/full/material-and-design-optimization-for-an-aluminum-bike-frame 44/101
37
[14]. The decision was made to use ANSYS Workbench 13.0 due to its ability to import
solid models created in ProEngineer, and the software’s ability to simulate fatigue
loading on the frame. The procedure for setting up the model in ANSYS is described in
the following sections.
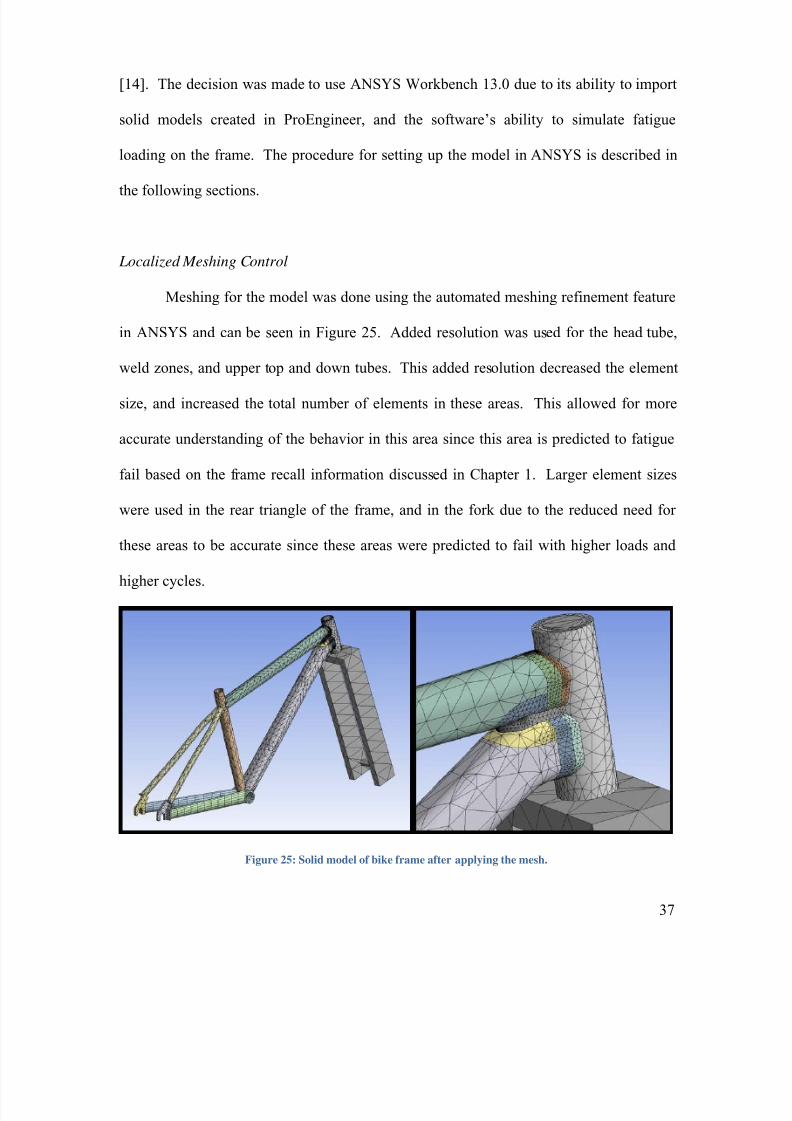
Localized Meshing Control
Meshing for the model was done using the automated meshing refinement feature
in ANSYS and can be seen in Figure 25. Added resolution was used for the head tube,
weld zones, and upper top and down tubes. This added resolution decreased the element
size, and increased the total number of elements in these areas. This allowed for more
accurate understanding of the behavior in this area since this area is predicted to fatigue
fail based on the frame recall information discussed in Chapter 1. Larger element sizes
were used in the rear triangle of the frame, and in the fork due to the reduced need for
these areas to be accurate since these areas were predicted to fail with higher loads and
higher cycles.
Figure 25: Solid model of bike frame after applying the mesh.

8/15/2019 Material and Design Optimization for an Aluminum Bike Frame
http://slidepdf.com/reader/full/material-and-design-optimization-for-an-aluminum-bike-frame 45/101
38
Boundary Conditions and Loading
Following the ASTM F2711-08 test standard, boundary conditions and loads were
applied to the frame in ANSYS Workbench 13.0. A force of 1,200 N was applied to the
test fork so that the force was parallel to the rear dropouts. The force was applied in the
direction away from the rear dropouts as defined by the ASTM F2711-08 standard. Since
tensile stress is the cause of fatigue failures the group decided to model the 1,200 N
tensile force for analysis. Boundary conditions were then applied to the rear dropouts as
fixed support conditions as defined by the ASTM F2711-08 test standard.
FEA Output Model
The group investigated areas on the frame with high levels of tensile strain to
predict where the failure on the frame would occur. This was done by generating result
outputs for the model showing tensile stress levels. The analysis was based on the fact
that areas with high levels of tensile stress produce high levels of tensile strain, and thus
produce fatigue failures. The output from ANSYS can be seen below in Figure 26.
Figure 26: FEA output showing tensile stress and correlation to fatigue failure location.

8/15/2019 Material and Design Optimization for an Aluminum Bike Frame
http://slidepdf.com/reader/full/material-and-design-optimization-for-an-aluminum-bike-frame 46/101
39
Based on the FEA output, there were three main areas on the bicycle frame with a
susceptibility to fatigue failure. These areas were the top tube near the weld to the down
tube, on the down tube near the weld to the seat tube, and on the down tube near the weld
to the head tube. Based on the grain structure of the top tube and down tube discussed in
Chapter 2.2.1, the group decided that the down tube tensile and fatigue strength would be
higher than the top tube, especially near the head tube due to the small grain size. Small
grains generally correlate to higher fatigue strength [27]. Due to this, the predicted
fatigue failure locations include the top tube near the weld to the down tube, and the
down tube near the weld to the seat tube.
The group worked to then calculate the predicted number of cycles before failure
in these two locations. This was done by determining stress levels in the areas likely to
produce fatigue failure and use these levels to determine cycles to failure from S-N
curves. The stress levels for these areas were taken from an output in ANSYS showing
von Mises stress since ANSYS does not have an output showing only tensile stress. This
output can be seen in Figure 27. From the solution output, the stresses in these areas
were calculated to be approximately 95 MPa for the three areas of predicted fatigue
failure.

8/15/2019 Material and Design Optimization for an Aluminum Bike Frame
http://slidepdf.com/reader/full/material-and-design-optimization-for-an-aluminum-bike-frame 47/101

8/15/2019 Material and Design Optimization for an Aluminum Bike Frame
http://slidepdf.com/reader/full/material-and-design-optimization-for-an-aluminum-bike-frame 48/101
41
Figure 28: Aluminum 6061-T6 S-N curve showing predicted failure at 490,000 cycles.
From the S-N curve, the group concluded that the predicted cycles to failure for
the bicycle frame was 490,000 cycles on the top tube near the weld with the down tube,
and on the down tube near the weld to the seat tube.
3.3 Frame Testing
Physical fatigue tests were conducted on the donated frames to validate the
integrated FEA methodology. These physical tests followed the ASTM F2711-08
8/15/2019 Material and Design Optimization for an Aluminum Bike Frame
http://slidepdf.com/reader/full/material-and-design-optimization-for-an-aluminum-bike-frame 49/101
42
horizontal fatigue test standard, and allowed for validation of the FEA results. The group
worked to develop a test rig, tested the frames, and observed fatigue failures on the
frames.
In order to conduct the horizontal fatigue test outlined in the ASTM F2711-08 test
standard, an adequate testing rig first had to be constructed. The group created the test
rig by designing and creating a test rig structure, and control system for the rig.
3.3.1 Test Rig Structure Development
The test rig structure had to meet a number of specifications as defined by the
ASTM F2711-08 test standard. These specifications can be seen below.
Test Rig Structure Specifications
• Securely hold the rear dropouts of the bike frame
• Securely hold the head tube of the frame to a test fork
•
Include a rigid test fork that will not deflect with up to 1500 N of force• Hold the rear dropouts and test fork mount at the same height
• Apply a force of 1500 N on a test fork in the positive direction (away from the
rear dropouts)
•
Apply a force of 750 N on a test fork in the negative direction (towards the rear
dropouts)
• Run for at least 500,000 cycles
• Be able to be mounted on a 5’ by 2.5’ desk
The group designed the test rig to meet the specifications above. The design
created by the group involved a test rig frame, air cylinder, dropout holders and a test

8/15/2019 Material and Design Optimization for an Aluminum Bike Frame
http://slidepdf.com/reader/full/material-and-design-optimization-for-an-aluminum-bike-frame 50/101
43
fork. These components can be seen in Figure 29, and the specific design and fabrication
of each of these elements is described in the following paragraphs.
Figure 29: Structural components of test rig.
Test Rig Frame
A test rig frame was chosen as the first part of the test structure to design and
fabricate. The test rig frame was designed to be the supporting structure for which the
other structural components were mounted. The bicycle frame was then horizontally
mounted to these components. T-slotted extrusions from 80/20 were chosen to use for
the rig support structure. This decision was based on the extrusions’ adequate material
properties, ease of assembly, and vibration proof connections. Made of 6105-T5
aluminum, 80/20 is a modular industrial erector set, allowing for easy assembly. The
6105-T5 aluminum 80/20 extrusions were predicted to have adequate stiffness (82 GPa)
8/15/2019 Material and Design Optimization for an Aluminum Bike Frame
http://slidepdf.com/reader/full/material-and-design-optimization-for-an-aluminum-bike-frame 51/101
44
to support testing. The connections utilize a 2 degree drop lock, which makes the
connections vibration proof, which is favorable based on the prediction of high vibrations
during testing [1].
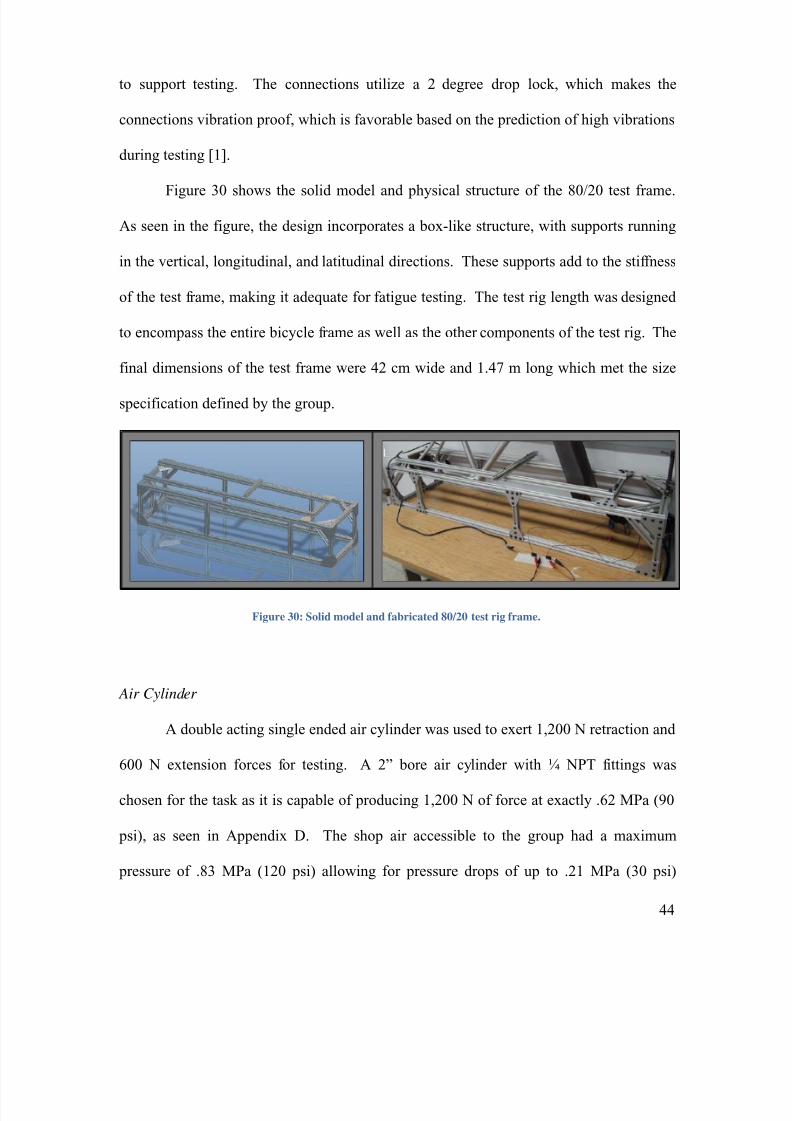
Figure 30 shows the solid model and physical structure of the 80/20 test frame.
As seen in the figure, the design incorporates a box-like structure, with supports running
in the vertical, longitudinal, and latitudinal directions. These supports add to the stiffness
of the test frame, making it adequate for fatigue testing. The test rig length was designed
to encompass the entire bicycle frame as well as the other components of the test rig. The
final dimensions of the test frame were 42 cm wide and 1.47 m long which met the size
specification defined by the group.
Figure 30: Solid model and fabricated 80/20 test rig frame.
Air Cylinder
A double acting single ended air cylinder was used to exert 1,200 N retraction and
600 N extension forces for testing. A 2” bore air cylinder with ¼ NPT fittings was
chosen for the task as it is capable of producing 1,200 N of force at exactly .62 MPa (90
psi), as seen in Appendix D. The shop air accessible to the group had a maximum
pressure of .83 MPa (120 psi) allowing for pressure drops of up to .21 MPa (30 psi)

8/15/2019 Material and Design Optimization for an Aluminum Bike Frame
http://slidepdf.com/reader/full/material-and-design-optimization-for-an-aluminum-bike-frame 52/101
45
before the compressor would be unable to provide the necessary pressure. This ensured
the air cylinder would always have enough air pressure to transmit the correct load even
when other machines were using air from the compressor. The air cylinder extends when
pressure is fed into the back section, and retracts when air is pumped into the front
section. The air cylinder is shown in Figure 31.
Four quarter inch mounting holes were drilled into two of the cross beams on the
80/20 test frame to mount the air cylinder to the test rig. These holes matched up with
the mounting holes provided on the air cylinder, allowing for it to be bolted directly to
the support structure.
Figure 31: Air cylinder used to exert forces onto tested bike frame.
Dropout Holders
Two of the most crucial components of the test rig were the front and rear dropout
holders. These holders act as the connection from the test rig to the bicycle frame, and
must be secure enough to allow for proper fatigue loading of the donated frame. Per the
ASTM F2711-08 standard, there are only two specifications for the bicycle frame
dropouts: they must be securely held, and must also be horizontally aligned with the

8/15/2019 Material and Design Optimization for an Aluminum Bike Frame
http://slidepdf.com/reader/full/material-and-design-optimization-for-an-aluminum-bike-frame 53/101
46
force. This concept is illustrated in Section 2.6.1. The rear dropouts were secured to a
plate which was then bolted to the end of the rig opposite the air cylinder. Additional
80/20 extrusions and bolts were used in securing this section to ensure its stability. This
setup can be seen in Figure 32.
Figure 32: Rear dropout base plate fixtured to test rig frame.
The rear dropout holder is constructed and mounted in a way that accomplishes
two important tasks. First, by placing all of the bolts for the dropout holder in axial
tension and compression, the assembly becomes much stronger. This is because bolts are
designed to be loaded axially and not in shear. The second important aspect is that the
rear dropout holder is mounted in such a way that there is no unsupported moment during
loading. Again, this ensures that the test rig structure is as solid as possible, and that the
loads from the air cylinder will be properly transmitted to the bicycle frame.
Steel bar stock was chosen to use to manufacture the dropouts to ensure that they
would not fail or deflect during operation of the test rig. Manufacturing the dropout

8/15/2019 Material and Design Optimization for an Aluminum Bike Frame
http://slidepdf.com/reader/full/material-and-design-optimization-for-an-aluminum-bike-frame 54/101
47
holders consisted of drilling and tapping two mounting holes into the back of the plates to
secure them to the back plate. Next the mounting holes for attaching the rear of the
bicycle frame to the dropout holders were drilled. After the rear dropout holders were
created, the mounting plate that connects them to the test rig itself needed to be
fabricated. This was completed by acquiring a bronze base plate and drilling seven holes
into it: four holes to mount the rear dropouts, and as three additional holes to mount the
base plate to the test rig. An exploded view of this assembly can be seen in Figure 33.
Figure 33: Exploded view of rear dropout assembly.
The front dropout was created from a length of square cross-section aluminum.
The piece was first cut to length on the band saw, and then the mini-mill was used to cut
and tap the two mounting holes that would attach it to the test fork. A third and final hole
was then drilled and tapped in the center to connect the dropout to the air cylinder’s
piston. This allowed the group to utilize the threaded rod attached to the piston, and
further simplified the fabrication process. The decision to use aluminum was based on

8/15/2019 Material and Design Optimization for an Aluminum Bike Frame
http://slidepdf.com/reader/full/material-and-design-optimization-for-an-aluminum-bike-frame 55/101
48
ease of manufacturing to make the center hole, and was of adequate strength due to the
large cross sectional area. This setup can be seen in Figure 34.
Figure 34: Threaded rod of air cylinder screwed into front dropout.
Test Fork
Attached to the front dropout holder was a test fork, which was designed and
manufactured based on the ASTM F2711-08 standard. The design of the test fork is
composed of two plate arms with a plate cross member and tube running through the
cross member. The test fork served as the main link between the air cylinder and the
bicycle frame, and needed to be strong enough to ensure that all of the force was
transmitted into the frame. Steel was the material of choice because it has a much higher
modulus of elasticity (205 GPa) when compared to 6061 (72 GPa) as discussed in
Chapter 2. With a higher modulus of elasticity, the steel required much more force to
deflect compared to the aluminum frame.

8/15/2019 Material and Design Optimization for an Aluminum Bike Frame
http://slidepdf.com/reader/full/material-and-design-optimization-for-an-aluminum-bike-frame 56/101
49
The group manufactured the test fork using a lathe, overhead mill, and band saw.
The steerer tube was turned using the lathe to 2.86 cm in diameter. A close fit hole for
the steerer tube was cut through the cross member using an overhead mill. The test fork
arms and cross member were cut from a 1.27 cm thick plate using a band saw. The test
fork arms were welded onto the cross member, and the steerer tube was welded into the
hole of the cross member. A standard 1 1/8 inch headset was used for mounting the fork
to the frame. The solid model of the test fork along with the completed test fork can be
seen in Figure 35.
Figure 35: Solid model of test fork and fabricated test fork.

8/15/2019 Material and Design Optimization for an Aluminum Bike Frame
http://slidepdf.com/reader/full/material-and-design-optimization-for-an-aluminum-bike-frame 57/101
50
3.3.2 Test Rig Controls Development
While designing and manufacturing the structure of the test rig, the group
concurrently designed the control system. The control system needed to meet a number
of specifications to be able to perform the test following the ASTM F2711-08 standard.
The group defined the specifications required to control the rig as follows:
Test Rig Controls Specifications
• Direct .83 MPa (120 psi) of air pressure into the air cylinder for tensile loading
• Direct .41 MPa (60 psi) of air pressure into the air cylinder for compression
loading
•
Cycle air loads at 1 Hz
• Run for at least 500,000 cycles
• Run using resources available in HL-031 Laboratory
The group worked to accomplish the task specifications and came up with the
design described below. The group decided that the system would consist of 2 solenoids,
2 pressure regulators, and an electrical circuit that would be controlled using a LabVIEW
Virtual Instrument (VI).
The entire control system for the test rig can be seen in Figure 36. As seen in the
figure, the orange boxes represent the electrical circuit, with a DC input signal from
LabVIEW, which control the solenoids. The solenoid valves allow air from the air
compressor, regulated using pressure regulators, into the double acting pneumatic
cylinder. Each of the components of the control system are discussed below Figure 36.
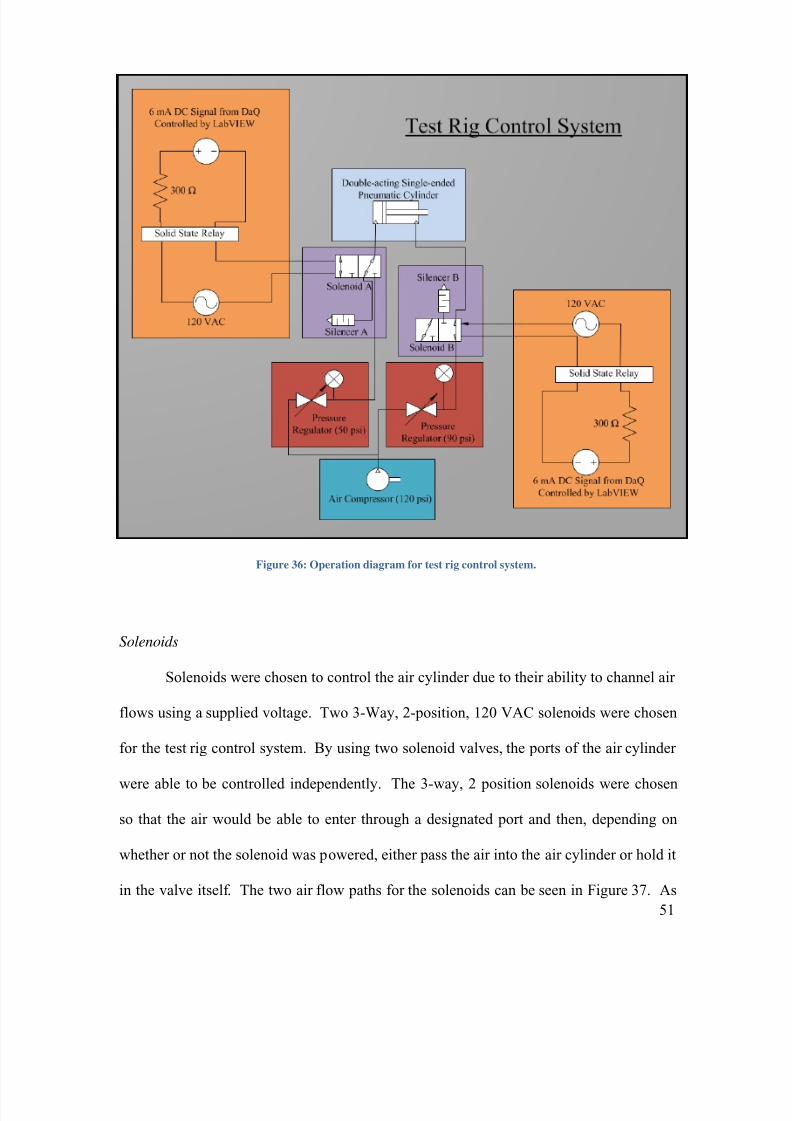
8/15/2019 Material and Design Optimization for an Aluminum Bike Frame
http://slidepdf.com/reader/full/material-and-design-optimization-for-an-aluminum-bike-frame 58/101
51
Figure 36: Operation diagram for test rig control system.
Solenoids
Solenoids were chosen to control the air cylinder due to their ability to channel air
flows using a supplied voltage. Two 3-Way, 2-position, 120 VAC solenoids were chosen
for the test rig control system. By using two solenoid valves, the ports of the air cylinder
were able to be controlled independently. The 3-way, 2 position solenoids were chosen
so that the air would be able to enter through a designated port and then, depending on
whether or not the solenoid was powered, either pass the air into the air cylinder or hold it
in the valve itself. The two air flow paths for the solenoids can be seen in Figure 37. As

8/15/2019 Material and Design Optimization for an Aluminum Bike Frame
http://slidepdf.com/reader/full/material-and-design-optimization-for-an-aluminum-bike-frame 59/101
52
seen in the figure, the air can travel through the solenoid when powered, and exhaust
through the solenoid when not powered.
Figure 37: Solenoid air flow path diagram.
Solenoid valves powered by 120 VAC were chosen so that they could be powered
using a common wall outlet. The solenoids used on the test rig can be seen in Figure 38.
As seen, the solenoid is mounted directly to the bottom of the air cylinder.
Figure 38: Solenoid valve connected to air cylinder.

8/15/2019 Material and Design Optimization for an Aluminum Bike Frame
http://slidepdf.com/reader/full/material-and-design-optimization-for-an-aluminum-bike-frame 60/101
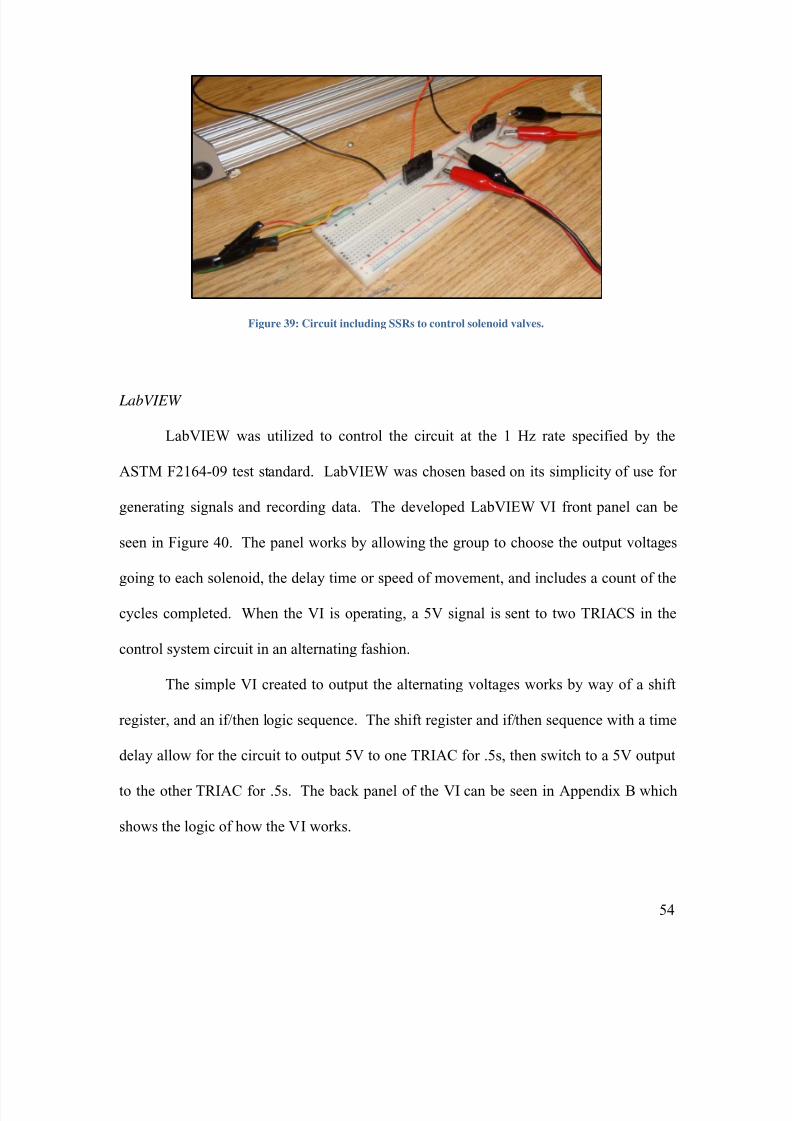
8/15/2019 Material and Design Optimization for an Aluminum Bike Frame
http://slidepdf.com/reader/full/material-and-design-optimization-for-an-aluminum-bike-frame 61/101
54
Figure 39: Circuit including SSRs to control solenoid valves.
LabVIEW
LabVIEW was utilized to control the circuit at the 1 Hz rate specified by the
ASTM F2164-09 test standard. LabVIEW was chosen based on its simplicity of use for
generating signals and recording data. The developed LabVIEW VI front panel can be
seen in Figure 40. The panel works by allowing the group to choose the output voltages
going to each solenoid, the delay time or speed of movement, and includes a count of the
cycles completed. When the VI is operating, a 5V signal is sent to two TRIACS in the
control system circuit in an alternating fashion.
The simple VI created to output the alternating voltages works by way of a shift
register, and an if/then logic sequence. The shift register and if/then sequence with a time
delay allow for the circuit to output 5V to one TRIAC for .5s, then switch to a 5V output
to the other TRIAC for .5s. The back panel of the VI can be seen in Appendix B which
shows the logic of how the VI works.

8/15/2019 Material and Design Optimization for an Aluminum Bike Frame
http://slidepdf.com/reader/full/material-and-design-optimization-for-an-aluminum-bike-frame 62/101

8/15/2019 Material and Design Optimization for an Aluminum Bike Frame
http://slidepdf.com/reader/full/material-and-design-optimization-for-an-aluminum-bike-frame 63/101
56
Figure 41: Testing rig with structure and controls.
3.3.4 Testing Procedure
With the test rig completed, the group developed a comprehensive testing
procedure to ensure accurate results with the test. The procedure for conducting the tests
can be seen below.
Setup
1. Ensure that all bolts and screws are tightened on the test rig
2. Fixture test rig to table using C-clamps
3. Connect the front dropout holder to the threaded rod on the air cylinder
4. Place rear dropouts on dropout holders and tighten skewers
5.
Ensure that frame is sitting level on the test rig
6. Connect solenoid valves to air cylinder ports
7. Connect tubes running from solenoid valves to pressure regulators
8. Connect pressure regulators to pressure accumulators

8/15/2019 Material and Design Optimization for an Aluminum Bike Frame
http://slidepdf.com/reader/full/material-and-design-optimization-for-an-aluminum-bike-frame 64/101
57
9. Connect shop air to each pressure tank
10. Using pressure regulators adjust air pressure to desired amount
a. For this application, the necessary pressures are .34 MPa (50 psi) to the
back port and .62 MPa (90 psi) to the front port
11.
Setup high definition video camera level with front triangle connection (emphasison top tube / down tube weld zone)
Testing
12.
Run test for 10 cycles while taking strain measurements (described in next
section)
13. Ensure that test rig is creating proper strain levels on the frame
14. Begin recording video
15. Begin applying load at 1 Hz (Ensure LabVIEW file is set to Time T=0)
16. Visually inspect frame for first 3,000 cycles
17. Visually inspect frame after 50,000 cycles (observe/take notes during crack
growth, record initial crack through propagation)
18. Conclude test when fracture occurs (Fracture is a crack, tear, or separation at the
surface of the frame that is visible to the unaided eye)
3.3.5 Test Rig Performance Investigation
In order to determine whether the test rig was working correctly, a strain gage was
used to monitor the strain of a section of the bicycle frame. The recorded strain was then
compared to the FEA to ensure that the proper strain levels were being achieved.
In order to determine the strain of the frame during testing, a strain gage was
attached to the frame on a flat area which the FEA indicated would have high levels of
strain during the test. This area was determined using a FEA of strain under loading.
The FEA solution can be seen in Figure 27. Based on the solution, the group chose to

8/15/2019 Material and Design Optimization for an Aluminum Bike Frame
http://slidepdf.com/reader/full/material-and-design-optimization-for-an-aluminum-bike-frame 65/101
58
place a strain gage on the bottom of the down tube with expectations of strain in the
range of 800-1,200 microstrains (strain expressed in parts per million).
Figure 42: FEA strain levels (left) and strain gage placement (right).
A strain gage was attached to the frame on the underside of the down tube as seen
in Figure 42. In order to monitor the strain, the group chose to use a LabVIEW VI as
well as a Wheatstone bridge. This decision was made based on the ease of developing a
VI to record the strain from the strain gage.
A Wheatstone bridge was chosen to monitor the small change in resistance of the
strain gage to determine the strain during the test. Without the use of the Wheatstone
bridge no change in resistance would be perceivable, as it allows for accurate recording
of small resistance changes. The schematic for the Wheatstone bridge used can be seen
in Figure 43. The strain gage attached to the frame functions as resistor 4 (R4) in the
schematic, and when the resistance changes as the gage is flexed, the voltage between
nodes A and C is measured and the resulting strain can then be calculated.

8/15/2019 Material and Design Optimization for an Aluminum Bike Frame
http://slidepdf.com/reader/full/material-and-design-optimization-for-an-aluminum-bike-frame 66/101
59
Figure 43: Wheatstone bridge schematic (left) and physical layout (right).
The physical Wheatstone bridge circuit can be seen in Figure 43. An input
voltage with cables monitoring the voltage is attached to the circuit, as well as cables
measuring the voltage between nodes A and C.
LabVIEW was chosen as the software to monitor and record the strain of the
frame. The front panel of the VI can be seen in Figure 44. The front panel allowed the
group to be able to set the output channels, the delay time for recording, a voltage output
to the strain gage, data for the strain gage, and to perform a calibration by simulating
strain using shunt resistors. Once the data was recorded for each shunt resistor, these
values were compared to the calculated strain for each change in resistance, and a slope
and intercept calibration was developed.
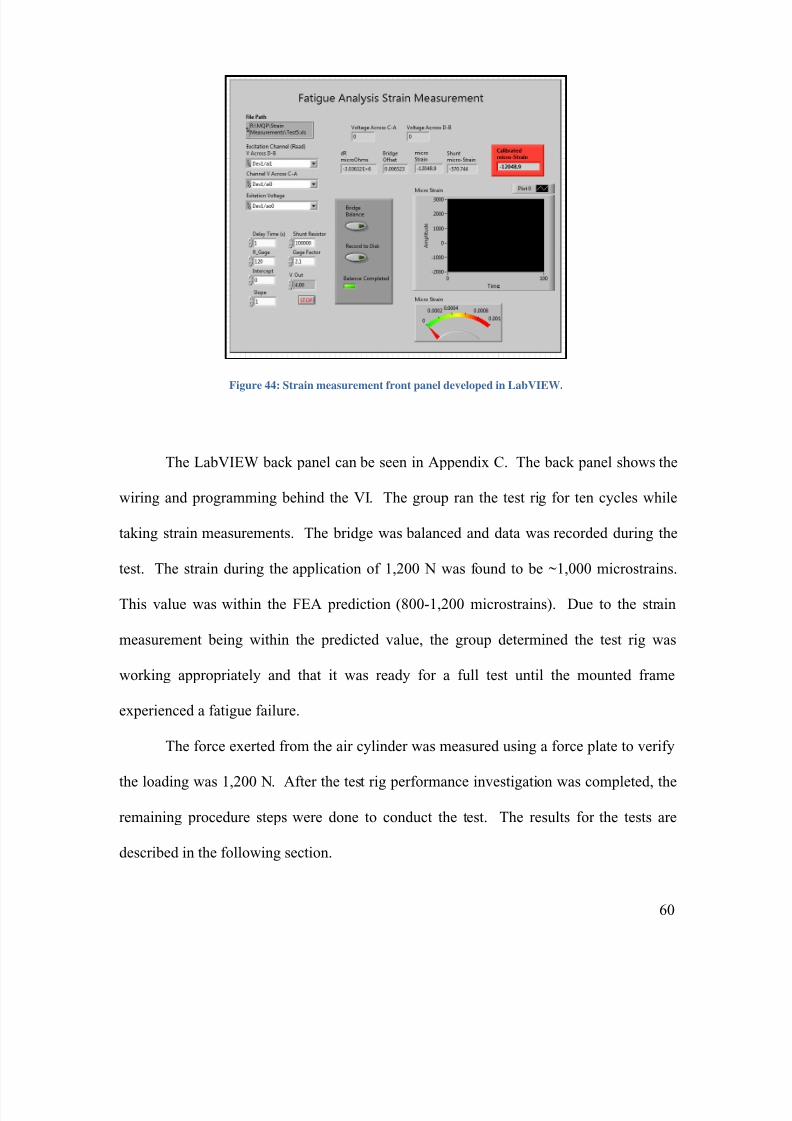
8/15/2019 Material and Design Optimization for an Aluminum Bike Frame
http://slidepdf.com/reader/full/material-and-design-optimization-for-an-aluminum-bike-frame 67/101
60
Figure 44: Strain measurement front panel developed in LabVIEW.
The LabVIEW back panel can be seen in Appendix C. The back panel shows the
wiring and programming behind the VI. The group ran the test rig for ten cycles while
taking strain measurements. The bridge was balanced and data was recorded during the
test. The strain during the application of 1,200 N was found to be ~1,000 microstrains.
This value was within the FEA prediction (800-1,200 microstrains). Due to the strain
measurement being within the predicted value, the group determined the test rig was
working appropriately and that it was ready for a full test until the mounted frame
experienced a fatigue failure.
The force exerted from the air cylinder was measured using a force plate to verify
the loading was 1,200 N. After the test rig performance investigation was completed, the
remaining procedure steps were done to conduct the test. The results for the tests are
described in the following section.
8/15/2019 Material and Design Optimization for an Aluminum Bike Frame
http://slidepdf.com/reader/full/material-and-design-optimization-for-an-aluminum-bike-frame 68/101
61
4.0 Frame Testing: Results, Comparison, and Analysis
4.1 Results and Comparison
Two bicycle frames were donated to the group, and both were physically fatigue
tested. One frame was physically tested by the group using the test rig and methods
described above, and the other was sent out to an external frame testing company. The
external testing company was Engineering Materials Lab in California which specializes
in fatigue testing. Testing at WPI and at an external facility allowed for validation of the
group’s physical testing rig.
The frame that was tested by the group failed on the top tube in the HAZ created
from the weld to the down tube. The frame tested by the outside company failed on the
down tube in the HAZ created from the weld to the bottom bracket. The two crack
initiation locations can be seen in Figure 45 along with the FEA result output for
predicted failure location. As seen in the figure, the failures occurred in two of the three
zones predicted by the FEA for fatigue failure.

8/15/2019 Material and Design Optimization for an Aluminum Bike Frame
http://slidepdf.com/reader/full/material-and-design-optimization-for-an-aluminum-bike-frame 69/101
62
Figure 45: FEA (left) and tested (right) fatigue failure locations showing agreement.
4.1.1 Calculating Equivalent Cycles
Due to a misinterpretation of the test standard, and a modification to the test plan,
the test rig was run with several different loading scenarios. The test rig was initially run
with the loading reversed from the ASTM standard, which generated 600 N in tension

8/15/2019 Material and Design Optimization for an Aluminum Bike Frame
http://slidepdf.com/reader/full/material-and-design-optimization-for-an-aluminum-bike-frame 70/101
63
and 1,200 N in compression. Due to this error on the part of the group, the equivalent
cycles were calculated to determine the cycles to failure with correct loading. Also, the
group increased the loading after the frame passed the ASTM standard by a significant
number of cycles. This was done to be able to produce a failure in a timelier manner.
The group calculated the equivalent cycles based on the Miner’s rule. Miner’s
rule is summarized by the equation below. Miner’s rule shows that it is possible to assess
the proportion of cycles to failure for different stress levels in order to determine
equivalent cycles to failure.
�
≈ 1.0
=1
Based on this rule, the equivalent cycles to failure for the different loading
scenarios were calculated below in Table 10. The cycles to failure adjusted for the HAZ
was done based on the assumption that the cycles to failure for the HAZ was proportional
to the cycles to failure just as the UTS for the HAZ is proportional to the UTS for 6061-
T6.
Table 10: Equivalent cycles for physical frame testing
Loading (N)Cycles at
Load
PredictedCycles toFailure at
Load (FEA)
PredictedCycles toFailure
(Adjustedfor HAZ)
Percent toFailure (%)
EquivalentContribution Cycles
to Failure (1,200 N)
600 311,883 10,000,000 7,000,000 4.50 21,832
1,200 344,893 700,000 490,000 70.40 344,893
1,500 23,550 200,000 140,000 16.80 82,425
Total 449,150
8/15/2019 Material and Design Optimization for an Aluminum Bike Frame
http://slidepdf.com/reader/full/material-and-design-optimization-for-an-aluminum-bike-frame 71/101
64
As seen in Table 10 the total cycles to failure from physical testing was
approximately 449,000 cycles for the WPI frame. The predicted number of cycles to
failure for the heat-affected zone for the loading as defined by the test standard is 490,000
cycles. The data shows that the physical test and the predicted cycles to failure are
similar (difference of 8.4%) which validates the accuracy of the FEA model. The second
frame failed at roughly 300,000 equivalent cycles at the outside testing facility. The
group observed that the second frame had a slightly different geometry when compared
to the frame tested by the group. These differences included a difference in head tube
length, and a difference in weld length between the top and down tube. Since the FEA
was based on the frame tested at WPI, the cycles to failure prediction for the second
frame was less accurate. However, there was still very good agreement between the FEA
and physical frame testing for failure location and cycles to failure. This is especially
true for the frame that the group tested.
4.2 Physical Frame Failure Analysis
In order to obtain an understanding of the fracture origin, propagation, and root
cause, the group performed an extensive study on the crack. Crack propagation rates
were measured for the entire crack length along with the location of the crack. It was
also necessary to study both the fracture surface and the profile surrounding the fracture.
This was accomplished by observing the crack on both a macroscopic and microscopic
scale.

8/15/2019 Material and Design Optimization for an Aluminum Bike Frame
http://slidepdf.com/reader/full/material-and-design-optimization-for-an-aluminum-bike-frame 72/101
65
4.2.1 Observed Crack Propagation during Testing
Using simple observation during testing, the group saw the crack initiate on the
bottom center of the top tube directly adjacent to the weld that joins the top tube and
down tube together. This can be seen in Figure 46.
Figure 46: Fracture origin observed during testing.
This crack initiation point is in the weakest part of the HAZ. The crack then
propagated straight up, on both sides of the top tube. It eventually stopped about two
thirds of the way up on either side of the top tube. The extent that the crack propagated
on one side of the top tube can be seen in Figure 47 with the head tube on the left side of
the image.

8/15/2019 Material and Design Optimization for an Aluminum Bike Frame
http://slidepdf.com/reader/full/material-and-design-optimization-for-an-aluminum-bike-frame 73/101
66
Figure 47: Extent of crack propagation on front side.
4.2.2 Crack Growth Analysis
Length measurements of the crack were taken as it propagated through the frame.
These measurements and the corresponding number of cycles are plotted in Figure 48.
Each measurement point was defined by the group as a node, which allowed for
correlation during fractographic analysis. The front side of the crack had 12 nodes, and
the back side of the crack had 8 nodes.
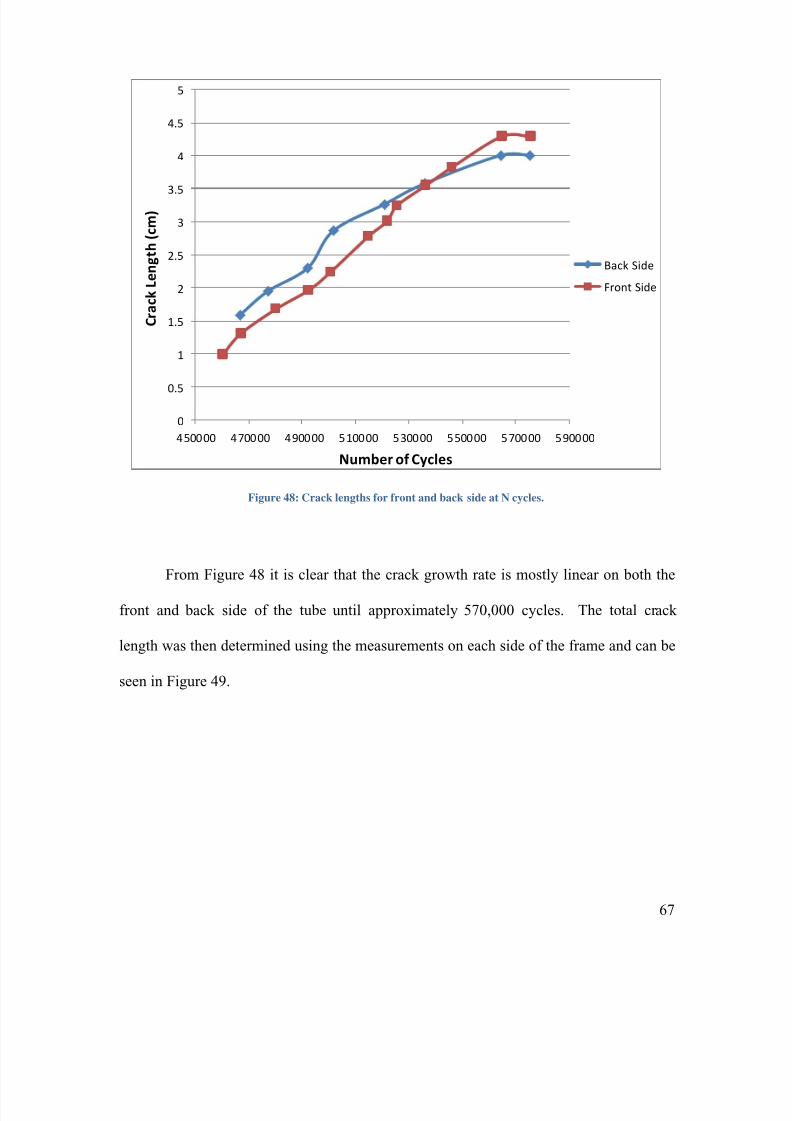
8/15/2019 Material and Design Optimization for an Aluminum Bike Frame
http://slidepdf.com/reader/full/material-and-design-optimization-for-an-aluminum-bike-frame 74/101
67
0
0.5
1
1.5
2
2.5
3
3.5
4
4.5
5
450000 470000 490000 510000 530000 550000 570000 590000
C r a c k L e n g t h ( c m )
Number of Cycles
Back Side
Front Side
Figure 48: Crack lengths for front and back side at N cycles.
From Figure 48 it is clear that the crack growth rate is mostly linear on both the
front and back side of the tube until approximately 570,000 cycles. The total crack
length was then determined using the measurements on each side of the frame and can be
seen in Figure 49.
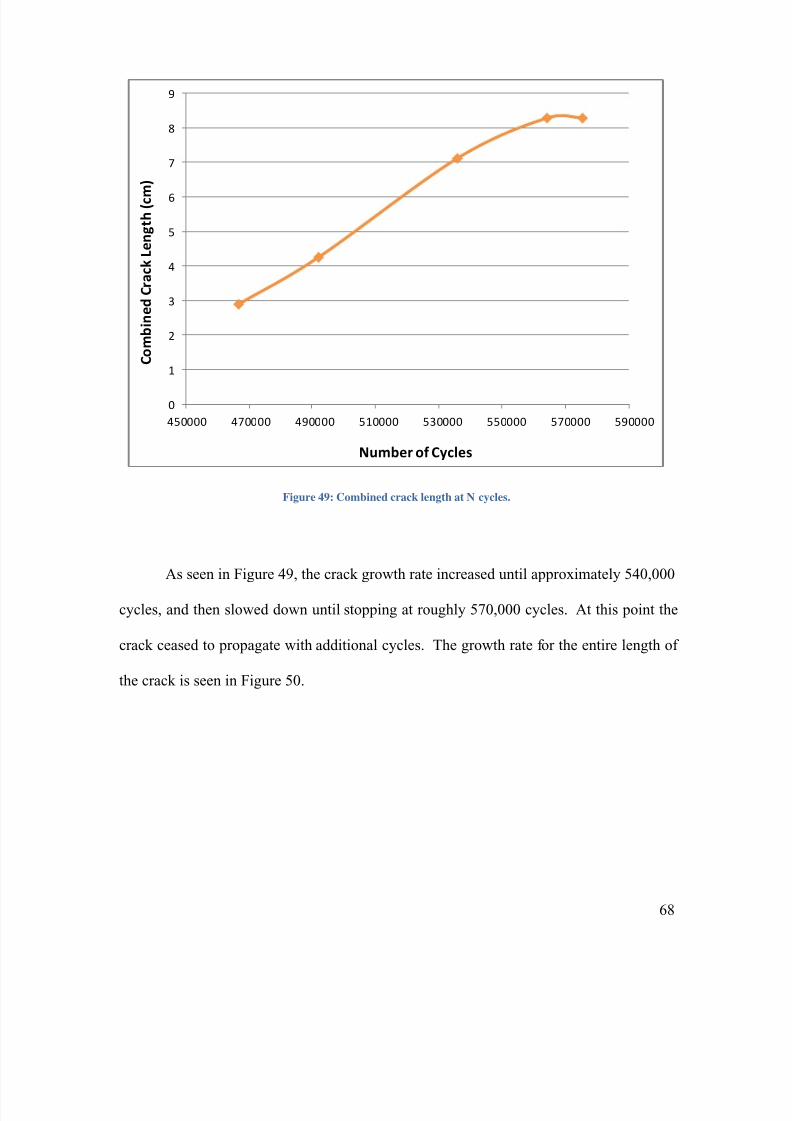
8/15/2019 Material and Design Optimization for an Aluminum Bike Frame
http://slidepdf.com/reader/full/material-and-design-optimization-for-an-aluminum-bike-frame 75/101
68
0
1
2
3
4
5
6
7
8
9
450000 470000 490000 510000 530000 550000 570000 590000
C o m b i n e d C r a c k L e n g t h ( c m
)
Number of Cycles
Figure 49: Combined crack length at N cycles.
As seen in Figure 49, the crack growth rate increased until approximately 540,000
cycles, and then slowed down until stopping at roughly 570,000 cycles. At this point the
crack ceased to propagate with additional cycles. The growth rate for the entire length of
the crack is seen in Figure 50.
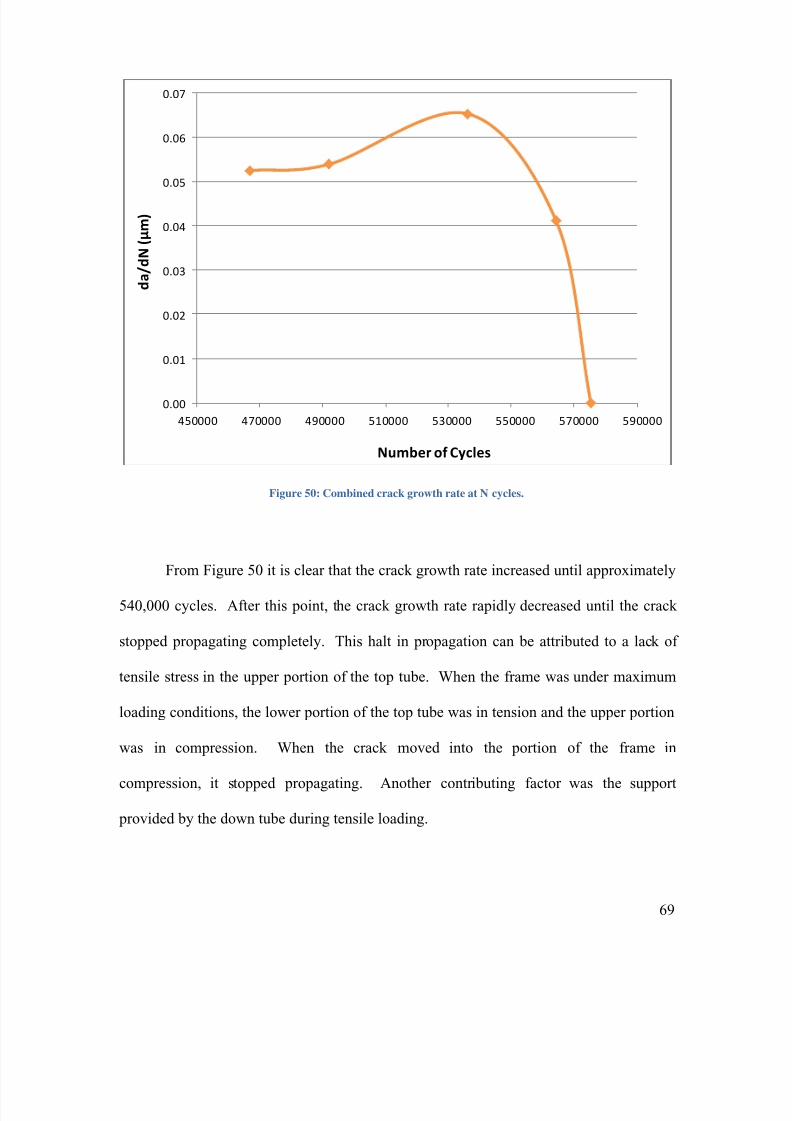
8/15/2019 Material and Design Optimization for an Aluminum Bike Frame
http://slidepdf.com/reader/full/material-and-design-optimization-for-an-aluminum-bike-frame 76/101
69
0.00
0.01
0.02
0.03
0.04
0.05
0.06
0.07
450000 470000 490000 510000 530000 550000 570000 590000
d a / d N ( μ m )
Number of Cycles
Figure 50: Combined crack growth rate at N cycles.
From Figure 50 it is clear that the crack growth rate increased until approximately
540,000 cycles. After this point, the crack growth rate rapidly decreased until the crack
stopped propagating completely. This halt in propagation can be attributed to a lack of
tensile stress in the upper portion of the top tube. When the frame was under maximum
loading conditions, the lower portion of the top tube was in tension and the upper portion
was in compression. When the crack moved into the portion of the frame in
compression, it stopped propagating. Another contributing factor was the support
provided by the down tube during tensile loading.

8/15/2019 Material and Design Optimization for an Aluminum Bike Frame
http://slidepdf.com/reader/full/material-and-design-optimization-for-an-aluminum-bike-frame 77/101
70
4.2.3 Fractographic Analysis
After failure, the crack surface was removed from the frame and analyzed on a
microscopic scale. An optical microscope analysis was conducted, followed by a stereo
microscope and SEM analysis. Images were taken during each of the analyses.
A natural light observation on the profile of the crack was used to identify how
the crack interacted with the different phases in the material. Different phases within the
material appeared as dark spots during the analysis, and interactions between the crack
edge and these dark spots were observed.
The samples used for the profile investigation were then electrolytically etched
and viewed under polarized light. The polarized light along with the electrolytic
treatment exposed the grains of the metal so that the interaction between the grain
boundaries and the crack edge could be observed.
Next, the face of the fracture surface was placed in the SEM with the primary
goals of determining the actual initiation site as well as the striation distances at each of
the nodes. A striation represents a microscopic gap caused by the physical advancement
of the crack due to one loading cycle. A Jeol JSM 7000f SEM was used for the analysis.
The fracture surface was viewed under a stereomicroscope as a preliminary to the SEM
analysis. This allowed the group to readily identify areas of interest more easily than
with the SEM. The fracture surface sample was cleaned ultrasonically with acetone prior
to the SEM analysis.
In order to more completely understand how changes in striation distance affect
crack growth rate; striation distances at each node had to be measured. At nodes 1 and 8
striations were not angled perpendicularly with the direction of crack propagation. At

8/15/2019 Material and Design Optimization for an Aluminum Bike Frame
http://slidepdf.com/reader/full/material-and-design-optimization-for-an-aluminum-bike-frame 78/101
71
these nodes, trigonometry was used to determine the equivalent perpendicular striation
distance.
The resulting pictures from the fractographic analysis are summarized in Figure
51. As seen, the fracture analysis regions correspond to the nodes from the back side of
the crack that were marked to evaluate crack growth as discussed in Section 4.2.2. The
nodes analyzed were 1, 3, 5 and 8, and analyzing these nodes thoroughly characterizes
the crack growth.
Figure 51: Results from optical microscope and SEM analysis.

8/15/2019 Material and Design Optimization for an Aluminum Bike Frame
http://slidepdf.com/reader/full/material-and-design-optimization-for-an-aluminum-bike-frame 79/101
72
The crack propagation observed by the group can be broken down into three
sections. The beginning consisted of the origin and nodes 1 and 2, and featured a slow
growth rate. The middle consisted of nodes 3-6, and featured faster crack propagation.
Finally, the end of the crack growth consisted of nodes 7 and 8, and featured a growth
rate similar to that of the beginning.
The propagation of the crack as viewed under the optical microscope can be seen
directly below the node titles in Figure 51. The beginning of the crack growth featured
propagation with little interaction with the different phases of the material. The next row
of pictures shows that there was also limited interaction with the grain boundaries during
this time of initial propagation. This corresponds to a transgranular mode of crack
growth. The final row of pictures shows the fracture surface as viewed under the SEM.
Small distances between the striations can be seen in the beginning phase which
corresponds to the slow crack growth that was observed. The middle section features
more substantial interaction with the phases and grain boundaries of the material. This
intergranular mode of propagation along with the large striation distances seen at these
nodes alludes to the fast growth rate that was observed. In the end, as the propagation
began to slow down, the crack transitioned back to having limited interaction with the
phases and grain boundaries. This shift to transgranular propagation along with the small
striation distances coincide with slower crack growth rates.
By tracing the striations, and observing defects in the material using the SEM, the
group was able to identify a crack origin point on the fracture surface. The origin point
was a feature that appeared to be a porosity near the outer edge of the tube where the

8/15/2019 Material and Design Optimization for an Aluminum Bike Frame
http://slidepdf.com/reader/full/material-and-design-optimization-for-an-aluminum-bike-frame 80/101
73
team first observed the crack. This porosity was in the HAZ, and had high levels of
tensile stress shown in the FEA which make it the likely origin.
Fracture Data
The predicted striation distances for the crack and the stress intensity factors were
calculated to aid in the analysis of the crack. In order to predict striation distance, da/dN,
changes in crack length were divided by changes in the number of cycles at their
respective nodes. In areas of more rapid crack growth, striation distances were predicted
to be larger. These values, along with the observed striation distance, can be seen in
Table 11.
The applied stress, σ, taken directly from the FEA, along with the crack length, a,
was used to calculate the stress intensity factor, K C, using the equation below. The stress
intensity factor characterizes the stress at the tip of the crack. These values can be seen in
the right column, along with the change in stress intensity factor in Table 11.
≈ σ√ π ∗ a

8/15/2019 Material and Design Optimization for an Aluminum Bike Frame
http://slidepdf.com/reader/full/material-and-design-optimization-for-an-aluminum-bike-frame 81/101
74
Table 11: Fracture data and calculations
Node(BackSide)
Cycles(N)
dNCrackLength(cm)
Changein CrackLength
(cm)
da/dN
ObservedDistancesBetween
Striations (μm)
AppliedStress(Mpa)
K c(MPa*m^.5)
ΔK c(MPa*m^.
1 574,084 1.32 0.329 89.8 18.29
2 591,806 17,722 1.59 0.27 0.15 0.424 81.7 18.23 -0.06
3 602,099 10,293 1.94 0.36 0.345 0.424 57.2 14.12 -4.11
4 617,144 15,045 2.30 0.36 0.236 0.939 40.8 10.97 -3.15
5 626,573 9,429 2.86 0.56 0.593 1.27 24.5 7.34 -3.63
6 645,710 19,137 3.26 0.40 0.211 1.17 8.17 2.62 -4.73
7 661,006 15,296 3.58 0.32 0.208 0.75 6.17 2.07 -0.55
8 689,326 28,320 4.00 0.42 0.15 0.469 1.63 5.79 3.73
As seen in Table 11, the applied stress acquired from the FEA drops greatly as the
crack progresses. This is due to the complex geometry of the tube and compressive
loading seen in the FEA output on the top of the top tube. Due to this drop in applied
stress during crack progression, the derived stress intensity factors are abnormal in
comparison to data resulting from a crack formed during a standard fatigue test on a
uniform bar. Typically in these experiments the change in stress intensity factor and
da/dN increases with crack propagation, unlike what was seen on the bike frame.
Striation Distance Comparison (Predicted vs. Measured)
Charts showing the comparison between the calculated “predicted” striation
distances and the measured striation distances can be seen in Figure 52. The two charts
use the data from Table 11 and a trend line to allow visualization of the change in
striation distance.

8/15/2019 Material and Design Optimization for an Aluminum Bike Frame
http://slidepdf.com/reader/full/material-and-design-optimization-for-an-aluminum-bike-frame 82/101
75
0.0
0.2
0.4
0.6
0.8
1.0
1.2
1.4
1.6
1.8
1 2 3 4 5 6 7 8 9 P r e d i c t e d s t r i a t i o n d i s t a n c e ( μ m )
Node
0.0
0.2
0.4
0.6
0.8
1.0
1.2
1.4
1.6
1.8
1 2 3 4 5 6 7 8 9 M e a s u r e d s t r i a t i o n
d i s t a n c e ( μ m )
Node
Figure 52: Predicted (left) and measured (right) striation distance.
The similar trends between graphs indicate a clear correlation between change in
crack length per change in cycle and the striation distances at certain nodes along the
crack. Points along the fracture that have large distances between striations have a large
change in crack length per cycle and points that have small distances between striations
have small changes in crack length per cycle, as would be expected. As seen, the
magnitude of striation distance is different between the predicted and measured. This
may be attributed to a slight error in measuring striation distance, or in the accuracy of
the crack length measurements.

8/15/2019 Material and Design Optimization for an Aluminum Bike Frame
http://slidepdf.com/reader/full/material-and-design-optimization-for-an-aluminum-bike-frame 83/101
76
5.0 Frame Optimization and Recommendations
After creating the FEA model, validating it with physical testing, and conducting
a fractographic analysis of the crack, modifications were made to attempt to improve
fatigue life and optimize the frame. Even though the frames lasted almost eight times the
ASTM test standard requirement, the group worked to provide recommendations to the
bike manufacturer to aid them with their goal of producing bikes that can withstand
abusive riding conditions without failure. The group explored optimizations targeted at
material, heat treatment, and geometry modifications.
5.1 Material Modifications
The group explored two different aluminum alloys with the same frame design to
improve fatigue life. The group investigated 7005 aluminum, a common bicycle frame
material, and 6013 aluminum, a relatively new aerospace alloy.
5.1.1 7005-T6 Aluminum
The 7005-T6 aluminum alloy is commonly used for mountain bike frames. Based
on the data from Table 2, the ultimate tensile strength of 7005-T6 is roughly 10%more
than 6061-T6. Since 7005 is not common outside of the bicycle industry, an S-N chart
for the material could not be found. Therefore, the group made the assumption that the
fatigue life for 7005-T6 is 10% longer than that of 6061-T6.
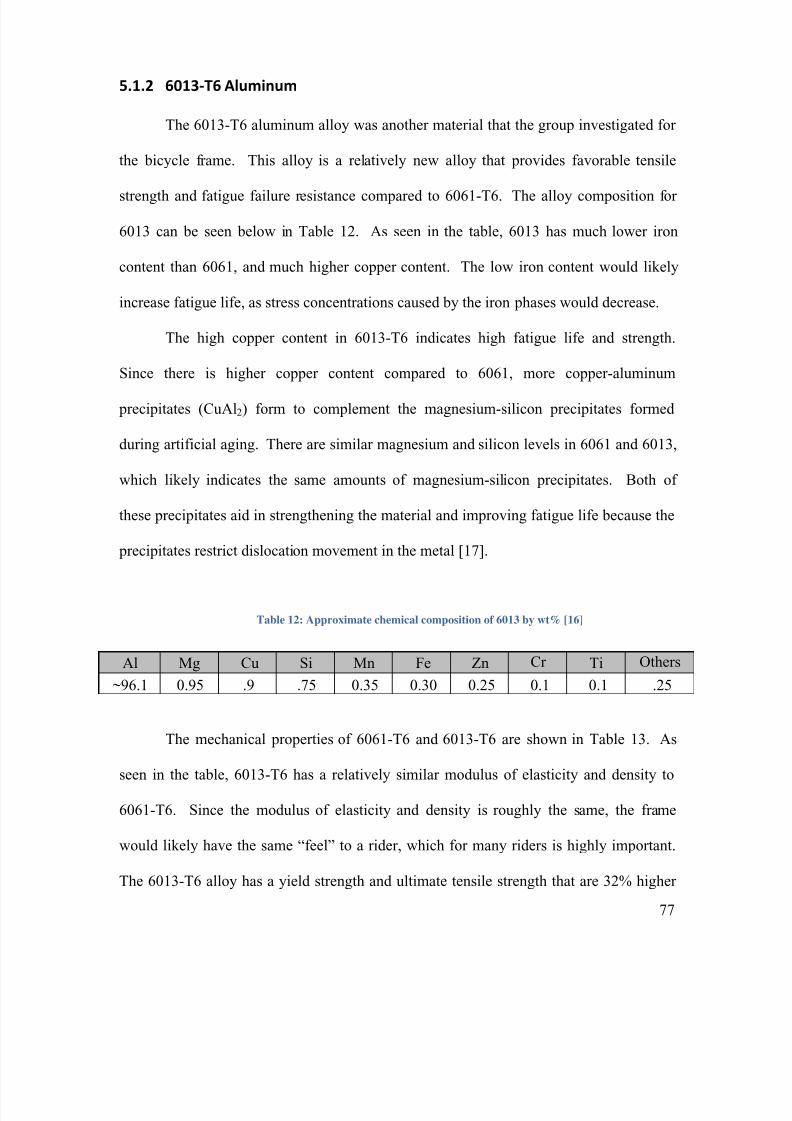
8/15/2019 Material and Design Optimization for an Aluminum Bike Frame
http://slidepdf.com/reader/full/material-and-design-optimization-for-an-aluminum-bike-frame 84/101
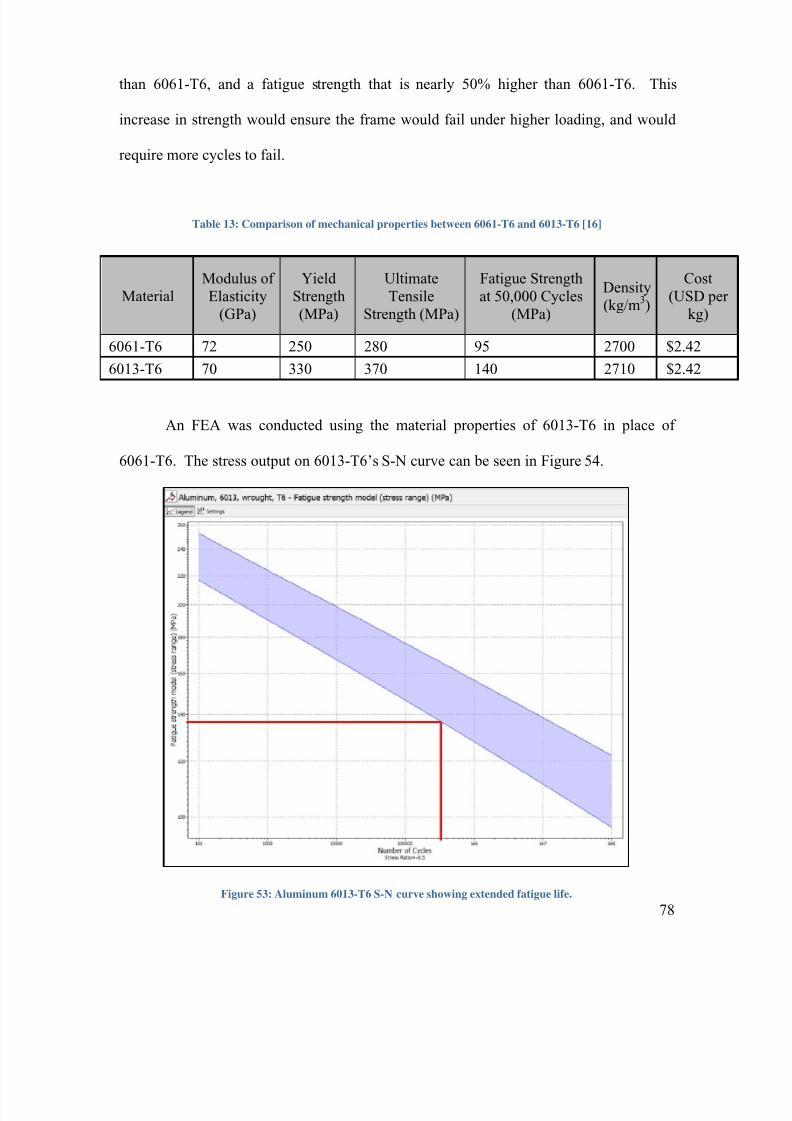
8/15/2019 Material and Design Optimization for an Aluminum Bike Frame
http://slidepdf.com/reader/full/material-and-design-optimization-for-an-aluminum-bike-frame 85/101
78
than 6061-T6, and a fatigue strength that is nearly 50% higher than 6061-T6. This
increase in strength would ensure the frame would fail under higher loading, and would
require more cycles to fail.
Table 13: Comparison of mechanical properties between 6061-T6 and 6013-T6 [16]
MaterialModulus ofElasticity
(GPa)
YieldStrength(MPa)
UltimateTensile
Strength (MPa)
Fatigue Strengthat 50,000 Cycles
(MPa)
Density(kg/m3)
Cost(USD per
kg)
6061-T6 72 250 280 95 2700 $2.42
6013-T6 70 330 370 140 2710 $2.42
An FEA was conducted using the material properties of 6013-T6 in place of
6061-T6. The stress output on 6013-T6’s S-N curve can be seen in Figure 54.
Figure 53: Aluminum 6013-T6 S-N curve showing extended fatigue life.
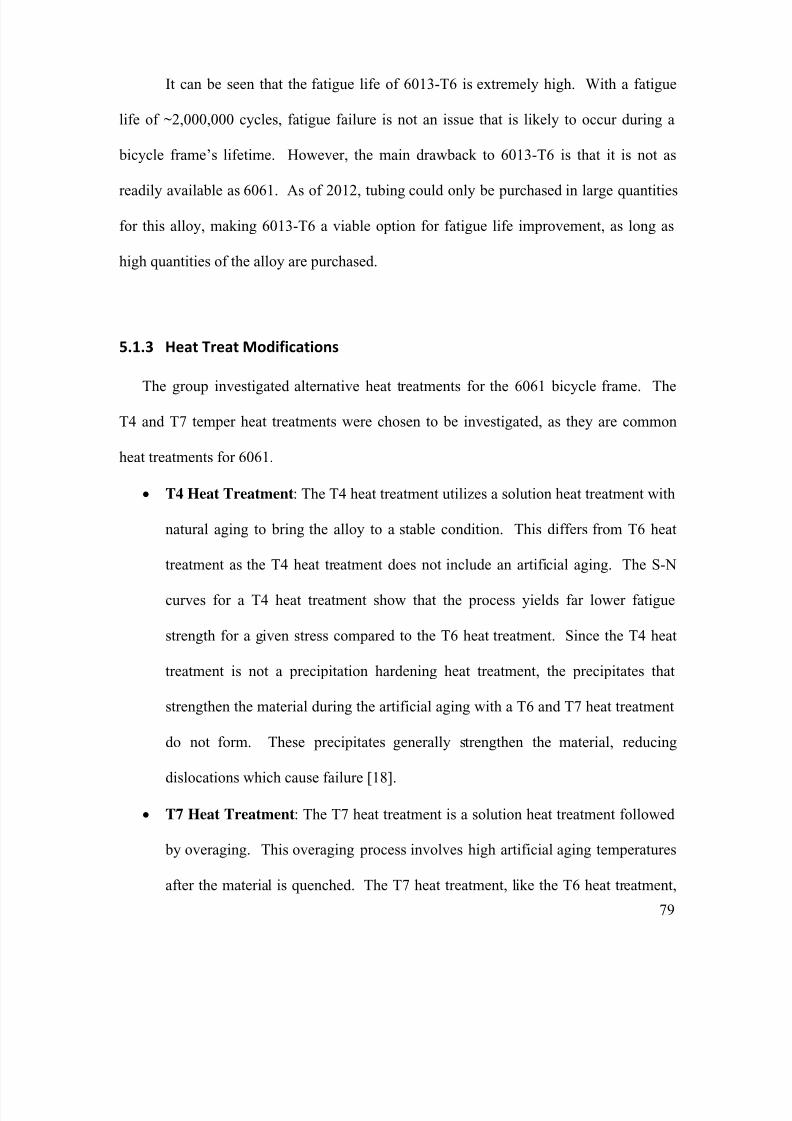
8/15/2019 Material and Design Optimization for an Aluminum Bike Frame
http://slidepdf.com/reader/full/material-and-design-optimization-for-an-aluminum-bike-frame 86/101
79
It can be seen that the fatigue life of 6013-T6 is extremely high. With a fatigue
life of ~2,000,000 cycles, fatigue failure is not an issue that is likely to occur during a
bicycle frame’s lifetime. However, the main drawback to 6013-T6 is that it is not as
readily available as 6061. As of 2012, tubing could only be purchased in large quantities
for this alloy, making 6013-T6 a viable option for fatigue life improvement, as long as
high quantities of the alloy are purchased.
5.1.3 Heat Treat Modifications
The group investigated alternative heat treatments for the 6061 bicycle frame. The
T4 and T7 temper heat treatments were chosen to be investigated, as they are common
heat treatments for 6061.
• T4 Heat Treatment: The T4 heat treatment utilizes a solution heat treatment with
natural aging to bring the alloy to a stable condition. This differs from T6 heat
treatment as the T4 heat treatment does not include an artificial aging. The S-N
curves for a T4 heat treatment show that the process yields far lower fatigue
strength for a given stress compared to the T6 heat treatment. Since the T4 heat
treatment is not a precipitation hardening heat treatment, the precipitates that
strengthen the material during the artificial aging with a T6 and T7 heat treatment
do not form. These precipitates generally strengthen the material, reducing
dislocations which cause failure [18].
• T7 Heat Treatment: The T7 heat treatment is a solution heat treatment followed
by overaging. This overaging process involves high artificial aging temperatures
after the material is quenched. The T7 heat treatment, like the T6 heat treatment,

8/15/2019 Material and Design Optimization for an Aluminum Bike Frame
http://slidepdf.com/reader/full/material-and-design-optimization-for-an-aluminum-bike-frame 87/101
80
is a precipitation hardened heat treatment. Investigation into the use of T7 heat
treatment using the ASM Handbooks allowed for the conclusion that this
overaging process generally sacrifices strength for dimensional stability and
corrosion resistance. Since dimensional stability and corrosion resistance are not
prominent issues, this heat treatment was not found to be beneficial for fatigue life
[18].
The material and heat treatment optimization investigation results can be seen
below in Table 14. As shown, both heat treatment adjustments had a negative effect on
fatigue life, as discussed above, and the material changes had a positive effect. The
6013-T6 material had a significantly higher fatigue life and is thus the optimal
modification.
Table 14: Material and heat treatment optimization results
Modification Cycles to Failure Predicted Failure Location Cost
6061-T6 (current) ~490,000Top tube near head tube ordown tube near bottom bracket
No change
6013-T6 ~2,000,000 Down tube near bottom
bracket
No change
(bulk purchase
required)
7005-T6 ~495,000 Top tube near head tube ~10% more than 6061
T4 heat treatment ~5,500 Top tube near head tube No change
T7 heat treatment ~300,000 Top tube near head tube No change
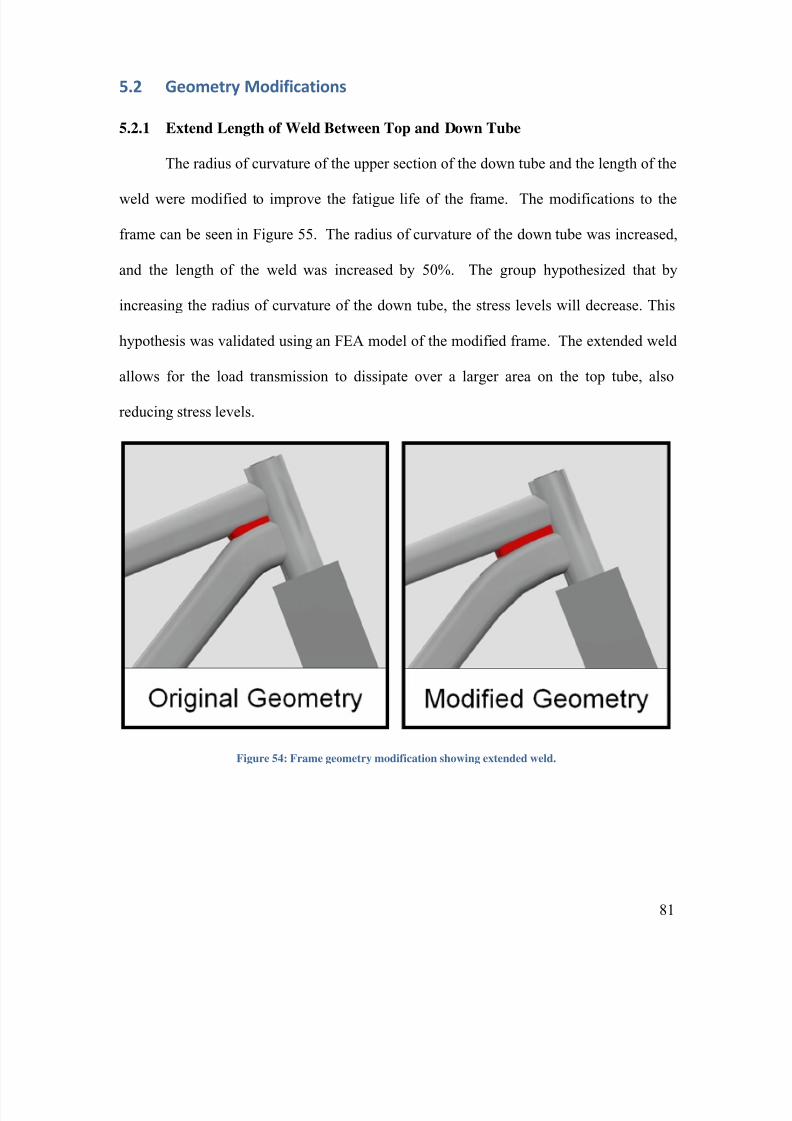
8/15/2019 Material and Design Optimization for an Aluminum Bike Frame
http://slidepdf.com/reader/full/material-and-design-optimization-for-an-aluminum-bike-frame 88/101
81
5.2 Geometry Modifications
5.2.1 Extend Length of Weld Between Top and Down Tube
The radius of curvature of the upper section of the down tube and the length of the
weld were modified to improve the fatigue life of the frame. The modifications to the
frame can be seen in Figure 55. The radius of curvature of the down tube was increased,
and the length of the weld was increased by 50%. The group hypothesized that by
increasing the radius of curvature of the down tube, the stress levels will decrease. This
hypothesis was validated using an FEA model of the modified frame. The extended weld
allows for the load transmission to dissipate over a larger area on the top tube, also
reducing stress levels.
Figure 54: Frame geometry modification showing extended weld.

8/15/2019 Material and Design Optimization for an Aluminum Bike Frame
http://slidepdf.com/reader/full/material-and-design-optimization-for-an-aluminum-bike-frame 89/101
82
5.2.2 Adjust Thickness of Down Tube
The thickness of the down tube near the bottom bracket was increased by 50%.
Since the failure on the frame sent out for third party testing happened in this location,
and the FEA showed high tensile stress in this area, the group determined adjusting this
area would be effective. The thickness was adjusted from 1.01 mm near the bottom
bracket to 1.52 mm. The results for the optimization investigation can be seen in Table
15.
Table 15: Geometry optimization results
Modification Cycles to Failure Predicted Failure Location
Current geometry ~490,000Top tube near head tube ordown tube near bottom bracket
Extend weld length betweentop and down tubes
~300,000 Down tube near head tube
Adjust thickness of down tubenear BB
~400,000 Top tube near head tube
Combined weld extension
and adjusted thickness~600,000
Down tube near bottom
bracket
5.2.3 Recommendation Summary
An investigation was conducted with the optimal material / heat treatment, and
geometry design. The optimal 6013-T6 alloy was set for the frame material. The
geometry was optimized with the extended weld between the top and down tube,
increased radius of curvature for the down tube, and increased down tube thickness near
the bottom bracket. The results from the investigation are seen in Table 16.

8/15/2019 Material and Design Optimization for an Aluminum Bike Frame
http://slidepdf.com/reader/full/material-and-design-optimization-for-an-aluminum-bike-frame 90/101
83
Table 16: Modification summary for optimal fatigue behavior
Modification Cycles to Failure Predicted Failure Location
6061-T6 and current
geometry~490,000
Top tube near head tube ordown tube near bottom bracket
6013-T6 and currentgeometry
~2,000,000Down tube near bottom bracket
6061-T6 and modifiedgeometry
~600,000Down tube near bottom bracket
6013-T6 and
modified geometry~3,500,000
Down tube near bottom
bracket
As seen in Table 16 the fatigue life with the optimal model was predicted to be
approximately 3,500,000 cycles by the FEA. The failure location was predicted to be on
the down tube near the bottom bracket. This location is significantly safer than the head
tube region, as a failure would not cause the ride to fall going over the front handlebars.
8/15/2019 Material and Design Optimization for an Aluminum Bike Frame
http://slidepdf.com/reader/full/material-and-design-optimization-for-an-aluminum-bike-frame 91/101
84
6.0 Conclusions and Future Work
In conclusion, the group successfully characterized the fatigue behavior of the
donated bicycle frames, and optimized the frame material, heat treatment, and geometry
to improve fatigue life. The finite element methodology proved to be an accurate way of
predicting fatigue failure locations and cycles to failure. This was validated based on the
methodology agreeing with the physical testing results. The fatigue failure locations
were almost exactly the same between the FEA and physical testing, and the cycle count
was within a 10% difference. The fractographic analysis allowed for an accurate
characterization of the fracture and origination point, and a thorough understanding of the
crack growth.
The group was able to optimize the bike frame which resulted in a predicted
fatigue life that is approximately 3,500,000 cycles compared to 490,000 for the original
frame The group recommends that future work be done to investigate 6013-T6
aluminum. The group also recommends extending the weld between the top and down
tubes and increasing the thickness of the down tube. The FEA methodology and physical
frame testing rig described in this report could be used to investigate these modifications
to determine their effectiveness in a future project.
8/15/2019 Material and Design Optimization for an Aluminum Bike Frame
http://slidepdf.com/reader/full/material-and-design-optimization-for-an-aluminum-bike-frame 92/101
85
7.0 Acknowledgements
The group would like to extend a special thank you to the following people who
helped the group successfully complete the project:
Professor Diana A. Lados
Sinister Bikes
Torbjorn Bergstrom
Xiang Chen
Stephen Cialdea
Michael Fagan
Anastasios Gavras
Dr. Adriana Hera
Nate Jannetti
Jonathan Leith
James Loiselle
Bradford Lynch
Professor Robert L. Norton
Randy Robinson
Adam Sears
Professor John M. Sullivan
Mike Zancanato
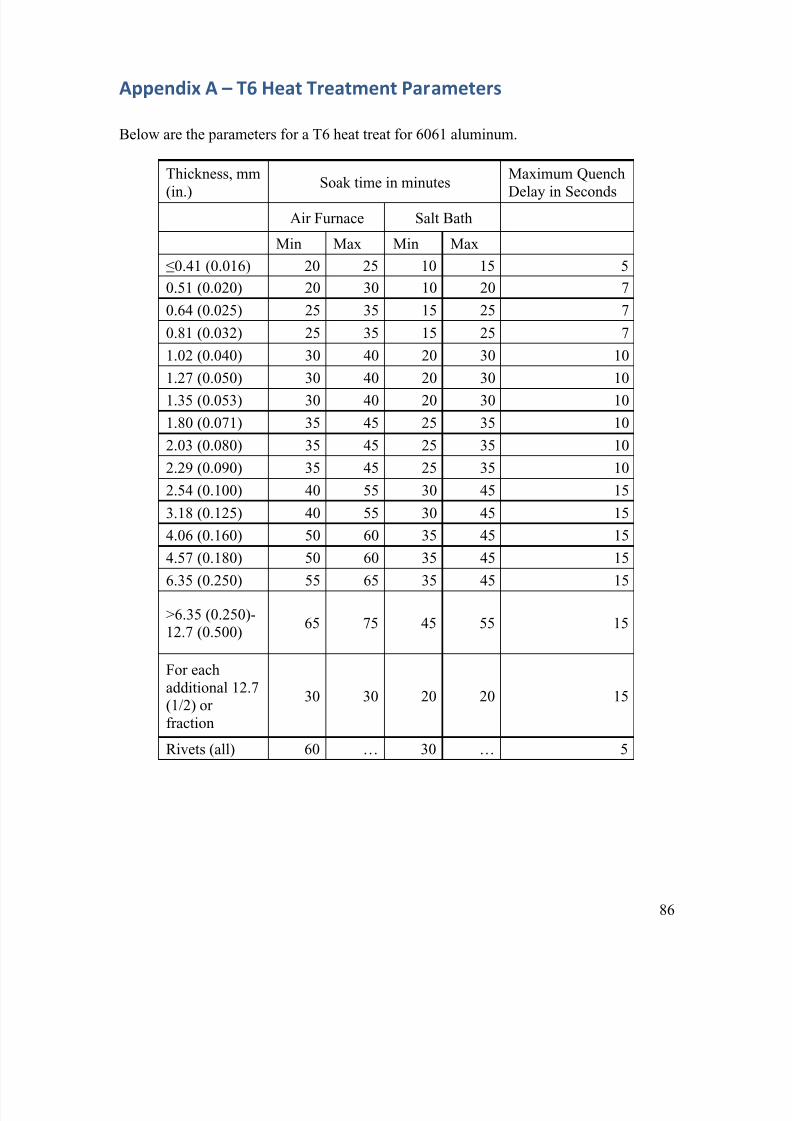
8/15/2019 Material and Design Optimization for an Aluminum Bike Frame
http://slidepdf.com/reader/full/material-and-design-optimization-for-an-aluminum-bike-frame 93/101
86
Appendix A – T6 Heat Treatment Parameters
Below are the parameters for a T6 heat treat for 6061 aluminum.
Thickness, mm
(in.)
Soak time in minutesMaximum Quench
Delay in SecondsAir Furnace Salt Bath
Min Max Min Max
≤0.41 (0.016) 20 25 10 15 5
0.51 (0.020) 20 30 10 20 7
0.64 (0.025) 25 35 15 25 7
0.81 (0.032) 25 35 15 25 7
1.02 (0.040) 30 40 20 30 10
1.27 (0.050) 30 40 20 30 10
1.35 (0.053) 30 40 20 30 10
1.80 (0.071) 35 45 25 35 10
2.03 (0.080) 35 45 25 35 10
2.29 (0.090) 35 45 25 35 10
2.54 (0.100) 40 55 30 45 15
3.18 (0.125) 40 55 30 45 15
4.06 (0.160) 50 60 35 45 15
4.57 (0.180) 50 60 35 45 15
6.35 (0.250) 55 65 35 45 15
>6.35 (0.250)-12.7 (0.500)
65 75 45 55 15
For eachadditional 12.7(1/2) orfraction
30 30 20 20 15
Rivets (all) 60 … 30 … 5
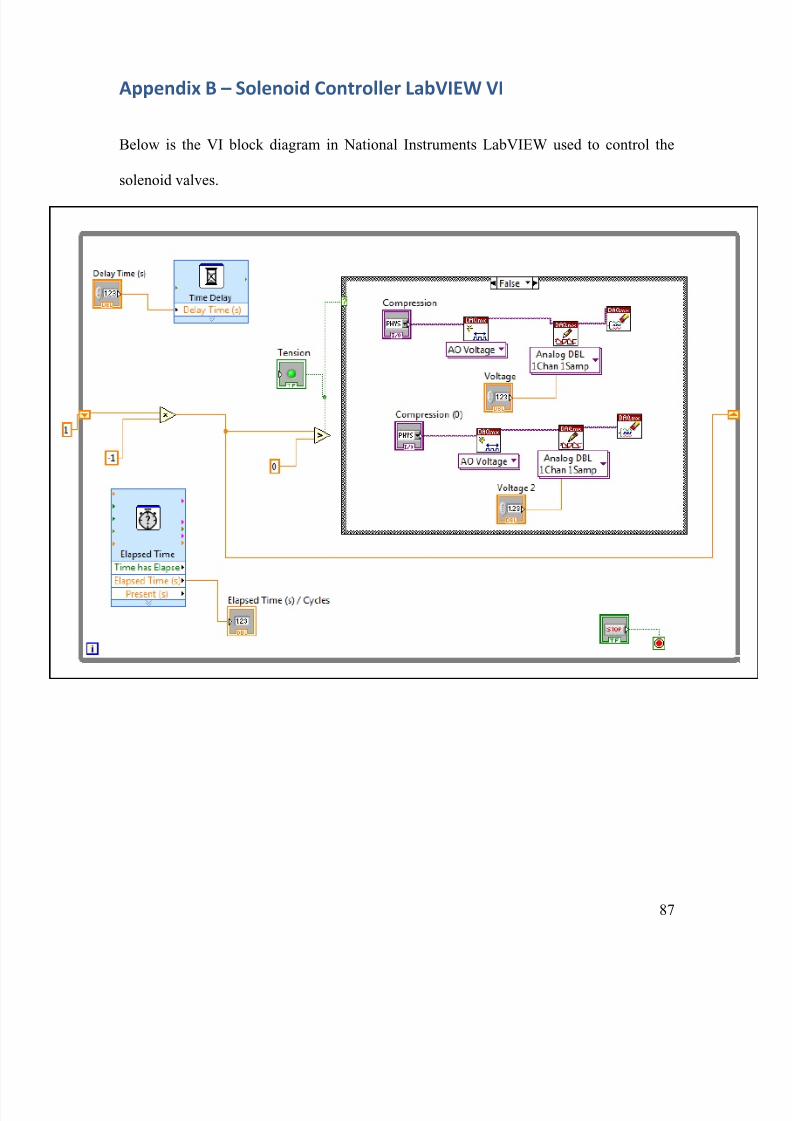
8/15/2019 Material and Design Optimization for an Aluminum Bike Frame
http://slidepdf.com/reader/full/material-and-design-optimization-for-an-aluminum-bike-frame 94/101
87
Appendix B – Solenoid Controller LabVIEW VI
Below is the VI block diagram in National Instruments LabVIEW used to control the
solenoid valves.

8/15/2019 Material and Design Optimization for an Aluminum Bike Frame
http://slidepdf.com/reader/full/material-and-design-optimization-for-an-aluminum-bike-frame 95/101
88
Appendix C – Strain Measurement LabVIEW VI
Below is the VI block diagram in National Instruments LabVIEW used to measure the
strain on the bicycle frame during testing.
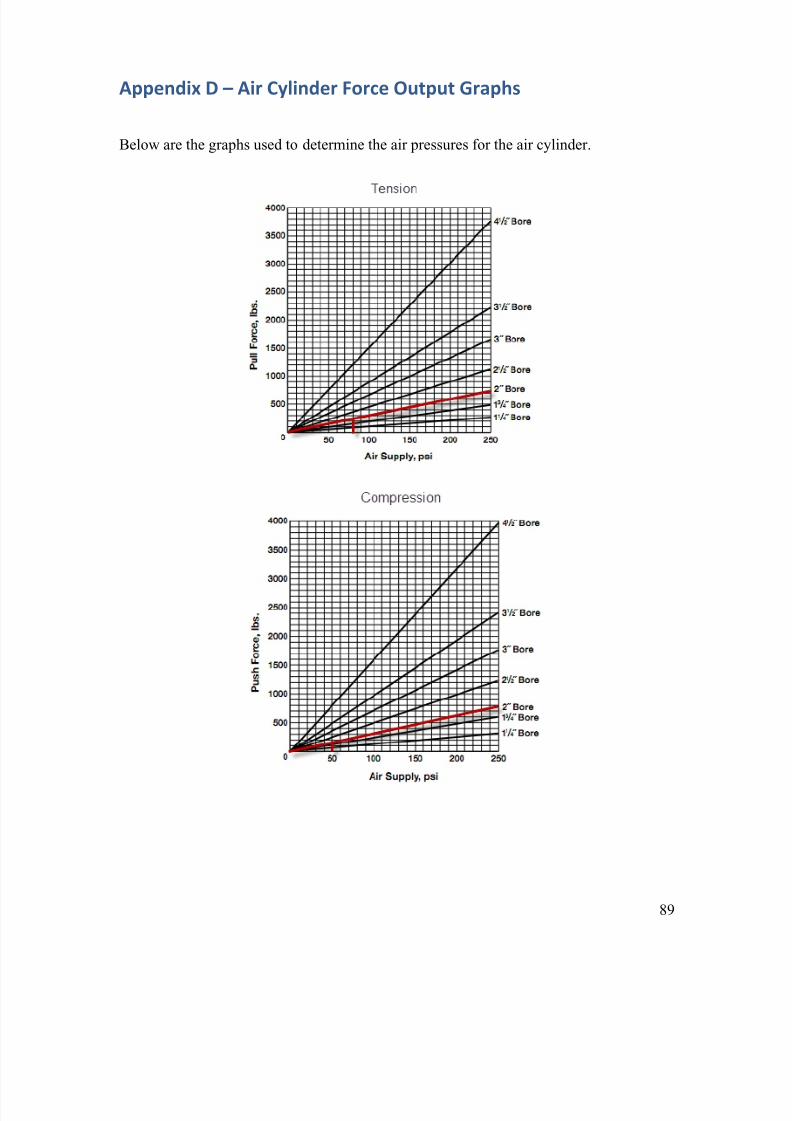
8/15/2019 Material and Design Optimization for an Aluminum Bike Frame
http://slidepdf.com/reader/full/material-and-design-optimization-for-an-aluminum-bike-frame 96/101
89
Appendix D – Air Cylinder Force Output Graphs
Below are the graphs used to determine the air pressures for the air cylinder.
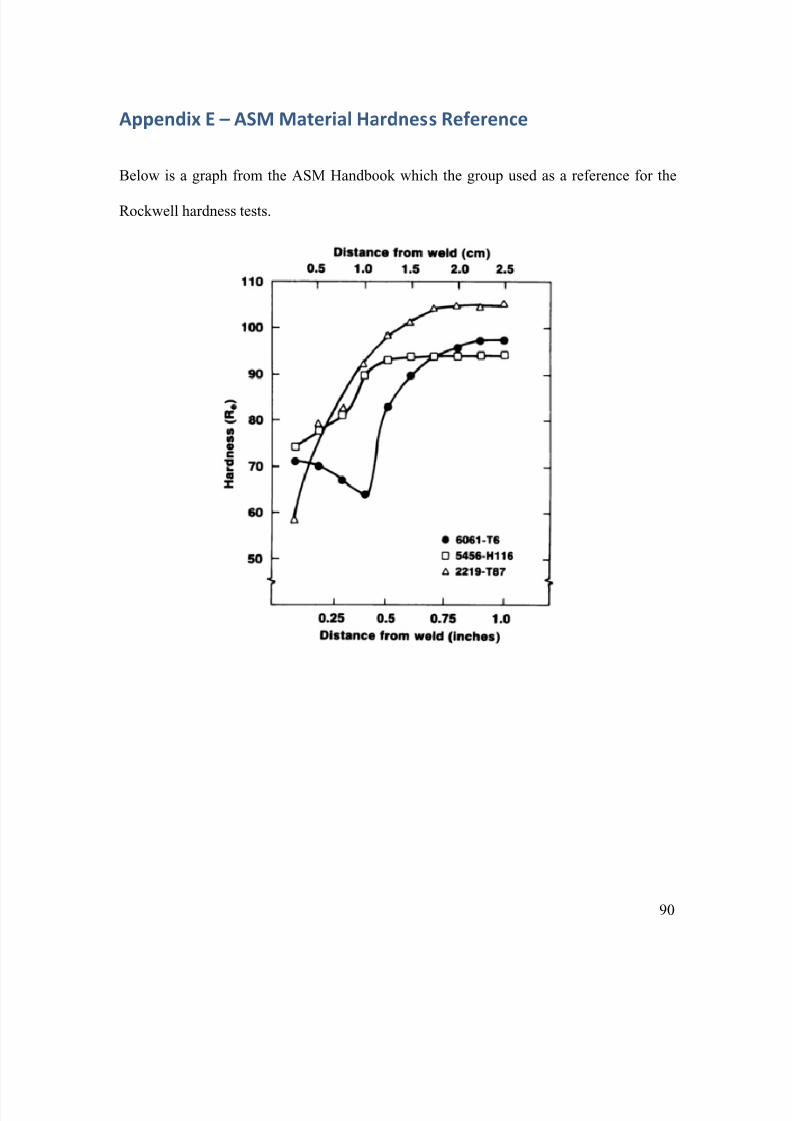
8/15/2019 Material and Design Optimization for an Aluminum Bike Frame
http://slidepdf.com/reader/full/material-and-design-optimization-for-an-aluminum-bike-frame 97/101
90
Appendix E – ASM Material Hardness Reference
Below is a graph from the ASM Handbook which the group used as a reference for the
Rockwell hardness tests.

8/15/2019 Material and Design Optimization for an Aluminum Bike Frame
http://slidepdf.com/reader/full/material-and-design-optimization-for-an-aluminum-bike-frame 98/101
91
References
1) "80/20 Inc. - The Industrial Erector Set." 80/20 Inc. - The Industrial Erector Set.
Web. Accessed 12 Oct. 2011. <http://www.8020.net/T-Slot-2.asp>.
2) Alcoa. "Understanding Extruded Aluminum Alloys." Alcoa.com. Dec. 2002. Web.
Accessed 14 Oct. 2011.
<http://www.alcoa.com/adip/catalog/pdf/Extruded_Alloy_6061.pdf>.
3) "Aluminum Tube-how it attains its shape”. Aluminum Global Suppliers. Accessed
15 Dec. 2011
<http://www.aluminiumglobalsuppliers.com/manufacturing/aluminium-
tubes.shtml>.
4) ASTM Standard F2043-09, "Standard Classification for Bicycle Usage," ASTM
International, West Conshohocken, PA, www.astm.org.
5) ASTM Standard F2614-09, "Standard Specification for Condition 3 Bicycle
Frames," ASTM International, West Conshohocken, PA, www.astm.org.
6)
ASTM Standard F2711-08, "Standard Test Methods for Bicycle Frames," ASTM
International, West Conshohocken, PA, www.astm.org.
7) ASTM Standard F2802-09, "Standard Specification for Condition 1 Bicycle
Frames," ASTM International, West Conshohocken, PA, www.astm.org.
8) ASTM Standard F2843-10a, "Standard Specification for Condition 0 Bicycle
Frames," ASTM International, West Conshohocken, PA, www.astm.org.
9) ASTM Standard F2868-10, "Standard Specification for Condition 2 Bicycle
Frames," ASTM International, West Conshohocken, PA, www.astm.org.
8/15/2019 Material and Design Optimization for an Aluminum Bike Frame
http://slidepdf.com/reader/full/material-and-design-optimization-for-an-aluminum-bike-frame 99/101
92
10) Brown, Sheldon. "Frame Materials for the Touring Cyclist." Sheldon Brown-
Bicycle Technical Information. Sheldon Brown, Aug. 2010. Web. Accessed 06
Sept. 2011. <http://www.sheldonbrown.com/frame-materials.html>.
11) Brown, Sheldon. "Glossary: Diamond Frame". Accessed 04 Oct. 2011.
12) "CPSC And Cannondale Announce A Bicycle Frame Safety Inspection Program."
U.S. Consumer Product Safety Commission. CPSC, 25 01 1995. Web. Accessed 18
Sept. 2011 <http://www.cpsc.gov/cpscpub/prerel/prhtml95/95069.html>.
13) "CPSC, Recreational Equipment Inc. Announce Recall of Children’s Bicycles.”
U.S. Consumer Product Safety Commission. December 2005 Web. Accessed 18
Sept. 2011 <http://www.cpsc.gov/cpscpub/prerel/prhtml06/06520.html>.
14) Failure Analysis and Prevention, ASM Metals Handbook, Vol 11, 1983, p 378.
15) "Friction Stir Welding Applications." TWI. Web. Accessed 22 Sept. 2011.
<http://www.twi.co.uk/content/fswapp.html>.
16) GRANTA. 2011. CES EduPack. Granta.
17) Heat Treating of Aluminum Alloys, Heat Treating, Vol 4, ASM Handbook, ASM
International, 1991.
18) Heat Treating of Aluminum Alloys, Properties and Selection: Nonferrous Alloys
and Special Purpose Materials, Vol 2, ASM Handbook, ASM International, 1991.
19) http://spaceflight.esa.int/impress/text/education/Images/MechanicalProperties/Imag
e046.png. Accessed 10 Oct. 2011.
20) http://svana.org/photos/singlespeed_mtb/websize/new_steel_mtb_frame.jpg.
Accessed 10 Oct. 2011.
21) http://www.burls.co.uk/images/ti/largeMTB.jpg. Accessed 10 Oct. 2011.

8/15/2019 Material and Design Optimization for an Aluminum Bike Frame
http://slidepdf.com/reader/full/material-and-design-optimization-for-an-aluminum-bike-frame 100/101
93
22) http://www.kirkframeworks.com/images/JK_cross/JKC_miter/DSC_1415.jpg.
Accessed 10 Oct. 2011.
23) Kalpakjian, Serope erope, and Steven teven R. chmid. Manufacturing Processes For
Engineering Materials. 5th. Prentice Hall, 2008. Print.
24) Kuhn, Howard, and Dana Medlin. Mechanical Testing and Evaluation. Materials
Park, OH: ASM International, 2000. Print.
25) Lang, L. H. "Hydroforming Highlights: Sheet Hydroforming and Tube
Hydroforming." Journal of Materials Processing Technology 151.1-3 (2004): 165-
77. Print.
26)
"Material Property Data." MatWeb. Web. Accessed 14 Oct 2011.<http://www.matweb.com/>.
27) Metallography: An Introduction, Metallography and Microstructures, Vol 9, ASM
Handbook, ASM International, 2004, p 3-20
28) "Metals – Aluminum.” Bikepro. Web. Accessed 15 Sept. 2011.
<http://www.bikepro.com/products/metals/alum.html>.
29)
"Microstructure Classification of Friction Stir Welds.” TWI. Web. Accessed 22
Sept. 2011 <http://www.twi.co.uk/content/fswqual.html>.
30) Nelson, Ron. "Bike Frame Races Carbon Consumer Goods Forward." Reinforced
Plastics. 47.7 (2003): 36-40. Web. Accessed 6 Sep. 2011.
31) "Niner Bikes Recalls Bicycle Frame Due to Crash Hazard.” U.S. Consumer Product
Safety Commission. May 2010 Web. Accessed 18 Sept. 2011
<http://www.cpsc.gov/cpscpub/prerel/prhtml10/10231.html>.
32) "Norco Recalls Bicycle Frames Due to Crash Hazard.” U.S. Consumer Product
Safety Commission. May 2009 Web. Accessed 18 Sept. 2011
<http://www.cpsc.gov/cpscpub/prerel/prhtml09/09223.html>.
8/15/2019 Material and Design Optimization for an Aluminum Bike Frame
http://slidepdf.com/reader/full/material-and-design-optimization-for-an-aluminum-bike-frame 101/101
33) "Parts of a Bicycle." The Bike Tube. Web. Accessed 18 Sept. 2011.
<http://thebiketube.com/bike/frame>.
34) "Rockwell Hardness Testing” Materials Evaluating and Engineering, Inc. Web.
Accessed 15 Nov. 2011 <http://mee-inc.com/rockhar.html>.
35) Santacruzbicycles.com. Accessed 14 Oct. 2011.
36) "Seattle Bike Supply is Voluntarily Recalling all 2008 Redline D640 Bicycles.”
Redline Bicycles. December 2010 Web. Accessed 18 Sept. 2011
<http://www.redlinebicycles.com/news/885-recall-notice-2008-d640>.
37) Sinisterbikes.com. Accessed 14 Oct. 2011.
38)
"TIG Welding Aluminum bike Frame." Welding Tips and Tricks. Web. 20 Sept.
2011. <http://www.weldingtipsandtricks.com/tig-welding-aluminum-bike-
frame.html>.
39) Trekbikes.com. Accessed 14 Oct. 2011.
40) "Understanding Bike Frame Materials.” Brightspoke. Web. 06 Sept. 2011.
<http://www.brightspoke.com/c/understanding/bike-frame-materials.html>.
41) Welding, Brazing and Soldering, ASM Metals Handbook, Vol 6, 1983, p 182
42) "What is Friction Stir Welding." ESAB Welding and Cutting. ESAB, n.d. Web.
Accessed 22 Sept. 2011. <http://esabna.com/us/en/education/knowledge/qa/What-
is friction stir welding of aluminum cfm>