Matching Firms and Young Jobseekers through a Job Fair: A Field … · 2019-07-01 · job fairs for...
59
Matching Firms and Young Jobseekers through a Job Fair: A Field Experiment in Africa * Girum Abebe † , Stefano Caria ‡ , Marcel Fafchamps § , Paolo Falco ¶ , Simon Franklin, Simon Quinn ** and Forhad Shilpi †† September 11, 2018 Abstract Matching frictions are believed to hurt the employment prospects of young jobseekers, partic- ularly in rapidly growing labour markets. To remedy this perceived shortcoming, we organise job fairs that match large firms with young jobseekers with at least a high-school diploma. Invitations to the fair are randomized among workers as well as employers. For a random subset of the treated, a Gale-Shapley algorithm is used to recommend prospective applicants to employers. We look for direct effects on interviews, offers and jobs in the aftermath of the fairs, and for indirect effects on expectations and search strategy by firms and jobseekers. We find that the fairs and algorithmic recommendations succeed in generating interviews yet lead to few hires. But the fairs affect expectations and search strategy. Firms were over- optimistic about the availability of skilled workers with work experience, and they increase their search effort after the fair. High-school leavers start with reservation wages well above what firms offer but reduce their expectation after the fairs, accept more offers, and are more likely to hold a permanent or formal job at endline. * We thank audiences at the CSAE Annual Conference 2017, the Third IZA/DFID GLM-LIC Conference 2017, RES Annual Conference 2017, SEEDEC Conference 2017, SERC Work in Progress Seminar, and NEUDC 2016; in particular, Prithwiraj Choudhury and Pieter Serneels who provided helpful comments and feedback. We thank Jali Bekele, Biruk Tekle, Marc Witte, Alemayehu Woldu and Ibrahim Worku for outstanding research assistance. Data collection and experimental implementation were funded by The World Bank Research Support Budget (RSB), GLM—LIC, and by the International Growth Centre. The findings, interpretations, and conclusions expressed in this paper are entirely those of the authors. They do not necessarily represent the views of the International Bank for Reconstruction and Development/World Bank and its affiliated organizations, or those of the Executive Directors of the World Bank or the governments they represent. The project would not have been possible without the constant support of Rose Page and the Centre for the Study of African Economies (University of Oxford), nor without the support of the Ethiopian Development Research Institute in Addis Ababa. This RCT was registered in the American Economic Association Registry for randomized control trials under Trial number AEARCTR-0000911. † Ethiopian Development Research Institute: [email protected] ‡ Oxford Department of International Development, University of Oxford: [email protected] § Freeman Spogli Institute, Stanford University: [email protected] ¶ OECD: [email protected] Centre for Economic Performance, London School of Economics: [email protected] ** Department of Economics, University of Oxford: [email protected] †† World Bank: [email protected] 1
Transcript of Matching Firms and Young Jobseekers through a Job Fair: A Field … · 2019-07-01 · job fairs for...
Matching Firms and Young Jobseekers through a Job Fair: A
Field Experiment in Africa∗
Girum Abebe†, Stefano Caria‡, Marcel Fafchamps§, Paolo Falco¶,
Simon Franklin,‖ Simon Quinn∗∗ and Forhad Shilpi††
September 11, 2018
Abstract
Matching frictions are believed to hurt the employment prospects of young jobseekers, partic-
ularly in rapidly growing labour markets. To remedy this perceived shortcoming, we organise
job fairs that match large firms with young jobseekers with at least a high-school diploma.
Invitations to the fair are randomized among workers as well as employers. For a random
subset of the treated, a Gale-Shapley algorithm is used to recommend prospective applicants
to employers. We look for direct effects on interviews, offers and jobs in the aftermath of the
fairs, and for indirect effects on expectations and search strategy by firms and jobseekers.
We find that the fairs and algorithmic recommendations succeed in generating interviews yet
lead to few hires. But the fairs affect expectations and search strategy. Firms were over-
optimistic about the availability of skilled workers with work experience, and they increase
their search effort after the fair. High-school leavers start with reservation wages well above
what firms offer but reduce their expectation after the fairs, accept more offers, and are more
likely to hold a permanent or formal job at endline.
∗We thank audiences at the CSAE Annual Conference 2017, the Third IZA/DFID GLM-LIC Conference 2017,RES Annual Conference 2017, SEEDEC Conference 2017, SERC Work in Progress Seminar, and NEUDC 2016;in particular, Prithwiraj Choudhury and Pieter Serneels who provided helpful comments and feedback. We thankJali Bekele, Biruk Tekle, Marc Witte, Alemayehu Woldu and Ibrahim Worku for outstanding research assistance.Data collection and experimental implementation were funded by The World Bank Research Support Budget(RSB), GLM—LIC, and by the International Growth Centre. The findings, interpretations, and conclusionsexpressed in this paper are entirely those of the authors. They do not necessarily represent the views of theInternational Bank for Reconstruction and Development/World Bank and its affiliated organizations, or those ofthe Executive Directors of the World Bank or the governments they represent. The project would not have beenpossible without the constant support of Rose Page and the Centre for the Study of African Economies (Universityof Oxford), nor without the support of the Ethiopian Development Research Institute in Addis Ababa. This RCTwas registered in the American Economic Association Registry for randomized control trials under Trial numberAEARCTR-0000911.
†Ethiopian Development Research Institute: [email protected]‡Oxford Department of International Development, University of Oxford: [email protected]§Freeman Spogli Institute, Stanford University: [email protected]¶OECD: [email protected]‖Centre for Economic Performance, London School of Economics: [email protected]
∗∗Department of Economics, University of Oxford: [email protected]††World Bank: [email protected]
1
1 A matching experiment
Policies designed to help young people find work often have limited success. Recent evidence
has for instance shown that: worker training programs have modest effects on employment and
earnings in both developed and developing countries (Crepon and Van den Berg, 2016; McKenzie,
2017);1 wage subsidies do not perform in the same manner in different labour markets (De Mel
et al., 2016); and job search assistance has positive short-term impacts but poorly understood
long-term effects (Card et al., 2010; Abebe et al., 2016; Franklin, 2015). A common feature of
these active labor policies is that they only target one side of the labour market. Yet obstacles
to youth employment are likely to exist on both sides. On the supply side young people are
prevented from searching optimally by liquidity constraints (Abebe et al., 2017). They may
also have unrealistic expectations about their employment prospects (Groh et al., 2015). On
the demand side, employers find screening young, inexperienced workers costly. Furthermore, if
they hold overly pessimistic views about the employability of young job applicants, they may
opt not to screen them at all (Glover et al., 2017; Beam et al., 2017; Caria et al., 2014). Policy
interventions may thus be more effective if they address frictions incurred by both workers and
firms – for instance, by reducing the costs of seach and signaling for young job candidates while
simultaneously lowering screening costs for employers.
Job fairs aim to serve this dual purpose by reducing frictions affecting both sides of the market.
The creation of a centralized clearing house allows applicants to investigate many employers and
job openings at once, and to apply to those they prefer. It simultaneously enables firms to screen
and interview many prospective workers at once. The ensuring reduction in search costs may
encourage employers to interview marginal applicants, e.g., less experienced applicants whom
they would not normally consider. Lower search costs should also allow young jobseekers to
apply to more jobs, an issue known to hurt their probability of employment (e.g., Caria et al.
2018).
It is common for universities and vocational schools located in developed economies to organize
job fairs for their prospective graduates.2 This type of intervention, however, is not yet common
in the rapidly growing economies of Africa.3 The purpose of this paper is to organize a job fair
for young jobseekers in a large African city and to test whether it improves their job prospects
while allowing firms to fill their vacancies. Since job fairs are uncommon for unskilled manual
work,4 we focus on educated jobseekers for whom skill assessment is presumably more critical
at the time of hiring.
1 See, however, Alfonsi et al. (2017) for recent evidence of a positive impact for a six-month-long training inwell-defined vocational skills.
2 Large companies in the United Kingdom, for instance, use job fairs to select young IT graduates.3 With a few exceptions – e.g., in Ethiopia hotels regularly recruit their staff at large job fairs.4 There are important exceptions. Chinese manufacturing firms, for example, use job fairs to hire blue-collar
workers (Chang, 2009). US employers organise job fairs in the Philippines to hire construction workers anddomestic helpers (Beam, 2016).
2
Job fairs can affect labor market outcomes in two major ways. First they can serve the role
of clearing house, allowing jobseekers to find jobs faster and firms to hire suitable employees
more rapidly. This effect may dissipate over time, however, as non-participants progressively
catch up. To test this search-cost-reduction effect, we randomize firms and jobseekers into a job
fair intervention and compare treated and control subjects four months after the fair. We also
collect precise data on all interviews, offers and postings arising as a direct consequence of the
job fair. Secondly, participating firms and workers get an opportunity to observe a large number
of market participants and can use this information to update their expectations and refine their
search strategy. To investigate this possibility, we collect detailed information on expectations,
reservation wage, and search activity. Relative to controls, subjects who did not get a job or
fill a vacancy at the fair may nonetheless experience different endline employment outcomes as
a result of improved search. While such finding would indicate that participants benefited from
an information effect, it does not by itself demonstrate that job fairs are a cost effective tool to
achieve it – a cheaper information dissemination intervention could possibly achieve the same
result.
We invite randomly selected employers and job candidates to a large job fair. Randomizing both
sides of the market at the same time sets our experiment apart from previous RCTs that have
focused on a single side of the market (e.g., Beam 2016). We further facilitate search by including
a matching intervention, itself randomized. Using a Gale-Shapley algorithm that combines
information on jobs obtained from firms with information on candidates’ profiles and preferences,
we give randomly selected firms a list of recommended candidates that are likely to be interested
in their vacancies, and that the firm is likely to attract given the jobs openings at other firms.
This intervention should further improve matching by promoting employee-candidate encounters
that have a higher chance of leading to an accepted offer. To investigate this, we add on the
list some randomly selected candidates to test whether a chance recommendation increases a
candidate’s prospects. The inclusion of this matching intervention, itself randomized on both
sides of the market, further sets our experiment apart from the literature on active labor market
interventions5, and it enables us to contribute to a nascent literature exploring the potential of
algorithmic approaches for improving the matching efficiency of markets.6
For our intervention to work, we need a site where search costs are high for workers and firms.
To this effect, we select a rapidly growing urban center in the developing world where the labour
market is least likely to be frictionless. Addis Ababa, capital of Ethiopia, is a good choice
5 In addition, randomly selected job seekers were treated with a certification intervention (Abebe et al., 2016).6 Algorithmic approaches have successfully been used in structured allocation problems — such as assigning
doctors to hospitals (see, for example, Roth (1984), Roth (1991), Kagel and Roth (2000) and McKinney et al.(2005)). The relevance of matching algorithms in less structured markets remains an open empirical question.A funded research project by Magruder and Ksoll entitled ”Labor Market Frictions in India – Evidence fromthe Introduction of a Job Information Platform” has experimented with offering job seekers a phone-based jobmatching app. Initial results seem to suggest that treated workers have worse endline outcomes due to the lowquality of the jobs offered on the app (source: private communication).
3
because it combines all the above characteristics with the additional feature that, at the time of
our study, the main avenue through which firms advertize openings is through job vacancy boards
located in the centre of the city. While the purpose of these boards is to facilitate job search,
they nonetheless entail sizeable transaction costs, especially for workers who not only must
incur substantial transport costs to visit the boards, but must spend considerable time visually
scanning the boards to identify suitable openings. Screening by firms is also challenging, given
the limited information that firms can extract from the CVs of young labour market entrants
(Abebe et al., 2016). In recent years Addis Ababa has experienced a large increase in the number
of available jobs, coupled with high migration flows and volatile inflation. This makes it hard
for firms and workers to have accurate beliefs about the distribution of wages and employment
opportunities. All these features suggest that job fairs are an appropriate intervention in this
context.
We randomly invited 250 firms and 1,000 jobseekers to take part in two separate one-day job
fairs, held four months apart. Participating firms are some of the largest in the city, covering all
the main sectors of economic activity. Almost all of them were actively looking to hire new staff
at the time of the fair. The sample of jobseekers is representative of the population of young
workers without a permanent job and looking for work. We limit our focus on jobseekers with
at least a secondary school certificate, because they are naturally destined for jobs that require
hard-to-measure skills, and thus for whom screening and signaling are more problematic.
As indicated earlier, job fairs can have an impact either directly by reducing search costs, or
indirectly by updating expectations. If job fairs are effective in reducing frictions, we should
observe to a higher employment probability on average among treated jobseekers, and fewer
unfilled vacancies among treated firms. In contrast, if job fairs mostly cause participants to
update their expectations about possible market outcomes, we should observe changes in search
strategy among firms and workers with initially unrealistic expectations. For instance, if workers
realize their initial wage expectation was too high, they may accept lower wage offers. Similarly,
if firms realize that few jobseekers have the needed skills, they may increase their search effort.
We investigate the effect of being invited to a fair on firms and jobseekers: direct effects of
treatment on interviews, offers, and jobs in the immediate aftermath of the fair; and indirect
effects on search strategy and endline employment outcomes. We note in passing that indirect
effect are more likely to be observed if direct effects are absent or weak: if treated workers find
a job and firms fill their vacancies, they have less cause to revise their expectations and search
strategy than if they did not.
Regarding the first channel of impact, results show that the fairs generate a rich set of interactions
between workers and firms. Three quarters of participating job candidates had an interview or
in-depth discussion with at least one recruiter at the fair, a finding that is particularly strong
among participants benefiting from our matching algorithm.7 Among those who met with a
7 Randomly recommended jobseekers see no improvement.
4
firm representative, 11% report visiting at least one firm for a job interview after the fair –
making up 105 job interviews in total. These interviews, however, generate only 14 accepted job
offers.8 Given the small magnitude of this effect relative to the number of participating firms
and applicants, we do not expect any persistent direct effect at endline – which is indeed what
we find. Similarly, we find no significant impact on firms’ hiring outcomes or the type of workers
they hired. This is not because of low demand or supply of labour: most firms do hire many
candidates outside of the job fairs, and they invest substantial amounts of time and money on
recruitment; and jobseekers similarly search hard, both at the fairs and elsewhere. We also find
no evidence of negative selection of workers into attendance,9 confirming that firms did not meet
an unusually weak pool of entry-level candidates at the fair. From this we conclude that the job
fair did not play the role of clearing house, although it did reduce search costs for both firms
and jobseekers.
As possible explanation, the evidence suggests that firms are reluctant to fill high-skill, pro-
fessional positions with the entry-level (but highly educated) workers that we invited.10 Firms
seemed disappointed with the quality of the applicants they met and reported them to be, on
average, less employable than the usual applicants they get when recruiting for high-skill posi-
tions. Firms were, however, interested in hiring attendees with no tertiary education for low-skill
positions: firms made 55 job offers to these candidates, but fewer than 15% were accepted. The
data further shows that attendees who did not study beyond high school came to the fairs
with reservation wages far higher than the starting wages offered at the fairs – and than the
wages earned by those who did take a job. Unrealistic expectations thus seem to have led these
high-school graduates to turn down the job offers they received as an outcome of the fair.
Do firms and jobseekers adapt by revising their expectations and subsequent search? This
is indeed what we find for both firms and jobseekers. Firms increase their advertising and
recruitment at the main job vacancy boards, consistent with the idea that they had unrealistic
expectations about skill availability in the market. This interpretation also tallies with what
employers told us at the fairs. For jobseekers, indirect effects are concentrated among the
group that had particularly unrealistic expectations at baseline – namely, high school graduates.
Among these jobseekers, the evidence clearly shows that, after the fairs, reservation wages fall,
job search effort increases, and visits to the job boards become more frequent. As a result,
this category of jobseekers experiences a considerable improvement in employment outcomes at
endline: permanent employment rates double and formal employment rates increase by almost
50 percent. In contrast, jobseekers with post-secondary education do not, on average hold
unrealistic wage expectations. But they seem to have been discouraged by their lack of success
at the job fair, and as a result appear somewhat demotivated in their job search. Although this
8 This is confirmed in the reports of both workers and firms.9 60% of invited jobseekers attend the fairs.
10 Many firms said that the prefer to look for recruits among workers at other firms who already possess formalwork experience.
5
effect is not statistically significant, it explains why the average treatment effect on employment
is not different from zero.
Our main policy contribution is to identify two key constraints to youth employment in a rapidly
growing African city, namely: firms’ reluctance to hire inexperienced candidates; and unrealistic
reservation wages. The first finding is already familiar, although the extent of this reluctance
comes as a surprise. If, as our results indicate, limited information distorts firms’ hiring strate-
gies, policy makers may wish to target job market interventions towards firms so as to improve
their recruitment effort directed at school leavers. The second finding is less widely known.
It suggests that policy makers may want to correct unrealistic beliefs among secondary school
leavers – something that can probably be achieved at a fraction of the cost of running a job fair.
The paper makes two methodological contributions. First, to the best of our knowledge, this is
the first experiment to study the effect of a labour market matching intervention on both workers
and firms. The richness of insights that this approach generates should encourage more work
along this line. Second, we combine a job fair with an employer-employee matching algorithm.
The recommendations we make to firms lead to more interviews for jobseekers suggested by the
algorithm, but not for jobseekers recommended at random. This demonstrates that, even with
limited data, matching algorithms can facilitate search. We expect such algorithms to play a
bigger role in the future, as information about skills and job needs becomes more widely available
(e.g., from social media).
The paper contributes to several distinct bodies of literature. A growing but relatively new
literature looks at labour market interventions that offer matching and information services
to workers. The study closest to ours is that of Beam (2016) who encourages rural Filipino
workers to attend a job fair for overseas jobs. The author finds that treatment changes workers’
perception of the labour market and encourage job search in big cities. But it has no effect
on the probability of working overseas. We expand on this design along several important
dimensions.11 In the same vein, Jensen (2012) finds that remote rural dwellers are more likely
to be employed when given information about available vacancies at nearby towns (see also Bassi
and Nansamba (2017)). In contrast to these studies, we focus on a sample of active job-seekers
already familiar with the labour market. Our design does not seek to introduce workers to a new
labour market or to motivate them to start looking for work. Instead we investigate whether
facilitating face-to-face contact with employers improves the chance of getting a job.
This paper also relates to work focussing on information in large labor markets, such as Groh
et al. (2015) who match workers and firms on the basis of observable characteristics. The authors
fail to increase the take-up of offers and interviews among participants, who instead remain
unemployed to look for better work. In contrast, we do find that our matching algorithm
generates more interaction between workers and firms. Pallais (2014) shows that providing
11 We randomise both at the level of the worker and at the level of the firm; we focus on an urban population;and we invite a large number of local firms to attend the fairs, as opposed to firms based in a foreign country.
6
information about workers’ abilities can improve their prospects in an online labour market.12
We generalize this finding by showing that both firms and workers update their search strategy
as a result of our intervention. Our paper also relates to a recent literature showing how biased
beliefs can lead to sub-optimal job search and employment decisions (Spinnewijn, 2015). Abebe
et al. (2017) find that workers are overconfident about the probability of being offered a job
by an employer. Krueger and Mueller (2016) show that high reservation wages can delay exit
from unemployment. We similarly find that some of our subjects have unrealistic expectations
about starting wages in large firms, something that contact with those firms at the fair appars
to correct.13
Finally, our results relate to the experimental work on firm recruitment.14 Field experiments
have tested different binding constraints to firm growth (Bandiera et al., 2011), but little at-
tention has been paid to hiring constraints.15 We provide original evidence about this. A large
literature examines how human resource management can raise the performance of employees
(Bloom and Van Reenen, 2011). For instance, Bloom et al. (2010) show that, in a developing
country context, productivity increases performance-based pay. There is less work on recruit-
ment practices as an HR tool.16 Our contribution is to show how firms in a developing country
use job fairs as a new recruitment and learning opportunity.
2 Data
2.1 Surveying of jobseekers
The job fairs intervention reported in this paper was run alongside the interventions studied in
Abebe et al. (2016), drawing on the same sampling frame.17 Specifically, we run our study with a
representative sample of young unemployed people in Addis Ababa. To draw this sample, we first
12 See also Stanton and Thomas (2015), who show that intermediaries in online markets can help workers andfirms to overcome information asymmetries.
13 By constrast, evidence from South Africa suggests that reservation wages are not out line of available wages,and thus are not a contributor to the unemployment problem (Nattrass and Walker, 2005).
14 In Ethiopia, Abebe et al. (2017) show that firms can attract better candidates by offering monetary incentivesto prospective applicants. Hoffman et al. (2015) show that firms can improve the quality of workers hiredby limiting managerial discretion in hiring and relying more directly in standardized test results. In anotherexperiment related to ours Hardy and McCasland (2015) study the use of an apprentice placement system,which they argue can be used as a novel screening mechanisms for firms.
15 Work on audit studies (Bertrand and Mullainathan, 2004) suggest that firms face time constraints that in somecases lead them to make sub-optimal hiring decisions based on statistical discrimination.
16 Oyer and Schaefer (2010) review the literature on hiring, writing, “The literature has been less successful atexplaining how firms can find the right employees in the first place. Economists understand the broad economicforces–matching with costly search and bilateral asymmetric information–that firms face in trying to hire. Butthe main models in this area treat firms as simple black-box production functions. Less work has been doneto understand how different firms approach the hiring problem, what determines the firm-level heterogeneityin hiring strategies, and whether these patterns conform to theory.”
17 Abebe et al. (2016) conduct two parallel field experiments, to reduce respectively the spatial and informationalbarriers to job search.
7
defined geographic clusters using the Ethiopian Central Statistical Agency (CSA) enumeration
areas.18 Our sampling frame excluded clusters within 2.5 km of the center of Addis Ababa, and
clusters outside the city boundaries. Clusters were selected at random from our sampling frame,
with the condition that directly adjacent clusters could not be selected, to minimize potential
spill-over effects across clusters.
In each selected cluster, we used door-to-door sampling to construct a list of all individuals in
the cluster who: (i) were aged between 18 and 29 (inclusive); (ii) had completed high school; (iii)
were available to start working in the next three months; and (iv) were not currently working in
a permanent job or enrolled in full time education. We randomly sampled individuals from this
list to be included in the study. Our lists included individuals with different levels of education.
We sampled with higher frequency from the groups with higher education. This ensured that
individuals with vocational training and university degrees are well represented in the study. All
selected individuals were contacted for an interview.
We completed baseline interviews with 4,388 eligible respondents. We attempted to contact
individuals by phone for at least a month (three months, on average); we dropped individuals
who could not be reached after at least three attempted calls. We also dropped any individual
who had found a permanent job and who retained the job for at least six weeks. Finally, we
dropped individuals who had migrated away from Addis Ababa during the phone survey. In all
we were left with 4,059 individuals who were are included in our experimental study. Of these
1006 were invited to the jobs fairs. Another 2226 were involved in the experimental interventions
discussed in Abebe et al. (2016), while 823 remained in the control group.
We collected data on study participants through both face-to-face and phone interviews. We
completed baseline face-to-face interviews between May and July 2014 and endline interviews
between June and August 2015. We collected information about the socio-demographic charac-
teristics of study participants, their education, work history, finances and their expectations and
attitudes. We also included a module to study social networks. We called all study participants
through the duration of the study. In these interviews we administered a short questionnaire
focused on job search and employment.19
We have low attrition; in the endline survey, we find 93.3% of all job-seekers. We find that very
few covariates predict attrition (see Table 9 in the Online Appendix). We are unable to reject a
joint F -test that a range of covariates have a significant effect on attrition. However, we do find
that the individuals invited to the job fairs are slightly more likely to respond to the endline
survey. However, because attrition is so low overall (attrition is 8% in the control group and
5.6% in the treatment group) we are not concerned that this is influencing our main results. We
18 CSA defines enumeration areas as small, non-overlapping geographical areas. In urban areas, these typicallyconsist of 150 to 200 housing units.
19 Franklin (2015) shows that high-frequency phone surveys of this type do not generate Hawthorne effects — forexample, they do not affect job-seekers’ responses during the endline interview.
8
show that our key findings are robust to bounding our estimates using the method of Lee (2009).
Attrition in the phone survey is also low; for example, we still contact 90% of respondents in
the final month.20
2.2 Surveying firms
We surveyed 498 large firms in Addis Ababa. We sampled these firms to be representative of the
largest employers in the city, stratified by sector. We included all major sectors in the economy,
including construction, manufacturing, banking and financial services, hotels and hospitality,
and other professional services. To sample firms, we first compiled a list of the largest 2,178
firms in Addis Ababa. Since no firm census exists for Ethiopia, we relied on a variety of data
sources, including the lists of formal firms maintained by different government ministries. In
all, we gathered data from more than eight different sources; many came from government-
maintained lists of formal firms. For the manufacturing sector we could rely on a representative
sample of the largest firms from the Large and Medium Enterprise surveys conducted by the
Central Statistics Agency (CSA). In other cases we requested lists of the largest firms in each
sector from the government agency in charge of that sector. Where firm size was available for
the various sources, we imposed a minimum size cut-off off of 40 workers.
We drew the firms in our sample using sector-level weights that reflect the number of employers
in that sector in the city. We constructed these weights using representative labour force data.21
The firms are, on average, very large by Ethiopian and African standards. The mean number of
employees per firm is 171.5 workers, but this masks considerable heterogeneity, particularly in
the ‘Tours & Hospitality’ sector, which is dominated by relatively small hotels and restaurants.
Average firm size, when this sector is excluded, is 326 workers per firm. Detailed information
on firm size is given in Table 1 below. Note that these numbers exclude casual daily labourers:
on average, firms report employing 34 casual labourers per day.
< Table 1 here. >
The firms in our sample are growing in size and looking to hire new workers. At the median,
the number of workers that firms expect to hire (at baseline) in the next 12 months amounts
to 12% of their current workforce. The median rate of hiring is highest (16%) among service
sector firms, which are also the most likely to come to the job fairs. The most common types of
workers which firms expect to hire are white collar workers, usually requiring university degrees.
These results are shown in Table 4 in the Online Appendix.
20 Figure 1 in the Online Appendix shows the trajectory of monthly attrition rates over the course of the phonesurvey.
21 Table 6 in the Online Appendix shows the number of firms surveyed in our sample, divided into five maincategories. Column (2) provides weighted percentages obtained by applying the inverse of the weights used tosample the firms. For instance we surveyed NGOs (“Education, Health, Aid”) relatively infrequently becauseof the large number of NGOs in the data.
9
2.3 Randomization of job-seekers
We assigned treatment at the level of the geographical cluster, after blocking on cluster character-
istics (see Abebe et al. (2016) for further details). Our sample is balanced across all treatment
and control groups, and across a wide range of outcomes (including outcomes that were not
used in the randomization procedure). We present extensive balance tests in Table 1. For each
baseline outcome of interest, we report the p-values for a test of the null hypothesis that we
have balance between the experiment and control groups. We cannot reject this null for any of
variables that we study.
2.4 Randomisation of firms
We assigned firms to either a treatment group or a control group using block level randomization
techniques suggested by Bruhn and McKenzie (2009). Firms in the treatment group were invited
to attend the job fairs, while firms in the control group did not receive an invitation. The
following method was used to group firms together: firstly, firms were partitioned by five main
industries (defined in Table 6, in the Online Appendix). Then firms were partitioned into
nearest neighbour groups of four firms on the basis of Mahalanobis distance defined over the set
of baseline variables.22 After that, we randomized the firms into two groups within each block
of four firms: two firms were invited to the job fairs, one firm on each of the days, at random.
The other two firms in the group were assigned to the control group, who were not to be invited
to the fairs.
Additionally, we assigned treatment using a re-randomization method. Following the recommen-
dations of Bruhn and McKenzie (2009), we control in our estimations for the baseline covariates
used for re-randomization (that is, the set of variables described in Table 2) and for the baseline
covariates used to construct the randomization blocks.23 With this sample we have 78% power
to detect a small treatment effect (that is, only 0.2 standard deviations), using a significance
level of 0.05%.
< Table 2 here. >
3 Design and implementation
3.1 The job fairs
We invited treated job-seekers and treated firms to attend two job fairs. The first fair took
place on October 25 and 26, 2014; the second fair took place on February 14 and 15, 2015. We
22 These are listed in Table 7 in the Online Appendix.23 Details of these variables and how they are defined are contained in our detailed pre-analysis plan.
10
ran two fairs to ensure that each job-seeker and firm would have the chance to participate in at
least one of them. The job fairs were held at the Addis Ababa University campus, a central and
well-known location in the capital city. To minimize congestion, each job fair lasted two days
and only half of the firms and job-seekers were invited to attend on each day. The firms that
were invited to attend on Saturday 25th (Sunday 26th) of October were then invited to attend
on Sunday 15th (Saturday 14th) of February. On the other hand, job-seekers invited to attend
on the Saturday (Sunday) of the first fair were also invited to attend on the Saturday (Sunday)
of the second fair. This ensured that, in each job fair, job-seekers were exposed to a different
pool of firms and firms were exposed to a different pool of job-seekers.24
At the beginning of both fairs, we gave job-seekers (i) a list of all firms invited to the fair and (ii)
a list of recommended meetings. We created these recommended meetings using information on
firms’ vacancies obtained from the phone survey which we ran shortly before the fairs (see the
data section). After creating a ranking of workers for each vacancy and a ranking of vacancies
for each worker, a matching algorithm matched workers and firms (we discuss this shortly). In
the second fair, we introduced two further elements. First, we gave job-seekers the list of all
vacancies, on top of the list of firms. Second, we gave firms a list of all job-seekers invited
to the fairs, with some information about their educational qualifications and previous work
experience. We asked firms to indicate up to 10 job-seekers whom they would like to talk to
at the job fair. These ‘requested meetings’ were posted on a small board a few hours after the
beginning of the fair.
During each fair, workers and firms were free to interact as they preferred. Each firm set up a
stall before the job-seekers arrived. These stalls were typically staffed by the firm’s HR team,
who brought with them printed material advertising the firms. In a typical interaction, a job-
seeker would approach the stall of a firm and ask questions about the firm and its vacancies.
The firm’s HR staff would then often also ask about the job-seeker’s skills and experience and
check his or her CV. If the job-seeker looked suitable for one of the vacancies, the firm would
then invite her or him to attend a formal job interview a few days after the job fair.
We did not restrict the invitation to the fair to unemployed job-seekers or to firms that had open
vacancies. However, of our initial sample of job-seekers, only about 8% had permanent jobs by
the time of the first job fair, and thus most job-seekers were still searching for work. Similarly,
most firms were hiring during the period that the job fairs were held. 89% hired at least one
worker in the year of the study. On average, firms hired 52 workers in the year and four workers
in the month after the job fairs.
24 Weekend days were selected to maximize the oppurtunity for both firms and workers to attend. In preliminarydiscussions with firms, we realised that most would be unable to take the time off daily activities to attendduring the week, but were interested in doing so on weekends. Similarly, many workers in our sample workedcasual jobs and were more likely to be engaged during the week. Many Ethiopians attend religious services onthe weekends: we allowed long enough time windows for job seekers to be able to attend on either side of suchservices.
11
In total, we invited 1,007 job-seekers and 248 firms to attend fairs. Both job-seekers and firms
were contacted over the phone, were given some information about the nature of the fairs and
had the opportunity to ask questions. 606 job-seekers attended at least one fair: a 60% take-up
rate. The most common reason that job-seekers gave for not attending the fairs was that they
were busy during that particular weekend. This reason was given by 226 job-seekers in the first
fair and 229 job-seekers in the second fair. Other reasons included not being able to take up a
job at that time (83 respondents for the second fair, but only nine respondents for the first fair)
and finding that the fair venue was too difficult to reach (31 respondents for the first fair and
25 respondents for the second fair). We find that very few baseline characteristics predict this
attendance. This reassures us that our results are not driven by negative selection of workers
into attendance. In fact, the two variables that do predict attendance positively are search effort
at baseline, and whether the person used certificates for job search: it seems that workers who
attended the fairs are the more active, and organized, job-seekers. Those who attended are more
likely to have a university degree or diploma, though the effect is not significant.
Similarly, 170 firms attended at least one job fair: a take-up rate of 68.5%. Of the firms that
did not attend the fairs, 12% reported that this was because they did not have vacancies at the
time. The remaining firms often cited reasons related to logistics and previous commitments.
13 firms reported that they thought they would not find the job fairs useful.
3.2 The matching algorithm
We provided each job-seeker with a personalized list of 15 firms that we suggested she or he
should talk to during the job fair; each firm received a symmetric personalized list, showing the
names of all those job-seekers who had been recommended to meet that firm. We formed the list
of 15 firms in two distinct ways. First, as we describe shortly, we used a Gale-Shapley Deferred
Acceptance algorithm to recommend 10 of the matches (Gale and Shapley, 1962). Second, we
augmented this list by randomly selecting five additional matches. We randomized the order in
which the 15 matches were presented.
In this context, the Gale-Shapley algorithm was applied as a computational tool to suggest
sensible matches, given baseline characteristics on both job-seekers and firms. To this end,
we constructed stylized synthetic rankings of vacant positions (for each job-seeker), and of
job-seekers (for each firm). We constructed firm rankings of job-seekers using lexicographic
preferences over (i) whether the previous occupation matched that of the vacancy, then (ii)
job-seekers’ educational qualifications, and then (iii) the job-seekers’ number of years in wage
employment. We constructed job-seeker rankings of vacancies using a simple ranking over the
advertised wage (that is, we applied identical rankings for each job-seeker). Of course, these
rankings were not intended literally to represent the true preferences of participants; rather,
they were intended to provide a simple method of purposive matching given a heterogeneous
12
set of vacancies and job-seeker skills. With these rankings in hand, we then looped 10 times
over the Gale-Shapley Algorithm; for each iteration of the loop, we formed a stable assignment,
subject to the constraint that we not match any firm and job-seeker who had been matched in
any earlier iteration.
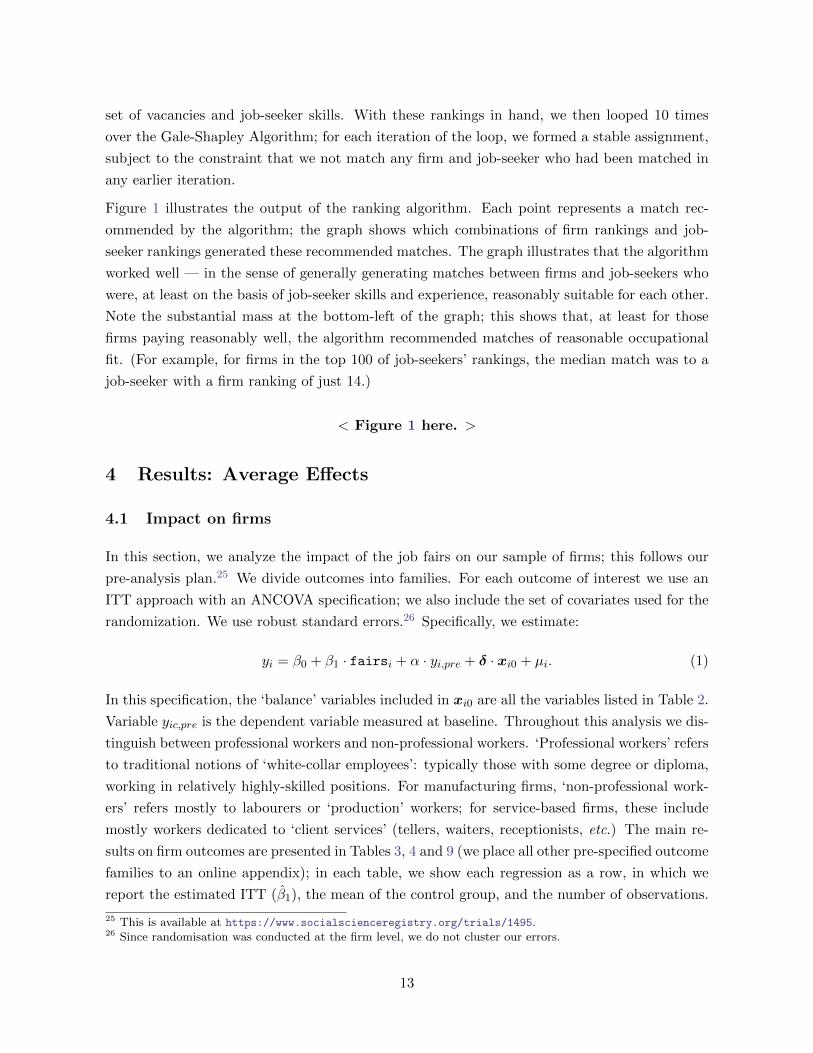
Figure 1 illustrates the output of the ranking algorithm. Each point represents a match rec-
ommended by the algorithm; the graph shows which combinations of firm rankings and job-
seeker rankings generated these recommended matches. The graph illustrates that the algorithm
worked well — in the sense of generally generating matches between firms and job-seekers who
were, at least on the basis of job-seeker skills and experience, reasonably suitable for each other.
Note the substantial mass at the bottom-left of the graph; this shows that, at least for those
firms paying reasonably well, the algorithm recommended matches of reasonable occupational
fit. (For example, for firms in the top 100 of job-seekers’ rankings, the median match was to a
job-seeker with a firm ranking of just 14.)
< Figure 1 here. >
4 Results: Average Effects
4.1 Impact on firms
In this section, we analyze the impact of the job fairs on our sample of firms; this follows our
pre-analysis plan.25 We divide outcomes into families. For each outcome of interest we use an
ITT approach with an ANCOVA specification; we also include the set of covariates used for the
randomization. We use robust standard errors.26 Specifically, we estimate:
yi = β0 + β1 · fairsi + α · yi,pre + δ · xi0 + µi. (1)
In this specification, the ‘balance’ variables included in xi0 are all the variables listed in Table 2.
Variable yic,pre is the dependent variable measured at baseline. Throughout this analysis we dis-
tinguish between professional workers and non-professional workers. ‘Professional workers’ refers
to traditional notions of ‘white-collar employees’: typically those with some degree or diploma,
working in relatively highly-skilled positions. For manufacturing firms, ‘non-professional work-
ers’ refers mostly to labourers or ‘production’ workers; for service-based firms, these include
mostly workers dedicated to ‘client services’ (tellers, waiters, receptionists, etc.) The main re-
sults on firm outcomes are presented in Tables 3, 4 and 9 (we place all other pre-specified outcome
families to an online appendix); in each table, we show each regression as a row, in which we
report the estimated ITT (β1), the mean of the control group, and the number of observations.
25 This is available at https://www.socialscienceregistry.org/trials/1495.26 Since randomisation was conducted at the firm level, we do not cluster our errors.
13
In each case, we report both p-values and False Discovery Rate q-values, calculated across the
family of outcomes (Benjamini et al., 2006).
First, in Table 3, Panel A, we test whether the fairs had an impact on firms’ recruitment
processes, as measured by firms’ ability to fill vacancies. We find no impact on these outcomes,
nor on how long it took to fill positions that were made available, nor on firms’ reported costs of
recruitment. We do find a small but significant positive impact of the fairs on unfilled vacancies.
That is, firms reported having more vacancies that they were unable to fill during the year.
However, this effect becomes marginally insignificant after we apply multiple hypothesis testing
corrections.
< Table 3 here. >
In Table 3, Panel B, we then look at the impact of the job fairs on firm hiring outcomes at the
time of the endline survey, which took place about six months after the second job fair. We find
no significant impact on the number of people hired by the firms in the last 12 months, nor on
the types of people, whether it be hiring of candidates with degrees, or hiring more candidates
on permanent contracts. This suggests that the job fairs did not significantly change how, and
whom, firms hired, over the 12 month period.27
Unsurprisingly, therefore, we find no impact on the firms’ overall work-force composition (Table
4). We asked firms about their entire current workforce (not just workers hired in the last few
months). We find no impacts on the types of contracts held by different workers, their starting
salaries, or the firms’ assessment of how well qualified their workers are, on average.28
< Table 4 here. >
4.2 Impact on jobseekers
We use the same specification as equation 1 to analyze the ITT for job-seekers; we report the
main results on employment outcomes in Tables 5. In an online appendix we present additional
results on employment amenities and job search at endline, in Tables 2 and 3, respectively. These
tables show regressions of key employment and search outcomes at the time of the endline survey
conducted four months after the second job fair. We cluster errors at the level of the enumeration
area in which respondents live, to correct for the fact that the treatments were randomized at
27 Similarly we find no impact on firms short term hiring, through a phone survey conducted immediately afterthe job fair. Table 11 shows the impacts on overall hiring. Table 12 shows the impacts on the types of workershired.
28 In addition, in Table 14 we show that the fairs had no impact overall firm productivity and growth. Table 13shows no impact on firms’ overall turnover and employee growth. Table 15 shows no overall impact on generalHR practices at the treated firms.
14
that level. As in our earlier results, we report both conventional p-values and False Discovery
Rate q-values.
We find no average effect on either endline employment outcomes (Table 5) or search methods
(Table 3). This is hardly surprising, in light of our results on firms. The effect on key job quality
outcomes such as ‘formal’ work or ‘permanent’ work are positive, but not significant.29 We find
that the fairs have no impacts on the types of jobs held by workers either.30
< Table 5 here. >
5 Why did the fairs not create more hires?
Why did the fairs not generate more hires, and what can we learn from this about labour market
matching? We explore two main types of explanations for our results. First, we hypothesise that
the fairs did not generate enough interaction between workers and firms to allow for hiring to
happen (suggesting that fairs are not an appropriate mechanism for screening workers). Second,
we investigate whether the workers who participated in the fairs were simply not good matches
for the participating firms.
5.1 Did the fairs provide enough scope for interaction?
We find that 454 job-seekers (75% of those attending) interacted with at least one firm at the
job fair, according to job-seekers’ reports. Of these, 69 job-seekers (11%) were then formally
interviewed after the job fairs. The same job-seeker typically contacts multiple firms and was
sometimes be interviewed by more than one firm. In total, we record 2,191 contacts between firms
and workers and 105 interviews (spread among 67 workers). Finally, we find that 45 jobseekers
were offered jobs, 14 job-seekers (2%) were hired. Overall, the job-seekers who attended a fair
secured one interview every 21 informal inquires with the firms, one job offer every 1.4 interview
and one job every 6.2 interviews approximately. 21 workers report that they rejected all of the
offers that they received.
How does this compare to workers’ search effectiveness outside the fairs? Between our baseline
and endline interview, job-seekers in our sample obtained an interview every 3.5 job applications,
an offer every 1.9 interviews, and a job every 3.3 interviews. From these figures, two conclusions
emerge. First, there was rich interaction between firms and job-seekers at the fairs. Second, this
29 These estimates are very much in line with the results suggesting that about 14 job seekers found jobs at thelarge formal firms at the job fairs, which would no doubt have been formal and permanent contracts; this effectwould register as a 1.5 percentage point increase in the probability of having such a job.
30 These results can be found in Table 2 in the online appendix, which reports effects on employment amenities.Table 3 shows the impacts on job search at enelin. Here we find only marginally significant impacts, which arenot robust to our multiple hypothesis corrections.
15
interaction led to surprisingly few good matches. In this section, we combine data on job-seekers
and on firms to explore this second finding.
We begin by exploring whether the more suitable worker-firm pairs attending the fair — ac-
cording to the rankings we created and the matching algorithm we ran — did indeed meet.
We interpret this as a basic descriptive test of coordination: do participants’ rankings predict
meetings? And, following this, do participants’ synthetic rankings also predict meetings? To
test this, we estimate the following dyadic regression models:
meetfw = β0 + β1 · Rankfw + β2 · Rankwf + µfw; (2)
meetfw = β0 + β1 · Gale Shapleyfw + β2 · Randomfw + µfw. (3)
Depending on the regression, meetfw is a dummy capturing either whether firm f requested
a meeting with worker w, or whether firm f and worker w actually met. We use a two-way
cluster methodology, clustering standard errors both at the level of the firm and at the level
of the worker (Cameron et al., 2011). We report model estimates in Table 6, which we obtain
using the sample of workers and firms who attended the fairs. We find that both rankings and
algorithmic recommendations are predictive of both requested and actual meetings. The effects
are large and significant. Moving from the highest to the lowest rank is associated with an
almost 100 percent decrease in the probability of a requested meeting, and about a halving of
the probability of an actual meeting. Further, matches suggested by the algorithm are about 200
percent more likely to happen than matches that were not suggested to workers. On the other
hand, the coefficient on randomly suggested matches is much smaller and is never significant.
In one specification we can reject that the two coefficients are equal at the 5 percent level. In
the other specifications, the F -test is on the margin of significance. We interpret these figures
as showing that suitable worker-firm pairs were likely to meet at the job fairs — and suggesting
that even a stylised matching algorithm can be useful in highlighting suitable matches for market
participants. This rules out the hypothesis that market design issues such as congestion and
mis-coordination prevented suitable pairs from meeting during the job fairs. In other words,
the fairs appear to have been well executed and attained their objective of facilitating meetings
between jobseekers and the firms that suited them best.
< Table 6 here. >
5.2 Were there not enough good matches available at the fairs?
Prior to arriving at the fairs, firms were surveyed and asked about their current vacancies: a
roster of different positions for which, at the time, they were looking to hire. On average, we
find that each firm was looking to hire for two different occupations, and had a total of seven
vacancies available. Only 30% of reporting firms told us that they had no vacancies at all. In
16
total, going into the fair, firms were hiring for 711 different vacancies, and looking to hire a total
of 1,751 workers. The occupational composition of the vacancies available at the firms exhibits
considerable overlap with the occupational composition of the jobseekers invited to the job fairs.
Therefore, we can rule out the possibility that the firms did not have sufficient vacancies of
the kind that participating jobseekers could have filled. We can also rule out that firms did
not interact sufficiently with workers. On average, each firm reports meeting 20 job-seekers
through the job fairs that they attended. In the second job fair, we asked firms — based on a
list of job-seekers’ qualifications — whether there were individuals whom they were interested
in interviewing. Most responded positively, by listing names of several candidates who were of
interest to them.
We would only see hires if the expected returns to hiring someone with a signal observed at
the fair was at least as high as the expected quality of the best recruit made through the usual
hiring channels. Indeed, firms may have already received applications for the positions that they
had open at the time of the fairs. If we assume that the job fairs did work for firms as a low
cost route to get a more accurate signal of worker ability, then firms must assess the quality of a
candidate for whom they have a very precise signal of ability against a range of anonymous CVs
received as applications. If the workers at the fairs simply were not very employable, it would be
unlikely that firms would invite them for interviews. If they were invited to the interview stage,
they would only be hired if they were indeed stronger candidates than all other interviewees.
Was the selected group of workers who chose to attend the fair of lower quality than the full
sample? Only about 60% of invited workers came to the fairs: if only those with very low
education, motivation and prospects of employment arrived, it is perhaps not surprising that
they did not get hired. As discussed above, in Table 5 we regress job-seekers’ attendance at
the fairs on a rich set of baseline characteristics; we find no evidence that observably weaker
candidates attended. In fact, the only two outcomes that robustly predict attendance were
related to search motivation: those who were searching the most at baseline, and who were
using formal certificates to search were most likely to attend. Education, gender, and even
employment do not predict attendance. We do find that invitees who were already working
at permanent jobs at the time of the fairs were slightly less likely to attend, but the effect is
unlikely to be driving our results: 4% of attendants at the fairs had permanent jobs, relative to
only 5.6% of the total sample.
5.2.1 Education and experience mismatch?
Given our random sampling strategy, the pool of participants was representative of the popula-
tion of young, educated job-seekers with little prior work experience. Could one explanation for
the lack of hiring be that large firms do not hire from this population? In other words, could
it be that young people who struggle to find a job immediately out of education will never be
17
able to find work at a formal firm, and thus active labour market policies that aim to get young
adults into work are unlikely to succeed?
First, we note that our job-seekers were not mismatched in terms of education. A substantial
proportion of our sample (31%) had on post-secondary education. However, 55% of firm hires
made after the fair, and 28% of all vacancies filled, were of job-seekers who had not finished
high-school.
Second, we investigate the role of work experience. Only 13% of workers had some experience in
a formal job. Could it be that the workers didn’t match firms experience requirements? Firms
do hire entry level workers without experience outside of the job fairs. After the job fair, we
interviewed all firms about the vacancies they had open before the fairs and how successful they
were at filling them. 424 firms hired 2,018 workers in one month after the job fairs. We find
that more than 30% of vacancies were filled with workers with zero years of work experience.
Because firms often hired many people at once to fill a particular vacancy, and because they
hired more workers for vacancies not requiring experience, this translates into 65% of all hires
made around the time of the fairs being filled with inexperienced workers.
That said, we find that firms exhibit a strong preference for experienced workers. We collected
data on firms’ open vacancies at the time that they attended the jobs fairs. Only 13% of
vacancies open at the fairs were intended for workers with no experience. This suggests that
firms do not think it is difficult to find candiates without work experience, so they used the
fairs as oppurtunity to focus on finding experienced workers. Firms may strongly prefer work
experience, but are often forced to hire the best entry level candidate they can find, due to a lack
of suitable candidates. Indeed, we find that although firms came to the fairs expecting to find
experienced workers for more skilled positions, they ended up making job offers to inexperienced
workers for lower paid positions. We explore the role of these expectations in the next section.
5.2.2 Mismatched expectations
We conclude, therefore, that firms did meet the kinds of workers whom they usually hire, both
in terms of education and work experience: it seems that matches were possible. However, there
may have been other kinds of mismatch preventing the hires from happening, related to the
expectations and reservation wages. In particular, we find that firms came to the fairs with
the expectation that they would be hiring experienced, skilled professionals, for which higher
education (degree or diploma) was essential. Hiring lower-skilled workers for low wage jobs does
not usually require considerable recruitment effort on the part of firms, so the fairs were seen as
a chance to head-hunt the best candidates. On this interpretation, when firms realised that their
expectations were not matched by the pool of available candidates, which was a representative
sample of the labour market, the result was a very low number of jobs generated.
So why were our highly educated workers, with university degrees, not hired at the fairs? Firms
18
report paying their recruits with university degrees an average of 4,500 birr per month. This
sum lies well above the reservation wages of university graduates at the fairs: these were equal
to 2,500 birr at the median, and only 10% of workers in our sample had reservation wages above
the average paid for professionals at these firms. So it is unlikely that the workers were not
interested in the high-skill positions available at the fairs.
Rather, a key constraint emerges: firms hiring for high-skilled professional positions put a par-
ticular premium on work experience for these positions. In particular, only 22% of vacancies
filled by job-seekers with post-secondary education were filled by workers with no experience,
compared to 52% of vacancies filled for high-school graduates (or below). Yet very few of the
tertiary educated jobseekers in our sample had any experience at all (only 20% had had any kind
of formal work experience). Firms may have been unwilling to hire them because of the costs
of training a worker with no experience, or because of the risk associated with hiring someone
without a reference letter from a previous employer.
To investigate this channel further, we return to our dyadic framework and to our data on
firm-requested meetings, to investigate what types of workers firms want to meet. We find
that the single strongest predictor of whether firms wanted to meet a worker was that workers’
previous job experience, even after controlling for worker and firm characteristics. The results
are not driven only by firms who intended to hire experienced workers before the fairs: even
firms that said they were willing to hire fresh graduates (without experience) were more likely
to request meetings with experienced workers. Unfortunately for these firms, when we look at
actual worker-firm meetings, we do not find that experienced workers were more likely to meet
up with the firms. Firms report that a lack of experience among workers was indeed a key
constraint for them not making more offers for high-skill positions.31 So firms that attended
the job fairs came with the intention of finding workers with work experience for relatively high
skilled positions, and seem to have overestimated how easy it would be find such a candidate
from the presentative group of jobseekers in attendence.
They did not miss the opportunity, however, to recruit for lower paid positions. We find that a
total of 76 offers were made to 45 different workers. Of those offers, 55 were made to low skilled
workers (workers with no post-secondary education), with the remaining 21 going to those with
diplomas or degrees. All offers made to low-skilled workers were to workers with no previous
31 In the phone questionnaire after the second job fair, we asked firms to rate the most employable job-seekersthey met at the job fair, compared to the candidates whom the firm would have selected for interviews throughits normal recruitment channels. Only 12 percent of firms report that the most employable job-seeker at thefair would be in the top 20 percent of candidates in their usual recruitment round. 54 percent of firms, onthe other hand, report that the most employable job-seeker at the fair would be in the bottom 50 percent ofcandidates in their usual recruitment. This is consistent with the fact that the most common reasons firmsreported for not hiring more job-seekers at the fairs are ‘insufficient work experience’ (34% of firms) and ‘wrongeducational qualifications’ (23%). On the other side of the market, even workers themselves report that theydid not have the required experience for the firms present at the job fairs. Many reported that firms ‘askedfor experience’, which few of them have in the formal sector. More than 65% reported that the main problemwith the fairs was that there were not enough jobs for which they were qualified.
19
work experience. Yet the low skilled workers accepted only 8 of those positions (14.5%) while
higher skilled workers accepted 6 (28.5%). This, ultimately, is why so few matches were made
at the fairs.
We argue that this was because of mismatched wage expectations. Lower-skilled workers had
over-inflated expectations about the salaries they could aspire to in the market. We explore this
possibility in Table 7. Workers without degrees in our sample report reservation wages with a
median of 1,400 birr per month. Yet firms that hired individuals with no degree (or diploma)
and no experience paid a median wage of only 855 birr. It may be the case, therefore, that even
the relatively few low-skilled vacancies that could have been filled at the fairs did not attract
a match because workers were unhappy with the offered wages. So, even though firms were
willing to hire entry-level workers without experience (and indeed made offers at the job fairs),
the workers did not take the offers because of unrealistic expectations. Recall that workers
reported receiving a sizeable number of job offers at the fairs, but only 33% of workers accepted
at least one of those offers.
< Table 7 here. >
In sum, it appears that workers and firms had mismatched expectations. Firms overestimated the
ease with which they could find experienced workers with tertiary education at the fairs; workers
with degrees may have been impressed by the salaries on offer by the firms, but disappointed
to find that the experience required to get those jobs was beyond their reach. On the other
hand, they were not particularly interested in hiring low-skilled workers, whom they could have
easily recruited on the open market at low wages without needing to invest in time-consuming
interviews and screening processes. Low-skilled workers, on the other hand, had reservation
wages well above those that firms were willing to offer. In the next section, we study how the
experience of attending the fairs influenced the expectations of both workers and firms, and thus
altered their search and recruitment behaviour later on.
6 Effects of the fairs on expectations and search
The analysis in the previous sections suggests that firms and workers came to the fairs with
inconsistent expectations about the types of matches they were likely to make. Did the fairs have
an impact, then, on expectations, and therefore firms’ and job-seekers’ search and recruitment
behaviour afterwards? Workers may have realised that their reservations wages were too high.
Given that so few workers recieved job offers, and also possibly because they saw the competition
they faced from other jobseekers in the market, they may have come to believe that formal jobs
were harder to get than they had originally thought. This updating of the beliefs would lead
them to increase their search effort and reduce their reservations wages in order to increase
20
their probability of finding a good job. In testing this new hypothesis, we go beyond what was
pre-specified in our original analysis plan.
To answer this question, we now explore changes in job-seekers’ search behaviour and in firms’
recruitment activities in the months after the job fairs. We find clear evidence that both job-
seekers and firms increased their efforts at search through formal channels. In particular, workers
were more likely to visit the job boards during the weeks after the job fairs. Figure 2 plots the
fortnight-specific treatment effect of the job fairs, relative to fortnight 0 (when the first job fairs
were held) and fortnight 8 (when the second job fair was held). These effects are estimated using
weekly phone call surveys conducted with all jobseekers in our sample, throughout the course of
the study. We find significant effects — albeit short-lived — on the probability of visiting the
job boards after each of the two fairs.
< Figure 2 here. >
In Table 8, we study impacts on firms’ recruitment activities outside the job fairs. That is, after
the fairs we asked firms about their methods of advertising for vacant positions, and whether
they conducted interviews with the applicants who applied. We find that firms invited to the job
fairs were about six percentage points more likely to have advertised new vacancies in the last 12
months (compared to a control mean of about 79%), and they were 12 percentage points more
likely to have advertised for professional positions (control mean: about 60%). They were also
more likely to be using the job vacancy boards: the main place for attracting formal applications.
All three results are significant, including after controlling for multiple hypothesis testing. This
suggests that the fairs increased beliefs about the returns to searching for jobs through the usual
formal methods, for both workers and firms that attended.
< Table 8 here. >
In Table 9, we test the effect of our treatment on expectations, search and employment. In
Panel A of that table, we show that our treatment had a large and significant effect on the
reservation wages (namely, a reduction of about 7 percent). This resulted in reservation wages
becoming more realistic: when we test effects on ‘wage mismatch’ (which we define as the
absolute difference between the reservation wage and the expected wage for a worker of that
skill/education level, in logs), we find a highly significant negative effect (of about 4 percent).
This was accompanied by a significant increase in visits to the job boards (an increase of about
three visits, on a control mean of about 15 visits). We find no significant average effects on
employment outcomes (namely, whether respondents had any work, and then either a permanent
job or a formal job).
< Table 9 here. >
21
Earlier, in Table 7, we showed descriptively that education is centrally important for explaining
heterogeneity in both reservation wages and offered wages — and that expectations appear to be
most unrealistic among those workers who do not have a degree qualification. With this stylised
fact in mind, we then disaggregate our treatment estimates by whether or not respondents have
a post-secondary education; we report results in Panel B of Table 9. We find that the average
effects on reservation wages can wholly be explained by large effects on those with only a high-
school education — who, on average, reduced their reservation wage by 9 percent, reduced wage
mismatch by 7 percent, and increased board visits by 4.2 percent (on a control mean of about 11
visits). Further, for respondents with high-school education, we find large and significant effects
on employment in ‘good jobs’: an increase of about 6 percentage points in the probability of
having a permanent job (on a control mean of just 6 percent), and an increase in the probability
of having a formal job of about 5 percentage points (on a control mean of about 11 percent).32
7 Conclusion
We run one of the first experimental studies of job fairs, bringing together a random sample of
young jobseekers and firms with vacancies. The jobseekers invited to the fairs are representative
of the type of young workers that firms usually hire. We facilitate interactions between workers
and firms by providing information about workers’ education and firms’ vacancies, and by sug-
gesting matches based on a Gale-Shapley algorithm. We find that the fairs generate a rich set
of interactions between workers and firms. But only 14 jobseekers were hired as a direct result
of interactions at the job fairs.
Our analysis of the mechanisms generating these results sheds new light on the workings of the
urban labour markets, and bears important implications for active labour market policies in
developing countries. First, we find that lack of work experience is a binding requirement for
the most qualified jobs and a crucial obstacle for young jobseekers. Firms see the fairs as an
opportunity to select highly qualified and experienced workers but find the pool of participating
jobseekers to be less experienced than they expected. As a result, they refrain from making
offers for highly qualified positions at the fair.33 Firms do make offers for low-skilled positions,
but many of these offers are turned down, consistent with the fact that low-skilled workers have
a reservation wage above the going wage rate.
Given the apparent mismatch of expectations between firms and workers, we investigate whether
subjects learn from their experience. The fairs induce an updating of expectations among high-
school graduates who have the most misguided expectations at baseline. After the fairs, these
32 In the bottom row of Table 9, we report p-values for tests of the null hypothesis that these effects are equalbetween educational groups. We reject this null for measures of wage mismatch and of having a permanentjob; we are very close to rejecting at conventional levels (p < 0.12) for board visits and for having a formal job.
33 This is consistent with Tervio (2009), who shows that firms can often over-invest in hiring among workers withexisting experience, instead of investing more in the recruitment of talented workers with less observable skills.
22
jobseekers revise their reservation wage downwards to more accurately reflect the wages offered
at the fairs and those that people of their education and skill level usually get in Addis Ababa.
These jobseekers also increase their job search effort through formal channels and, four months
after the job fairs, they are more likely to have found a formal job.
How do these results compare to other job search interventions directed at young jobseekers?
In other work (Abebe et al., 2016) we find that reducing search costs by giving out a transport
subsidy increases visits to the job boards by about 30%. The indirect effect of the job fairs
is about half that, and their effect on formal and permanent employment is similarly half the
size of the effect of the transport subsidy. However, unlike the job fairs that bring jobseekers
in contact with hundreds of firms, the transport subsidy does not reduce reservation wages. It
just allows young jobseekers to search more persistently and look at more vacancies, without
causing them to meet more firms face-to-face. Although recipients of the transport subsidy do
not update their beliefs, they nonetheless enjoy a short-term positive effect on employment.
Taken together with the findings of this paper, these results suggest that multiple frictions are
at play that potentially compound each other – especially among high-school graduates who
benefit most form both the reduction in search cost allowed by the transport subsidy, and the
revision in misguided expectations enabled by the job fairs.
What have we learned about the possible usefulness of job fairs in urban Africa? Based on the
frequent use of job fairs by schools elsewhere, we were hoping that they could serve as clearing
house to reduce friction and facilate the matching of young educated jobseekers to jobs in a
rapidly growing city. This is not what we find. The behavior of employers at the fair instead
suggest that, at this point in time, job fairs could be more appropriate for specific skills that
are hard to search for, such as job experience particular to a sector or technology. With time,
employers may start looking for university and vocational school graduates with specific interests
or internship experience – just like they do in the US. But this time does not seem to have been
reached yet in Addis Ababa. We can only hope that employers disappointed by what they saw
at the job fairs will, in the future, put more emphasis on providing task-specific training to
young jobseekers themselves.
References
Abebe, G., S. Caria, M. Fafchamps, P. Falco, S. Franklin, and S. Quinn (2016). Curse of
Anonymity or Tyranny of Distance? The Impacts of Job-Search Support in Urban Ethiopia.
NBER Working Paper No. 22409 .
Abebe, G., S. Caria, and E. Ortiz-Ospina (2017). The Selection of Talent. Working Paper .
Alfonsi, L., O. Bandiera, V. Bassi, R. Burgess, I. Rasul, M. Sulaiman, and A. Vitali (2017). Tack-
23
ling Youth Unemployment: Evidence from a Labor Market Experiment in Uganda. Working
Paper .
Bandiera, O., I. Barankay, and I. Rasul (2011). Field Experiments with Firms. The Journal of
Economic Perspectives 25 (3), 63–82.
Bassi, V. and A. Nansamba (2017). Information Frictions in the Labor Market: Evidence from
a Field Experiment in Uganda. Working Paper .
Beam, E., J. Hyman, and C. B. Theoharides (2017). The Relative Returns to Education,
Experience, and Attractiveness for Young Workers. IZA Discussion Paper No. 10537 .
Beam, E. A. (2016). Do Job Fairs Matter? Experimental Evidence on the Impact of Job-Fair
Attendance. Journal of Development Economics 120, 32–40.
Benjamini, Y., A. M. Krieger, and D. Yekutieli (2006). Adaptive Linear Step-up Procedures
that Control the False Discovery Rate. Biometrika 93 (3), 491–507.
Bertrand, M. and S. Mullainathan (2004). Are Emily and Greg more employable than Lakisha
and Jamal? A Field Experiment on Labor Market Discrimination. The American Economic
Review 94 (4), 991–1013.
Bloom, N., A. Mahajan, D. McKenzie, and J. Roberts (2010). Why do Firms in Developing
Countries have Low Productivity? The American Economic Review 100 (2), 619–623.
Bloom, N. and J. Van Reenen (2011). Human Resource Management and Productivity. Handbook
of Labor Economics 4, 1697–1767.
Bruhn, M. and D. McKenzie (2009). In Pursuit of Balance: Randomization in Practice in
Development Field Experiments. American Economic Journal: Applied Economics 1 (4),
200–232.
Cameron, A. C., J. B. Gelbach, and D. L. Miller (2011). Robust Inference with Multiway
Clustering. Journal of Business & Economic Statistics 29 (2), 238–249.
Card, D., J. Kluve, and A. Weber (2010). Active Labour Market Policy Evaluations: A Meta-
analysis. The Economic Journal 120 (548), F452–F477.
Caria, S., P. Falco, et al. (2014). Do Employers Trust Workers too Little? An Experimental
Study of Trust in the Labour Market. CSAE Working Paper .
Chang, L. T. (2009). Factory Girls: From Village to City in a Changing China. Random House
Digital, Inc.
Crepon, B. and G. J. Van den Berg (2016). Active Labor Market Policies. Annual Review of
Economics 8, 521–546.
24
De Mel, S., D. McKenzie, and C. Woodruff (2016). Labor Drops: Experimental Evidence on
the Return to Additional Labor in Microenterprises. NBER Working Paper No. 23005 .
Franklin, S. (2015). Location, Search Costs and Youth Unemployment: A Randomized Trial of
Transport Subsidies in Ethiopia. CSAE Working Paper WPS/2015-11 .
Gale, D. and L. S. Shapley (1962). College Admissions and the Stability of Marriage. The
American Mathematical Monthly 69 (1), 9–15.
Glover, D., A. Pallais, and W. Pariente (2017). Discrimination as a Self-Fulfilling Prophecy:
Evidence from French Grocery Stores. The Quarterly Journal of Economics 132 (3), 1219–
1260.
Groh, M., D. McKenzie, N. Shammout, and T. Vishwanath (2015). Testing the Importance of
Search Frictions and Matching Through a Randomized Experiment in Jordan. IZA Journal
of Labor Economics 4 (1), 1–20.
Hardy, M. and J. McCasland (2015). Are Small Firms Labor Constrained? Experimental
Evidence from Ghana. Working paper .
Hoffman, M., L. B. Kahn, and D. Li (2015). Discretion in Hiring. NBER Working Paper No.
21709 .
Jensen, R. (2012). Do Labor Market Opportunities Affect Young Women’s Work and Family
Decisions? Experimental Evidence from India. The Quarterly Journal of Economics 127 (2),
753–792.
Kagel, J. H. and A. E. Roth (2000). The Dynamics of Reorganization in Matching Markets:
A Laboratory Experiment Motivated by a Natural Experiment. The Quarterly Journal of
Economics 115 (1), 201–235.
Krueger, A. B. and A. I. Mueller (2016). A Contribution to the Empirics of Reservation Wages.
American Economic Journal: Economic Policy 8 (1), 142–179.
Lee, D. S. (2009). Training, Wages, and Sample Selection: Estimating Sharp Bounds on Treat-
ment Effects. The Review of Economic Studies 76 (3), 1071–1102.
McKenzie, D. J. (2017). How Effective are Active Labor Market Policies in Developing Coun-
tries? A Critical Review of Recent Evidence. Working Paper .
McKinney, C. N., M. Niederle, and A. E. Roth (2005). The Collapse of a Medical Labor
Clearinghouse (and why such Failures are Rare). American Economic Review 95 (3), 878–
889.
Nattrass, N. and R. Walker (2005). Unemployment and Reservation Wages in Working-Class
Cape Town. South African Journal of Economics 73 (3), 498–509.
25
Oyer, P. and S. Schaefer (2010). Personnel Economics: Hiring and Incentives. Handbook of
Labor Economics.
Pallais, A. (2014). Inefficient Hiring in Entry-Level Labor Markets. The American Economic
Review 104 (11), 3565–3599.
Roth, A. E. (1984). The Evolution of the Labor Market for Medical Interns and Residents: A
Case Study in Game Theory. Journal of political Economy 92 (6), 991–1016.
Roth, A. E. (1991). A Natural Experiment in the Organization of Entry-level Labor Markets:
Regional Markets for new Physicians and Surgeons in the United Kingdom. The American
Economic Review , 415–440.
Spinnewijn, J. (2015). Unemployed but Optimistic: Optimal Insurance Design with Biased
Beliefs. Journal of the European Economic Association 13 (1), 130–167.
Stanton, C. and C. Thomas (2015). Landing the First Job: The Value of Intermediaries in
Online Hiring. The Review of Economic Studies.
Tervio, M. (2009). Superstars and Mediocrities: Market Failure in the Discovery of Talent. The
Review of Economic Studies 76 (2), 829–850.
26

Tables
27
Tab
le1:
Fir
msi
ze
by
secto
r
Wor
ker
Typ
eS
amp
leIn
du
stry
Cli
ent
serv
ices
Pro
du
ctio
nS
upp
ort
staff
Wh
ite
coll
arA
llw
orker
sS
ize
Con
stru
ctio
n,
Min
ing,
Far
min
g2.
792
.721
.721
.814
3.2
92T
ou
rs-H
osp
ital
ity
15.8
7.4
13.2
7.4
46.4
102
Fin
an
ace,
Ser
vic
es,
Ret
ail
146.
633
.796
.618
3.3
473.
310
4E
du
cati
on,
Hea
lth
,A
id12
.65.
231
.273
.613
1.0
126
Manu
fact
uri
ng
24.4
149.
037
.433
.725
0.2
69
All
Ind
ust
ries
26.9
52.4
33.1
52.8
171.
549
3
No
tes:
Th
ista
ble
des
crib
esth
efi
rms
ino
ur
sam
ple
,d
isa
ggre
gati
ng
byp
rim
ary
sect
or
an
dby
type
of
occu
pati
on
s.
28
Tab
le2:
Su
mm
ary
of
vari
ab
les
use
din
blo
ckin
g/re
-ran
dom
isati
on
NMean
S.Dev.
1stQ.
Median
3rdQ.
Min.
Max.
p-value
Pri
vate
lim
ited
com
pany
493
0.5
10.5
00.0
01.0
01.0
00.0
1.0
0.9
63
NG
O493
0.1
30.3
40.0
00.0
00.0
00.0
1.0
0.9
58
Tours
&H
osp
itality
493
0.1
90.3
90.0
00.0
00.0
00.0
1.0
0.9
49
Ser
vic
es&
Fin
ance
s493
0.2
10.4
10.0
00.0
00.0
00.0
1.0
0.8
78
Educa
tion
&H
ealt
h493
0.2
10.4
10.0
00.0
00.0
00.0
1.0
0.9
44
Manufa
cturi
ng
493
0.2
60.4
40.0
00.0
01.0
00.0
1.0
0.9
37
Const
ruct
ion
&M
inin
g493
0.1
40.3
50.0
00.0
00.0
00.0
1.0
0.9
40
Dis
tance
toce
ntr
e491
4.9
38.8
51.9
63.4
25.8
00.2
123.6
0.8
86
Tota
lem
plo
yee
s493
288.1
1972.9
837.0
087.0
0225.0
04.0
18524.0
0.5
98
Work
forc
ecomposition
(job
cate
gory
)P
rofe
ssio
nals
493
0.2
90.2
30.1
00.2
10.4
50.0
0.9
0.9
21
Supp
ort
staff
493
0.2
40.1
50.1
30.2
20.3
20.0
0.8
0.4
01
Pro
duct
ion
493
0.2
60.2
90.0
00.1
70.5
00.0
1.0
0.8
63
Cust
om
erse
rvic
es493
0.1
40.1
60.0
00.0
70.2
20.0
0.7
0.8
73
Work
forc
ecomposition
(education)
Deg
ree
493
0.2
30.2
40.0
40.1
30.3
70.0
1.0
0.9
01
Dip
lom
a493
0.1
70.1
50.0
50.1
30.2
40.0
1.0
0.5
19
Turn
over
493
0.2
10.8
80.0
50.1
00.1
90.0
14.3
0.1
50
Tota
lannual
new
yea
rs493
54.4
5218.4
24.0
011.0
035.0
00.0
3901.0
0.2
68
Hir
ing
rate
493
54.4
5218.4
24.0
011.0
035.0
00.0
3901.0
0.2
68
Use
form
al
recr
uit
men
t493
0.6
50.4
80.0
01.0
01.0
00.0
1.0
0.7
03
Would
com
eto
afa
ir493
0.7
90.4
11.0
01.0
01.0
00.0
1.0
0.7
11
Tota
lsa
les
(1000s)
339
554.7
53.8
4e+
03
7.1
750
23.0
17
121.8
310
0.0
6.0
e+04
0.4
92
Aver
age
sala
ry(B
irr)
493
2885.0
73010.3
51303.0
31990.1
83190.0
00.0
27683.2
0.8
12
Exp
ecte
dhir
ing
rate
493
0.2
20.8
50.0
00.0
80.1
90.0
14.9
0.5
71
No
tes:
Th
ista
ble
pro
vid
esba
sic
des
crip
tive
sta
tist
ics
on
sam
ple
firm
s;in
do
ing
so,
ita
lso
sho
ws
the
vari
abl
esu
sed
for
bloc
kin
ga
nd
re-r
an
do
mis
ati
on
.T
he
‘p-v
alu
e’co
lum
nsh
ow
sin
div
idu
alp-v
alu
esfo
rte
sts
of
cova
ria
teba
lan
ce.
29
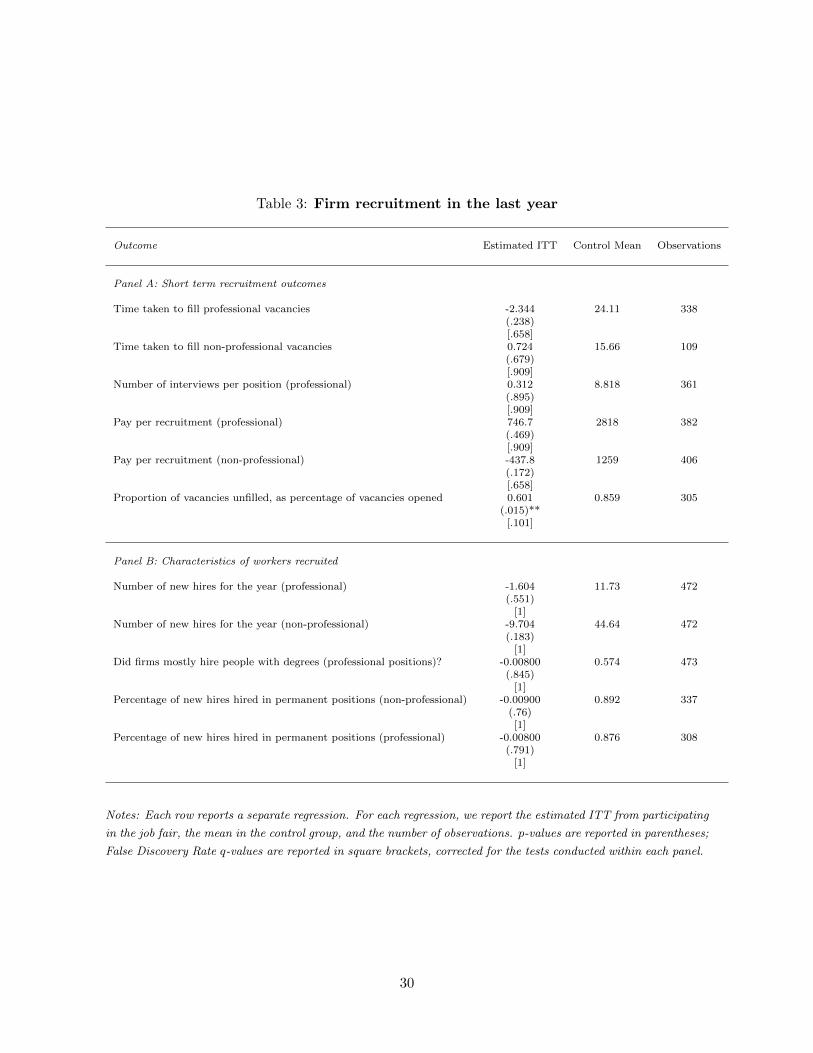
Table 3: Firm recruitment in the last year
Outcome Estimated ITT Control Mean Observations
Panel A: Short term recruitment outcomes
Time taken to fill professional vacancies -2.344 24.11 338(.238)[.658]
Time taken to fill non-professional vacancies 0.724 15.66 109(.679)[.909]
Number of interviews per position (professional) 0.312 8.818 361(.895)[.909]
Pay per recruitment (professional) 746.7 2818 382(.469)[.909]
Pay per recruitment (non-professional) -437.8 1259 406(.172)[.658]
Proportion of vacancies unfilled, as percentage of vacancies opened 0.601 0.859 305(.015)**
[.101]
Panel B: Characteristics of workers recruited
Number of new hires for the year (professional) -1.604 11.73 472(.551)
[1]Number of new hires for the year (non-professional) -9.704 44.64 472
(.183)[1]
Did firms mostly hire people with degrees (professional positions)? -0.00800 0.574 473(.845)
[1]Percentage of new hires hired in permanent positions (non-professional) -0.00900 0.892 337
(.76)[1]
Percentage of new hires hired in permanent positions (professional) -0.00800 0.876 308(.791)
[1]
Notes: Each row reports a separate regression. For each regression, we report the estimated ITT from participating
in the job fair, the mean in the control group, and the number of observations. p-values are reported in parentheses;
False Discovery Rate q-values are reported in square brackets, corrected for the tests conducted within each panel.
30
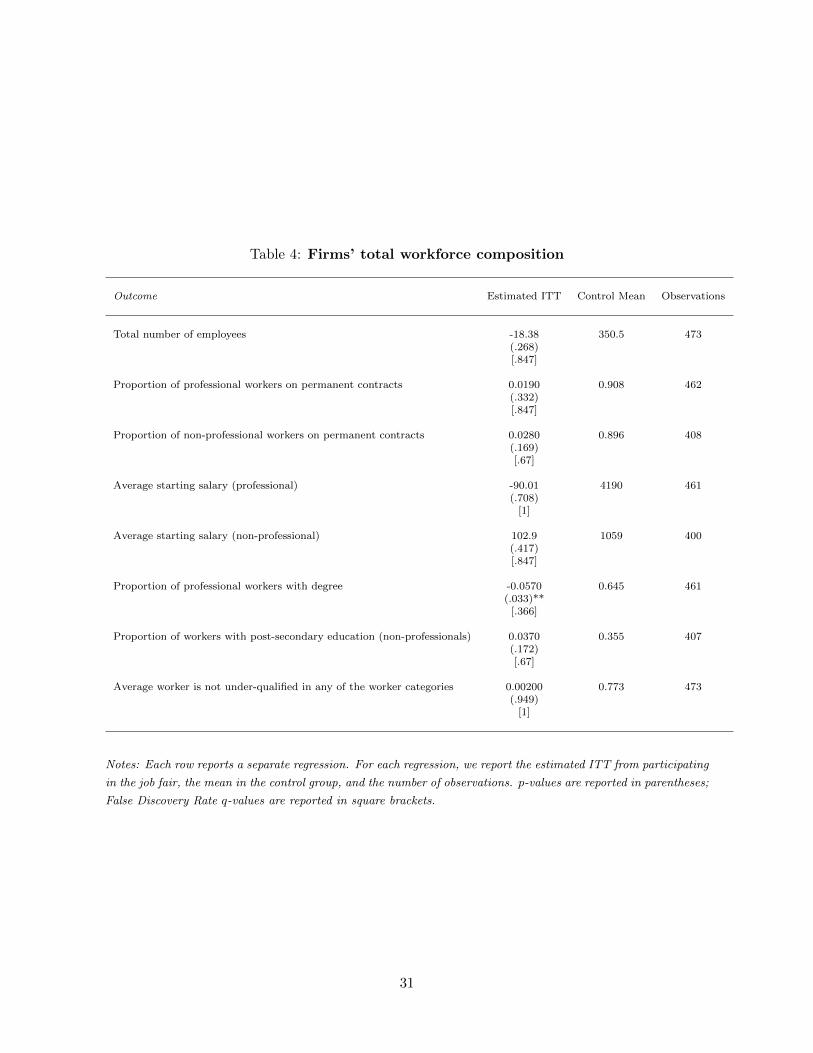
Table 4: Firms’ total workforce composition
Outcome Estimated ITT Control Mean Observations
Total number of employees -18.38 350.5 473(.268)[.847]
Proportion of professional workers on permanent contracts 0.0190 0.908 462(.332)[.847]
Proportion of non-professional workers on permanent contracts 0.0280 0.896 408(.169)[.67]
Average starting salary (professional) -90.01 4190 461(.708)
[1]
Average starting salary (non-professional) 102.9 1059 400(.417)[.847]
Proportion of professional workers with degree -0.0570 0.645 461(.033)**
[.366]
Proportion of workers with post-secondary education (non-professionals) 0.0370 0.355 407(.172)[.67]
Average worker is not under-qualified in any of the worker categories 0.00200 0.773 473(.949)
[1]
Notes: Each row reports a separate regression. For each regression, we report the estimated ITT from participating
in the job fair, the mean in the control group, and the number of observations. p-values are reported in parentheses;
False Discovery Rate q-values are reported in square brackets.
31
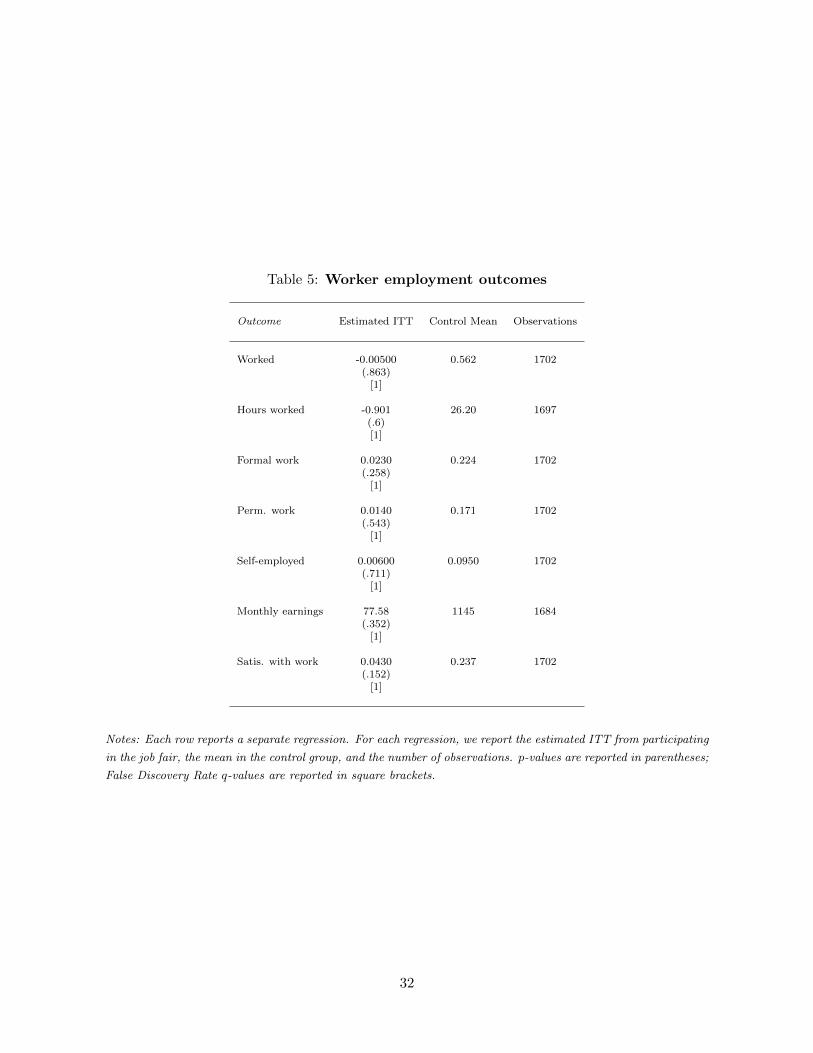
Table 5: Worker employment outcomes
Outcome Estimated ITT Control Mean Observations
Worked -0.00500 0.562 1702(.863)
[1]
Hours worked -0.901 26.20 1697(.6)[1]
Formal work 0.0230 0.224 1702(.258)
[1]
Perm. work 0.0140 0.171 1702(.543)
[1]
Self-employed 0.00600 0.0950 1702(.711)
[1]
Monthly earnings 77.58 1145 1684(.352)
[1]
Satis. with work 0.0430 0.237 1702(.152)
[1]
Notes: Each row reports a separate regression. For each regression, we report the estimated ITT from participating
in the job fair, the mean in the control group, and the number of observations. p-values are reported in parentheses;
False Discovery Rate q-values are reported in square brackets.
32
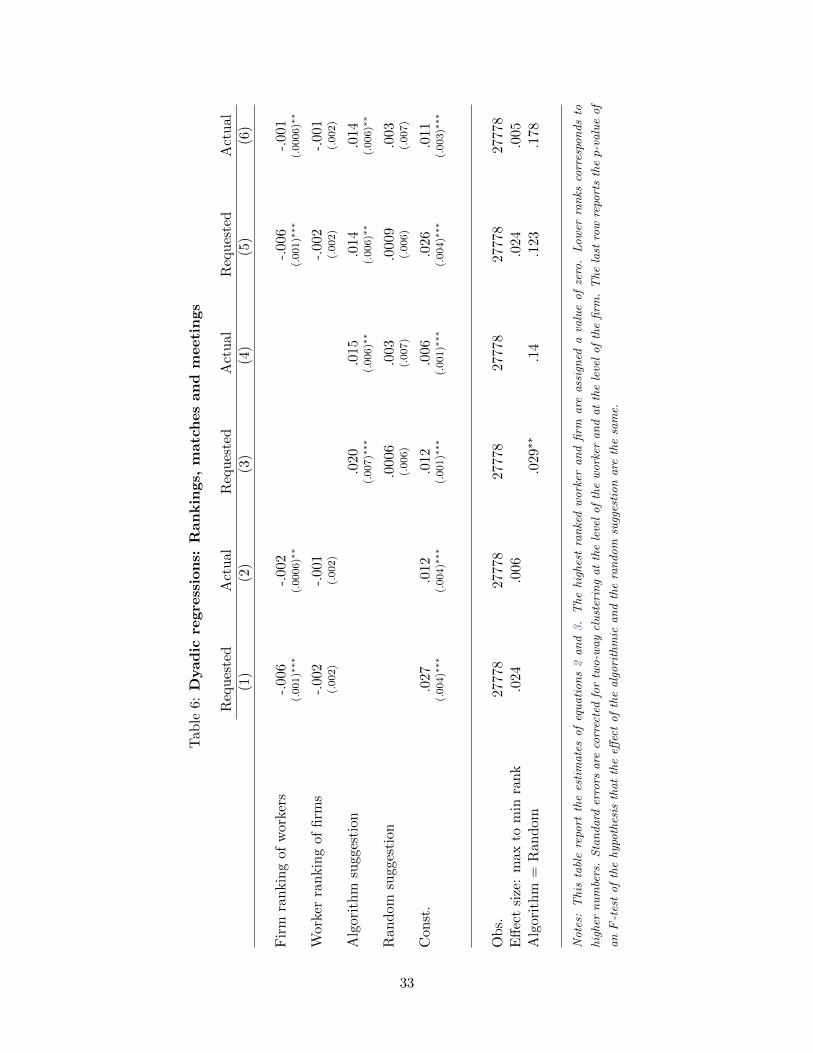
Tab
le6:
Dyad
icre
gre
ssio
ns:
Ran
kin
gs,
matc
hes
an
dm
eeti
ngs
Req
ues
ted
Act
ual
Req
ues
ted
Act
ual
Req
ues
ted
Act
ual
(1)
(2)
(3)
(4)
(5)
(6)
Fir
mra
nkin
gof
work
ers
-.00
6-.
002
-.00
6-.
001
(.001)∗
∗∗(.
0006)∗
∗(.
001)∗
∗∗(.
0006)∗
∗
Work
erra
nkin
gof
firm
s-.
002
-.00
1-.
002
-.00
1(.
002)
(.002)
(.002)
(.002)
Alg
orit
hm
sugge
stio
n.0
20.0
15.0
14.0
14(.
007)∗
∗∗(.
006)∗
∗(.
006)∗
∗(.
006)∗
∗
Ran
dom
sugge
stio
n.0
006
.003
.000
9.0
03(.
006)
(.007)
(.006)
(.007)
Con
st.
.027
.012
.012
.006
.026
.011
(.004)∗
∗∗(.
004)∗
∗∗(.
001)∗
∗∗(.
001)∗
∗∗(.
004)∗
∗∗(.
003)∗
∗∗
Ob
s.277
7827
778
2777
827
778
2777
827
778
Eff
ect
size
:m
ax
tom
inra
nk
.024
.006
.024
.005
Alg
orit
hm
=R
an
dom
.029
∗∗.1
4.1
23.1
78
No
tes:
Th
ista
ble
repo
rtth
ees
tim
ate
so
feq
ua
tio
ns
2a
nd
3.
Th
eh
igh
est
ran
ked
wo
rker
an
dfi
rma
rea
ssig
ned
ava
lue
of
zero
.L
ow
erra
nks
corr
espo
nd
sto
hig
her
nu
mbe
rs.
Sta
nd
ard
erro
rsa
reco
rrec
ted
for
two
-wa
ycl
ust
erin
ga
tth
ele
vel
of
the
wo
rker
an
da
tth
ele
vel
of
the
firm
.T
he
last
row
repo
rts
thep-v
alu
eo
f
anF
-tes
to
fth
eh
ypo
thes
isth
at
the
effec
to
fth
ea
lgo
rith
mic
an
dth
era
nd
om
sugg
esti
on
are
the
sam
e.
33
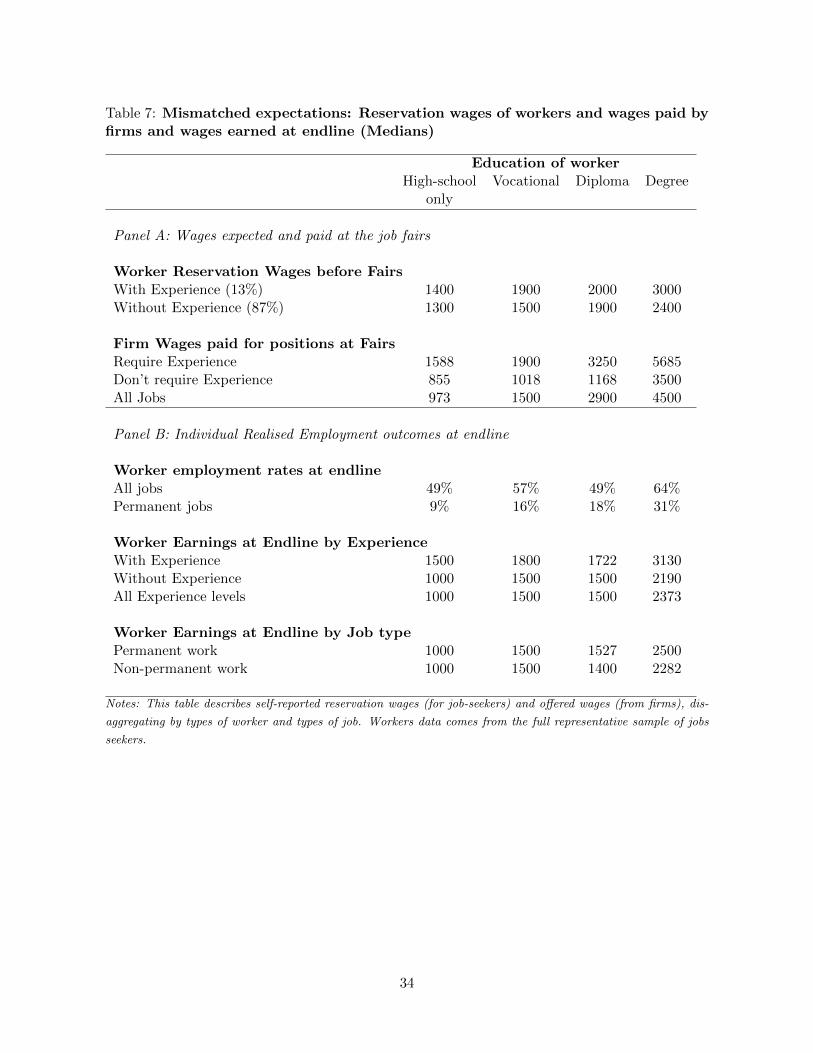
Table 7: Mismatched expectations: Reservation wages of workers and wages paid byfirms and wages earned at endline (Medians)
Education of workerHigh-school Vocational Diploma Degree
only
Panel A: Wages expected and paid at the job fairs
Worker Reservation Wages before FairsWith Experience (13%) 1400 1900 2000 3000Without Experience (87%) 1300 1500 1900 2400
Firm Wages paid for positions at FairsRequire Experience 1588 1900 3250 5685Don’t require Experience 855 1018 1168 3500All Jobs 973 1500 2900 4500
Panel B: Individual Realised Employment outcomes at endline
Worker employment rates at endlineAll jobs 49% 57% 49% 64%Permanent jobs 9% 16% 18% 31%
Worker Earnings at Endline by ExperienceWith Experience 1500 1800 1722 3130Without Experience 1000 1500 1500 2190All Experience levels 1000 1500 1500 2373
Worker Earnings at Endline by Job typePermanent work 1000 1500 1527 2500Non-permanent work 1000 1500 1400 2282
Notes: This table describes self-reported reservation wages (for job-seekers) and offered wages (from firms), dis-
aggregating by types of worker and types of job. Workers data comes from the full representative sample of jobs
seekers.
34
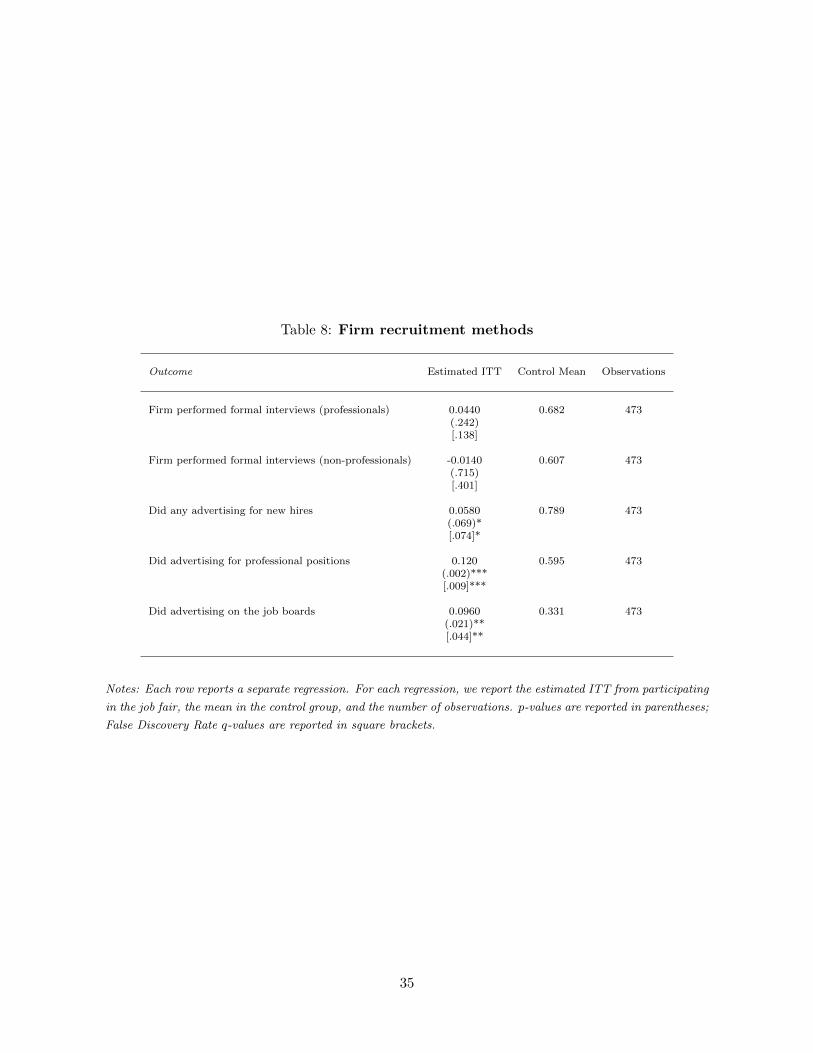
Table 8: Firm recruitment methods
Outcome Estimated ITT Control Mean Observations
Firm performed formal interviews (professionals) 0.0440 0.682 473(.242)[.138]
Firm performed formal interviews (non-professionals) -0.0140 0.607 473(.715)[.401]
Did any advertising for new hires 0.0580 0.789 473(.069)*[.074]*
Did advertising for professional positions 0.120 0.595 473(.002)***[.009]***
Did advertising on the job boards 0.0960 0.331 473(.021)**[.044]**
Notes: Each row reports a separate regression. For each regression, we report the estimated ITT from participating
in the job fair, the mean in the control group, and the number of observations. p-values are reported in parentheses;
False Discovery Rate q-values are reported in square brackets.
35
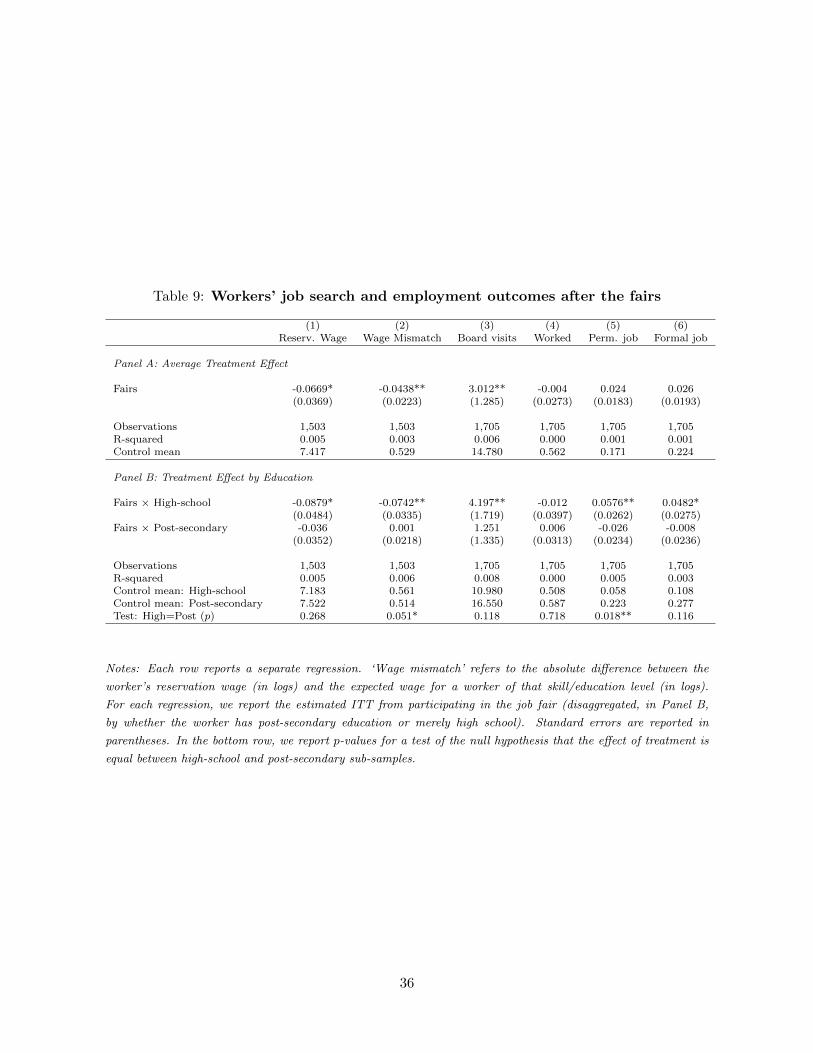
Table 9: Workers’ job search and employment outcomes after the fairs
(1) (2) (3) (4) (5) (6)Reserv. Wage Wage Mismatch Board visits Worked Perm. job Formal job
Panel A: Average Treatment Effect
Fairs -0.0669* -0.0438** 3.012** -0.004 0.024 0.026(0.0369) (0.0223) (1.285) (0.0273) (0.0183) (0.0193)
Observations 1,503 1,503 1,705 1,705 1,705 1,705R-squared 0.005 0.003 0.006 0.000 0.001 0.001Control mean 7.417 0.529 14.780 0.562 0.171 0.224
Panel B: Treatment Effect by Education
Fairs × High-school -0.0879* -0.0742** 4.197** -0.012 0.0576** 0.0482*(0.0484) (0.0335) (1.719) (0.0397) (0.0262) (0.0275)
Fairs × Post-secondary -0.036 0.001 1.251 0.006 -0.026 -0.008(0.0352) (0.0218) (1.335) (0.0313) (0.0234) (0.0236)
Observations 1,503 1,503 1,705 1,705 1,705 1,705R-squared 0.005 0.006 0.008 0.000 0.005 0.003Control mean: High-school 7.183 0.561 10.980 0.508 0.058 0.108Control mean: Post-secondary 7.522 0.514 16.550 0.587 0.223 0.277Test: High=Post (p) 0.268 0.051* 0.118 0.718 0.018** 0.116
Notes: Each row reports a separate regression. ‘Wage mismatch’ refers to the absolute difference between the
worker’s reservation wage (in logs) and the expected wage for a worker of that skill/education level (in logs).
For each regression, we report the estimated ITT from participating in the job fair (disaggregated, in Panel B,
by whether the worker has post-secondary education or merely high school). Standard errors are reported in
parentheses. In the bottom row, we report p-values for a test of the null hypothesis that the effect of treatment is
equal between high-school and post-secondary sub-samples.
36

Graphs
37
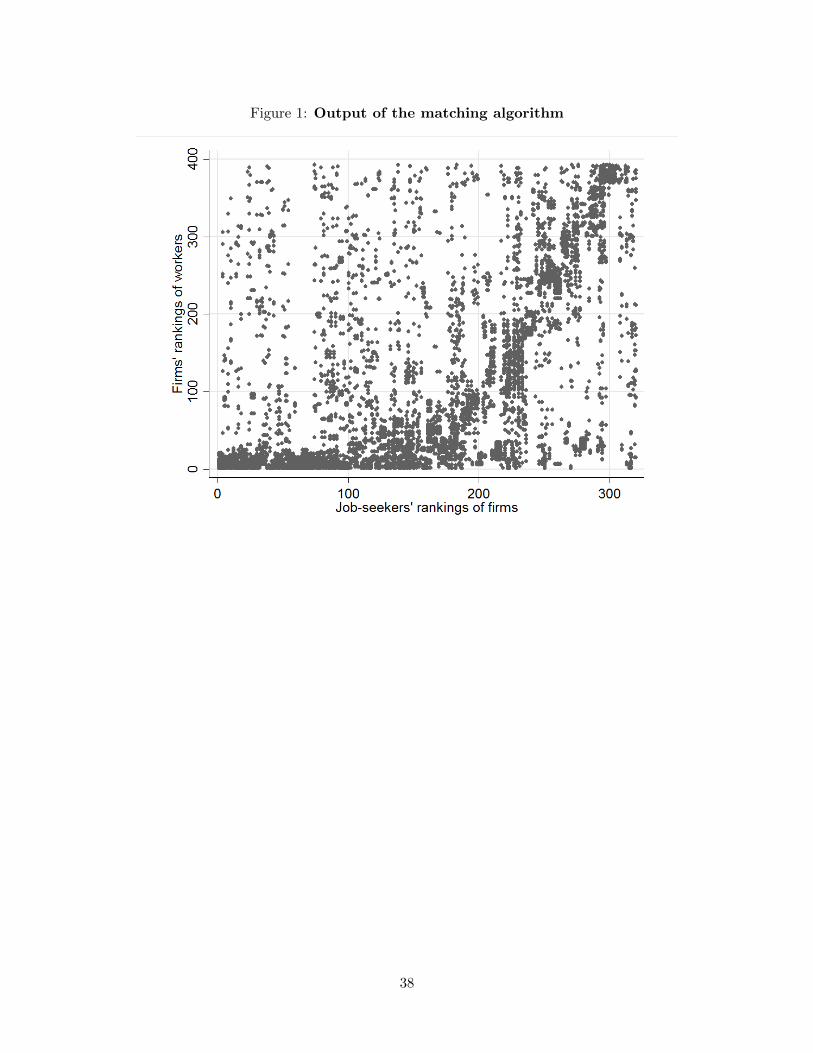
Figure 1: Output of the matching algorithm
38
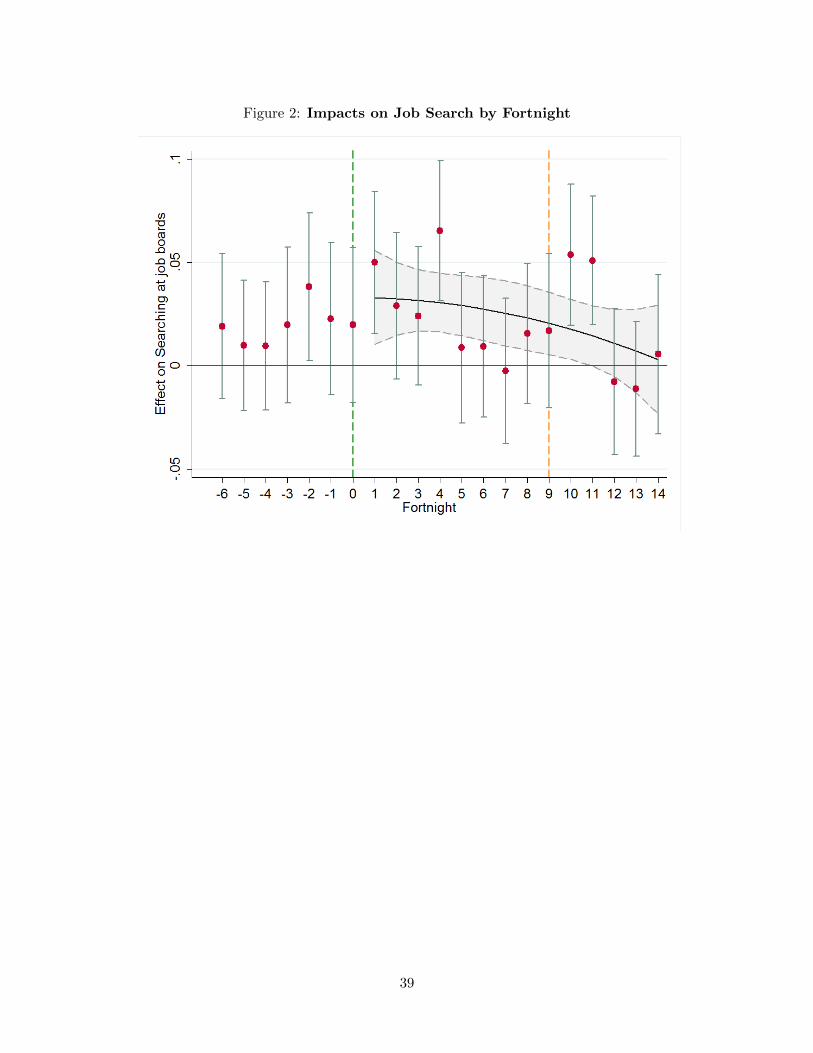
Figure 2: Impacts on Job Search by Fortnight
39

Online Appendix: AdditionalFigures and Tables
1
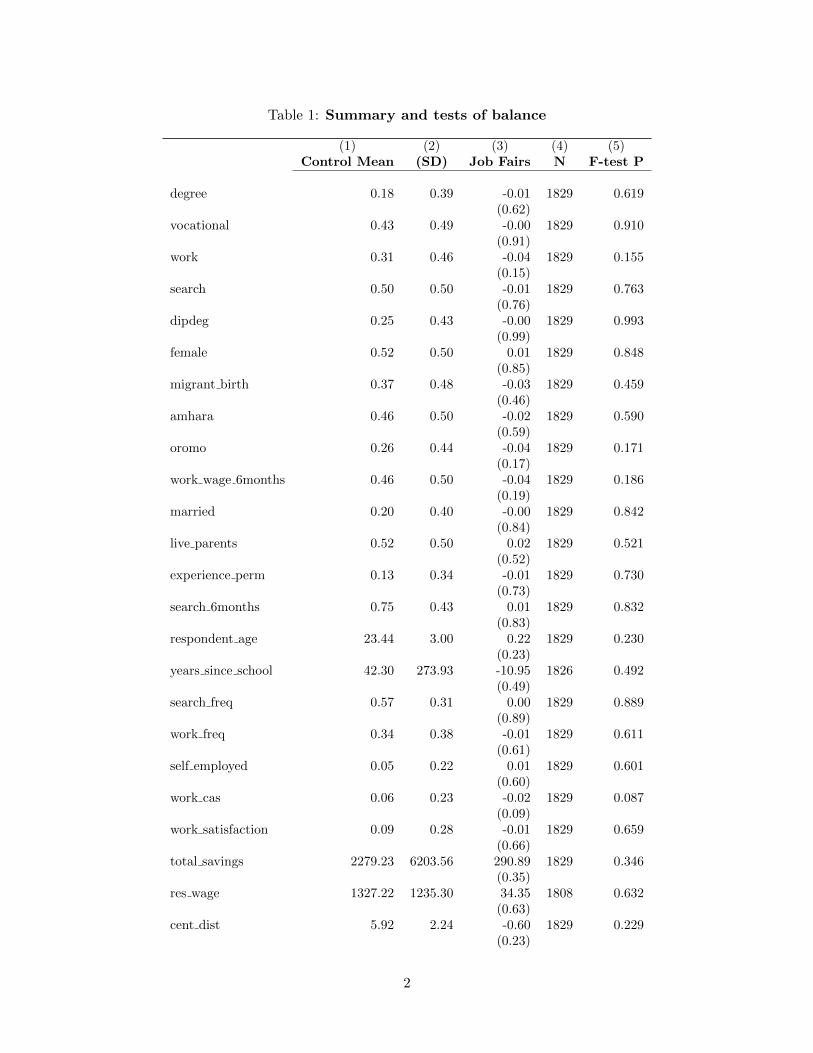
Table 1: Summary and tests of balance
(1) (2) (3) (4) (5)Control Mean (SD) Job Fairs N F-test P
degree 0.18 0.39 -0.01 1829 0.619(0.62)
vocational 0.43 0.49 -0.00 1829 0.910(0.91)
work 0.31 0.46 -0.04 1829 0.155(0.15)
search 0.50 0.50 -0.01 1829 0.763(0.76)
dipdeg 0.25 0.43 -0.00 1829 0.993(0.99)
female 0.52 0.50 0.01 1829 0.848(0.85)
migrant birth 0.37 0.48 -0.03 1829 0.459(0.46)
amhara 0.46 0.50 -0.02 1829 0.590(0.59)
oromo 0.26 0.44 -0.04 1829 0.171(0.17)
work wage 6months 0.46 0.50 -0.04 1829 0.186(0.19)
married 0.20 0.40 -0.00 1829 0.842(0.84)
live parents 0.52 0.50 0.02 1829 0.521(0.52)
experience perm 0.13 0.34 -0.01 1829 0.730(0.73)
search 6months 0.75 0.43 0.01 1829 0.832(0.83)
respondent age 23.44 3.00 0.22 1829 0.230(0.23)
years since school 42.30 273.93 -10.95 1826 0.492(0.49)
search freq 0.57 0.31 0.00 1829 0.889(0.89)
work freq 0.34 0.38 -0.01 1829 0.611(0.61)
self employed 0.05 0.22 0.01 1829 0.601(0.60)
work cas 0.06 0.23 -0.02 1829 0.087(0.09)
work satisfaction 0.09 0.28 -0.01 1829 0.659(0.66)
total savings 2279.23 6203.56 290.89 1829 0.346(0.35)
res wage 1327.22 1235.30 34.35 1808 0.632(0.63)
cent dist 5.92 2.24 -0.60 1829 0.229(0.23)
2
travel 1.83 2.03 0.21 1826 0.185(0.19)
written agreement 0.06 0.23 0.00 1829 0.810(0.81)
cv application 0.28 0.45 -0.00 1829 0.903(0.90)
expect offer 1.46 2.09 -0.21 1697 0.245(0.24)
aspiration 5583.33 5830.85 191.89 1694 0.636(0.64)
network size 6.74 9.63 0.89 1818 0.529(0.53)
respondent age 23.44 3.00 0.22 1829 0.230(0.23)
present bias 0.12 0.33 0.00 1252 0.889(0.89)
future bias 0.08 0.27 -0.02 1252 0.282(0.28)
life satisfaction 4.20 1.85 -0.08 1828 0.633(0.63)
3
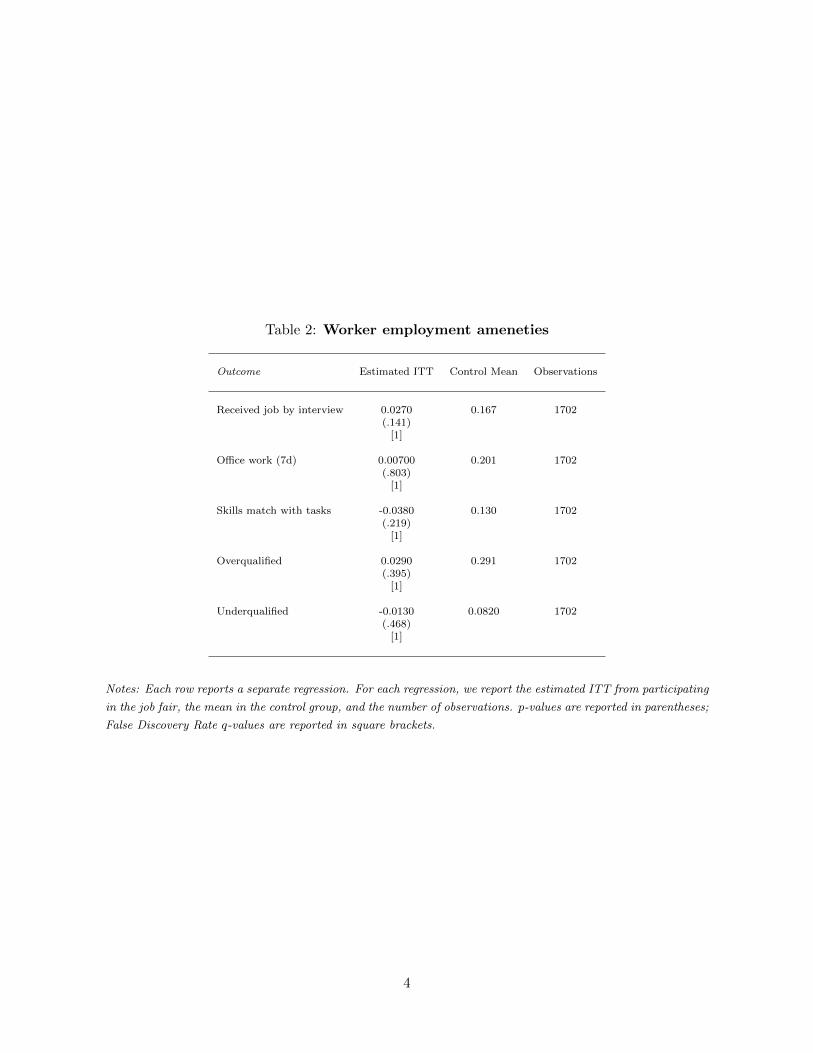
Table 2: Worker employment ameneties
Outcome Estimated ITT Control Mean Observations
Received job by interview 0.0270 0.167 1702(.141)
[1]
Office work (7d) 0.00700 0.201 1702(.803)
[1]
Skills match with tasks -0.0380 0.130 1702(.219)
[1]
Overqualified 0.0290 0.291 1702(.395)
[1]
Underqualified -0.0130 0.0820 1702(.468)
[1]
Notes: Each row reports a separate regression. For each regression, we report the estimated ITT from participating
in the job fair, the mean in the control group, and the number of observations. p-values are reported in parentheses;
False Discovery Rate q-values are reported in square brackets.
4
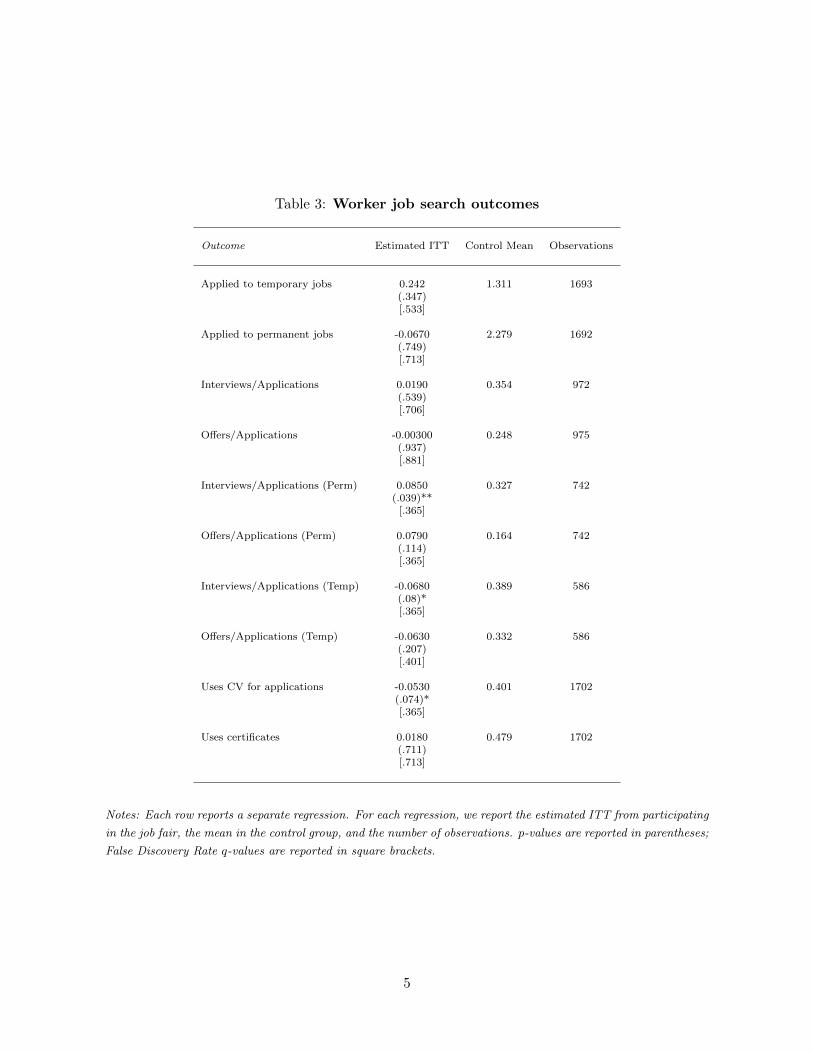
Table 3: Worker job search outcomes
Outcome Estimated ITT Control Mean Observations
Applied to temporary jobs 0.242 1.311 1693(.347)[.533]
Applied to permanent jobs -0.0670 2.279 1692(.749)[.713]
Interviews/Applications 0.0190 0.354 972(.539)[.706]
Offers/Applications -0.00300 0.248 975(.937)[.881]
Interviews/Applications (Perm) 0.0850 0.327 742(.039)**
[.365]
Offers/Applications (Perm) 0.0790 0.164 742(.114)[.365]
Interviews/Applications (Temp) -0.0680 0.389 586(.08)*[.365]
Offers/Applications (Temp) -0.0630 0.332 586(.207)[.401]
Uses CV for applications -0.0530 0.401 1702(.074)*[.365]
Uses certificates 0.0180 0.479 1702(.711)[.713]
Notes: Each row reports a separate regression. For each regression, we report the estimated ITT from participating
in the job fair, the mean in the control group, and the number of observations. p-values are reported in parentheses;
False Discovery Rate q-values are reported in square brackets.
5
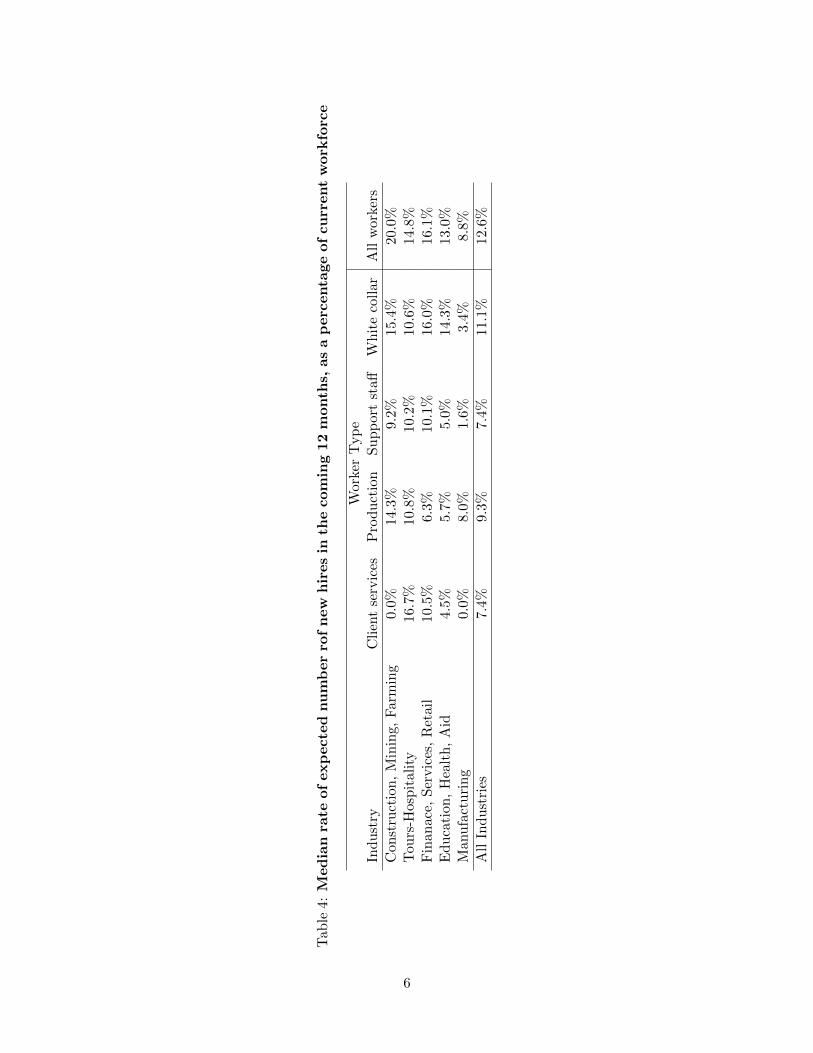
Tab
le4:
Med
ian
rate
of
exp
ecte
dnu
mb
er
rof
new
hir
es
inth
ecom
ing
12
month
s,as
ap
erc
enta
ge
of
cu
rrent
work
forc
e
Wor
ker
Typ
eIn
du
stry
Cli
ent
serv
ices
Pro
du
ctio
nS
upp
ort
staff
Wh
ite
coll
arA
llw
orke
rs
Con
stru
ctio
n,
Min
ing,
Far
min
g0.
0%14
.3%
9.2%
15.4
%20
.0%
Tou
rs-H
osp
ital
ity
16.7
%10
.8%
10.2
%10
.6%
14.8
%F
inan
ace
,S
ervic
es,
Ret
ail
10.5
%6.
3%10
.1%
16.0
%16
.1%
Ed
uca
tion
,H
ealt
h,
Aid
4.5%
5.7%
5.0%
14.3
%13
.0%
Manu
fact
uri
ng
0.0%
8.0%
1.6%
3.4%
8.8%
All
Ind
ust
ries
7.4%
9.3%
7.4%
11.1
%12
.6%
6
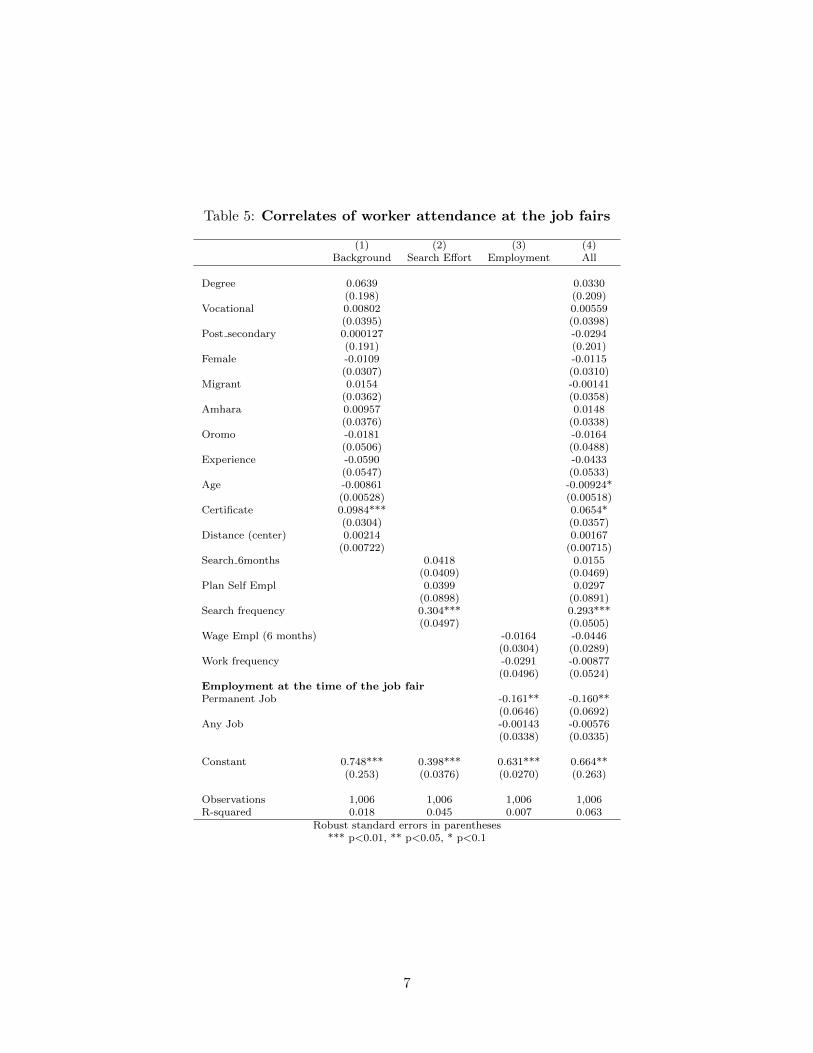
Table 5: Correlates of worker attendance at the job fairs
(1) (2) (3) (4)Background Search Effort Employment All
Degree 0.0639 0.0330(0.198) (0.209)
Vocational 0.00802 0.00559(0.0395) (0.0398)
Post secondary 0.000127 -0.0294(0.191) (0.201)
Female -0.0109 -0.0115(0.0307) (0.0310)
Migrant 0.0154 -0.00141(0.0362) (0.0358)
Amhara 0.00957 0.0148(0.0376) (0.0338)
Oromo -0.0181 -0.0164(0.0506) (0.0488)
Experience -0.0590 -0.0433(0.0547) (0.0533)
Age -0.00861 -0.00924*(0.00528) (0.00518)
Certificate 0.0984*** 0.0654*(0.0304) (0.0357)
Distance (center) 0.00214 0.00167(0.00722) (0.00715)
Search 6months 0.0418 0.0155(0.0409) (0.0469)
Plan Self Empl 0.0399 0.0297(0.0898) (0.0891)
Search frequency 0.304*** 0.293***(0.0497) (0.0505)
Wage Empl (6 months) -0.0164 -0.0446(0.0304) (0.0289)
Work frequency -0.0291 -0.00877(0.0496) (0.0524)
Employment at the time of the job fairPermanent Job -0.161** -0.160**
(0.0646) (0.0692)Any Job -0.00143 -0.00576
(0.0338) (0.0335)
Constant 0.748*** 0.398*** 0.631*** 0.664**(0.253) (0.0376) (0.0270) (0.263)
Observations 1,006 1,006 1,006 1,006R-squared 0.018 0.045 0.007 0.063
Robust standard errors in parentheses*** p<0.01, ** p<0.05, * p<0.1
7
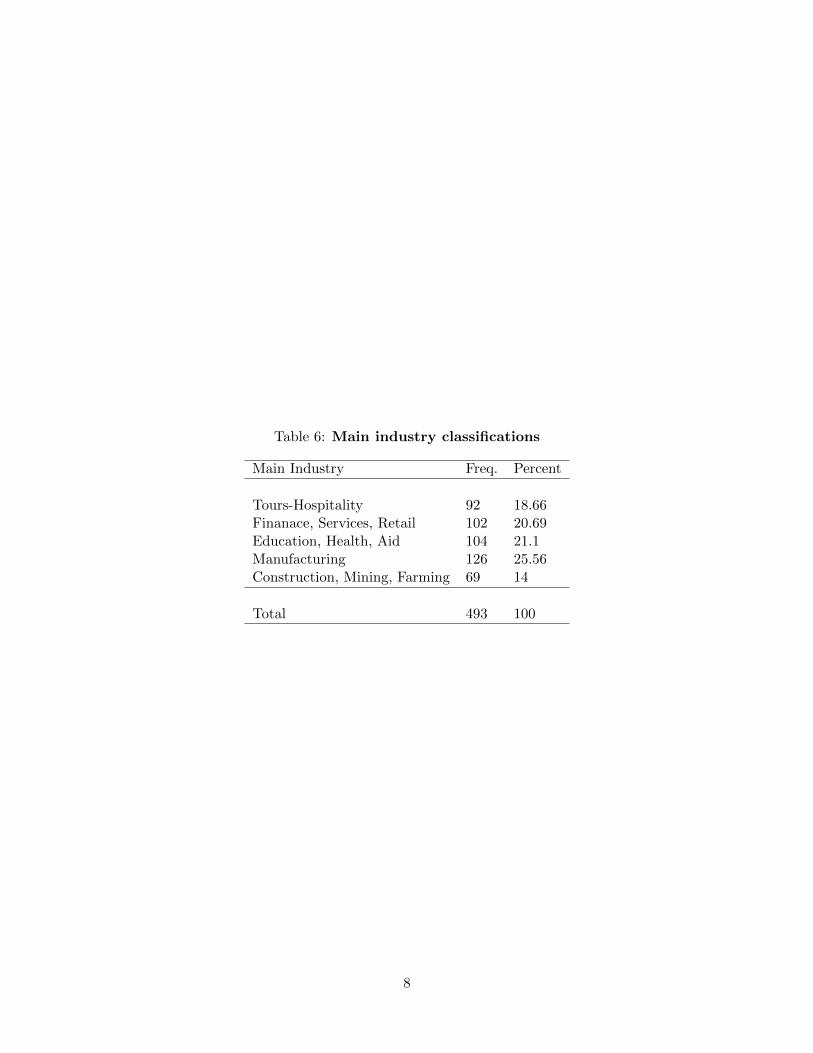
Table 6: Main industry classifications
Main Industry Freq. Percent
Tours-Hospitality 92 18.66Finanace, Services, Retail 102 20.69Education, Health, Aid 104 21.1Manufacturing 126 25.56Construction, Mining, Farming 69 14
Total 493 100
8
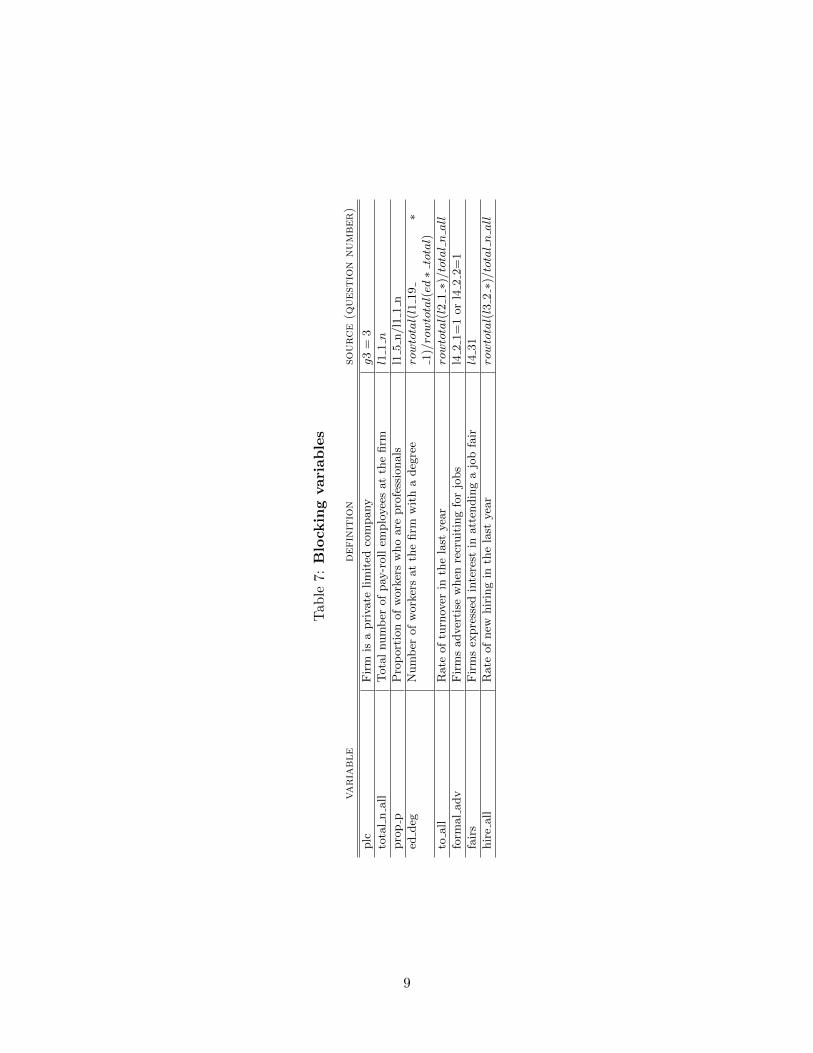
Tab
le7:
Blo
ckin
gvari
ab
les
variable
definition
source(q
uest
ionnumber)
plc
Fir
mis
apri
vate
lim
ited
com
pany
g3
=3
tota
ln
all
Tota
lnum
ber
of
pay
-roll
emplo
yee
sat
the
firm
l11n
pro
pp
Pro
port
ion
of
work
ers
who
are
pro
fess
ionals
l15
n/l1
1n
eddeg
Num
ber
of
work
ers
at
the
firm
wit
ha
deg
ree
rowtotal(l1
19
∗1)/rowtotal(ed
∗total)
toall
Rate
of
turn
over
inth
ela
styea
rrowtotal(l2
1∗)/totalnall
form
al
adv
Fir
ms
adver
tise
when
recr
uit
ing
for
jobs
l42
1=
1or
l42
2=
1
fair
sF
irm
sex
pre
ssed
inte
rest
inatt
endin
ga
job
fair
l431
hir
eall
Rate
of
new
hir
ing
inth
ela
styea
rrowtotal(l3
2∗)/totalnall
9
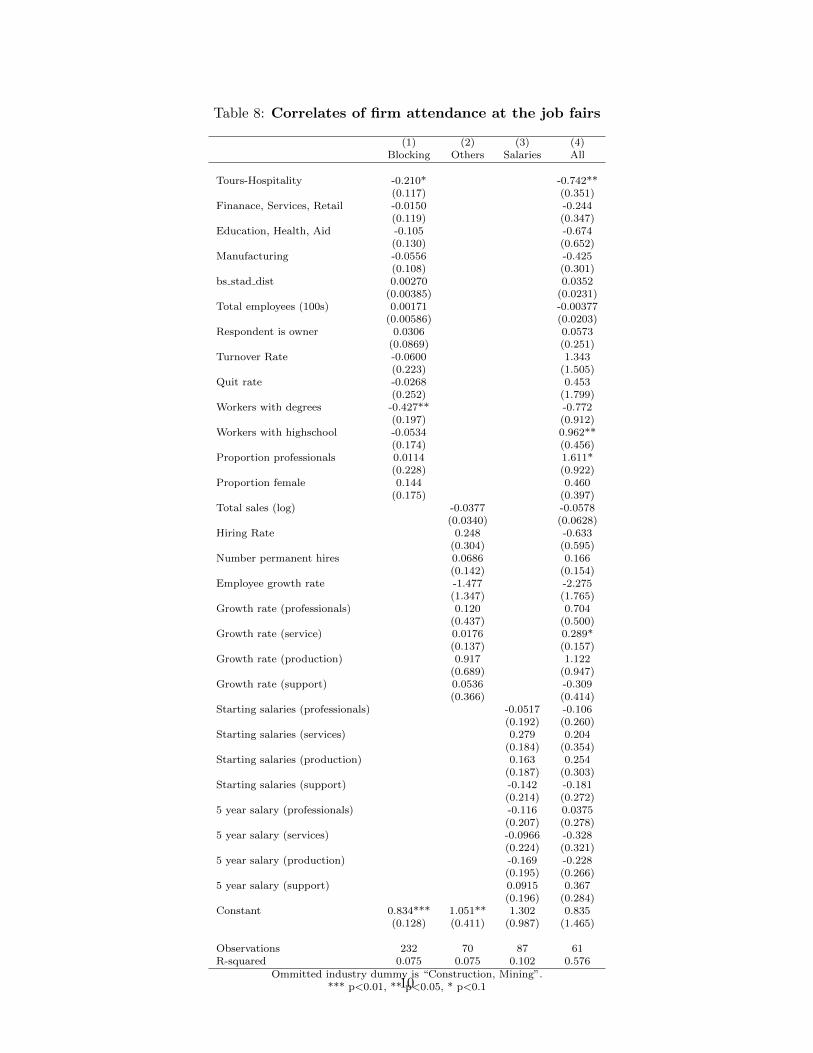
Table 8: Correlates of firm attendance at the job fairs
(1) (2) (3) (4)Blocking Others Salaries All
Tours-Hospitality -0.210* -0.742**(0.117) (0.351)
Finanace, Services, Retail -0.0150 -0.244(0.119) (0.347)
Education, Health, Aid -0.105 -0.674(0.130) (0.652)
Manufacturing -0.0556 -0.425(0.108) (0.301)
bs stad dist 0.00270 0.0352(0.00385) (0.0231)
Total employees (100s) 0.00171 -0.00377(0.00586) (0.0203)
Respondent is owner 0.0306 0.0573(0.0869) (0.251)
Turnover Rate -0.0600 1.343(0.223) (1.505)
Quit rate -0.0268 0.453(0.252) (1.799)
Workers with degrees -0.427** -0.772(0.197) (0.912)
Workers with highschool -0.0534 0.962**(0.174) (0.456)
Proportion professionals 0.0114 1.611*(0.228) (0.922)
Proportion female 0.144 0.460(0.175) (0.397)
Total sales (log) -0.0377 -0.0578(0.0340) (0.0628)
Hiring Rate 0.248 -0.633(0.304) (0.595)
Number permanent hires 0.0686 0.166(0.142) (0.154)
Employee growth rate -1.477 -2.275(1.347) (1.765)
Growth rate (professionals) 0.120 0.704(0.437) (0.500)
Growth rate (service) 0.0176 0.289*(0.137) (0.157)
Growth rate (production) 0.917 1.122(0.689) (0.947)
Growth rate (support) 0.0536 -0.309(0.366) (0.414)
Starting salaries (professionals) -0.0517 -0.106(0.192) (0.260)
Starting salaries (services) 0.279 0.204(0.184) (0.354)
Starting salaries (production) 0.163 0.254(0.187) (0.303)
Starting salaries (support) -0.142 -0.181(0.214) (0.272)
5 year salary (professionals) -0.116 0.0375(0.207) (0.278)
5 year salary (services) -0.0966 -0.328(0.224) (0.321)
5 year salary (production) -0.169 -0.228(0.195) (0.266)
5 year salary (support) 0.0915 0.367(0.196) (0.284)
Constant 0.834*** 1.051** 1.302 0.835(0.128) (0.411) (0.987) (1.465)
Observations 232 70 87 61R-squared 0.075 0.075 0.102 0.576
Ommitted industry dummy is “Construction, Mining”.*** p<0.01, ** p<0.05, * p<0.110
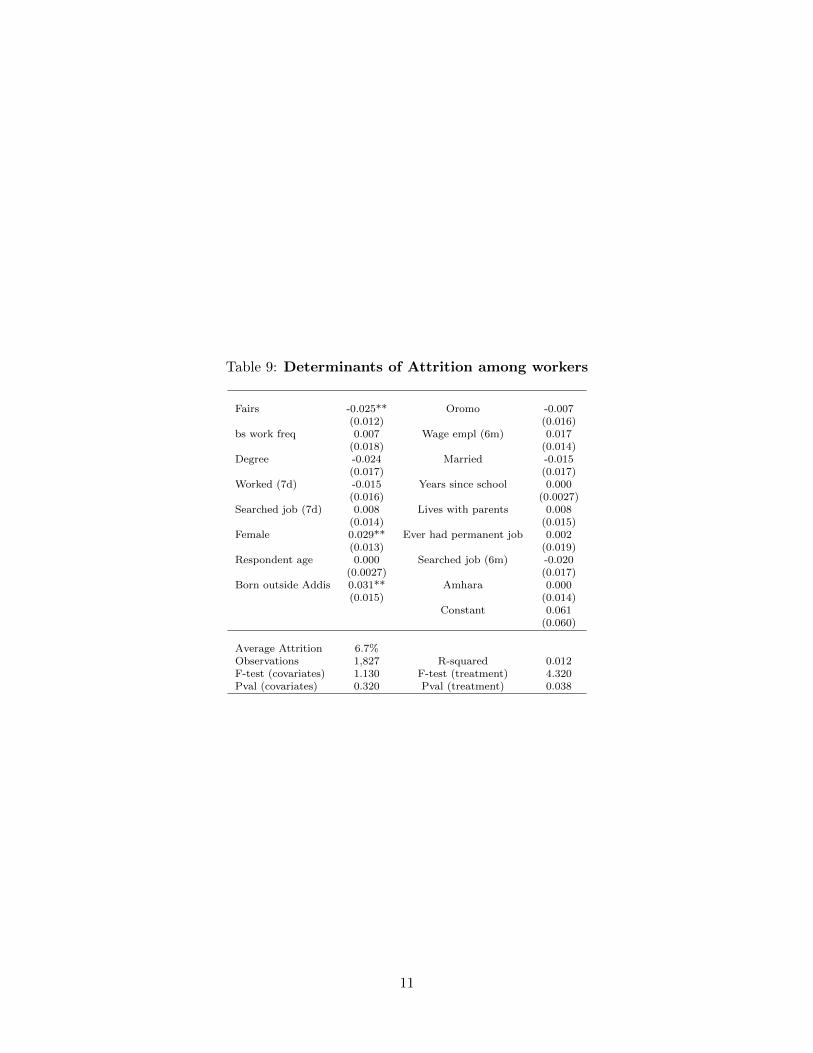
Table 9: Determinants of Attrition among workers
Fairs -0.025** Oromo -0.007(0.012) (0.016)
bs work freq 0.007 Wage empl (6m) 0.017(0.018) (0.014)
Degree -0.024 Married -0.015(0.017) (0.017)
Worked (7d) -0.015 Years since school 0.000(0.016) (0.0027)
Searched job (7d) 0.008 Lives with parents 0.008(0.014) (0.015)
Female 0.029** Ever had permanent job 0.002(0.013) (0.019)
Respondent age 0.000 Searched job (6m) -0.020(0.0027) (0.017)
Born outside Addis 0.031** Amhara 0.000(0.015) (0.014)
Constant 0.061(0.060)
Average Attrition 6.7%Observations 1,827 R-squared 0.012F-test (covariates) 1.130 F-test (treatment) 4.320Pval (covariates) 0.320 Pval (treatment) 0.038
11
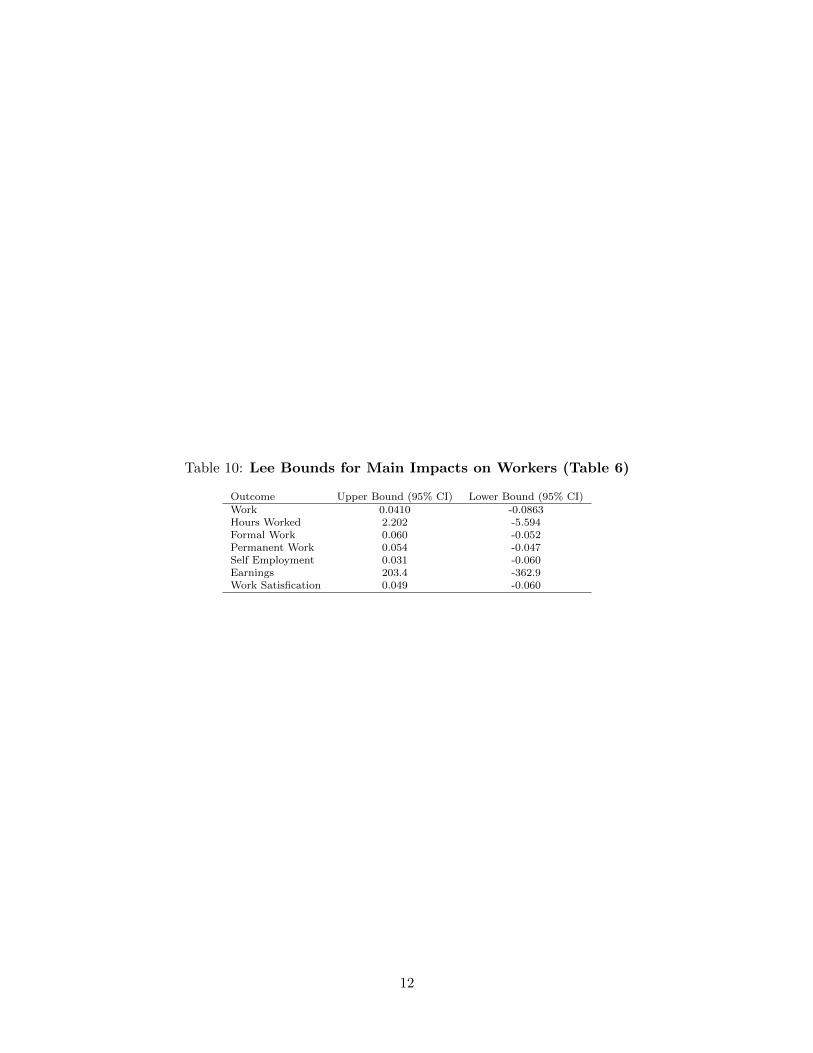
Table 10: Lee Bounds for Main Impacts on Workers (Table 6)
Outcome Upper Bound (95% CI) Lower Bound (95% CI)Work 0.0410 -0.0863Hours Worked 2.202 -5.594Formal Work 0.060 -0.052Permanent Work 0.054 -0.047Self Employment 0.031 -0.060Earnings 203.4 -362.9Work Satisfication 0.049 -0.060
12
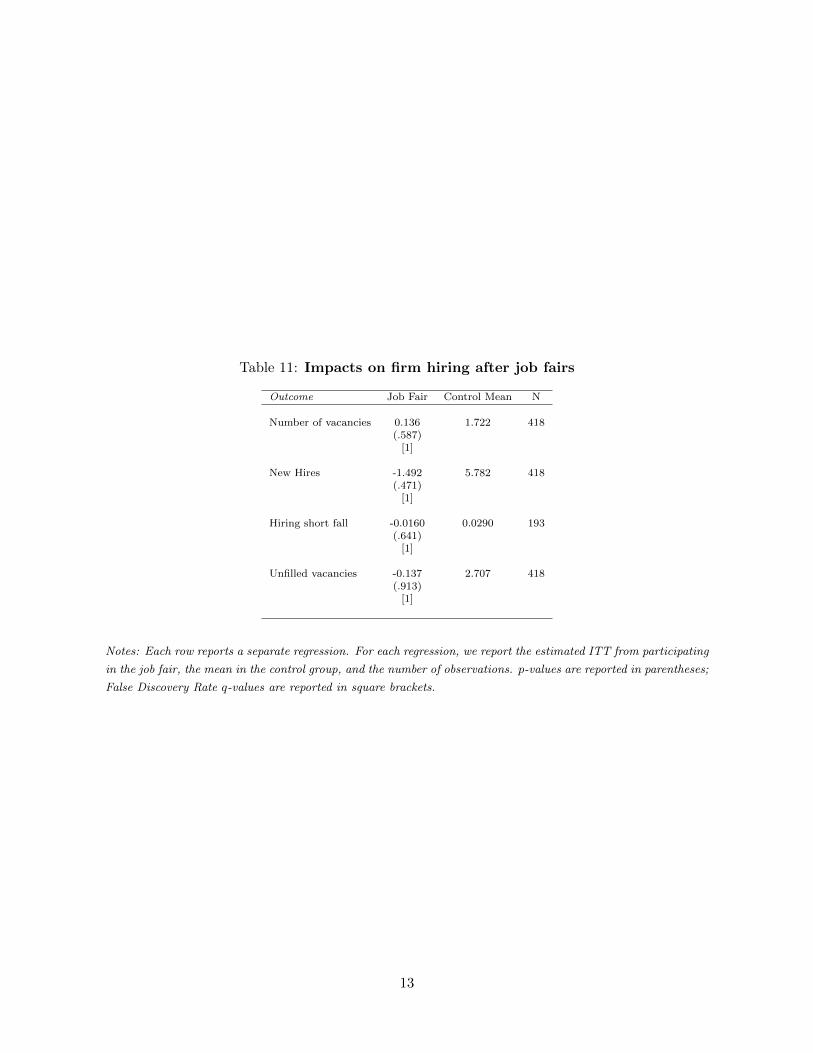
Table 11: Impacts on firm hiring after job fairs
Outcome Job Fair Control Mean N
Number of vacancies 0.136 1.722 418(.587)
[1]
New Hires -1.492 5.782 418(.471)
[1]
Hiring short fall -0.0160 0.0290 193(.641)
[1]
Unfilled vacancies -0.137 2.707 418(.913)
[1]
Notes: Each row reports a separate regression. For each regression, we report the estimated ITT from participating
in the job fair, the mean in the control group, and the number of observations. p-values are reported in parentheses;
False Discovery Rate q-values are reported in square brackets.
13
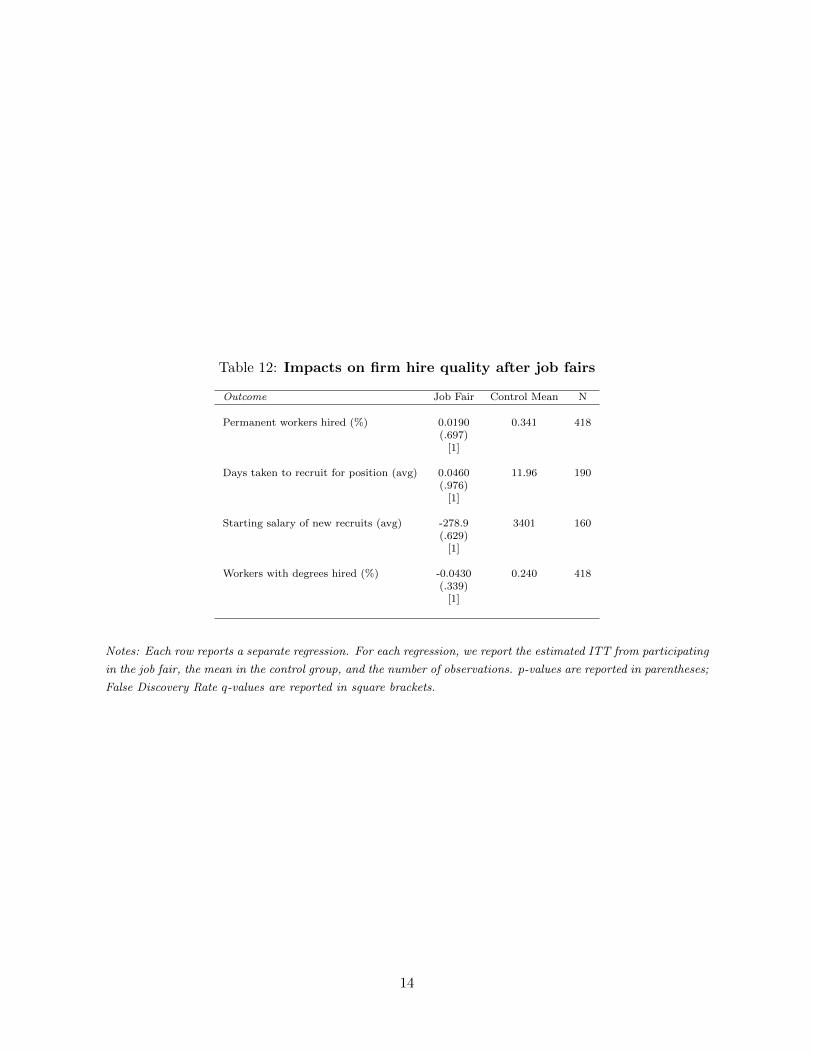
Table 12: Impacts on firm hire quality after job fairs
Outcome Job Fair Control Mean N
Permanent workers hired (%) 0.0190 0.341 418(.697)
[1]
Days taken to recruit for position (avg) 0.0460 11.96 190(.976)
[1]
Starting salary of new recruits (avg) -278.9 3401 160(.629)
[1]
Workers with degrees hired (%) -0.0430 0.240 418(.339)
[1]
Notes: Each row reports a separate regression. For each regression, we report the estimated ITT from participating
in the job fair, the mean in the control group, and the number of observations. p-values are reported in parentheses;
False Discovery Rate q-values are reported in square brackets.
14

Table 13: Impacts on firm turnover and employye growth
Outcome Job Fair Control Mean N
Firing rate (professionals) 0.00400 0.00600 458(.343)
[1]
Firing rate (non-professionals) 0.00300 0.0130 319(.535)
[1]
Quit rate (professionals) 0.00800 0.143 458(.685)
[1]
Quit rate (non-professionals) 0.0250 0.134 320(.49)[1]
Employee growth rate 0.0170 0.0140 472(.29)[1]
Employee growth rate (professionals) -0.0140 0.0310 467(.638)
[1]
Notes: Each row reports a separate regression. For each regression, we report the estimated ITT from participating
in the job fair, the mean in the control group, and the number of observations. p-values are reported in parentheses;
False Discovery Rate q-values are reported in square brackets.
15
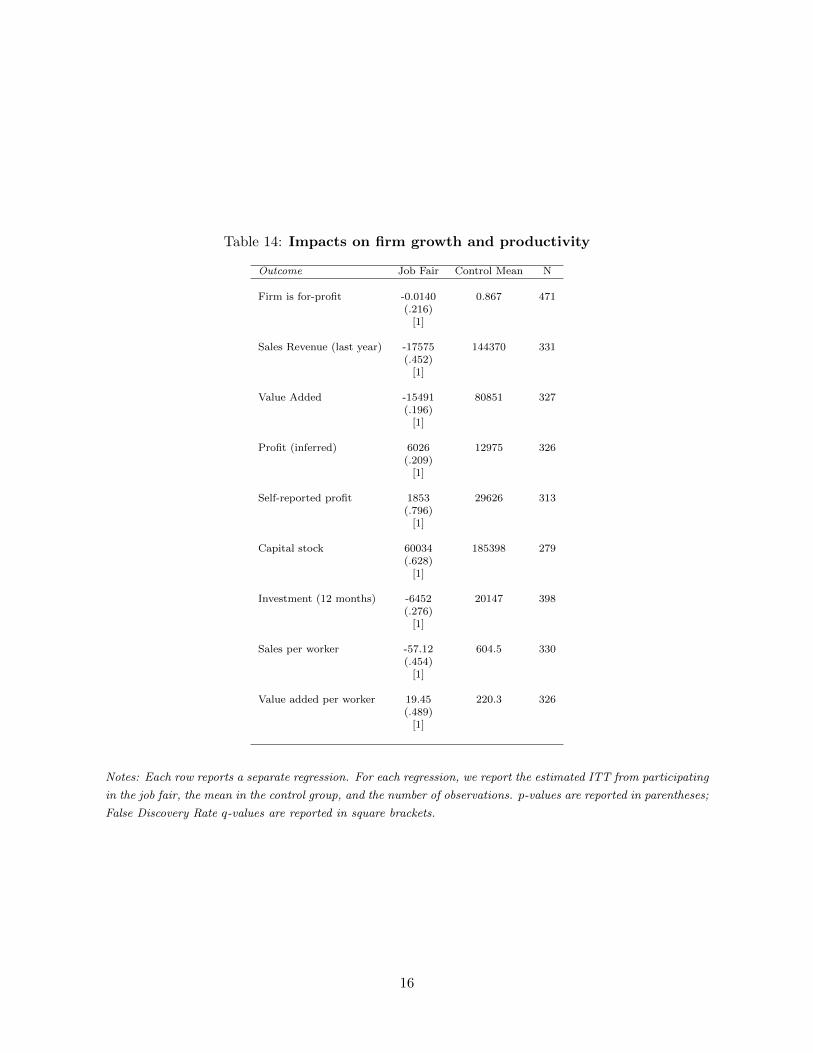
Table 14: Impacts on firm growth and productivity
Outcome Job Fair Control Mean N
Firm is for-profit -0.0140 0.867 471(.216)
[1]
Sales Revenue (last year) -17575 144370 331(.452)
[1]
Value Added -15491 80851 327(.196)
[1]
Profit (inferred) 6026 12975 326(.209)
[1]
Self-reported profit 1853 29626 313(.796)
[1]
Capital stock 60034 185398 279(.628)
[1]
Investment (12 months) -6452 20147 398(.276)
[1]
Sales per worker -57.12 604.5 330(.454)
[1]
Value added per worker 19.45 220.3 326(.489)
[1]
Notes: Each row reports a separate regression. For each regression, we report the estimated ITT from participating
in the job fair, the mean in the control group, and the number of observations. p-values are reported in parentheses;
False Discovery Rate q-values are reported in square brackets.
16
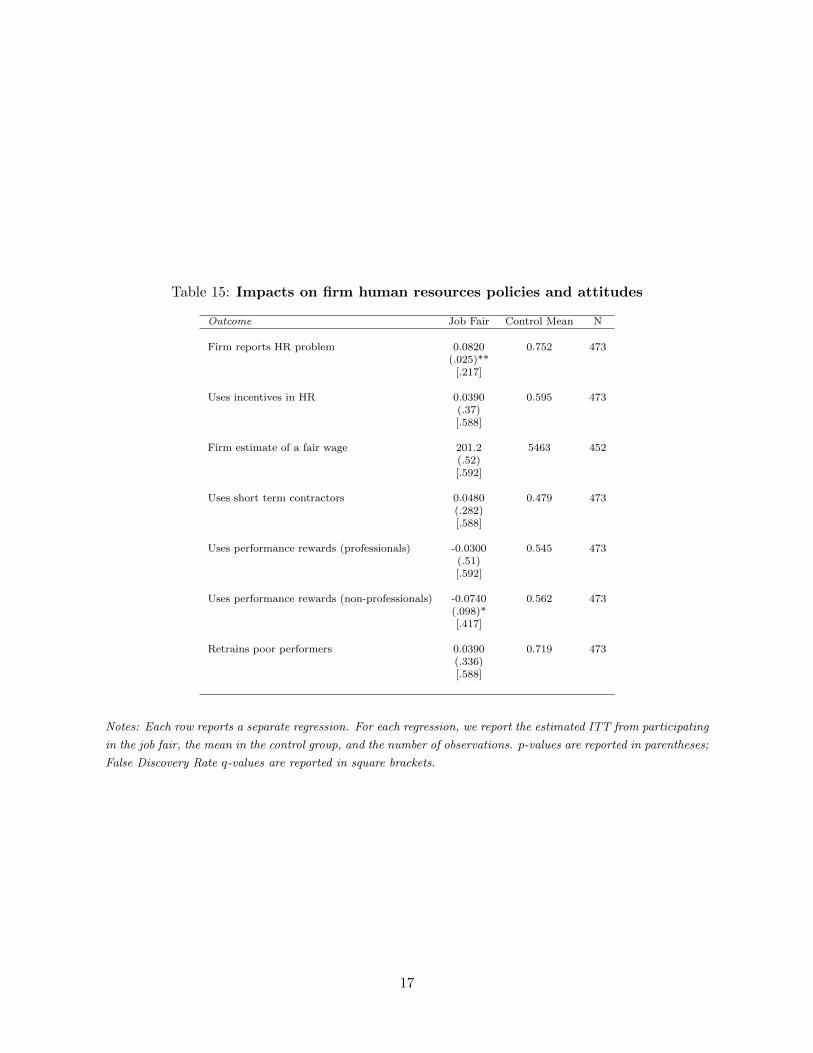
Table 15: Impacts on firm human resources policies and attitudes
Outcome Job Fair Control Mean N
Firm reports HR problem 0.0820 0.752 473(.025)**
[.217]
Uses incentives in HR 0.0390 0.595 473(.37)[.588]
Firm estimate of a fair wage 201.2 5463 452(.52)[.592]
Uses short term contractors 0.0480 0.479 473(.282)[.588]
Uses performance rewards (professionals) -0.0300 0.545 473(.51)[.592]
Uses performance rewards (non-professionals) -0.0740 0.562 473(.098)*[.417]
Retrains poor performers 0.0390 0.719 473(.336)[.588]
Notes: Each row reports a separate regression. For each regression, we report the estimated ITT from participating
in the job fair, the mean in the control group, and the number of observations. p-values are reported in parentheses;
False Discovery Rate q-values are reported in square brackets.
17
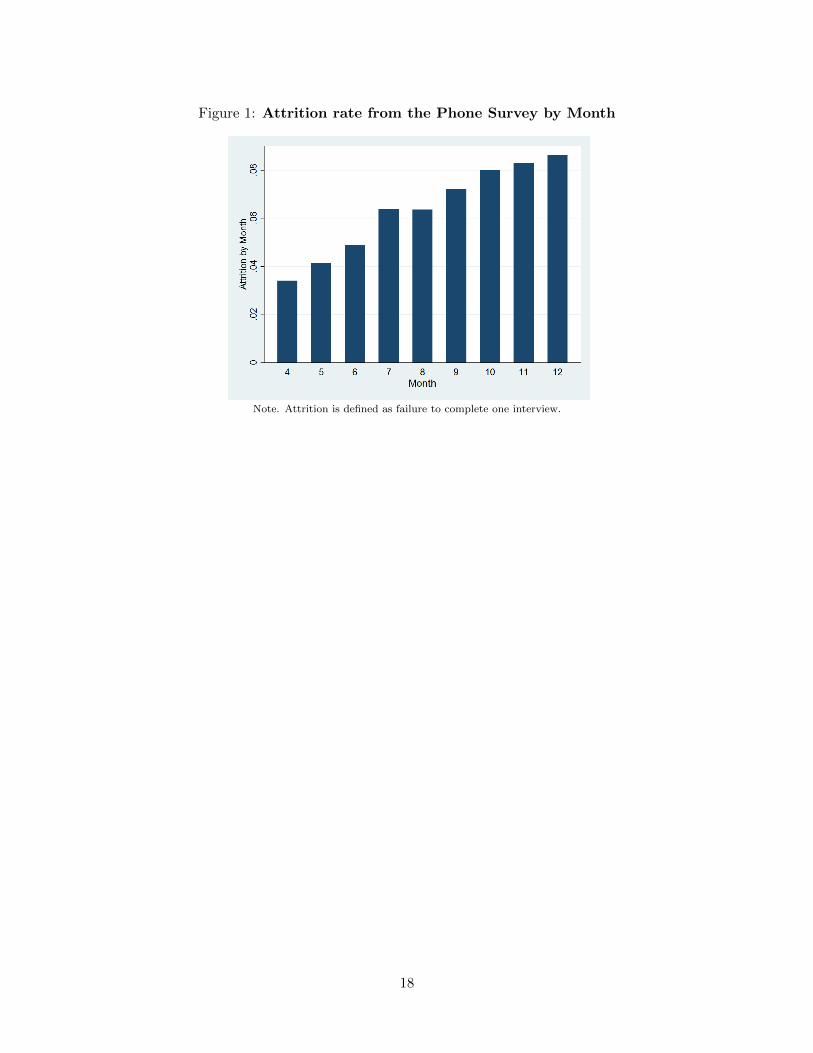
Figure 1: Attrition rate from the Phone Survey by Month
Note. Attrition is defined as failure to complete one interview.
18
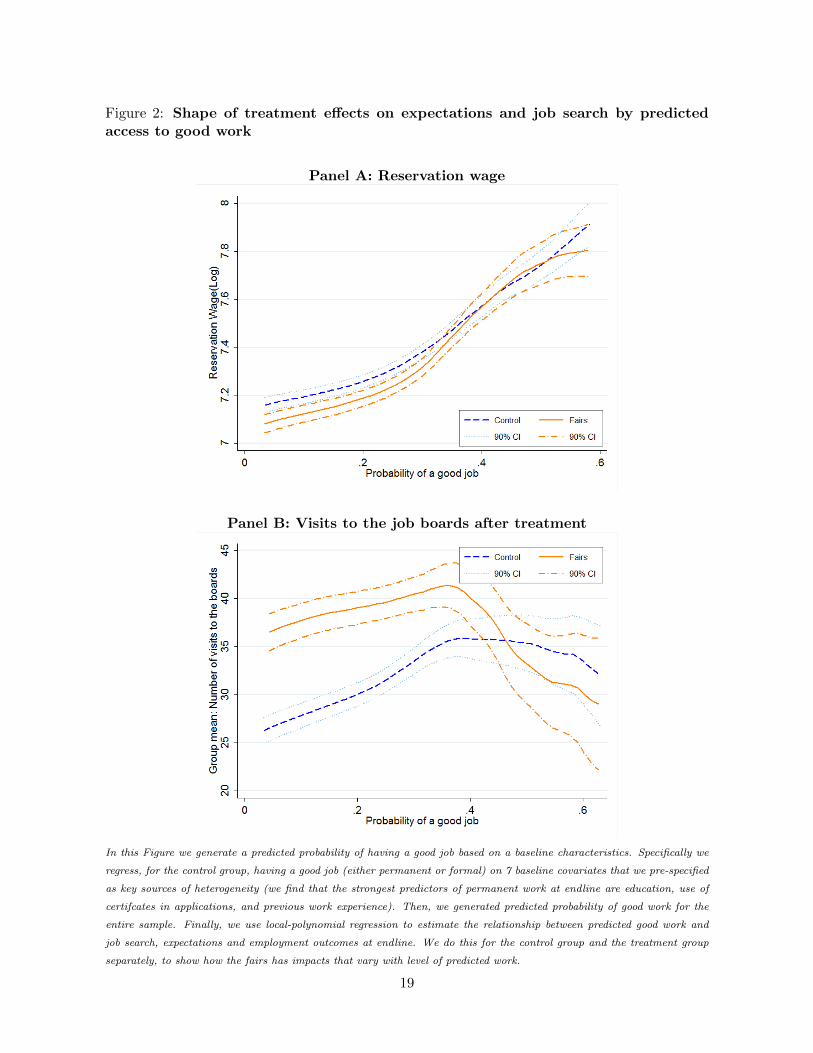
Figure 2: Shape of treatment effects on expectations and job search by predictedaccess to good work
Panel A: Reservation wage
Panel B: Visits to the job boards after treatment
In this Figure we generate a predicted probability of having a good job based on a baseline characteristics. Specifically we
regress, for the control group, having a good job (either permanent or formal) on 7 baseline covariates that we pre-specified
as key sources of heterogeneity (we find that the strongest predictors of permanent work at endline are education, use of
certifcates in applications, and previous work experience). Then, we generated predicted probability of good work for the
entire sample. Finally, we use local-polynomial regression to estimate the relationship between predicted good work and
job search, expectations and employment outcomes at endline. We do this for the control group and the treatment group
separately, to show how the fairs has impacts that vary with level of predicted work.
19
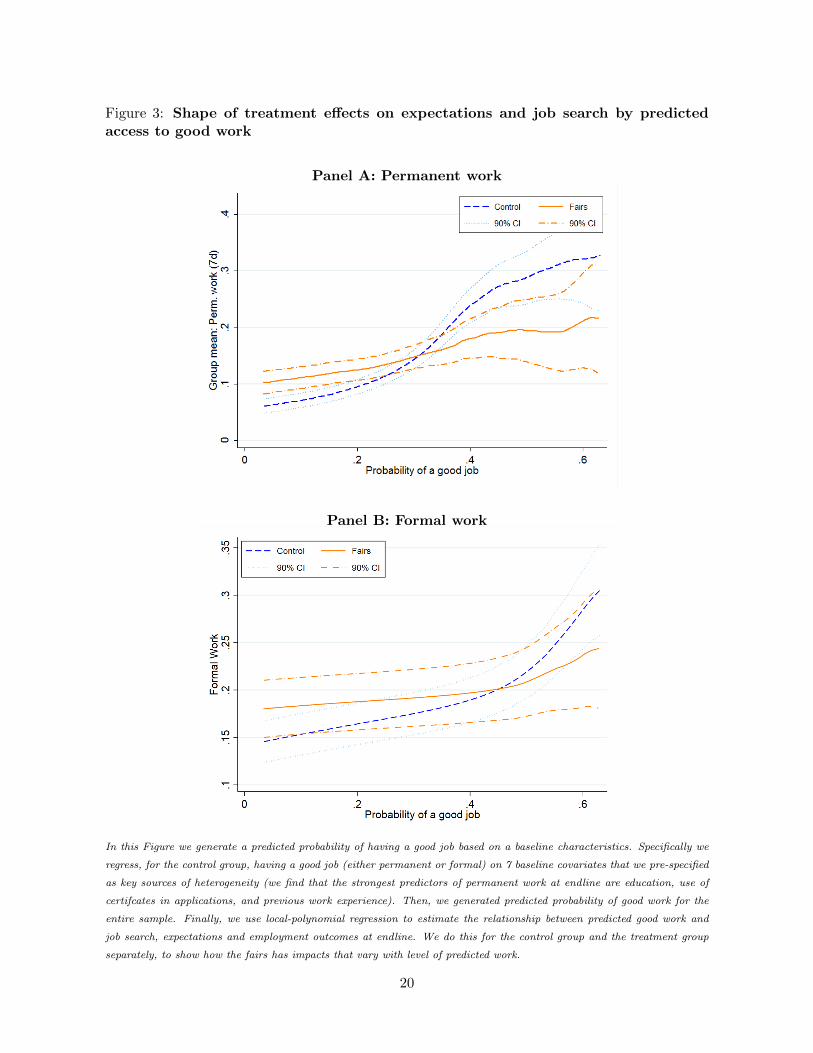
Figure 3: Shape of treatment effects on expectations and job search by predictedaccess to good work
Panel A: Permanent work
Panel B: Formal work
In this Figure we generate a predicted probability of having a good job based on a baseline characteristics. Specifically we
regress, for the control group, having a good job (either permanent or formal) on 7 baseline covariates that we pre-specified
as key sources of heterogeneity (we find that the strongest predictors of permanent work at endline are education, use of
certifcates in applications, and previous work experience). Then, we generated predicted probability of good work for the
entire sample. Finally, we use local-polynomial regression to estimate the relationship between predicted good work and
job search, expectations and employment outcomes at endline. We do this for the control group and the treatment group
separately, to show how the fairs has impacts that vary with level of predicted work.
20