Matching Collateral Supply and Financing Demands in · PDF file128 Matching Collateral Supply...
25
FRBNY Economic Policy Review / December 2014 127 • The 2008 failure and near-collapse of some of the largest dealer banks underscored the complexity and vulnerability of the industry. • A study of dealer banks finds that their unique sources of financing are highly efficient in normal times, but may be subject to marked and abrupt reductions in stressful times. • Dealer banks’ sources of financing include matched-book repos, internalization, and collateral received in connection with over- the-counter derivatives trading. • Under some conditions, U.S. accounting rules allow dealer banks to provide financing for more positions than are reflected on their bal- ance sheets. Rules that permit netting of certain collateralized transactions may not yield a true economic netting of dealer banks' exposures. • A prudent risk management framework should acknowledge the risks that inhere in collateralized finance. e authors thank Tobias Adrian, Darrell Duffie, Steven Spurry, and James Vickery for helpful comments. e views expressed in this article are those of the authors and do not necessarily reflect the position of the Federal Reserve Bank of New York or the Federal Reserve System. Adam Kirk is a risk analytics associate, James McAndrews an executive vice president and the director of research, Parinitha Sastry a former senior research associate, and Phillip Weed a risk analytics associate at the Federal Reserve Bank of New York. Correspondence: [email protected] Matching Collateral Supply and Financing Demands in Dealer Banks Adam Kirk, James McAndrews, Parinitha Sastry, and Phillip Weed 1. Introduction B anks are usually described as financial institutions that accept deposits of dispersed savers and use the deposited funds to make loans to businesses and households. is description is accurate but incomplete, as banks also engage in other types of intermediation that finance economic activity. Some banks act as dealers in markets, providing liquidity and supporting price discovery by buying and selling finan- cial instruments, helping to facilitate trade in markets. Banks also perform prime brokerage services—a role that involves providing financing to investors along with many ancillary services, such as collateral management, accounting, and analytical services. e banks that engage in these activi- ties, which we call dealer banks, facilitate the functioning of financial markets. To conduct their business, dealer banks rely on varied and, in some cases, unique sources of funding. In most cases, dealer banks’ lending is collateralized by securities or cash. As in a standard bank, funding for a loan made by the bank may come from the bank’s own equity or from external sources, that is, from parties that are not borrowers from the bank. Unlike a standard bank, however, dealer banks can employ internal sources to fund a customer loan, either by taking a trading position that offsets that of the customer receiving the
Transcript of Matching Collateral Supply and Financing Demands in · PDF file128 Matching Collateral Supply...

FRBNY Economic Policy Review / December 2014 127
• The 2008 failure and near-collapse of some of the largest dealer banks underscored the complexity and vulnerability of the industry.
• A study of dealer banks finds that their unique sources of financing are highly efficient in normal times, but may be subject to marked and abrupt reductions in stressful times.
• Dealer banks’ sources of financing include matched-book repos, internalization, and collateral received in connection with over-the-counter derivatives trading.
• Under some conditions, U.S. accounting rules allow dealer banks to provide financing for more positions than are reflected on their bal-ance sheets. Rules that permit netting of certain collateralized transactions may not yield a true economic netting of dealer banks' exposures.
• A prudent risk management framework should acknowledge the risks that inhere in collateralized finance.
The authors thank Tobias Adrian, Darrell Duffie, Steven Spurry, and James Vickery for helpful comments. The views expressed in this article are those of the authors and do not necessarily reflect the position of the Federal Reserve Bank of New York or the Federal Reserve System.
Adam Kirk is a risk analytics associate, James McAndrews an executive vice president and the director of research, Parinitha Sastry a former senior research associate, and Phillip Weed a risk analytics associate at the Federal Reserve Bank of New York.
Correspondence: [email protected]
Matching Collateral Supply and Financing Demands in Dealer Banks
Adam Kirk, James McAndrews, Parinitha Sastry, and Phillip Weed
1. Introduction
Banks are usually described as financial institutions that accept deposits of dispersed savers and use the deposited
funds to make loans to businesses and households. This description is accurate but incomplete, as banks also engage in other types of intermediation that finance economic activity. Some banks act as dealers in markets, providing liquidity and supporting price discovery by buying and selling finan-cial instruments, helping to facilitate trade in markets. Banks also perform prime brokerage services—a role that involves providing financing to investors along with many ancillary services, such as collateral management, accounting, and analytical services. The banks that engage in these activi-ties, which we call dealer banks, facilitate the functioning of financial markets.
To conduct their business, dealer banks rely on varied and, in some cases, unique sources of funding. In most cases, dealer banks’ lending is collateralized by securities or cash. As in a standard bank, funding for a loan made by the bank may come from the bank’s own equity or from external sources, that is, from parties that are not borrowers from the bank. Unlike a standard bank, however, dealer banks can employ internal sources to fund a customer loan, either by taking a trading position that offsets that of the customer receiving the

128 Matching Collateral Supply and Financing Demands
loan or by utilizing an offsetting position taken by another customer. For example, the bank may make a “margin loan” to one customer, lending cash to finance the customer’s security purchase, with the customer offering the purchased security as collateral for the bank loan. Another customer may request to borrow the same security to establish a short position, offering cash to the bank as collateral for the loan. The two customers’ pledges of collateral provide the bank with the resources to fulfill both customers’ demands for borrowing. That dealer banks can in some cases use the collateral pledged by one cus-tomer to lend to another, or to fund a trade made by the bank, confers a cost advantage since internal sources of funding are generally less expensive than external market sources. Dealer banks also maintain specialization in collateral valuation and management, which reinforces the aforementioned financing cost advantages. Consequently, such collateralized lending to investors is concentrated in dealer banks.
The interdependence of the financing for the borrowing of one customer and the collateral posted by another customer makes the sources of funding for dealer banks vulnerable in ways that are different from those of standard banks. Consider that in a standard bank, when a borrower repays a loan, the bank can often redeploy the repaid funds as a loan to another borrower or as payment to a deposit holder. In contrast, when a borrower repays the dealer bank, the borrower also reclaims the collateral it posted to the bank. If the dealer has repledged this collateral to finance another customer’s position, it must find a substitute for the reclaimed collateral returned to the borrower. In other words, the dealer must scramble to find an alternative source of the collateral in order to meet its obliga-tions. In times of financial market stress, external parties may be reluctant to lend to the dealer bank, even against collateral, so it can be costly and difficult for the bank to seek funding externally. This vulnerability of dealer banks, though similar to that faced by standard banks when depositors withdraw, differs in that it occurs instead when borrowers repay their loans, reflecting the profound interdependence between the bank’s customers, their borrowing, and their pledges of collat-eral. Of course, not all of the dealer bank’s funding is internally generated and so, like standard banks, dealer banks engage in maturity transformation and thus are also susceptible to rapid withdrawals of external sources of funding.
This article aims to provide a descriptive and analytical perspective on dealer banks and their sources of financing. In reviewing the methods by which dealer banks reuse collateral, we consider various concepts related to collateralized finance, many of which have been discussed in Duffie (2010, 2011), Stigum and Crescenzi (2007), and Committee on the Global Financial System (2013). We conclude that this type of financ-ing yields high levels of efficiency in normal times, but may be
subject to significant and abrupt reductions in stressful times, relative to the external financing sources upon which other banks rely. That conclusion raises many issues about how policy should address this type of financial sector vulnerabil-ity, which we briefly discuss. In addition, the limitations of existing sources of data on the extent of the use of collateral by dealer banks leads us to recommend more extensive reporting of dealer banking financing arrangements.
First, we create an analytical and stylized framework of dealer banks to outline their major collateralized finance activ-ities. Under certain circumstances, U.S. accounting rules allow the dealer to provide financing for more positions than are re-flected on its balance sheet. Dealer banks can take advantage of netting rules when calculating the size of their balance sheets. For example, under both U.S. and international accounting standards, the exposure of a dealer bank to a customer that has offsetting collateralized positions with the dealer bank can be reported as the net economic claim on the dealer bank by the customer. Consider the following (extreme) example. Suppose, as outlined above, Customer A borrows cash and provides a security as collateral to the dealer bank; suppose, further-more, that Customer B borrows the security and provides cash collateral to the dealer bank. The dealer bank uses the collateral provided by one customer to satisfy the borrowing demands of the other. Now suppose that, later, Customer B borrows cash and proffers a different security to the dealer bank as collateral, and Customer A borrows that security and supplies cash to the dealer bank as collateral. Then because each customer’s expo-sure may be eligible to be net on the balance sheet of the dealer, the dealer may be able to report assets and liabilities equal to $0, even though it had provided financing in substantial amounts to the two customers. Consequently, a dealer bank’s balance sheet captures only a portion of its gross provision of financing to customers.
As a result of this fact, we present both a stylized balance sheet and a stylized collateral record that together allow for a better representation of how dealers provide collateralized financing. We then apply this stylized framework to explain how dealer banks perform key intermediation functions and discuss the various methods by which dealer banks can reuse collateral provided by customers. We review three of them in detail: matched-book financing, internalization of collateral financing, and pledging of collateral received in over-the-counter (OTC) derivatives trading. The nature of these activ-ities allows dealer banks to derive efficiencies in their use of collateral and assist in the performance of financial markets.
We also use and apply data in firms’ public disclosures to our stylized framework, to the extent that dealer banks' activities are reflected in such disclosures, and attempt to measure the degree to which firms economize and optimize on

FRBNY Economic Policy Review / December 2014 129
their collateral resources. To determine how much financing a dealer bank provides to customers, one must examine the “collateral record” of a dealer bank, which can be found in its 10-K and 10-Q public disclosures. However, the nature of the reporting is not standardized across dealer banks; as a result, we are forced to restrict ourselves to a small number of banks. We choose to focus on Bank of America, Citigroup, Goldman Sachs, JP Morgan Chase, and Morgan Stanley—the bank hold-ing companies with the largest broker-dealer subsidiaries.1 As the largest dealer banks, their data capture the majority of such activity. We also include Lehman Brothers for its historical rel-evance to the crisis. These data allow us to provide a consistent aggregate view of the amount of collateral received, collateral pledged, and the size of the dealer banks' collateralized liabili-ties, for the very largest dealer banks. These data portray how these aggregate amounts have changed across time, especially during the period of the financial crisis and its aftermath.
In our review, we rely on two notions of efficiency em-ployed by dealer banks. First, we define “collateral efficiency” as the percentage of a dealer bank’s collateral received that is rehypothecated. This concept is one indicator that focuses on how extensively the dealer bank uses its customer-provided collateral resources. It is likely, and in our sample we verify, that this measure is increasing with the size of the dealer’s collateral pool, as a larger portfolio of collateral will contain securities that match more customer demands than would a smaller portfolio. Other factors that we conjecture would increase collateral efficiency include the number and mix of customers, the operational capacity of the dealer, and other economic features of the dealer firm, such as its creditworthiness, that make it a good counterparty.
The second concept of efficiency captured by dealer banks, “collateralized financing efficiency,” is a broad economy. Dealer banks seek to optimize their use of collateral to reduce their costs of serving customers’ demand for borrowing. This concept differs from the previous one in that collateralized financing efficiency refers to all the economic benefits reaped by dealer banks in their allocation of firm and customer collateral. By rehypothecating the collateral that secures dealer banks’ loans to customers, the dealer bank can pro-vide to customers lower-cost financing, or increase its own profit margins. This lower cost is a reflection of two potential
1 Broker-dealers are firms that participate in markets by buying and selling securities on behalf of themselves and their clients. They must register with the Securities and Exchange Commission (SEC), and are often a subsidiary of a larger bank holding company. Any securities purchased by the firm for its account can be sold to clients or other firms, or can become part of the firm’s own holdings. Our definition of dealer banks includes activities performed by broker-dealers, but also includes OTC derivative dealing activities, which are often conducted in the affiliated depository institution subsidiary of the parent holding company (rather than the broker-dealer subsidiary).
benefits captured in the collateralized financing arrangements in which dealer banks specialize. First, in a violation of the Miller-Modigliani theorem and framework, dealer banks can attract funding more cheaply by pledging collateral, rather than borrowing on an uncollateralized basis; a fortiori, the dealer bank can obtain funds for an even lower cost if those funds themselves are provided as collateral when a customer borrows a security held by the dealer bank.2 Second, by using collateral of one customer to satisfy the borrowing demand of another customer, the dealer can in certain instances min-imize the amount of economic and regulatory capital and liquidity needed to support its financing activities. In our re-view, we provide a measure of gross collateral received relative to assets recorded on the balance sheet, which can provide a gauge of the efficiency of collateralized finance provided by dealer banks. Those economies, which we will discuss in more detail below, also lead to a lower cost of provision of financing services by the dealer bank.
Additionally, like banks of all types, dealer banks engage in maturity and credit transformation; however, dealer banks also engage in the transformation of customer collateral. For example, a dealer bank can lend to a customer for a specific maturity, and then obtain funds by pledging the collateral pro-vided by the customer but at a shorter maturity; that sort of maturity transformation is just one way by which dealer banks provide additional value to customers. Various types of credit transformations are also made by dealer banks as they seek to satisfy the demands of different customers. This includes col-lateral substitution, in which the dealer bank effectively lends one type of security while the customer provides the dealer bank collateral of a different type.
To the extent that dealer banks capture efficiencies from collateralized finance, we would expect that they would dom-inate this form of finance as they could provide these services at lower cost than alternative approaches. It is important to keep in mind that notwithstanding the presence of collat-eralized financing efficiencies, the dealer bank is subject to significant risks that may offset the lower costs provided by this form of finance in normal times, in a full consideration of social costs and benefits.
In particular, the dependency of the funding available to dealer banks sourced from collateral provided by customers was clearly evident in the financial crisis of 2007-09. As we will see, the amount of funding available to dealer banks shrank
2 In the Miller-Modigliani framework, firms and households are risk-neutral and markets are complete, so borrowing on a collateralized or uncollater-alized basis is essentially equivalent, and would yield the same interest rate. However, in a framework in which information about the extent of borrowing by the firm is not known by the lender, lenders are risk-averse and markets are incomplete; collateralized borrowing rates may be below uncollateralized borrowing rates.

130 Matching Collateral Supply and Financing Demands
precipitously in the wake of the bankruptcy of Lehman Brothers Holdings International. Further, the gross amount of collat-eral received by the other dealer banks in our sample, and the amount that these dealer banks in turn pledged as collateral, fell even more precipitously, indicating that the collateral provided by customers, when used as a secondary source of funding by the bank itself, is subject to greater withdrawal than the net claims or obligations as reported on-balance-sheet.
A limitation of our analysis lies in the way that dealer banks report their activities in providing collateralized finance. Be-cause of the aforementioned interdependencies, dealer banks report their holdings and uses of collateral in ways that are open to alternative interpretations. As a result, it is not always clear how best to describe their balance sheet in a way that is consistent across firms. The reporting is heterogeneous and, consequently, not fully comparable across firms. This places severe limitations on the number of firms whose financing arrangements we review in this article.
Our study is organized as follows. Section 2 begins by defin-ing the businesses of dealer banks, and follows by constructing some stylized balance sheets that clearly depict the sources and uses of funding for the major dealer banks. In section 3, we describe the main types of dealer financing arrangements, including those that allow the banks to utilize internal sources of funding for their lending, using our stylized frameworks so that comparisons can be made across institutions. In section 4, we use the public disclosures to provide measures of the stylized balance sheets and collateral record we introduce in section 2 for the firms, measuring the relative importance and evolution of the sources of financing over time. Section 5 concludes.
2. An Overview of Dealer Banks
Dealer banks are active in the intermediation of many markets, either in their role as dealers or in their role as prime brokers where they provide financing to investors. Dealer banks are financial intermediaries that make markets for many securi-ties and derivatives by matching buyers and sellers, holding inventories, and buying and selling for their own account when buyers and sellers approach the dealer at different times, for different quantities, or are clustered on one side of the market. Many banks with securities dealer businesses also act in the primary market for securities as investment banks, underwrit-ing issues to sell later to investors. Services typically provided by dealers include buying and selling the same security simul-taneously, extending credit and lending securities in con-nection with transactions in securities, and offering account services associated with both cash and securities.
Many dealers carry out their activities in a broker-dealer subsidiary of a bank holding company. For most derivatives trades, dealers are one of the two counterparties, with many dealers recording their derivative exposures at their affiliated bank, the depository institution subsidiary of the parent com-pany. Prime brokers are the financing arm of the broker-dealer, offering advisory, clearing, custody, and secured financing services to their clients, which are often large active investors, especially hedge funds. Prime brokers can conduct a variety of transactions for their customers, including derivatives trading, cash management, margin lending, and other types of financ-ing transactions.
Dealer banks, like other for-profit businesses, strive to minimize the cost of providing financing to customers, which often need cash or particular securities. They can do this in part through a strategy of meeting their clients’ needs with-out relying wholly on costlier sources of external funding. Sometimes this is accomplished if the dealer bank itself has an offsetting position, or at other times another customer’s position. By fulfilling the collateral needs of one party (either in the form of cash or securities) with an already existing source of that collateral, the dealer bank can avoid additional financing transactions. This maximizes its income directly by eliminating a borrowing cost, as well as indirectly by minimiz-ing costs associated with larger balance-sheet sizes.
2.1 Stylized Framework for Dealer Banks
Our stylized framework consists of two components: a bal-ance sheet and a collateral record.3 While a complete represen-tation of a dealer bank’s financial reporting is out of the scope of this article, we describe conceptually how certain financing activities appear on the balance sheet and the collateral record. By examining both the balance sheet and the collateral record, we can, to some extent, trace how much the firm is relying on internal sources of collateralized financing, that is, financing provided either by the dealer’s own trading activity or by other customers’ activities, and how much is sourced externally.
In Table 1, we present a simplified (and reduced) version of the official balance sheets reported by our sample of dealer banks, focusing on the parts most oriented toward their dealer banking business. We intend to use this simplification of the
3 The collateral record can be thought of as analogous to a balance sheet, in that it records all sources and uses of collateral by the dealer bank. Like the balance sheet, it is an accounting concept, but it reflects underlying commitments made by the dealer bank. As such, it can also be thought of as a commitment schedule of the firm to receive/deliver collateral or cash from/to customers under specific conditions.

FRBNY Economic Policy Review / December 2014 131
balance sheet to illuminate those dealer-bank-specific and unique financing activities. Some categories are excluded because they are less relevant to the collateralized finance business unique to dealer banking, while others are grouped together because they are economically similar. This allows us to apply a single framework consistently across firms whose reporting disclosures are not always homogenous.
Assets are grouped into the categories outlined above and typically reflect a “use of ” or “claim to” cash.
• Cash will generally include the dealer’s own funds that are held in an account with a bank, such as a deposit with a bank within the same bank holding company, a Federal Reserve Bank, or a third-party bank. Cash will also include funds deposited with a bank that are fully segregated on behalf of a customer of the dealer.
• Financial instruments owned will reflect the fair value of risky positions owned by the bank, such as securities, phys-ical commodities, principal investments, and derivative contracts. In concept, the fair value reflects the cash that could be obtained upon sale of the instrument.
• Reverse repurchase agreements (reverse repo)/securities borrow-ing generally reflects a cash outlay and a receipt of a financial instrument as collateral, such as a security.4 The reverse repo is recorded on the balance sheet as the value of the cash outlay, not the collateral. These collateralized transactions are gov-erned by specific SIFMA5 forms. (For a more detailed discus-sion of these transactions, see Adrian et al. [2011].)
4 A repurchase agreement, or repo, is an agreement to sell a security with a commitment to repurchase it at a specified date in the future, usually the next day, for a stated price. The economic function of these agreements is essentially equivalent to a short-term secured loan, and usually the value of the securities purchased is greater than the cash outlay, with the difference referred to as a haircut. For more details, see Copeland, Martin, and Walker (2010). For the party on the opposite side of the transaction, the agreement is called a reverse repo. 5 Repurchase and reverse repurchase agreements are typically governed by a master repurchase agreement (MRA) or global master repurchase agreement (GMRA). Securities borrowing and securities lending are typically governed by a master securities lending agreement (MSLA).
• Brokerage receivables are economically similar to reverse repos/securities borrowing, but are generally related to other forms of collateralized lending, such as brokerage customer margin loans and collateral posted in connection with derivatives.
Liabilities and equity are grouped into the categories out-lined above and typically reflect a “source of ” or “obligation to return” cash.
• Equity reflects all balance-sheet equity accounts, such as earnings and stock issuance.
• Instruments sold but not yet owned reflect the dealer’s own short positions in a financial instrument, such as a security, physical commodity, or derivative contract.
• Repurchase agreements (repos)/securities lending generally reflects a cash receipt and a pledge of a financial instrument, such as a security. These are similar to the reverse repo/secu-rities borrowing transactions described above, but in these the dealer bank takes the opposing side of the trade.
• Brokerage payables are economically similar to repos/se-curities lending, but are generally related to other collater-alized borrowings, such as brokerage customer credit bal-ances and collateral received in connection with derivative transactions.
While the balance sheet represents an accurate snapshot of the net economic claims on and obligations of the dealer relative to those counterparties from an idealized simultane-ous settlement of all claims in default, it does not necessarily reveal an accurate view of the dealer bank’s actual collateral sources and uses in real time, nor of the total amount of financing that the dealer bank is providing to customers. In this way, the balance sheet and the collateral record offer al-ternative insights into the financing and funding conditions of the firms. Combining the information from the balance sheet and the collateral record allows us to glimpse some of the collateral efficiencies and “collateralized financing” efficiencies experienced by the dealer bank.
The collateral record is divided into two categories, total collateral received that can be repledged, and total collateral pledged (Table 2). The collateral record reflects sources and
Table 1 Stylized Balance Sheet
Assets Liabilities and Equity
Cash EquityInstruments owned Instruments sold but not yet ownedReverse repo/securities borrowing Repo/securities lendingBrokerage receivables Brokerage payables
Table 2 Stylized Collateral Record
Collateral Received Collateral Repledged
- -- -

132 Matching Collateral Supply and Financing Demands
uses of collateral broadly, including on a gross outstanding basis, and does not conform to specific guidance under U.S. generally accepted accounting principles (GAAP).
Dealer banks receive cash and securities as collateral in connection with reverse repos, securities borrowing, and brokerage receivables.
While these transactions may also be reflected on the stylized balance sheet, the reported numbers will differ from the collateral record for several reasons. First, the balance sheet does not fully reflect the use of collateral in the trans-action. For example, a dealer may extend a $100 margin loan to a brokerage customer to purchase a security, which will be recorded as a $100 brokerage receivable on our stylized balance sheet. In this case, the dealer may have received (and was permitted to repledge) $140 of the brokerage customer’s security. The collateral received can be delivered or repledged in connection with repos, securities lending, and brokerage payables. In this example, the dealer could repledge the $140 of the client’s securities in a repurchase agreement; the move-ment of the client’s securities would show up in the dealer’s collateral record, but the stylized balance sheet would only reflect the margin loan and repurchase agreement.
Crucially, U.S. GAAP allows for the netting of receivables (for example, reverse repo, securities borrowing, and broker-age receivables) and payables (for example, repo, securities lending, and brokerage payables) when:
a. The repurchase and reverse repurchase agreements are executed with the same counterparty.
b. The repurchase and reverse repurchase agreements have the same explicit settlement date specified at the inception of the agreement.
c. The repurchase and reverse repurchase agreements are exe-cuted in accordance with a master netting agreement (MNA).6
d. The securities underlying the repurchase and reverse re-purchase agreements exist in book-entry form and can be transferred only by means of entries in the records of the transfer system operator or securities custodian.
e. The repurchase and reverse repurchase agreements will be settled on a securities transfer system (for which specific operational conditions are described) and the enterprise must have associated banking arrangements in place (also described in detail). Cash settlements for securities trans-ferred are made under established banking arrangements that provide that the enterprise will need available cash on deposit only for any net amounts that are due at the end
6 A master netting agreement in effect allows all transactions covered by the MNA between the two parties to offset each other, aggregating all trades on both sides and then replacing them with a single net amount (International Swaps and Derivatives Association 2012).
of the business day. It must be probable that the associated banking arrangements will provide sufficient daylight over-draft or other intraday credit at the settlement date for each of the parties.
f. The enterprise intends to use the same account at the clearing bank or other financial institution at the settle-ment date in transacting both 1) the cash inflows resulting from the settlement of the reverse repurchase agreement and 2) the cash outflows in the settlement of the offsetting repurchase agreement.7
As a result, U.S. GAAP netting has the effect of reducing the size of the balance sheet relative to the collateral record.
3. Review of Select Activities at Dealer Banks
The following sections outline specific activities or transactions that dealer banks conduct in carrying out financial intermedi-ation, focusing on three in particular: matched-book dealing, internalization, and derivatives collateral. While not exhaustive, these activities are representative of the activities inherent in the dealer’s business model, which are accompanied by a unique set of risks that are not faced by standard banks.
3.1 Matched-Book Dealing
Dealer banks often refer to a balance sheet where repurchase agreements finance offsetting reverse repurchase agreements as a “matched book.” The dealer bank’s business model relies on optimizing its uses and sources of collateral. In essence, this means some clients demand cash and possess securities, while others demand securities and possess cash. In a typical matched-book transaction, a client provides a security as collateral in exchange for cash and grants the dealer the right to repledge this collateral. The dealer repledges this security to another client to source the cash. As a result, the dealer’s balance sheet does not reflect any security owned. This can be an efficient method to finance securities for customers if the dealer has better access to repo markets generally, and the dealer can earn a slight interest rate spread in the difference in the interest paid to lenders and the rate it charges its borrow-ers. This incremental spread is one form of the “collateralized financing” efficiency exploited by dealers.
7 Financial Accounting Standards Board Interpretation no. 41, “Offsetting of Amounts Related to Certain Repurchase and Reverse Repurchase Agree-ments” (FIN 41).

FRBNY Economic Policy Review / December 2014 133
Dealers can run a matched book using various types of transactions. For illustrative purposes, we focus on the sim-plest example, described above, of offsetting repos and reverse repos. Exhibit 1 presents a dealer that starts with no balance sheet, but is then approached by another broker-dealer, Cus-tomer A, which is looking for a $1,000 overnight cash loan and offers a $1,020 security as collateral. The dealer enters into a matched-book trade by simultaneously executing an overnight reverse repo with Customer A (Transaction 1) and an overnight repo with Customer B (Transaction 2), a mutual fund willing to invest its excess cash overnight.
The dealer’s balance sheet reflects a symmetrical increase in both a claim to $1,000 cash and an obligation to return $1,000 cash. Although the dealer acted as principal, the balance sheet reflects no position in Security Q. However, the collateral record shows that the dealer received and acquired the right to repledge or sell $1,020 of Security Q, of which it actually repledged $1,020.
If the dealer had been unable to use Customer A’s collateral to secure a loan from Customer B, it might have had to bor-row on an unsecured basis to source the cash or, alternatively, encumber some of the bank’s own collateral. As a result, the
transaction might have become uneconomical from the deal-er’s perspective. In this example, the dealer passed the haircut required by Customer B (approximately 2 percent) entirely on to Customer A. As a result, in the example the dealer reaps efficiencies to the extent that it can borrow from Customer B at a lower cost than it can lend to Customer A.
Furthermore, there are cases where the dealer bank exe-cutes matched-book transactions in a way that can provide it a net funding source. Consider a modification to our exam-ple, in which the dealer is able to demand a higher degree of overcollateralization on the reverse repo. Suppose the dealer required Customer A to deliver $1,060 worth of securities as collateral for the cash borrowed, and Customer B still required only $1,020 of the securities from the dealer in exchange for its cash. Here, the dealer retains an additional $40 of securities that it could potentially pledge to additional financing trans-actions. The dealer, in charging a higher haircut than the one it pays, generates an additional financial capacity as a result of its intermediation activities. In turn, these extra efficien-cies—we might call them a “collateral haircut margin”—allow the dealer to provide prime brokerage and lending services at lower costs. Whether the haircut margin reflects a transfer to
Stylized Dealer Balance Sheet
Category Beg. Balance Transaction 1 Transaction 2 End. Balance
Cash — (1,000) 1,000 —
Instruments owned — — — —
Reverse repo/securities borrowed — 1,000 — 1,000
Brokerage receivables — — — —
Total assets — 1,000
Repo/securities loaned — — 1,000 1,000Instruments sold, but not yet owned — — — —Brokerage payables — — — —Total liabilities — 1,000
Total equity — —
Exhibit 1 Matched-Book Dealing
Transaction 1: Customer A lends Dealer $1,020 in Security Q and receives $1,000 in cash. Transaction 2: Dealer lends Customer B $1,020 in Security Q and receives $1,000 in cash.
Stylized Collateral Record
TransactionCollateral Received
Collateral Repledged
Transaction 1 1,020Transaction 2 1,020
Customer A(Broker-Dealer)
$1,020 Security Q Customer B(Mutual Fund)Dealer
$1,000 Cash
$1,020 Security Q
$1,000 Cash

134 Matching Collateral Supply and Financing Demands
dealer banks, or whether competition among dealer banks for the profits provided by this haircut margin results in lower fi-nancing costs for customers—and therefore provides a benefit to society—depends on the level and nature of the competi-tion between dealer banks.
Maturity, Credit, and Collateral TransformationIn the original example, the final maturity of both transactions was the following day. However, a matched book does not always involve executing offsetting repurchase and reverse repurchase agreements that are “perfectly matched” in terms of the final maturity date or the credit quality of the involved counterparties. That is, dealer banks engage in maturity and credit transformation.
First, dealers can borrow cash through repo at shorter maturities than those at which they lend through reverse repo. Maturity mismatches expose the dealer to some interest rate risk, should short-term borrowing rates spike before maturity. In an extreme event, the dealer is exposed to “rollover risk,” in which it could prove difficult for the dealer to roll over its borrowings, while still being required to fund the lending on longer-term reverse repos.
Second, dealers can borrow from more creditworthy inves-tors and lend to less creditworthy borrowers, which introduces an element of credit risk, although this risk is mitigated by requiring collateral and charging haircuts accordingly. Gener-ally, these risks are common to most financial intermediaries, including traditional banks.
U.S. GAAP Netting and Collateral TransformationThe matched-book examples thus far have been presented as two transactions from the dealer’s perspective, each with a different counterparty. In practice, dealers will often have multiple transactions executed with a single counterparty. Un-der U.S. GAAP, repos and reverse repos can be reported on a net basis with a single counterparty if executed in accordance with a master netting arrangement and if the agreements have the same explicit settlement date, as well as some additional operational requirements.8
Importantly, offsetting repurchase agreements are not re-quired to be collateralized by the same securities to be eligible for U.S. GAAP netting. In essence, this means a dealer can deliver $100 cash in exchange for a U.S. Treasury security and, separately, borrow $100 cash and pledge a corporate
8 Refer to International Swaps and Derivatives Association (2012).
bond, and offset these two transactions on its balance sheet as long as the other required conditions are met. This form of collateral transformation presents the dealer with more op-portunities to optimize its sources and uses of collateral with clients without enlarging, or “grossing up,” its balance sheet. However, this also introduces an additional layer of complex-ity in analyzing the dealer’s collateral position, particularly in periods when market clearing conditions for different types of securities diverge.
3.2 Internalization of Trading Activities
Dealers achieve yet another source of collateralized financing efficiency by “internalizing” their trading activities, that is, by using offsetting trading positions between two clients or between clients and the dealer bank to “finance” each other. Similar to the concept of matched book, opportunities to “internalize” can arise via the provision of funds by the dealer bank collateralized by client securities. Those securities are then reused and delivered into another transaction as a means of financing the client position. Its name refers to the con-cept that the bank, in some cases, can source financing for a customer internally, without the need to attract additional funding from the external marketplace for funds.
Though internalization exhibits certain similarities with matched book as a financing mechanism, it differs in the degree of cost advantage, in its ability to minimize the size of the bal-ance sheet, and in its flexibility to generate financing for dealer bank trading positions. While these differences generally suggest that internalization is a low-cost and flexible form of financing for dealer banks, internalization is vulnerable to a unique set of risks, as it relies on the market positioning of customers. As conditions in markets change, owing to a significant price move, for example, either one side or the other might rapidly exit its financing position from the dealer, forcing the dealer to quickly replace securities or cash from external markets.
Exhibit 2 depicts one example of internalization, with the prime brokerage business of a dealer bank facilitating oppos-ing transactions for two separate hedge fund clients. In this example, the dealer bank lends to a hedge fund client on mar-gin and uses a portion of the securities purchased to fund the original margin loan (Transaction 1b). Internalization occurs when a separate client has sold short the same security, and therefore the collateral backing the margin loan is rehypothe-cated and delivered into the short position (Transaction 2b).
In this example, the dealer bank starts with a balance sheet of zero. Customer A deposits $500 of cash into its brokerage ac-count (Transaction 1a) and then borrows $500 from the dealer

FRBNY Economic Policy Review / December 2014 135
bank to acquire a $1,000 long position in Security Q (Transaction 1b), using $500 of the funds deposited in Transaction 1a to make the purchase. Customer A pledges the acquired securities as collateral for the loan. As Customer A purchases the securities on margin, the dealer gains rehy-pothecation rights over the collateral posted in the amount of 140 percent of the margin loan, which is $700 of Security Q in this example. The remaining $300 of Security Q is segregated and placed off the dealer’s books.
Separately, hedge fund Customer B, intending to open a short position in the same security, first deposits $350 of cash
into its brokerage account (Transaction 2a) and then borrows $700 of Security Q from the dealer bank (Transaction 2b), pledging and depositing a total of $1,050 with the dealer bank ($700 in cash collateral and the $350 in its brokerage account). Here we assume both clients hold margin accounts governed by Regulation T,9 which generally allows a client to borrow up to 50 percent of the value of a security pledged as collateral (in this case, $500 for Customer A) and requires clients to maintain
9 The Federal Reserve Board’s Regulation T relates to cash accounts held by customers and limits the amount of credit that dealers may extend to custom-ers for the purchase of securities.
Stylized Dealer Balance Sheet
CategoryBeg.
BalanceTransaction
1aTransaction
1bTransaction
2aTransaction
2bEnd.
Balance
Cash (including segregated lock-up)
— 500 (1,000) 350 700 550
Instruments owned
— — — — — —
Reverse repo/ securities borrowed
— — — — — —
Brokerage receivables
— — 500 — — 500
Total assets — 500 (500) 350 700 1,050
Repo/securities loaned
— — — — — —
Instruments sold, but not yet owned
— — — — — —
Brokerage payables
— 500 (500) 350 700 1,050
Total liabilities — 500 (500) 350 700 1,050
Total equity — —
Exhibit 2 Customer-to-Customer Internalization
Transaction 1a: Customer A deposits $500 in Cash into its brokerage account.Transaction 1b: Dealer lends Customer A $500 in Cash to purchase $1,000 of security Q, receiving $700 of rehypothecatable collateral.Transaction 2a: Customer B deposits $350 in Cash into its brokerage account.Transaction 2b: Customer B sells short $700 of security Q, posting the cash proceeds to the Dealer as collateral.End. Balances: Dealer holds the residual $550 of cash in a segregated lock-up account.
Stylized Collateral Record
TransactionCollateral Received
Collateral Repledged
Transaction 1b 700 —Transaction 2b — 700
Customer A(Hedge Fund)
$700 Security Q Customer B(Hedge Fund)
Dealer(Prime Broker)$500 Cash
$700 Security Q
$700 Cash

136 Matching Collateral Supply and Financing Demands
margin in the amount of 150 percent of the market value of open short positions (in this case, $1,050 for Customer B).
The dealer settles Customer B’s short sale by using the securities pledged by Customer A for its margin loan, effec-tively internalizing the two positions. The dealer’s ending balance sheet will reflect a segregated cash balance of $550, a brokerage receivable in the amount of the $500 margin loan to Customer A, and a brokerage payable to Customer B equiva-lent to $1,050.10
Differences between Internalization and Matched Book
This example highlights a key difference with matched-book financing—as the name implies, internalization eliminates the need for external sources of financing, and represents a form of both “collateral” and “collateralized financing” efficiency.
Absent the ability to internalize these positions, the dealer would need to engage in two additional external transactions to satisfy both clients’ positions. First, the margin loan would require financing, which the dealer bank would most likely obtain from the repo market. Second, the dealer bank would have to source the security to satisfy the client’s short posi-tion, likely through a securities borrowing transaction. Both of these external transactions would resemble our example of matched book, in that the dealer bank would seek to earn a small spread based on its superior access to repo and secu-rities borrowing markets. Instead, the dealer bank furnished its clients with a total of $1,200 in credit (the $500 margin loan and $700 short position), earning interest and fees on that level of credit, but has a balance sheet of only $1,050. Internalization allows the dealer to generate potential income from finding and matching, among its own customers, natural buyers and sellers of the same security. Importantly, inter-nalization also presents regulatory advantages from a capital and leverage perspective; eliminating the need to engage in external repo and securities borrowing transactions mini-mizes the size of the balance sheet and enables the dealer bank to increase other client activity.
A second substantive difference from matched book lies in the dealer bank’s ability to finance its own positions with
10 This amount is a function of both clients’ “net equity,” as per SEC rule 15c3-3, and is not accessible to the dealer as a source of funding for other activities. The “locked-up” amount reflects the difference between the value of collateral rehypothecated from Customer A’s margin account and the receivable from the margin loan ($700 - $500 = $200), plus the difference between Customer B’s credit balance (that is, the original cash deposit plus the proceeds from the short position) and the market value of the short position ($1,050 - $700 = $350). Therefore, the total locked-up cash balance is $200 + $350 = $550.
client activity. A dealer bank may be naturally long a security as a part of its market-making inventory, as a hedge, or as an investment. Under circumstances where a client sells short that same security, the dealer bank can deliver its own inven-tory into the short sale, or in other words internalize the two positions. Again, the dealer benefits significantly from this form of internalization as it earns a fee on the client’s short, and saves on the financing cost of its own inventory, although it does not achieve the same degree of balance-sheet reduction observed in the case of internalization between two clients.
Risks Associated with InternalizationThe internalization of client and firm trading activities affords the dealer bank distinctive cost and income advantages; how-ever, it engenders a unique set of risks.
Unlike the traditional banking model, a dealer bank’s client assets and liabilities tend to have an undefined set of matur-ities. The maturity of offsetting client positions is therefore difficult to predict precisely. Short-term imbalances in the du-ration of client or dealer positions that have been internalized against each other pose significant risks to the dealer. During a period of market or firm-specific stress in particular, a dealer may need to replace one side of an internalized transaction. For example, a client may liquidate its account by repaying its margin loan, resulting in a cash inflow to the dealer; however, the dealer may have already rehypothecated the underlying collateral for the margin loan to deliver into another client’s short sale. In this event, the dealer bank may need to source a hard-to-borrow security in an illiquid market in order to settle the sale of the margined long position. Similarly, a client may “buy back” a short position that was previously financ-ing another client’s long position, which may force the dealer to resort to the external market to seek additional funds in a potentially illiquid repo market. While these imbalances between long and short positions might resolve themselves over a period of time, they can be temporarily destabilizing, requiring the dealer bank to increase its balance sheet to finance positions externally or, if that were to prove difficult, to sell assets or close client positions quickly.
In a similar vein, dealers can look to any unused capacity to internalize trading positions when wholesale funding markets experience temporary dislocations. This residual capacity in certain cases could function as a buffer, allowing dealer banks to shift from external sources of financing to internal ones during a short-lived period of market stress. Importantly, however, the ability to internalize is likely correlated with the relative liquidity of a given position. In other words, the least liquid positions—those with the greatest probability of

FRBNY Economic Policy Review / December 2014 137
becoming unfundable during a period of stress—would have the fewest opportunities for internalization. Alternatively, more common securities, such as exchange-listed asset classes, would likely present more opportunities for internalization as they would be present in greater abundance, offering more opportunity for matching with other client positions. This in-ventory of client positions, then, allows the dealer bank to use internalization, where possible, as a potential cushion against the cost of finding more expensive funding or tapping into liquidity reserves to replace existing wholesale sources.
Internalization and Financial ReportingInternalization is an important source of financing for dealer banks. However, under current standards for financial re-porting, the degree to which dealer banks internalize trading activities or maintain available but untapped capacity to internalize positions is, at best, unclear. Since internalization results from the optimization of trading activities visible only through a dealer bank’s collateral record, it is neither directly nor quickly observable given current standards of public financial disclosure. The “leveraging effect” of client-to-client internalization largely occurs off-balance-sheet, with only an imperfect record appearing in the footnotes to the firms’ reported financial statements, where repledged collateral received from margin lending is aggregated with repledged collateral received through other secured transactions.
Moreover, U.S. GAAP accounting allows dealers to net long and short exposures within individual client margin accounts, which further augments the balance-sheet efficiency of inter-nalized transactions, but by extension increases the disparity between the gross positions financed and the net exposures reported on-balance-sheet.
3.3 Derivatives Collateral Received
The final category of dealer bank financing examined in this article is collateral received or posted in relation to secured derivatives transactions. These transactions generate or use cash through receiving or posting initial margin (IM) and variation margin (VM), which serve to offset the risks associated with current and potential future exposure, respec-ti vely.11 In principle, the collateral and collateralized financing
11 See Basel Committee on Banking Supervision and International Organiza-tion of Securities Commissions (2013, p.10). Here, exposure refers generally to the replacement cost should the derivative counterparty default. Current exposure (CE) is a function of the current mark-to-market value of the
efficiencies gained through derivatives transactions are similar to those arising from matched-book transactions or inter-nalization. That is, a dealer bank that has sold a derivative to a client can purchase an equal and opposite exposure from another dealer bank, using the collateral received from one transaction to satisfy the collateral requirement on the second, while capturing a small income spread.
Unlike other secured transactions addressed in this article, however, the derivatives transactions as defined here do not entail the exchange of cash for securities, but rather the post-ing or receipt of collateral to secure an economic claim. Deriv-atives are collateralized according to contractual terms stipu-lated in the Credit Support Annex (CSA) of an International Swaps and Derivatives Association (ISDA) master agreement, which establishes the types of acceptable collateral, among other rules. Cash tends to be favored in this context because it is operationally easier to exchange and attains a greater degree of balance-sheet efficiency through the cash collateral netting provisions granted under U.S. GAAP and IFRS.
Firms can offset their derivative assets against derivative liabilities when:
a. Each of two parties owes the other determinable amounts.
b. The reporting party has the right to set off the amount owed with the amount owed by the other party.
c. The reporting party intends to set off.
d. The right of setoff is enforceable at law.
Additionally, cash collateral received or paid in connection with a derivatives contract can be net against the fair value of the contract if executed under a master netting arrangement.12
Net Financing and EfficienciesAsymmetries in contractual terms covering the extent of collateralization may give rise to situations in which dealer banks receive more collateral than they post, generating net financing possibilities to the extent that this excess can be repledged.
transaction, whereas potential future exposure (PFE) reflects certain aspects of the contract itself (for example, revaluation/margining period) and the prospective volatility of the underlying instrument.12 “Without regard to the condition in paragraph 5(c), a reporting entity may offset fair value amounts recognized for derivative instruments and fair value amounts recognized for the right to reclaim cash collateral (a receivable) or the obligation to return cash collateral (a payable) arising from derivative instrument(s) recognized at fair value executed with the same counterparty under a master netting arrangement.” Financial Accounting Standards Board Interpretation no. 39, “Offsetting of Amounts Related to Certain Contracts” (FIN 39).
138 Matching Collateral Supply and Financing Demands
The size of this potential net financing pool is linked to a variety of factors specific to the dealer bank and the nature of the derivatives transactions. Much like other forms of secured financing, the dealer’s relative credit quality and market access will influence its ability to negotiate preferential margining terms. In general, the tendency to margin on a portfolio basis suggests that large active dealers would benefit from econo-mies of scale, minimizing their requirements to post collateral on interdealer transactions, while reinforcing their ability to command greater amounts from smaller or nondealer coun-terparts. Forthcoming rules governing the margining of OTC derivatives may limit this benefit by establishing minimum levels for the calculation of IM and VM; however, it is unlikely that the benefits of scale would be eliminated entirely.
Exhibit 3 uses our stylized framework to illustrate how matched collateralized derivatives transactions can both gen-erate net financing for a dealer and minimize leverage through balance-sheet netting provisions. In this example, the dealer engages in matched derivatives transactions, remaining mar-ket-risk-neutral, but establishing preferential terms for IM. At inception, the offsetting transactions are reflected in the dealer bank’s cash position, a brokerage receivable representing the IM paid on the hedging transaction, and a brokerage payable associated with the dealer’s obligation to return IM received from Customer A. Notably, we assume that the fair values of each transaction will be fully collateralized by cash VM such that they qualify for netting treatment, and therefore the con-tract exposures will not be reported on-balance-sheet.
Stylized Dealer Balance Sheet
Category Transaction 1 Transaction 2 Transaction 3 Transaction 4End.
Balance
Cash 1,000 (500) (100) 100 500
Instruments owned — — — — —Reverse repo/ securities borrowed
— — — — —
Brokerage receivables
— 500 — — 500
Total assets 1,000 — (100) 100 1,000
Repo/securities loaned
— — — — —
Instruments sold, but not yet owned
— — — — —
Brokerage payables 1,000 — — — 1,000
Total liabilities 1,000 — — — 1,000
Total equity — — (100) 100 —
Exhibit 3 Asymmetric Collateral Terms on Matched Derivatives
Transaction 1: Customer A purchases a Total Return Swap long position, for which Customer A pays $1,000 in initial margin (IM).Transaction 2: Dealer sells the same exposure to Customer B, another dealer, but is required to post only $500 in IM. Transaction 3: Customer A’s contract value appreciates $100, requiring the Dealer to post $100 in collateral to Customer A.Transaction 4: Dealer’s contract with Customer B depreciates, requiring Customer B to post $100 in collateral to the Dealer.
Stylized Collateral Record
TransactionCollateral Received
Collateral Repledged
Transaction 1 1,000 —Transaction 2 — 500Transaction 3 — 100Transaction 4 100 —
Customer A(Pension Fund)
Transaction 1$1,000 Cash
Customer B(Dealer)Dealer
Transaction 3$100 Cash
Transaction 2$500 Cash
Transaction 4$100 Cash

FRBNY Economic Policy Review / December 2014 139
Irrespective of market movements in the underlying po-sition, the dealer will retain the net funding gained through the receipt of IM. Furthermore, margin deposits tend to earn a short-duration money market yield, rendering this an inexpensive form of financing for dealer banks. Thus, because of the cash/collateral netting and portfolio margining imposed by the dealer bank, the dealer reaps collateralized financing efficiencies. The netting here is not bilateral customer-to-dealer netting, but netting by the dealer bank itself. “Rehypothe-cating” cash is effectively netting by the dealer of collateral received and collateral posted.
Potential RisksBalance-sheet and cost advantages aside, the stock of net col-lateral received by a dealer bank is exposed to certain vulner-abilities that call into question its overall durability as a means of financing, even under circumstances where the offsetting transactions are matched in terms of market risk and level of collateralization.
First, in a traditional sense, these transactions are subject to the same rollover risk considerations as other dealer financing arrangements. At the maturity of a swap transaction, unless the position is rolled over, the collateral received would need to be returned to the original client. If a dealer offsets a posi-tion with one of shorter duration, or if a dealer obtains some amount of net collateral received on transactions of matched duration, at maturity it faces a financing gap in the amount of the margin posted to the offsetting transaction.
Second, from the contractual perspective, transactions are often embedded with certain credit rating downgrade triggers requiring the posting of additional collateral or imposing more constraining restrictions on rights of rehypothecation. Other contractual risks exist as well, such as the potential for a client to replace existing collateral posted with a currency or security that cannot readily be reposted to a matched deriva-tive position, however, this risk would only be present to the extent that the dealer bank takes a sort of contractual basis risk by accepting divergent collateral types on matched trades.
Finally, dealer banks may be beholden to reputational considerations in periods of stress. While they may have contractual rights over the use of client collateral, they may nevertheless honor client requests to segregate collateral or close out trades preemptively in the spirit of preserving their franchise. It is this element of uncertainty and contingent risk that undermines the durability of net collateral received in relation to derivatives as a source of dealer financing.
4. Data
Five bank holding companies—Bank of America, Citigroup, Goldman Sachs, J.P. Morgan Chase, and Morgan Stanley—represent more than 95 percent of the domestic banking industry’s net current credit exposure for over-the-counter derivatives, which totaled $673 billion in 2013:Q1 (Table 3). These five banks are the major derivatives dealers, so we focus on these companies. We also include Lehman Brothers for its relevance to the crisis. By including these firms, we can
Table 3 Net Current Credit Exposure of OTC Derivatives March 31, 2013
Rank Holding Company
Total OTC Derivatives
(Billions of Dollars)
1 Goldman Sachs Group, Inc., The 152,6792 JPMorgan Chase & Co. 144,490 3 Bank of America Corporation 110,506 4 Morgan Stanley 103,813 5 Citigroup Inc. 93,8166 Wells Fargo & Company 15,015 7 HSBC North America Holdings Inc. 12,2388 Bank of New York Mellon Corporation, The 12,0219 State Street Corporation 6,802 10 PNC Financial Services Group, Inc., The 3,547 11 Suntrust Banks, Inc. 2,521 12 Fifth Third Bancorp 1,663 13 Capital One Financial Corporation 1,417 14 TD Bank US Holding Company 1,385 15 Northern Trust Corporation 1,154 16 KeyCorp 1,067 17 Unionbancal Corporation 1,036 18 RBS Citizens Financial Group, Inc. 951 19 Deutsche Bank Trust Corporation 834 20 Regions Financial Corporation 732 21 Ally Financial Inc. 66122 BB&T Corporation 57923 BancWest Corporation 456 24 M&T Bank Corporation 450 25 BBVA USA Bancshares, Inc. 426
Total for industry 673,018
Sources: OCC; FR Y-9C, Schedule HC-L.
Note: Total OTC Derivatives is the sum of all net current credit exposures (Line 15(a)).

140 Matching Collateral Supply and Financing Demands
examine the importance of the unique forms of financing we outline as well as how variable they were through the crisis.
To begin to gauge the size and importance of different funding sources for dealer banks, we show in Chart 1 the se-lect liabilities of our candidate firms as of December 31, 2012, excluding unsecured borrowings and deposits in accordance with our stylized balance sheet.13 Each of the five firms whose liabilities we display is a bank holding company (BHC) that performs the more standard banking activities of deposit tak-ing and lending to households and commercial firms, as well as the activities we group and display under dealer banks.
With the exception of dealing in OTC derivatives, most of the dealer bank activities are concentrated in the broker-dealer subsidiaries of the BHCs. Goldman Sachs and Morgan Stanley were “stand-alone” investment banks in 2008 prior to their con-version to BHCs in September 2008, so their businesses remain more concentrated in dealer banking and prime brokerage than those of Bank of America, J.P. Morgan Chase, and Citigroup, reflected by the high portion of their total liabilities repre-sented by select dealer banking funding sources. Merrill Lynch, a subsidiary of Bank of America, filed its 10-Q and 10-K reports separately from Bank of America up until 2013:Q1. Conse-
13 Recall that Lehman Brothers Holdings International filed for bankruptcy on September 15, 2008, so that firm is not shown in the chart.
quently, Citigroup and J.P. Morgan Chase have a much larger proportion of deposits as a share of their liabilities, and so the select liabilities we display in Chart 1 reflect a lower percentage of their total liabilities than for Goldman Sachs, Merrill Lynch, and Morgan Stanley. In many of our reported figures below, we concentrate our analysis on Goldman Sachs, Merrill Lynch, and Morgan Stanley, for two reasons. First, disclosures from these firms are primarily oriented toward dealer banking—more so than for the universal banks of Citigroup and J.P. Morgan Chase, which have large deposit franchises and corporate and household lending businesses, in addition to their dealer banking activities. Because our stylized balance sheet excludes the deposit-taking part of standard banking, we more closely approximate our stylized balance sheet by focusing on the three former investment banks. Second, the reporting of the collateral record is least consistent, among the five BHCs reported above, for Citigroup and J.P. Morgan Chase, with some elements only available at the annual frequency or not reported in an equiva-lent manner, as the other banks.
4.1 Data Sources
In the following sections, we use data from the firms’ 10-Q/ 10-K filings to analyze their balance sheet and collateral records using our stylized framework. The components of our stylized balance sheet are calculated directly from the firms’ consolidated balance sheets. We can estimate the firms’ collat-eral record by exploiting self-reported data that appear either in parentheses on the balance sheet or in textual footnotes. We focus on the 10-Q/10-K data in this article because they offer the most consistent measures of the balance sheet and collat-eral record for dealer banks (see the data appendix).
Firms report collateral received from counterparties in connection with certain brokerage activities, such as reverse repurchase agreements, securities borrowing, and derivatives, as well as the amount of the collateral received that was subse-quently repledged by the firm. The firms in our sample sepa-rately report the portion of their financial instruments owned that they have pledged as collateral that can be repledged, as well as financial instruments that have been pledged that can-not be repledged; taking the sum of these two numbers gives us the amount of financial instruments owned by the firm that it has pledged.
Firms also specifically state the amount of cash collateral posted and received in connection with derivatives activity that qualifies for U.S. GAAP netting.
Chart 1
Select Funding Sources of Major Derivatives DealersDecember 31, 2012
Billions of U.S. dollars
Source: Company 10Q/10K filings.
Note: The figures in parentheses represent the sum of the select liabilities as a percentage of total liabilities.
0
100
200
300
400
500
600
700
Brokerage payablesOblig. to return secs. rec’d. as collateralInstruments sold but not yet owned (shorts)Collateralized funding
JPMMLGSMSCiti
(62)
(62)
(79)(23)
(26)

FRBNY Economic Policy Review / December 2014 141
4.2 Quantifying the Collateral Record
Reconstructing the collateral record as described above can shed light on the efficiencies captured by dealer banks through their secured activities. Although we are limited in our ability to fully quantify the sources of financing examined in our styl-ized framework—in particular, the internalization of trading activities—we assess two aspects of the collateral record that are indicative of the benefits dealer banks realize through the intermediation of secured transactions.
First, the level of collateral received that has been rehy-pothecated indicates firms’ reliance on “customer collateral” generated through secured lending activities and derivatives to raise financing, from both internal and external sources; these data allow us to directly measure the banks' “collateral efficiency,” as we have defined it. Second, the total stock of collateral held and the total stock of collateral pledged relative to the balance sheet can be used to indicate the degree of “col-lateralized financing efficiency” achieved by the dealer banks.
In both cases, we examine with particular attention the financial crisis period of 2008-09 characterized by significant balance-sheet deleveraging. With respect to levels of rehy-pothecation, we draw upon the example of Lehman Brothers to illustrate the magnitude of contraction in a case that ulti-mately ended in bankruptcy and liquidation.
Finally, we attempt to decompose the level of collateral efficiencies achieved into its transactional sources, that is, for the three types of activities described earlier—matched-book, internalization, and derivatives. Although this falls short of fully quantifying the amount of financing generated by the methods examined through our stylized framework, it provides some insight into the relative materiality of each source. Moreover, it allows us to observe a rough trend during the period of the crisis, raising important questions about the systemic risk effects of each activity.
Collateral EfficiencyWe first display a measure of “collateral efficiency,” which we earlier defined as the percentage of a dealer bank’s collateral received that is rehypothecated. Recall that it is likely that collateral efficiency is increasing with the size of the dealer’s collateral pool, as a larger portfolio of collateral will contain securities that match more customer demands than would a smaller portfolio. Indeed, this correlation was positive and significant at the aggregate level for the sample of banks we examine in this article (Chart 2). Further, a simple regression using the panel data with entity-fixed effects confirms this positive and significant correlation between collateral efficiency
and the collateral pool for these three firms. Other factors that we conjecture would increase collateral efficiency include the number and mix of customers, the operational capacity of the dealer, and other economic features of the dealer firm, such as its creditworthiness, that make it a good counterparty.
The collateral efficiency achieved by dealer banks underlies the more expansive collateralized financing efficiencies that pervade dealer banking. We examine this efficiency by com-paring the size of the collateral pledged by dealer banks and the size of their on-balance-sheet assets and liabilities.
Collateralized Financing Efficiency: A Liability Perspective
Recall that we defined collateralized financing efficiency as all the economic benefits reaped by dealer banks in their allocation of firm and customer collateral. To provide indicators of this efficiency, we first display the total stock of collateral pledged by the dealer banks relative to on-balance-sheet transactions that consume collateral, namely, their total secured liabilities. This is consistent with our stylized balance sheet for the dealer banks, where we focus on their secured financing activities.
The difference between the amount of collateral pledged by the dealer bank and its level of secured on-balance-sheet liabilities highlights the netting and other balance sheet economies that enable dealer banks to gain collateralized financing efficiency. This provides a measure of collateral financing efficiency.
Chart 2
Collateral Efficiency and the Dealer’s Collateral Pool
Collateral efficiency (percent)
Collateral received that can be repledged (collateral pool)(billions of U.S. dollars)
Source: Company 10Q/10K filings; includes GS, MS, and ML.
1,000 1,500 2,000 2,500 3,00070
75
80
85
90

142 Matching Collateral Supply and Financing Demands
In Chart 3, we also measure the amount of rehypothecated collateral, recalling that this is the numerator in our mea-sure for collateral efficiency. The chart illustrates the strong dependency on reuse of collateral received to finance dealer bank intermediation of cash and securities. Conceptually, in the event that all secured borrowers of the bank were to demand segregation of their collateral or fully restrict rehypothecation rights, the amount of rehypothecated collateral represents the total amount of financing that a dealer bank would need to raise from its own collateral or from the unsecured debt market to maintain its existing secured lending activities. The chart shows, therefore, just how important the amount of rehypothecation is to the dealer bank in achieving its efficiencies.
Chart 3 illustrates the trend between 2007:Q4 and 2013:Q1 of secured funding, including repo and securities lending transactions (blue area), firm shorts14 (dark blue area), and payables to clients (light blue area), again restricting our purview to Goldman Sachs, Merrill Lynch, and Morgan Stanley for comparability. The thick blue line indicates the total amount of collateral pledged, with the thin black line representing the portion of collateral pledged that was sourced from other secured transactions and has been rehypothecated. The difference between the two lines represents the amount of the firms' own collateral pledged to secured transactions.
14 Includes securities sold and not yet purchased. Excludes on-balance-sheet derivatives transactions, as the fair value of derivative liabilities reported on-balance-sheet generally refers to unsecured derivatives. This introduces a certain amount of error into our discussion of liabilities requiring collateral to be posted, as certain derivatives are collateralized by cash or securities that do not qualify for netting.
The importance of rehypothecation and the matching of sources and uses of collateral are emphasized by the level of rehypothecation relative to secured liabilities and total collat-eral pledged, and in normal times represents how efficient the dealer banks are in economizing on collateral. Total secured liabilities peaked in 2008:Q1 at just under $2 trillion, or 68 percent of the balance sheet, evidence of their materiality as a source of dealer funding. At that time, the level of collat-eral that had been rehypothecated and repledged exceeded the total secured liabilities reported on-balance-sheet by $156 billion, which indicates a very high level of collateralized financing efficiency.
The subsequent crisis-era period between 2007:Q4 and 2008:Q4 depicts a decline in total collateral pledged of nearly $1.5 trillion, or a 55 percent decrease. At the same time, on-balance-sheet secured liabilities declined by a much lower amount—$897 billion, or a 47 percent drop. In addition, the level of collateral rehypothecation fell by $1.2 trillion, or 57 percent, over the same period. The accelerated decline of the collateral stock pledged and the level of rehypothecation suggest a sort of collateral scarcity that particularly affects dealer banks. As the dealer banks’ collateral efficiency plum-meted, as shown directly in Chart 4, they had to supply more of their own collateral to secure funding as well as rely on uncollateralized funding or increases in equity.
Why did such a precipitous drop in collateralized financing occur during the crisis? Duffie (2013) provides a case study of
Billions of U.S. dollars
Payables to clients
Firm shortsSecured funding
Chart 3
Secured Liabilities Relative to Collateral Pledged
Source: Company 10Q/10K filings; includes GS, MS, and ML.
0
500
1,000
1,500
2,000
2,500
3,000Collateral pledged
Rehypothecatedcollateral
2013Q1201220112010200920082007Q4 0500
1,000
1,500
2,000
2,500
3,000
3,500
4,000
4,5005,000
Chart 4Collateral Ef�ciency and Total Primary Dealer Repo
Percent Billions of U.S. dollars
Source: Company 10K/10Q �lings, Federal Reserve Bank of New York (FR 2004).Notes: Collateral e�ciency includes GS, MS, and ML; shaded area highlights rapidly declining collateral e�ciency.
7072
74
76
78
80
82
84
86
8890
13121110090807062005
Primary dealerrepo outstanding
Scale
Collateral ef�ciency Scale
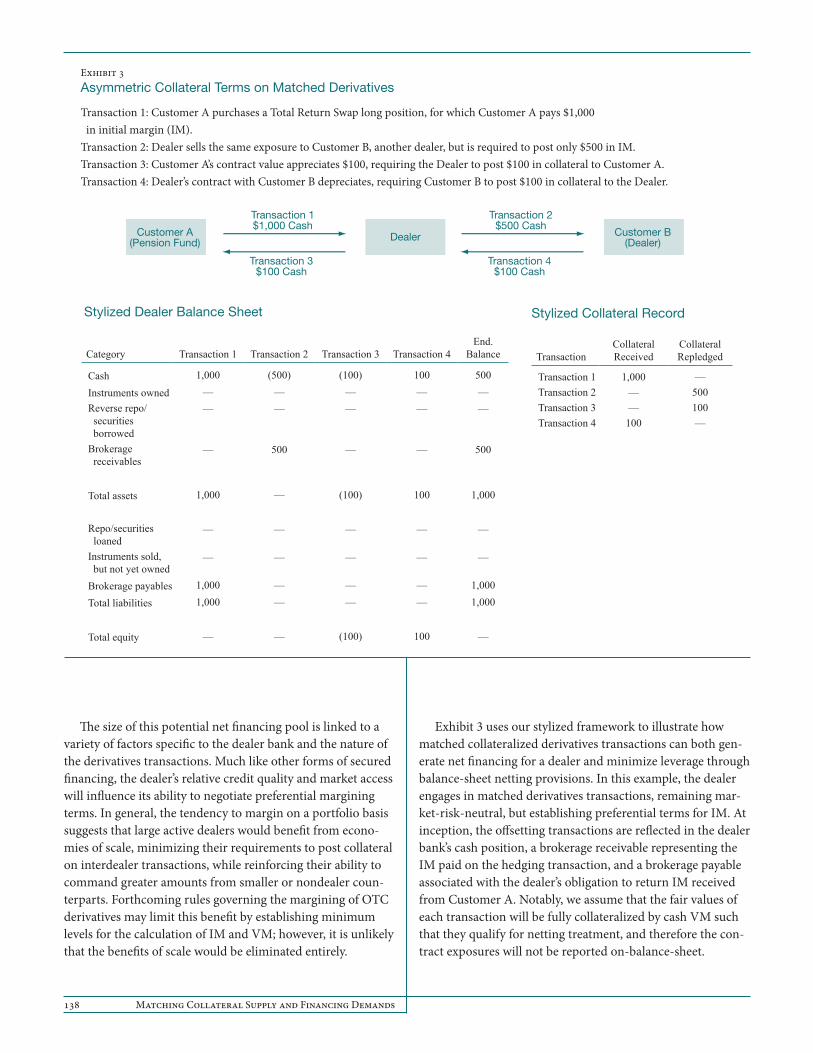
FRBNY Economic Policy Review / December 2014 143
some of the factors leading to the decline by examining fea-tures of Morgan Stanley’s experience during the days following the bankruptcy of Lehman Brothers International Holding Co. In that case, Duffie reports that “[t]he dominant source of loss in liquidity was through an effective run by Morgan Stanley’s prime-brokerage clients.” As prime-brokerage clients exited their positions with Morgan Stanley, the firm lost access to securities those clients had posted as collateral which, because of overcollateralization of client positions, in turn reduced the amount of financing Morgan Stanley could raise using those securities as collateral for its own borrowing. At the same time, however, many clients continued to have high and immediate demand for funding, which Morgan Stanley worked to fulfill; denying client requests would send a very negative signal about the firm’s ability to meet its other obligations, potentially crip-pling the firm. Consequently, Morgan Stanley had to rely on other and in general more costly external sources of financing to fulfill the demands it faced, which tended to expand its bal-ance sheet, all else equal. These strains led to a significant drop in the levels of collateral received and pledged by the dealer banks and a decline in the efficiency of the activity, to which we turn next. It is likely that the drop reflected a combination of decreases in both demand and supply of this type of financ-ing, as hedge funds and other clients reduced their risk profile and cut back on risky positions that required financing, and as dealer banks faced much higher costs of financing as they relied on more costly external sources of financing, including relying on higher levels of equity.
Collateralized Financing Efficiency: An Asset Perspective
We turn next to the asset side of our stylized balance sheet and the total stock of collateral managed by a dealer bank, including the stock that has been pledged or encumbered as well as what remains unencumbered and available. Assets generally reflect a firm’s earning potential; however, a simple balance sheet rep-resents net economic claims and, as a result, can understate the earning potential discussed in our stylized framework, stem-ming from the reuse of collateral that appears in the collateral record. Collateralized financing efficiency can be measured as the difference between the total collateral stock as viewed from the collateral record relative to the reported balance sheet. This in turn signals how much gross financing the dealer bank has extended in its activities, relative to the amount of lending it reports on-balance-sheet. However, as discussed earlier, we cannot adequately capture the full extent of the dealer’s collater-alized financing efficiency using the data that we have because
we do not know the “opportunity cost” the dealer avoided by not seeking funding from external markets. Thus, this estimate of collateralized financing efficiency will inherently be an un-derestimate, and will not reflect the full economy involved that would otherwise include the lower costs of internal sources of funds as well as the economization of capital and liquidity.
To arrive at this figure, we approximate the total stock of collateral held as the sum of the collateral received in relation to secured transactions reported in the footnotes of firms’ SEC fil-ings and the cash and financial instruments owned that appear on-balance-sheet. Notably, we do not include intangible assets, traditional loans, and certain investments (such as investments in subsidiaries) in the total stock of collateral, as these are not typically pledged as collateral for secured transactions.
Additionally, the linkage between the collateral record and the balance sheet is ambiguous, in particular, as it relates to cash. We expect that cash received in relation to derivatives or other secured transactions would appear both on the collateral record and the balance sheet; however, current disclosures do not provide enough detail to distinguish the overlap. Therefore, we approximate the potential range of total collateral received, using a lower bound that excludes on-balance-sheet cash (un-segregated and segregated) and an upper bound that includes all on-balance-sheet cash. Separately, and later in this article, we examine the net receipt of cash collateral in relation to OTC de-rivatives. Again, we restrict our view to Goldman Sachs, Merrill Lynch, and Morgan Stanley—the most comparable banks.
Chart 5Collateral Stock Relative to Total Assets
Billions of U.S. dollars
Source: Company 10K/10Q �lings; includes GS, MS, and ML.Note: Bottom line of range excludes cash (lower bound); top line includes cash balances (upper bound).
0
500
1,000
1,500
2,000
2,500
3,000
3,500
4,000
4,500
13121110090807062005
Collateral stock range
Total assets

144 Matching Collateral Supply and Financing Demands
Chart 5 illustrates the trend of total assets (blue area) and our estimated range of the total collateral stock (blue band). Empirically, we can observe that dealer banks tend to gener-ate stocks of collateral in excess of their total balance sheet during periods of stable market conditions, although this spread contracts acutely in response to market disruption. The stock of collateral for our sample firms peaked in 2008:Q1 at approximately $3.9 trillion–$4.2 trillion in notional terms (116–125 percent when measured relative to total on-balance-sheet assets). That is, the firms extended financing to custom-ers in excess of their on-balance-sheet reported lending by approximately 16–25 percent.
In 2009:Q1, the stock of total collateral fell to $2.0 tril-lion–$2.2 trillion, or 92–103 percent of total on-balance-sheet assets. The drop in the total stock of collateral outpaced balance sheet deleveraging in both notional and percentage terms, falling $1.9 trillion–$2.0 trillion, or 47–50 percent, versus a $1.2 trillion, or 38 percent, decline in total on-balance-sheet assets—a fact that illustrates the outsized effect of deleveraging on the collateral record.
Balance-sheet declines understate the amount of contraction in secured financial activity for dealer banks, and the collateral-ized financing efficiencies exploited by dealer banks disappear rapidly during periods of stress. This disparity between the net economic claims or obligations on-balance-sheet and the gross collateral flows is an important concept, particularly when col-lateral sources and uses are allocated across different customers or a customer and the dealer bank. Dealer banks, in an effort to preserve their franchise, do not necessarily unwind positions on a net basis. Recall that deleveraging can occur asymmetrically, resulting in large funding gaps in the interim.
The average collateral stock as a percentage of total assets was between 118 and 125 percent between 2005 and 2010; this number fell in the 2010-12 period to 107–116 percent. Two reasons for this decrease in firms’ collateral efficiency and collateralized financing efficiency likely relate to increased regulatory restrictions and increased risk aversion by dealer counterparties.
First, there have been several proposed regulatory changes that indirectly limit the levels of collateral rehypothecation. Recent liquidity regulations, such as the proposed Liquidity Coverage Ratio (LCR), could reduce these levels by requiring dealer banks to hold a buffer of unencumbered high-quality liquid assets as a reserve against short-term market and idio-syncratic liquidity risk in the future. Additionally, recent rules from the Commodity Futures Trading Commission would require that the execution and clearing of standardized swap contracts be shifted to central counterparties. These changes might decrease the stock of rehypothecatable collateral held by dealer banks for two reasons: 1) it may disintermediate dealer
banks as market participants interact directly through the central counterparty or exchange and 2) it will likely concen-trate a pool of collateral at the central counterparty, reducing the overall supply of collateral held by dealer banks. Proposals for an international supplemental leverage ratio would also indirectly limit the extent of rehypothecation, in particular, in terms of matched-book activity. Industry commentary sug-gests that the proposed rules discourage the use of matched-book repo, in particular reducing incentives for the use of repo backed by highly liquid securities. Additionally, the SEC has proposed placing new requirements on the segre-gation of collateral received in relation to centrally cleared “security-based” swaps, which could, on net, reduce levels of dealer rehypothecation. The Financial Stability Board and the European Commission have also countenanced the idea of outright constraints on rehypothecation, although these pro-posals are much further from tangible implementation.
Second, risk-averse dealer counterparties may be placing increased contractual limits on collateral rehypothecation to mitigate counterparty risk exposure.
4.3 Composition Analysis
We now attempt to decompose the stock of collateral received in relation to secured activities into its component pieces, linking them where possible to our stylized framework. This view cannot fully explain the “collateralized financing efficiency” or the extent of matched financing that takes place between the sources and uses of collateral; however, it reflects a perspective of all sources of collateral received, including their relative materiality and durability. Chart 6 shows this decomposition of the stock of collateral received, which excludes financial instruments owned, into collateral received from reverse repo and securities borrowing (dark blue area), derivatives dealing (light blue area), and brokerage activities (blue area).
Estimates of Collateral Received by ActivityFor this chart, we attempt to estimate the amount of collat-eral received in connection with reverse repo and securities borrowing transactions using the total amount reported on the firms’ balance sheets. However, because of the collateral-ized financing efficiencies discussed earlier, the balance-sheet number will severely underestimate the actual amount of collateral received in such transactions, as this proxy does not account for counterparty netting or haircuts, when lenders ask

FRBNY Economic Policy Review / December 2014 145
borrowers to pledge collateral in excess of the value of the se-cured transaction. This omission is sizable; as of August 2013, median haircuts in the U.S. tri-party repo market ranged from 2 percent for U.S. government and agency securities to 8 per-cent for some noninvestment-grade securities.
In addition, as described earlier, U.S. GAAP allows dealer banks to net down all secured funding transactions with a single counterparty. Recent disclosures by dealer banks provide us with insight into the magnitude of this divergence between the firms’ collateral record and the size of their balance sheets because firms have begun reporting netting amounts. As of 2013:Q1, counterparty netting reduced the amount of reverse repo and securities borrowing reported on-balance-sheet by $268 billion, which is approximately 16 percent of the total stock of collateral received (Table 4). In sum, this proxy estimates all collateral received from reverse repo and securities borrowing transactions, a portion of which will be delivered into repo and securities lend-ing transactions to form a “matched book.”
Additionally, the amount of collateral received in connec-tion with derivatives transactions is reported directly by our sample of dealer banks, but this number only includes cash collateral received that qualifies for netting treatment under U.S. GAAP. This proxy will also underestimate the actual collateral received from derivatives, since dealers receive cash collateral that does not qualify for netting as well as noncash collateral. Again, more recent disclosures from our sample of banks show that about $27 billion of other collateral is received in connection with derivatives, or about 2 percent of
the total stock of collateral received (see Table 4). A section below furthers expands upon cash collateral received from derivatives transactions.
The amount of collateral received from brokerage activity is estimated as the total amount of collateral received less the amounts attributed to matched-book dealing and derivatives. This will include collateral received from margin lending, of which a portion was likely delivered into customer or firm short positions, or “internalized.” However, this residual balance will also include the amount of residual error result-ing from the proxies used above, or specifically the amount of counterparty netting for repo/reverse repo transactions, aggregate repo haircuts, and the amount of cash and noncash collateral received from derivatives that does not qualify for netting under U.S. GAAP. This is reported in Table 4 to amount to $407 billion, or 24 percent of the total collateral received by the dealer banks, indicating that margin and securities lending and other brokerage activities are a powerful source of collater-alized financing efficiency for the dealer banks.
Prior to the crisis, brokerage activities contributed the majority of collateral to the total stock received, with reverse repo and securities borrowing contributing a close second (see Chart 6). At the height of the crisis and around the point of Lehman’s failure, our sample of dealer banks were all delever-aging at a breakneck pace. As observed in Charts 3 and 5, this entailed major reductions in assets and wholesale secured liabilities. We highlight above how this had an outsized effect on the stock of collateral as reported on the collateral record. Chart 6 attempts to attribute that contraction to the various
Chart 6Collateral Received from Speci�c Activitiesand Total Assets
Billions of U.S. dollars
Source: Company 10K/10Q �lings; includes GS, MS, and ML.
0
500
1,000
1,500
2,000
2,500
3,000
3,500
Brokerage activity
Derivatives dealing
Matched-book dealing
13121110092008
Total assets
Table 4 2013:Q1 Disclosures from Morgan Stanley, Goldman Sachs, and Merrill Lynch
Amount
Billions of Dollars Percent
Total collateral received
1,702 100
From: Reverse repo/securities borrowing reported on balance sheet 816 48Reverse repo/securities borrowing counterparty netting under U.S. GAAP 268 16Derivatives cash collateral netting under U.S. GAAP 184 11Derivatives other collateral 27 2Remaining residual amount 407 24

146 Matching Collateral Supply and Financing Demands
activities of the dealer banks. Gorton and Metrick (2012) and Duffie (2011) discuss the runs occurring in dealer banks, with Gorton and Metrick focusing specifically on repo runs. Our analysis suggests that there may also have been runs affecting margin and securities lending, and brokerage services, in addition to those on repos.
Based on our approximations, the collateral received in relation to brokerage activities collapsed dramatically in a remarkably short time frame, accounting for most of the aggregate decline. This may suggest that prime brokerage clients were selling assets or closing out short positions in an attempt to withdraw funds and limit credit exposure to the dealer banks. At its most severe, this likely would result in a significant loss of internalization, as discussed through our stylized framework. At a minimum, it implies that the collateral financing efficiencies obtained by dealer banks are fleeting, and that they can disappear during a period of severe market disruption.
Cash Collateral in Relation to OTC DerivativesCash collateral received in relation to derivatives transac-tions exceeds that posted for most of the dealer banks in our sample. For derivatives collateral, we can now expand our sample of firms to include Citigroup and J.P. Morgan Chase, as the reporting conventions are more homogenous among the five banks. In Chart 7, we see that the dealer banks, especially Goldman Sachs, typically receive in cash much more from derivatives counterparties than the amount they post to their
counterparties. This excess cash usually earns a short-term money market rate for the counterparty that posted it, and so to the extent that it can be rehypothecated, represents a very low-cost source of funding for the dealer banks.15 Chart 7 shows that derivatives cash collateral is a significant source of low-cost funding for the largest OTC derivatives dealer banks.
The time series of net derivatives cash collateral position shows a trend that is significantly at odds with the reductions in collateral received with the other dealer bank activities during the financial crisis. In Chart 7, we see that during the crisis period, the levels of net funding generated from deriv-atives activities actually increased. A closer look at individual firms reveals that Goldman Sachs was by far the primary beneficiary, but that Morgan Stanley and J.P. Morgan also benefited. While this is at first blush surprising, it reflects a broad shift toward increased collateralization in the wake of the failure of Lehman Brothers, and the near-failure of AIG may underlie these figures. In other words, the prior deficien-cies in collateralization of derivatives positions may have been corrected as the crisis developed.
Performance under Severe Duress: A Lehman Brothers Case Study
The asset and liability perspectives both highlight how the financing and collateral efficiency and the gross stock of re-hypothecatable collateral evaporate during a period of market stress; however, in this case Lehman serves as a more targeted example. Although data limitations prevent a similar asset and liability analysis, we can observe changes in Lehman’s levels of collateral pledged, collateral received, and the percentage of collateral received that had been rehypothecated. Depicted in Chart 8, all levels fell dramatically between 2008:Q1 and 2008:Q2, presumably surrounding the market turmoil related to J.P. Morgan’s acquisition of Bear Stearns. Of note, these levels declined well in advance of Lehman’s actual failure, with the last disclosure as of May 31, 2008. Additionally, Lehman’s levels of rehypothecation were elevated relative to the rest of our sample at 92 percent in 2008:Q1 versus an average of 83 percent, which may have contributed to its downward spiral of deleveraging and asset fire sales.
15 As discussed above, it is not fully clear in the financial reporting of the dealer banks whether cash is included or excluded from the collateral record. As a result, in the collateral record it is not clear if cash collateral is always included. That is why we provide the range of possible collateral in Chart 3, in one case excluding from the collateral record the derivatives cash collateral figures reported below. Consequently, one should not necessarily conclude that the net derivatives cash position reported in Chart 7 is an additional collateralized financing efficiency, over and above that reported in Chart 3.
Chart 7Net Derivatives Cash Collateral Position
Billions of U.S. dollars
Source: Company 10K/10Q �lings.
-40
-20
0
20
40
60
80
100
120
140
CML
MS
GS
1312111009082007Q4
JPM

FRBNY Economic Policy Review / December 2014 147
5. Conclusion
The economies of the activities undertaken by dealer banks relate intrinsically to the way these banks source and use collateral. In this article, we describe three types of activi-ties—matched-book financing, internalization, and deriva-tives collateral received in excess of posted—that allow dealer banks to reap efficiencies by reusing collateral provided by customers. Additionally, we discuss how netting accounting rules, excess collateralization, cheaper internal sources of cash and securities, and other collateral efficiencies allow them to finance customer demands in excess of their own liabilities. We attempt to measure these sources using publicly disclosed data in 10-Q and 10-K filings, illustrating how these sources of financing have evolved over time, including during the financial crisis of 2007-09. The data reveal that, while efficient in normal times, such financing drastically and abruptly dries up during times of financial stress.
In particular, we describe two types of efficiencies gained by dealer banks: collateral efficiency and collateralized financing efficiency. First, dealer banks realize “collateral efficiencies” by rehypothecating collateral they have received from their customers. This ability to rehypothecate collateral allows them to “internalize” their sources of collateral and cash, finding uses for them among their other customers, or for their own trading. Collateral efficiency is likely related to the scale of the dealer bank’s activity and the distribution of securities pledged as collateral by its customers. Second, dealer banks reap “collater-
alized financing efficiencies,” which allow them to engage in a larger amount of collateralized lending than is reported on their balance sheets. A dealer bank’s collateralized financing effi-ciency is related to the amount of netting allowed by U.S. and international accounting standards; the accounting treatment of brokerage activities, such as shorts; the differential between the cost of internal sources of funding and external ones; and the fees/income earned on lending activities. To determine the level of a firm’s collateralized financing efficiency, an analyst must consult the collateral record of the banks, which is embedded within the text of firms’ 10-Q and 10-K reports.
Unsurprisingly, we find that the experience of the financial crisis was especially troubling for dealer banks. The collateral they had received from customers disappeared when customers exited positions that the dealer bank had financed. Because dealer banks had heavily utilized the customer-provided collat-eral, they were forced to source collateral and cash externally to manage and meet their obligations at the same time that mar-kets were most disturbed. Notably, the dealer banks’ brokerage receivables were most affected by the crisis, plummeting signifi-cantly more than the firms’ other sources of collateral and much more than the balance sheet assets of the firms. This likely is the result of the significant moves in markets, including the equity markets, which at the height of the crisis led customers to exit leveraged bets (such as margin loans) on those markets as quickly as possible. The dealer banks were heavily exposed to this source of risk in their financing profile. In contrast, the dealer banks received more collateral in connection with deriv-atives during and after the financial crisis. This likely reflects a widespread undercollateralization of derivative positions prior to the crisis, as well as a renewed focus on counterparty credit risk during the crisis as many dealer bank counterparties expe-rienced credit rating downgrades.
Our observations raise the question of whether the risk of dealer financing, which is more comprehensively, although still imperfectly, reflected in a bank's collateral record than in its balance sheet, is managed appropriately. That the amount of financing extended by dealer banks, as measured by the col-lateral record, fell further and more swiftly than the amount measured by the banks’ balance sheets suggests that a prudent risk management framework would acknowledge the risks inherent in collateralized finance, and allocate both capital and liquidity to be available to address any shortfalls that would arise in a risk event. Our observations reflect the fact that reputational and other economic considerations provide incentives to dealer banks to roll over one side of a customer’s trade, while the other side is extinguished, which brings the exposure on-balance-sheet. Accounting netting in this case does not reflect true economic netting of risk exposures. This line of reasoning leads us to suggest that the recent consulta-
Chart 8Lehman and the Collateral Record in the Run-Upto Collapse
Billions of U.S. dollars Percent
Source: Company 10K/10Q �lings.
400
600
800
1,000
1,200
75
80
85
90
95Rehypothecated collateral
Scale
Collateral pledged
Collateral received
0807062005

148 Matching Collateral Supply and Financing Demands
tive document of the Basel Committee on Bank Supervision (2013) that outlined a revision to the Basel III leverage ratio framework which, when measuring securities financing trans-actions, excludes any recognition of accounting netting, may be warranted as a measurement approach.16 We do not ad-vocate that a binding leverage requirement for capital should be applied, as this would essentially equalize the risk weights for different types of risk exposures, opening the window for dealer banks to increase the risk of their positions while not increasing their required regulatory capital.17 However, some capital and liquidity charge (as, for example, is the case with the Liquidity Coverage Ratio) for financing transactions that are currently subject to accounting netting treatment, and are therefore off-balance-sheet, does seem warranted.
Our measures of collateral and collateralized financing ef-ficiencies have declined in the aftermath of the financial crisis.
That trend likely reflects some greater regulatory limitations on collateral rehypothecation, and some greater restrictions put in place by customers on the reuse of their collateral. Nonetheless, the size and importance of the financing and collateral efficiencies we describe in this study remain large for the dealer banks.
It is important to acknowledge the limitations of the data used in this study, which reflect the inadequate reporting requirements for collateral used by dealer banks. More reg-ular, frequent, and standardized public disclosures on asset encumbrance—including the level of unencumbered assets relative to unsecured liabilities, overcollateralization levels, and received collateral that can be rehypothecated—would allow for more reliable measurements of these activities. Such data could provide a fuller picture of the financial condition and vulnerabilities of dealer banks.
16 Note that this is also the approach taken by the Liquidity Coverage Ratio, which requires the reporting of gross contractual obligations for secured transactions that mature within the thirty-day period. This is impactful for the collateral swap/optimization trades we discuss in the context of matched book, which allow the dealer to transform its collateral profile without expanding its balance sheet. Under circumstances where dealers exchange less liquid collateral for highly liquid collateral, they must hold liquidity in an amount equivalent to the difference in stressed run-off rates applied to each class of collateral. Furthermore, in case of cash brokerage internalization, the Liquidity Coverage Ratio requires liquidity to be held for instances where offsetting customer-to-customer or customer-to-firm exposures are used to finance one another.
17 Darrell Duffie makes this point most clearly in his October 13, 2013, Brookings Institution presentation, “Capital Requirements with Robust Risk Weights.”

FRBNY Economic Policy Review / December 2014 149
Data Appendix
In our study, we choose to focus on data from firms’ 10-Q/10-K filings to examine dealer banks’ financing trans-actions. The 10-Q balance sheet data are firm specific and consolidated at the bank holding company level, which include U.S. and U.K. broker-dealer subsidiaries. However, as we discuss in the study, using 10-Q/10-K data restricts which firms we can analyze; of the major OTC derivatives dealers, only three institutions report their balance sheet and collateral record in a consistent way.
There are other data sources that potentially offer similar insights, namely, the Federal Reserve Board’s Flow of Funds data and the Federal Reserve Bank of New York’s data on primary dealers. In this appendix, we describe the advantages and disadvantages of these alternative data sources and offer a robustness check for some of our main findings.
The Flow of Funds data aggregate all broker-dealer quarterly balance sheets from their FOCUS regulatory submissions to the SEC and provide industry-wide data on those activities of dealer banks. However, the Flow of Funds data are inadequate for our analysis in four respects. First, U.K. broker-dealer subsidiaries of U.S. bank holding companies are not included in the Flow of Funds data. This omission could have a sizable effect on the balance-sheet data since the U.K. dealer banks are particularly large prime brokers and are not bound by SEC rules 15c3-3, al-lowing them to rehypothecate securities to a larger extent than their U.S. counterparts. Second, the Flow of Funds only reports a combined number for repurchase agreements and federal funds, and this number represents a “net” amount, that is, total fed funds and repo borrowing less fed funds and repo lending. Third, the Flow of Funds does not offer data on firms’ collateral sources and uses, such as collateral received or pledged by the dealer. Fourth, the Flow of Funds does not report firm shorts, that is, securities sold but not yet purchased. As a result, we can only proxy one component of our stylized framework—the stylized balance sheet—using the Flow of Funds, and we cannot isolate all the components of dealer banks’ secured funding or proxy the sources of dealer banks’ collateral received.
The Federal Reserve Bank of New York provides at a weekly frequency aggregate data on primary dealers’ posi-tions, financing, and settlement activities across asset classes, collected from their FR 2004 regulatory filings. Financing data are split into two categories that together represent a view of the collateral record: securities received as collateral by the dealer from its counterparties (“securities in”) and securities pledged by the dealer as collateral (“securities out”). This includes collateral received and pledged in connection with securities lending, repurchase agreements, and margin loans,
and is reported on a gross basis. Additionally, the FR 2004 data report the portion of securities pledged and received in connection with repos and reverse repos, which is a useful proxy for dealers’ matched-book transactions. However, these data exclude collateral received and pledged in connection with derivatives activity and do not distinguish between firms’ own collateral that was pledged and collateral received that the dealer rehypothecated. As a result, the FR 2004 data underestimate collateral pledged/received and preclude any measure of dealers’ “collateral efficiency” as we have defined it. Additionally, like the Flow of Funds data, the FR 2004 data exclude financing activities of U.K. broker-dealer subsidiaries of U.S. bank holding companies.
Though these data are limited for the reasons described above, they do allow for a rough check for some of our main conclusions. We combine Flow of Funds balance sheet data for U.S. broker-dealers with FR 2004 data describing the primary dealers’ quarter-end collateral record to obtain a time-consistent series.18
Chart A1 confirms that dealers generate stocks of collateral in excess of their balance sheet (see the similarity to Chart 5
Chart a1Collateral Received Compared withTotal Financial Assets
Billions of U.S. dollars
Sources: FR 2004 Financing Data for Primary Dealers; Flow of Funds Data for Securities Brokers and Dealers.
0
1,000
2,000
3,000
4,000
5,000
6,000
Collateral stock
Total �nancial assets
1312111009080706052004
Collateral receivedby primary dealers
18 We recognize that these data sources cover different populations and, unlike the sources we use in the study, do not cover collateral associated with derivatives.

150 Matching Collateral Supply and Financing Demands
Data Appendix (continued)
in our study). We proxy the collateral stock by taking the sum of the primary dealers’ “Securities In” (from the FR 2004) and dealer banks’ credit market instruments owned (from the Flow of Funds); here, we measure the balance sheet using broker-dealers’ total financial assets (from the Flow of Funds). The drop in the collateral stock greatly exceeds that of the balance sheet during the crisis, suggesting that balance-sheet declines do not fully reflect the reduced provisioning of se-cured financing by the dealers. The collateral stock peaked at $5.1 trillion in 2008:Q1 and subsequently fell 46 percent (or $2.3 trillion) to a trough of $2.7 trillion in 2009:Q3. In con-trast, the balance sheet dropped from $3.2 trillion in 2008:Q1 to $2 trillion in 2009:Q3, representing a fall of 36 percent (or $1.2 trillion). In sum, these data indicate that dealers’ collat-eralized financing efficiencies can vanish precipitously during periods of market disruption.
It is important to note that these two data sources repre-sent different samples, with the Flow of Funds representing all U.S. broker-dealers and the FR 2004 data representing just primary dealers, a subset of the total industry. This means our measure of the dealers’ balance sheet encompasses the entire (domestic) broker-dealer industry, while our measure of the collateral stock only includes the primary dealers. It is likely that the collateralized financing activities are concentrated at the largest broker-dealers, and so the primary dealers’ collat-eral record could be expected to represent the vast majority of all dealer banks’ collateral received. That said, our measure of the collateral stock would tend to underestimate the total for all broker-dealers, meaning that the level of the collateral stock for all broker-dealers would be even higher and thus more in excess of the broker-dealers’ aggregate balance sheet. This result, then, would likely be even stronger with aggregate collateral record data from the full broker-dealer industry.
Chart A2 plots the composition of the collateral received by primary dealers as is reported in the FR 2004. These data confirm the significant contraction in matched-book and other
sources. Additionally, and perhaps more importantly, “other sources” declined as a percentage of total collateral received. These observations are consistent with the firm-specific data from the SEC disclosures we present in Chart 6 in the study, and indicate that both brokerage activities and matched-book dealing were significant sources of dealer collateral precrisis, and that both of these activities plunged dramatically during the crisis, along with total collateral received. In contrast to Chart 6, Chart A2 attributes a larger portion of total collateral received to matched book. This could be a result of accounting idiosyncrasies of the FR 2004; for example, primary dealers may have included collateral received in connection with other secured transactions (such as margin loans) with that sourced from reverse repos in their FR 2004 reports.
Chart A2Collateral Received by Primary Dealers(“Securities In”)
Billions of U.S. dollars
Source: FR 2004 Financing Data for Primary Dealers.
0
1,000
2,000
3,000
4,000
5,000
Collateral sourcedfrom reverse repos
13121110092008
Collateral sourced fromother �nancing activities

FRBNY Economic Policy Review / December 2014 151
References
Adrian T., B. Begalle, A. Copeland, and A. Martin. 2011. “Repo and Securities Lending.” Federal Reserve Bank of New York Staff Reports, no. 529, December.
Basel Committee on Banking Supervision. 2013. “Revised Basel III Leverage Ratio Framework and Disclosure Requirements.” Consultative document.
Basel Committee on Banking Supervision and International Organization of Securities Commissions. 2013. “Margin Requirements for Non-Centrally Cleared Derivatives.” Consultative document.
Committee on the Global Financial System. 2013. “Asset Encumbrance, Financial Reform, and the Demand for Collateral Assets.”
Copeland, A., A. Martin, and M. Walker. 2010. “The Tri-Party Repo Market before the 2010 Reforms.” Federal Reserve Bank of New York Staff Reports, no. 477, November.
Duffie, D. 2010. “The Failure Mechanics of Dealer Banks.” Journal of Economic Perspectives 24: 51-72.
———. 2011. How Big Banks Fail: And What To Do About It. Princeton, N.J.: Princeton University Press.
———. 2013. “Replumbing Our Financial System—Uneven Progress.” International Journal of Central Banking 9, supplement 1: 251-80. Available at http://www.ijcb.org/journal/ijcb13q0a12.pdf.
Gorton, G., and A. Metrick. 2012. “Securitized Banking and the Run on Repo.” Journal of Financial Economics 104, no. 3: 425-51.
International Swaps and Derivatives Association. 2012. “Netting and Offsetting: Reporting Derivatives under U.S. GAAP and under IFRS.”
King, M., 2008. Are the Brokers Broken? New York: Citibank Global Markets Group.
Singh, M., and J. Aitken. 2009. “Deleveraging after Lehman—Evidence from Reduced Rehypothecation.” IMF Working Paper no. 09/42, March.
Squam Lake Working Group on Financial Regulation. 2010. “Prime Brokers and Derivatives Dealers.” Council on Foreign Relations working paper.
Stigum, M., and A. Crescenzi. 2007. The Money Market. 4th ed. New York: McGraw Hill.
The views expressed are those of the authors and do not necessarily reflect the position of the Federal Reserve Bank of New York or the Federal Reserve System. The Federal Reserve Bank of New York provides no warranty, express or implied, as to the accuracy, timeliness, completeness, merchantability, or fitness for any particular purpose of any information contained in documents produced and provided by the Federal Reserve Bank of New York in any form or manner whatsoever.