Mata Kuliah: Tata Letak Fasilitas (TKI 4215) FLOW, SPACE ... · String Diagram merupakan alat untuk...
72
FLOW, SPACE, AND ACTIVITY RELATIONSHIP Mata Kuliah: Tata Letak Fasilitas (TKI 4215) www.aeunike.lecture.ub.ac.id
Transcript of Mata Kuliah: Tata Letak Fasilitas (TKI 4215) FLOW, SPACE ... · String Diagram merupakan alat untuk...
FLOW, SPACE, AND ACTIVITY
RELATIONSHIP
Mata Kuliah: Tata Letak Fasilitas (TKI 4215)
www.aeunike.lecture.ub.ac.id
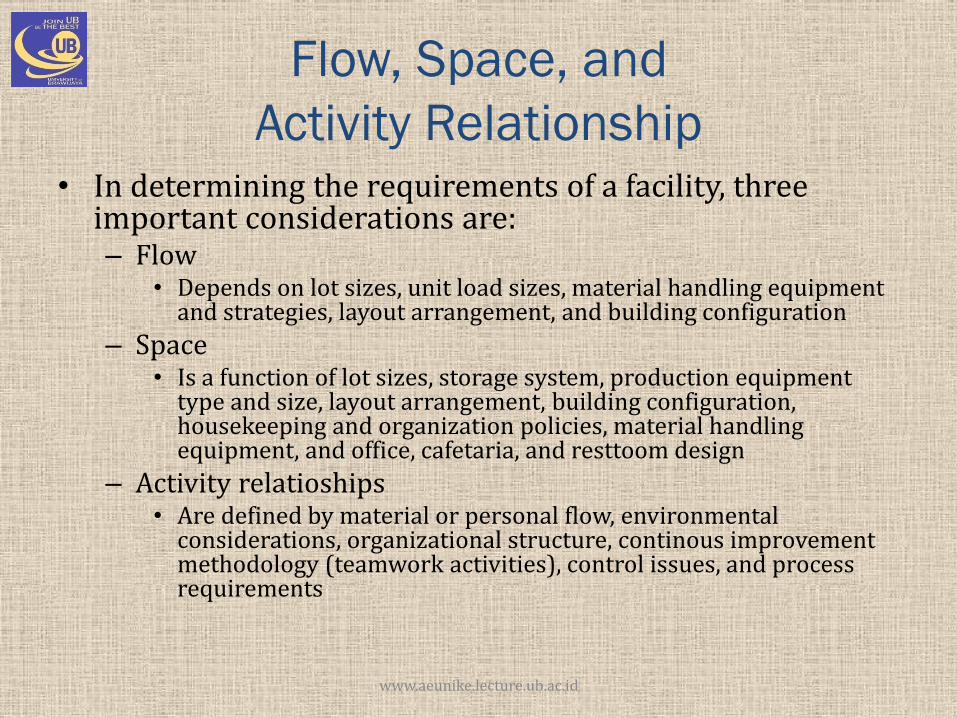
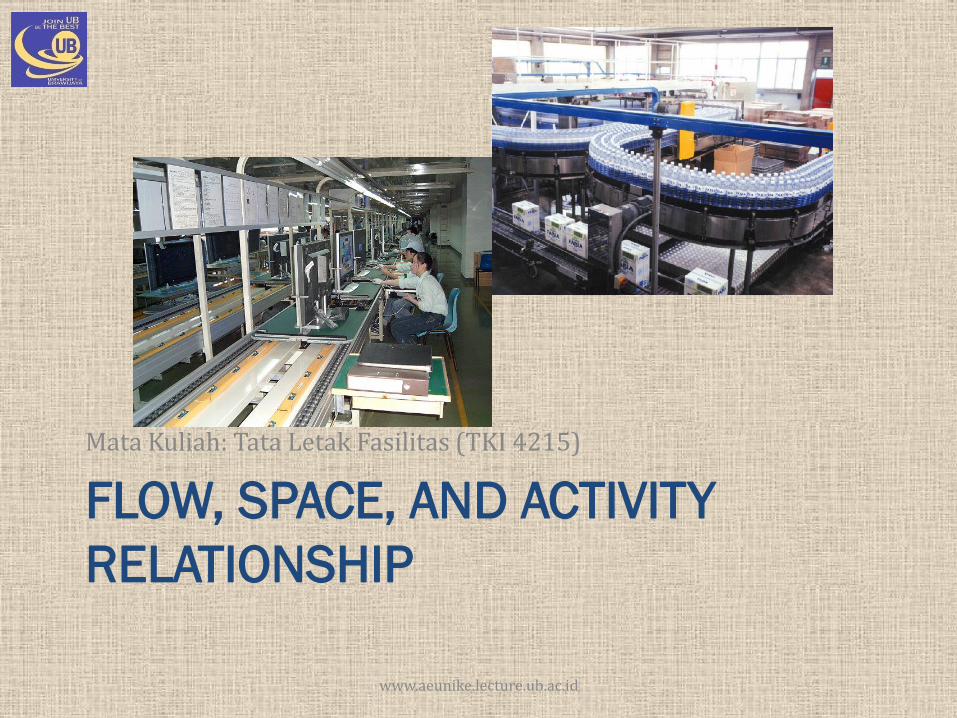
Flow, Space, and
Activity Relationship • In determining the requirements of a facility, three
important considerations are: – Flow
• Depends on lot sizes, unit load sizes, material handling equipment and strategies, layout arrangement, and building configuration
– Space • Is a function of lot sizes, storage system, production equipment
type and size, layout arrangement, building configuration, housekeeping and organization policies, material handling equipment, and office, cafetaria, and resttoom design
– Activity relatioships • Are defined by material or personal flow, environmental
considerations, organizational structure, continous improvement methodology (teamwork activities), control issues, and process requirements
www.aeunike.lecture.ub.ac.id
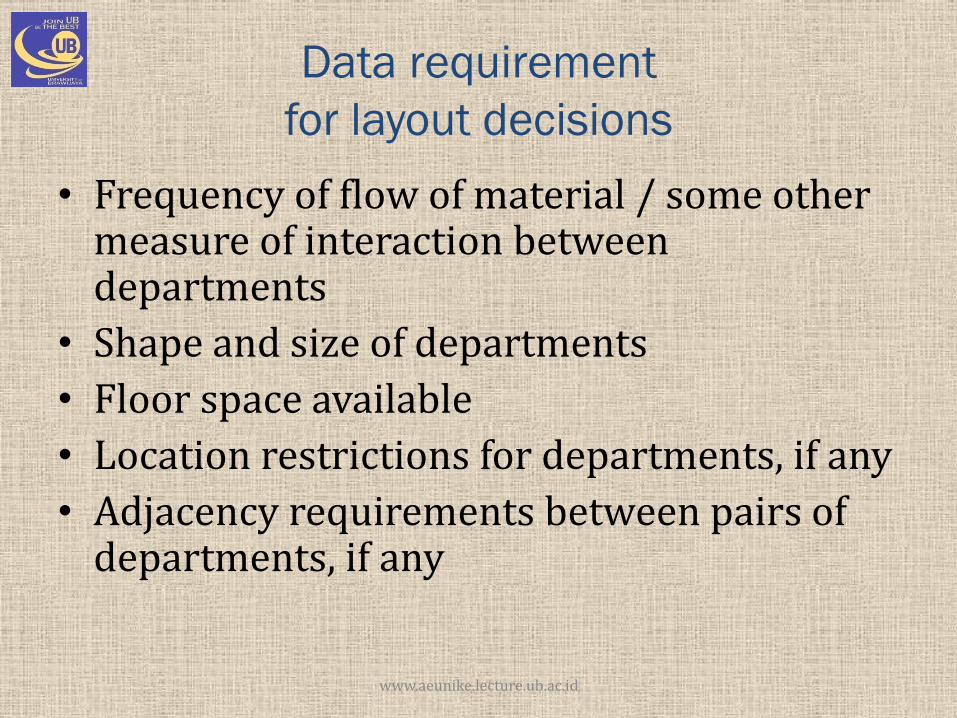
Data requirement
for layout decisions
• Frequency of flow of material / some other measure of interaction between departments
• Shape and size of departments
• Floor space available
• Location restrictions for departments, if any
• Adjacency requirements between pairs of departments, if any
www.aeunike.lecture.ub.ac.id
FLOW PATTERN
www.aeunike.lecture.ub.ac.id
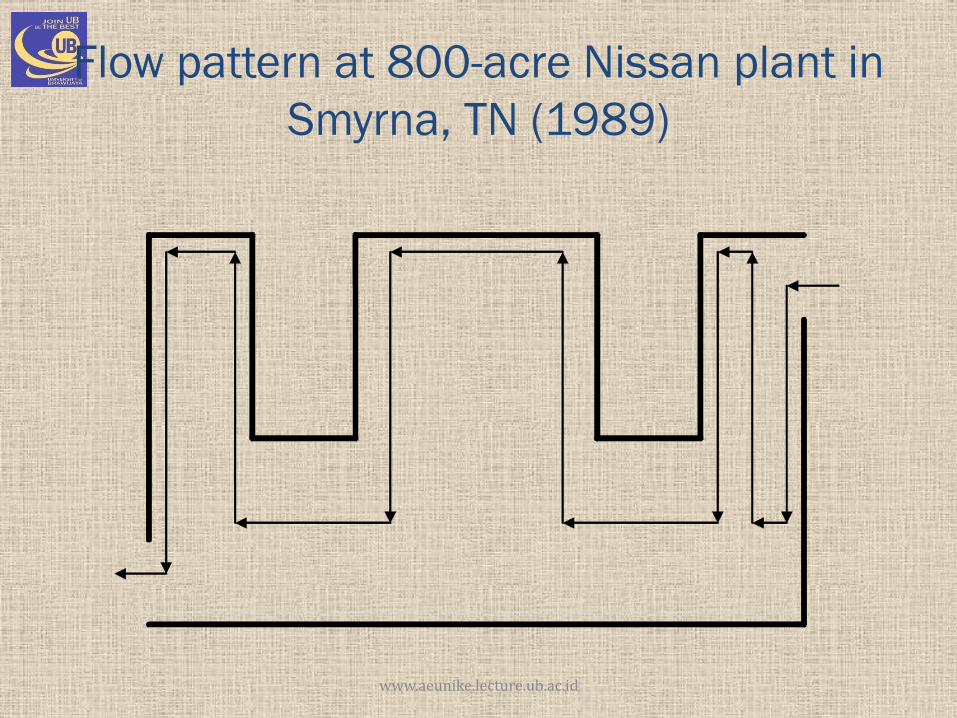
Flow pattern at 800-acre Nissan plant in
Smyrna, TN (1989)
www.aeunike.lecture.ub.ac.id
www.aeunike.lecture.ub.ac.id
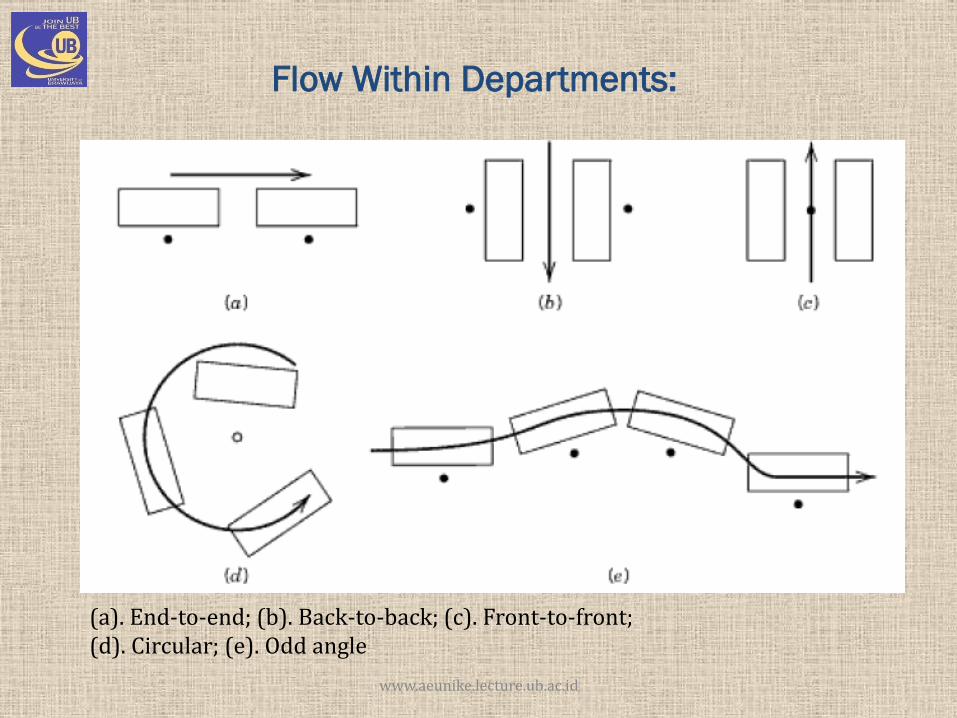
Flow Within Departments:
(a). End-to-end; (b). Back-to-back; (c). Front-to-front; (d). Circular; (e). Odd angle
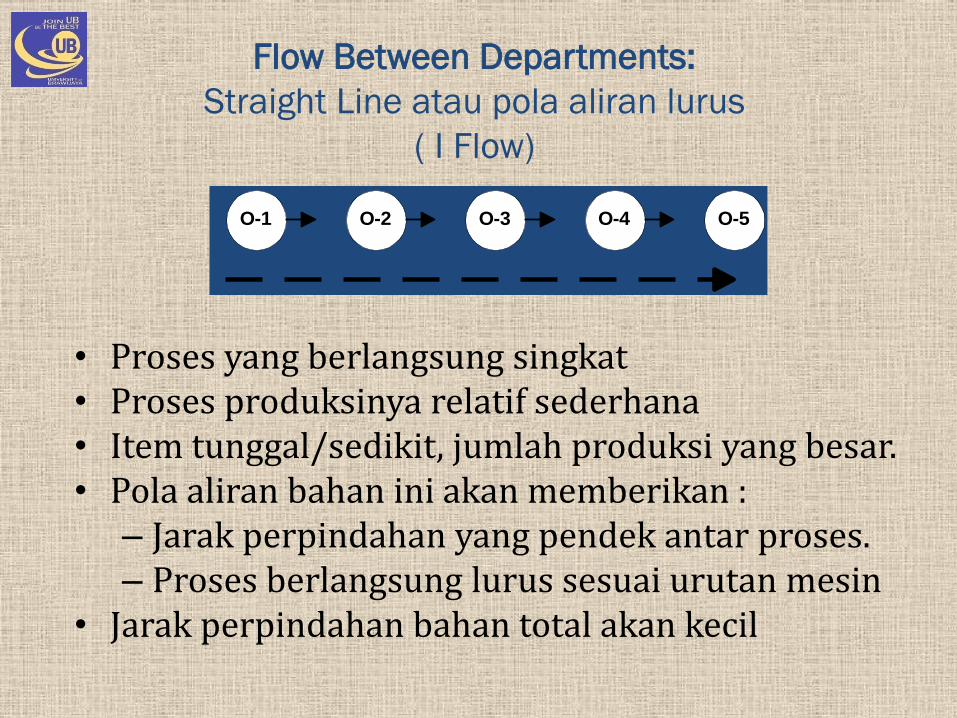
Flow Between Departments:
Straight Line atau pola aliran lurus
( I Flow)
• Proses yang berlangsung singkat • Proses produksinya relatif sederhana • Item tunggal/sedikit, jumlah produksi yang besar. • Pola aliran bahan ini akan memberikan :
– Jarak perpindahan yang pendek antar proses. – Proses berlangsung lurus sesuai urutan mesin
• Jarak perpindahan bahan total akan kecil
O-1 O-2 O-3 O-4 O-5
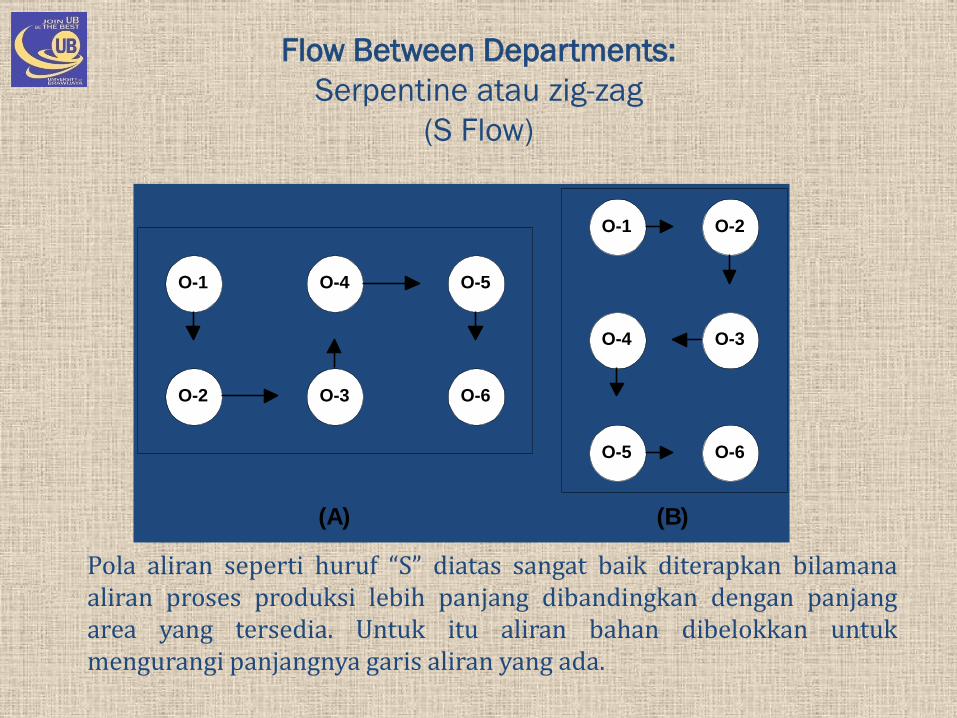
Flow Between Departments:
Serpentine atau zig-zag
(S Flow)
(A)
O-1
O-2 O-3
O-4 O-5
O-6
O-1 O-2
O-4 O-3
O-5 O-6
(B)
Pola aliran seperti huruf “S” diatas sangat baik diterapkan bilamana aliran proses produksi lebih panjang dibandingkan dengan panjang area yang tersedia. Untuk itu aliran bahan dibelokkan untuk mengurangi panjangnya garis aliran yang ada.
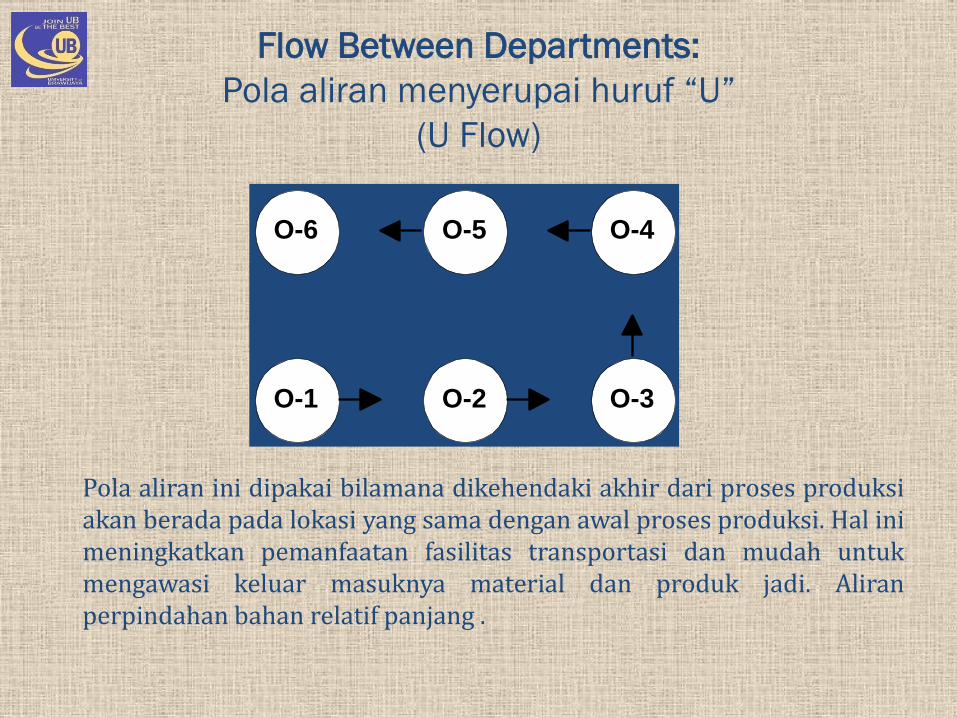
Flow Between Departments:
Pola aliran menyerupai huruf “U”
(U Flow)
O-1 O-2 O-3
O-4O-5O-6
Pola aliran ini dipakai bilamana dikehendaki akhir dari proses produksi akan berada pada lokasi yang sama dengan awal proses produksi. Hal ini meningkatkan pemanfaatan fasilitas transportasi dan mudah untuk mengawasi keluar masuknya material dan produk jadi. Aliran perpindahan bahan relatif panjang .
O-1
O-2
O-3
O-4
O-5
O-6
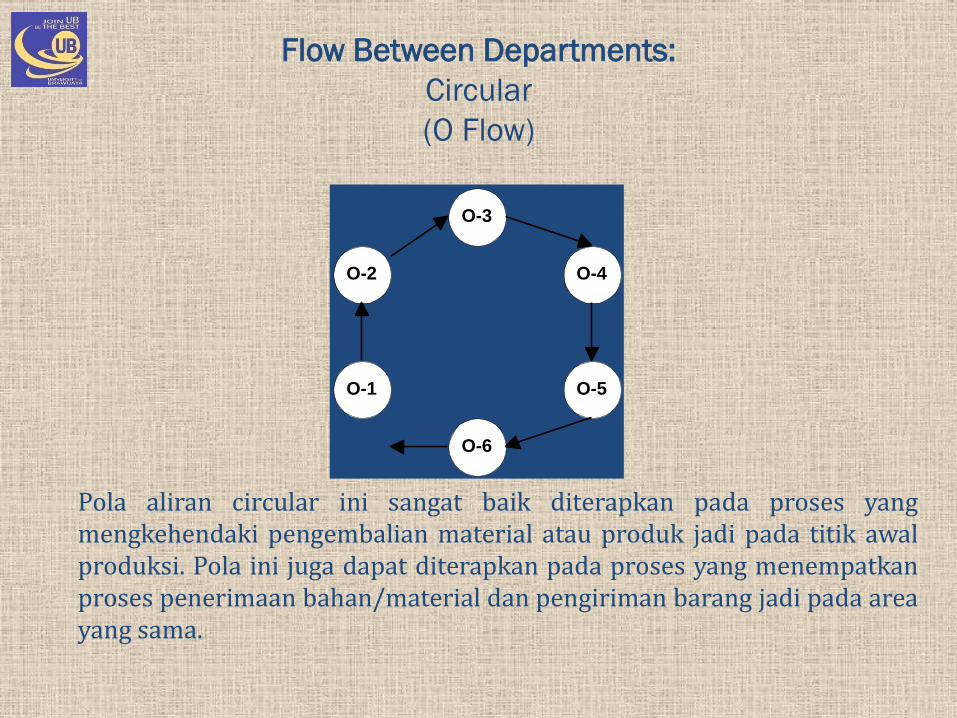
Pola aliran circular ini sangat baik diterapkan pada proses yang mengkehendaki pengembalian material atau produk jadi pada titik awal produksi. Pola ini juga dapat diterapkan pada proses yang menempatkan proses penerimaan bahan/material dan pengiriman barang jadi pada area yang sama.
Flow Between Departments:
Circular
(O Flow)
O-1
O-2
O-3
O-4
O-5
O-6
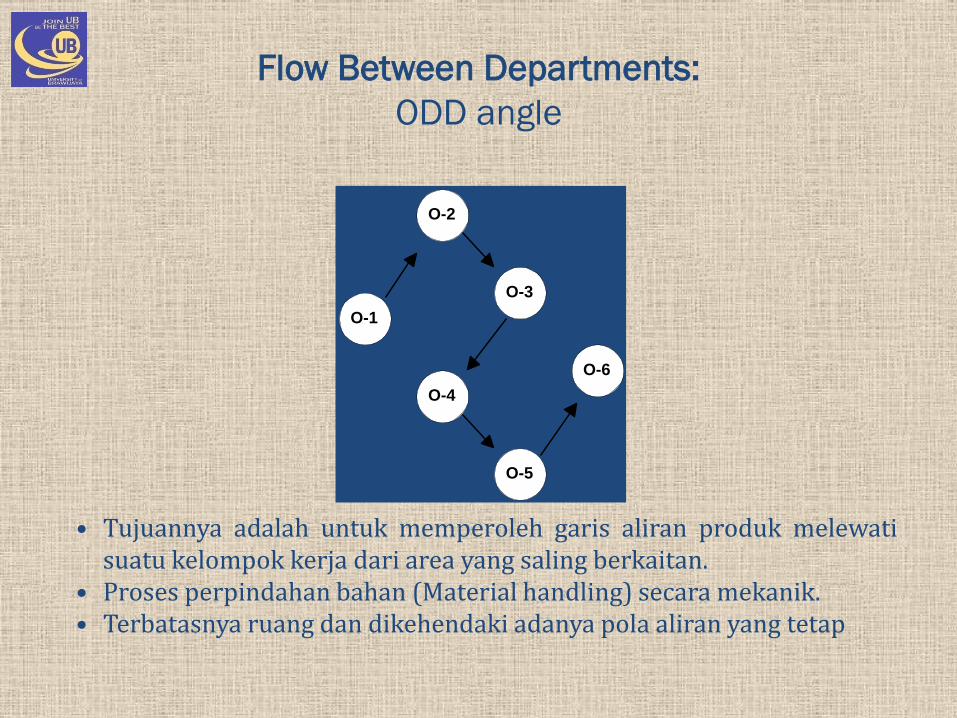
• Tujuannya adalah untuk memperoleh garis aliran produk melewati suatu kelompok kerja dari area yang saling berkaitan.
• Proses perpindahan bahan (Material handling) secara mekanik. • Terbatasnya ruang dan dikehendaki adanya pola aliran yang tetap
Flow Between Departments:
ODD angle
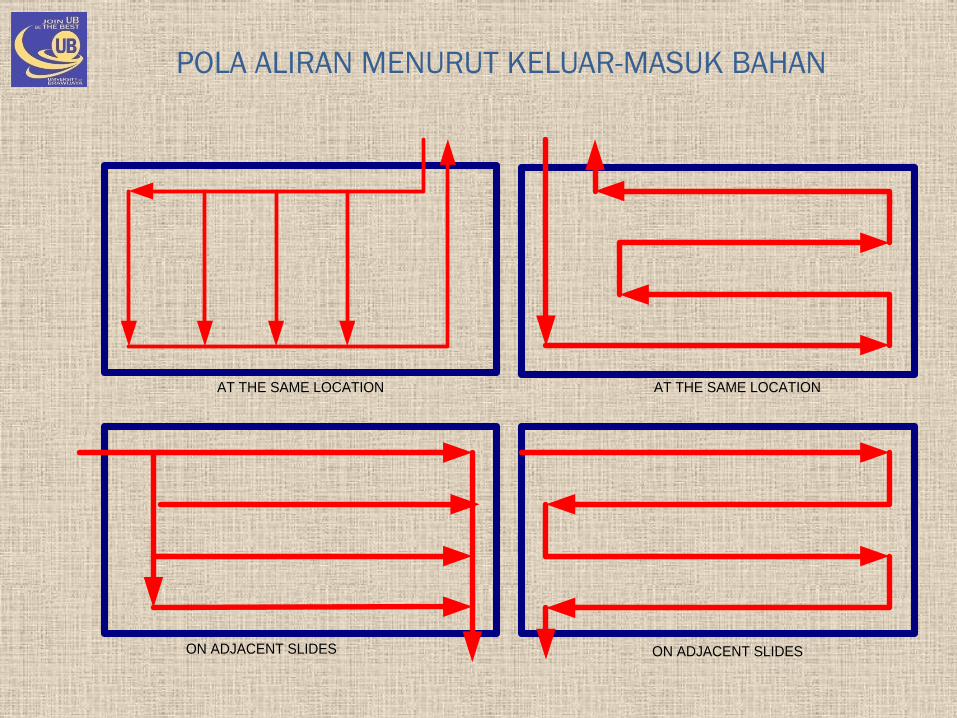
AT THE SAME LOCATION
ON ADJACENT SLIDES
AT THE SAME LOCATION
ON ADJACENT SLIDES
POLA ALIRAN MENURUT KELUAR-MASUK BAHAN
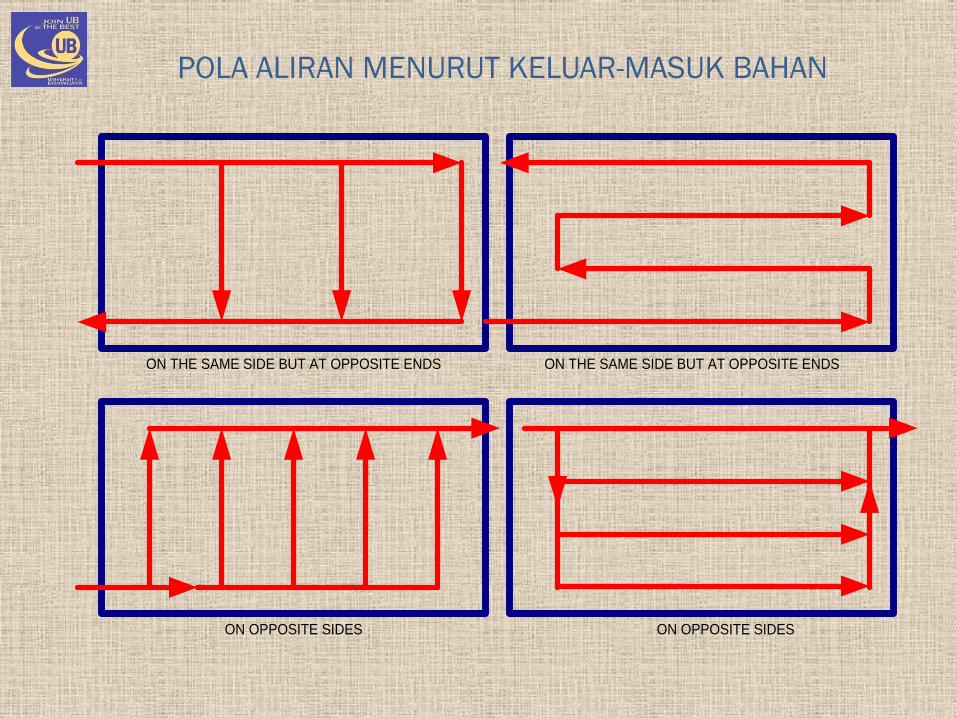
ON THE SAME SIDE BUT AT OPPOSITE ENDS ON THE SAME SIDE BUT AT OPPOSITE ENDS
ON OPPOSITE SIDES ON OPPOSITE SIDES
POLA ALIRAN MENURUT KELUAR-MASUK BAHAN
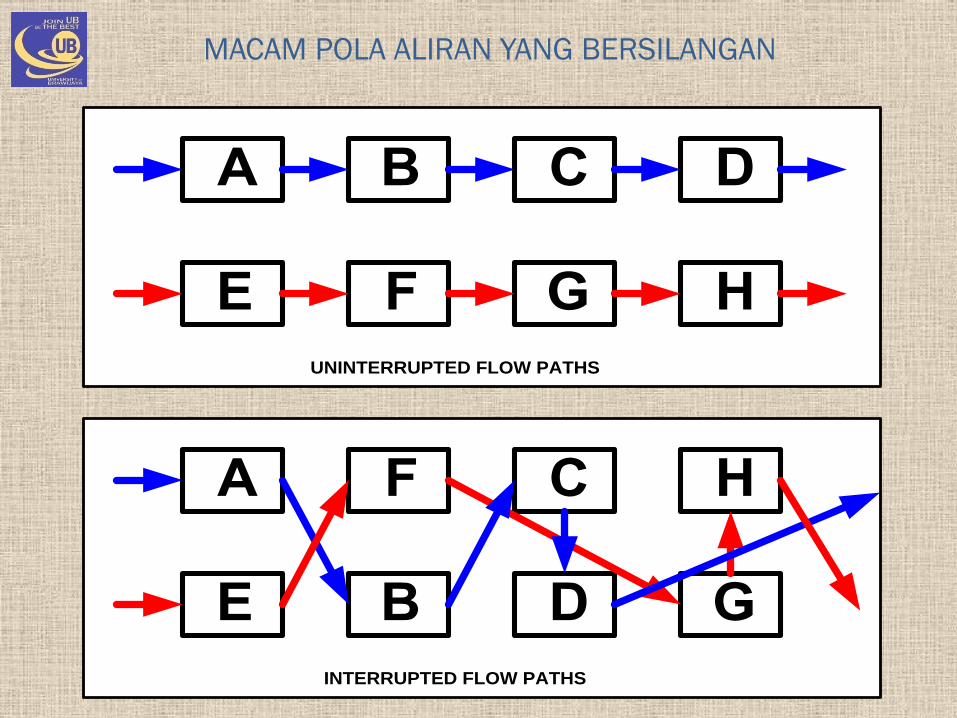
A B
E
DC
HF G
UNINTERRUPTED FLOW PATHS
A F
E
HC
GB D
INTERRUPTED FLOW PATHS
MACAM POLA ALIRAN YANG BERSILANGAN

POLA ALIRAN BAHAN UNTUK
PROSES PERAKITAN (ASSEMBLY)
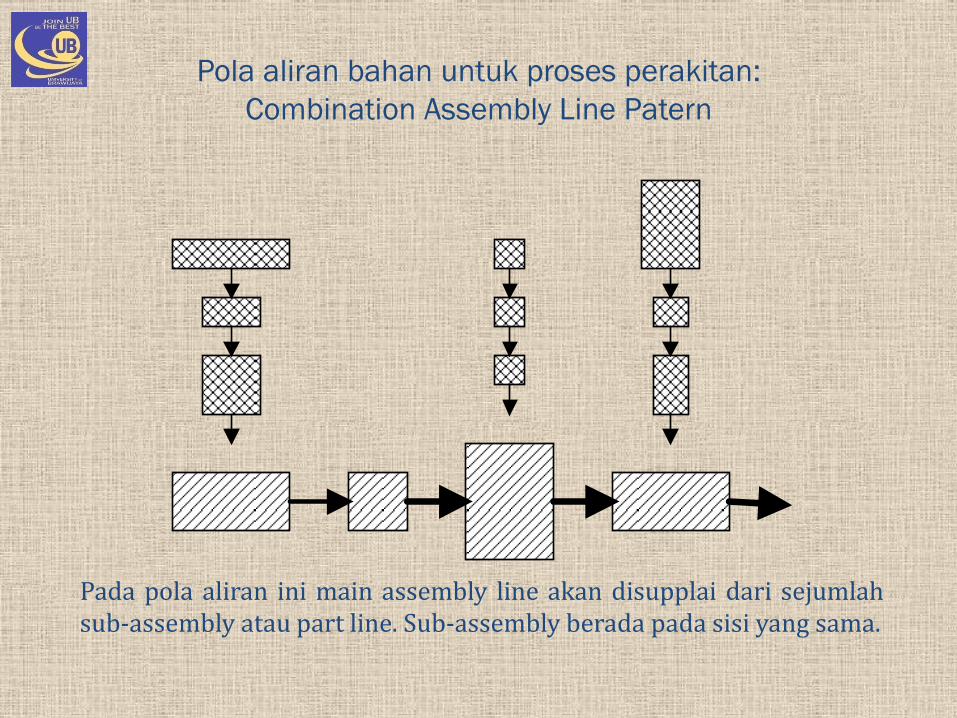
Pada pola aliran ini main assembly line akan disupplai dari sejumlah sub-assembly atau part line. Sub-assembly berada pada sisi yang sama.
Pola aliran bahan untuk proses perakitan:
Combination Assembly Line Patern
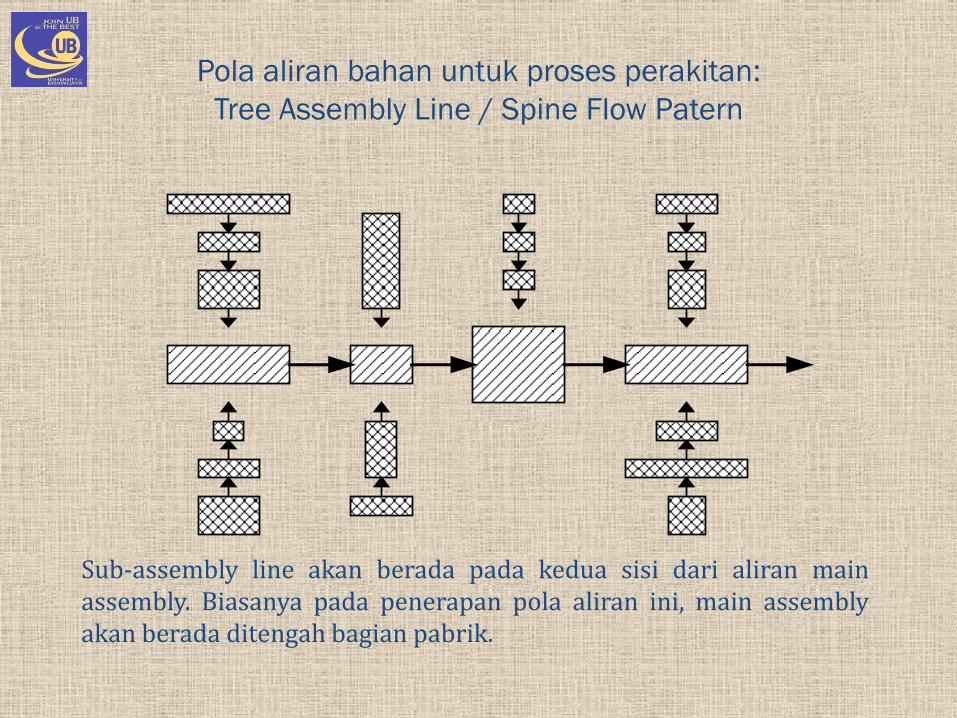
Pola aliran bahan untuk proses perakitan:
Tree Assembly Line / Spine Flow Patern
Sub-assembly line akan berada pada kedua sisi dari aliran main assembly. Biasanya pada penerapan pola aliran ini, main assembly akan berada ditengah bagian pabrik.
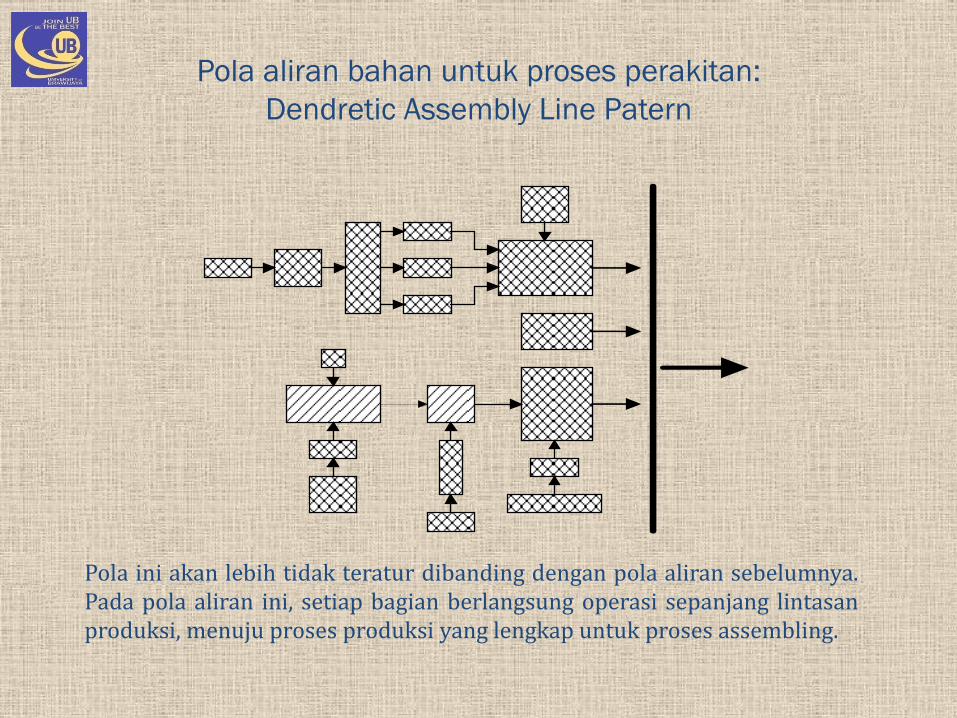
Pola ini akan lebih tidak teratur dibanding dengan pola aliran sebelumnya. Pada pola aliran ini, setiap bagian berlangsung operasi sepanjang lintasan produksi, menuju proses produksi yang lengkap untuk proses assembling.
Pola aliran bahan untuk proses perakitan:
Dendretic Assembly Line Patern
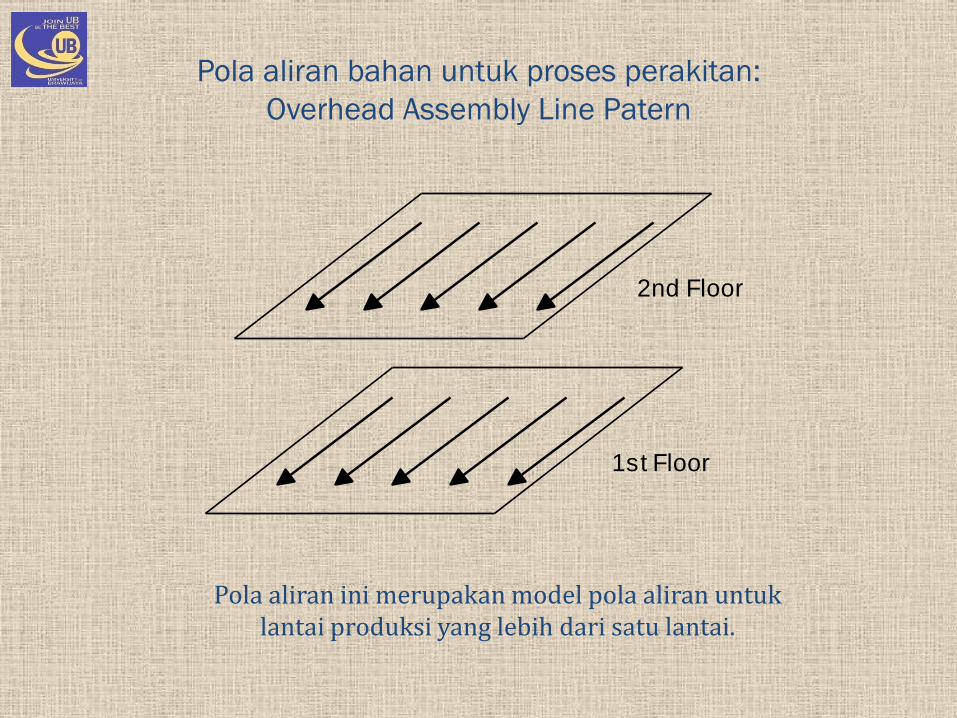
Pola aliran bahan untuk proses perakitan:
Overhead Assembly Line Patern
2nd Floor
1st Floor
Pola aliran ini merupakan model pola aliran untuk lantai produksi yang lebih dari satu lantai.
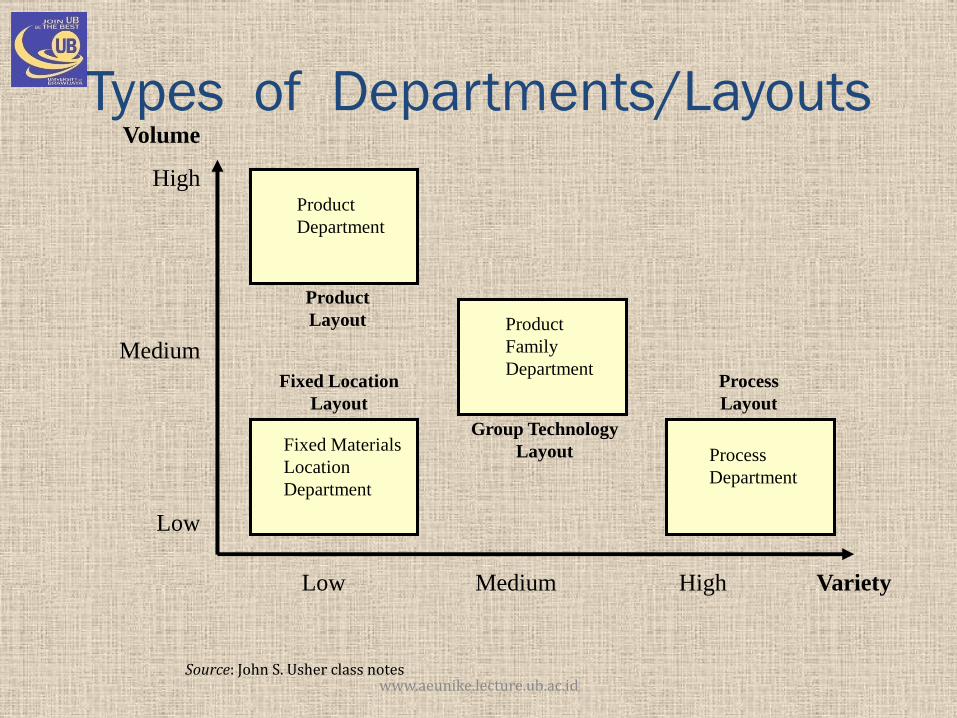
Types of Departments/Layouts Volume
High
Medium
Low
Low Medium High Variety
Product
Department
Fixed Materials
Location
Department
Process
Department
Product
Family
Department
Product
Layout
Fixed Location
Layout
Group Technology
Layout
Process
Layout
Source: John S. Usher class notes www.aeunike.lecture.ub.ac.id
Five types of layout
• Product layout
• Process layout
• Fixed-position layout
• Group-technology layout
• Hybrid layout
www.aeunike.lecture.ub.ac.id
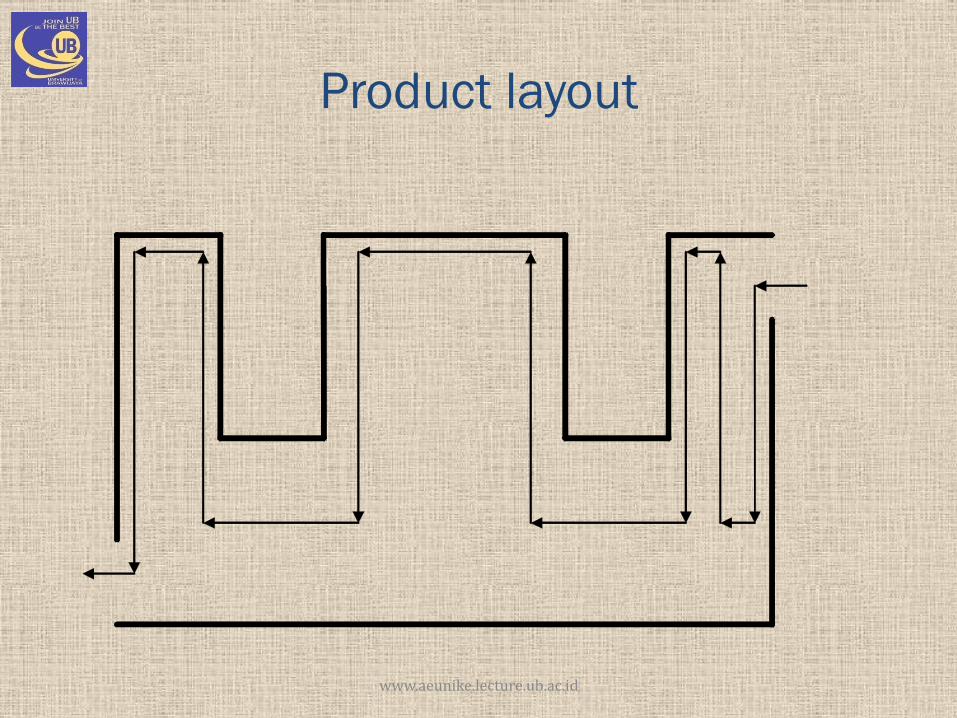
Product layout
www.aeunike.lecture.ub.ac.id
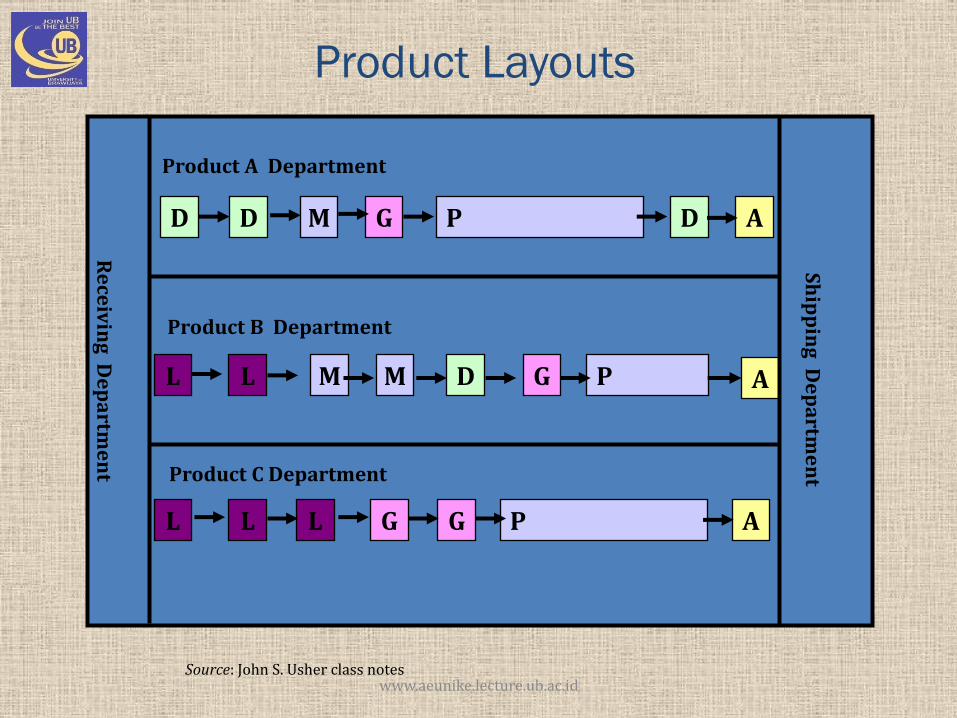
Product Layouts
L
L
L L
L M
M
M
D D
D
D G
G
G
G A
A
Product C Department
Product A Department
P
P
P
Product B Department
A
Sh
ipp
ing
De
pa
rtme
nt
Re
ceiv
ing
De
pa
rtme
nt
Source: John S. Usher class notes www.aeunike.lecture.ub.ac.id
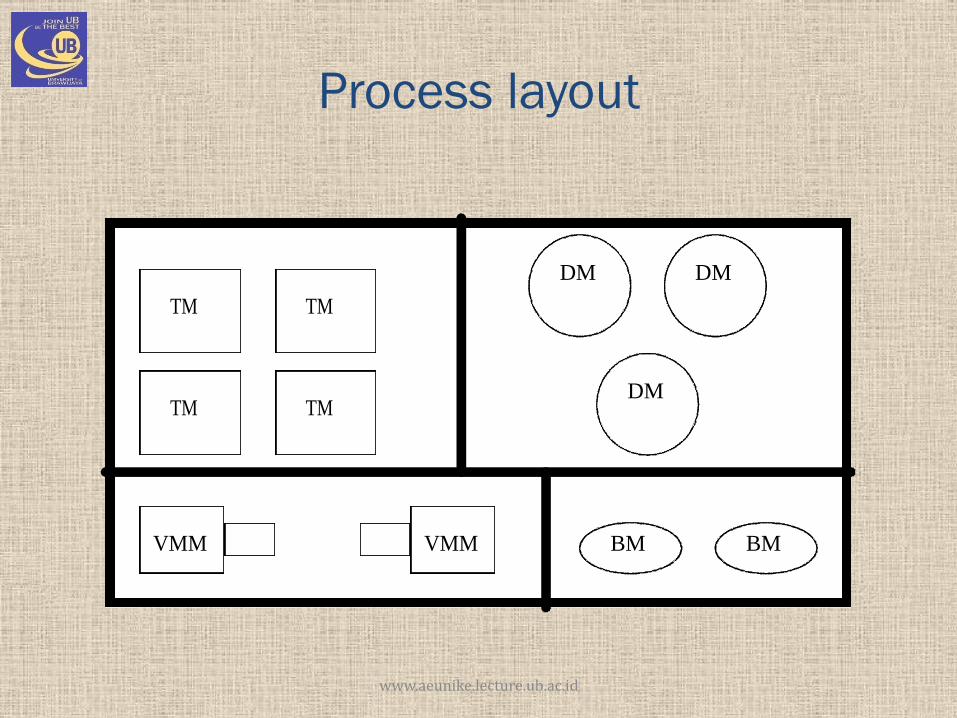
Process layout
TM
TM TM
TM
DM
DM
DM
VMM VMM BM BM
www.aeunike.lecture.ub.ac.id
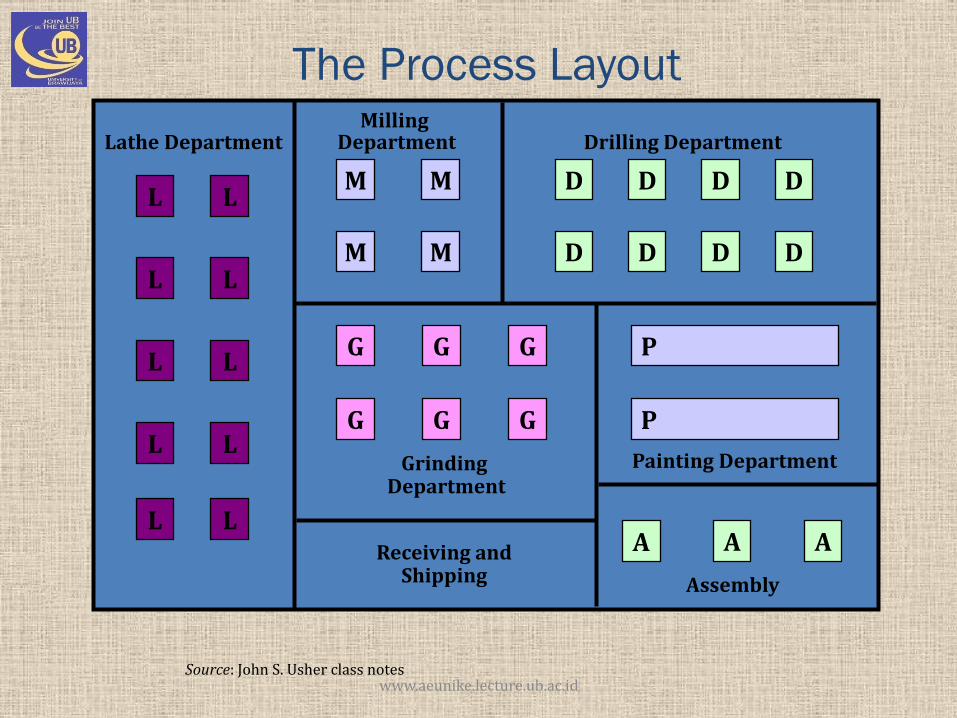
The Process Layout
L
L
L
L
L
L
L
L
L
L M
M
M
M
D
D
D
D
D
D
D
D
G
G
G
G
G
G
A A A Receiving and Shipping Assembly
Painting Department
Lathe Department Milling
Department Drilling Department
Grinding Department
P
P
Source: John S. Usher class notes www.aeunike.lecture.ub.ac.id
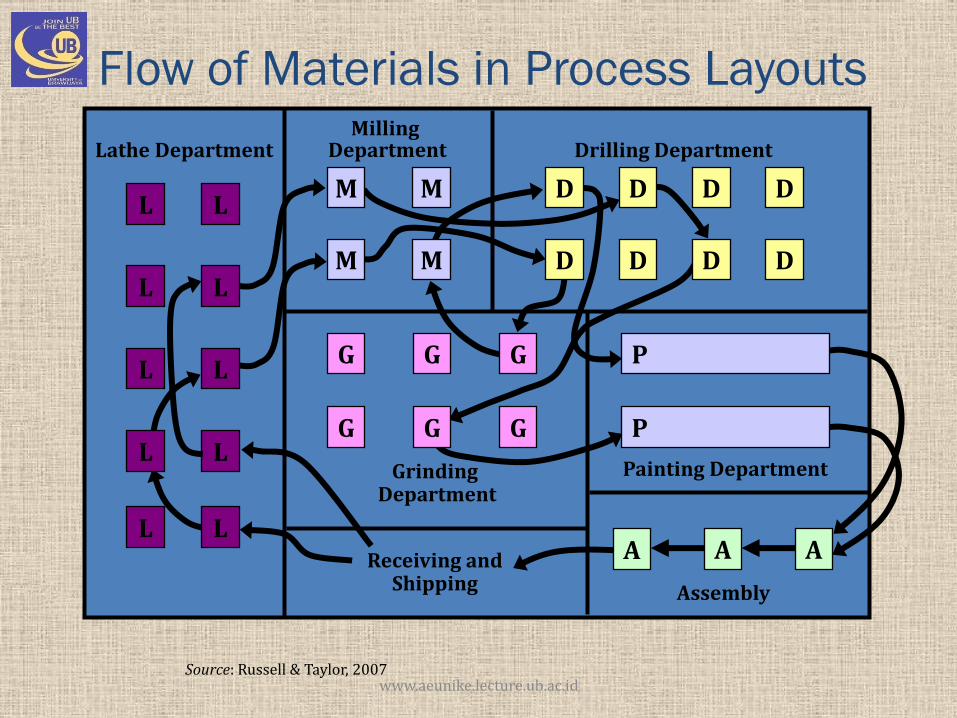
Flow of Materials in Process Layouts
L
L
L
L
L
L
L
L
L
L M
M
M
M
D
D
D
D
D
D
D
D
G
G
G
G
G
G
A A A Receiving and Shipping Assembly
Painting Department
Lathe Department Milling
Department Drilling Department
Grinding Department
P
P
Source: Russell & Taylor, 2007 www.aeunike.lecture.ub.ac.id
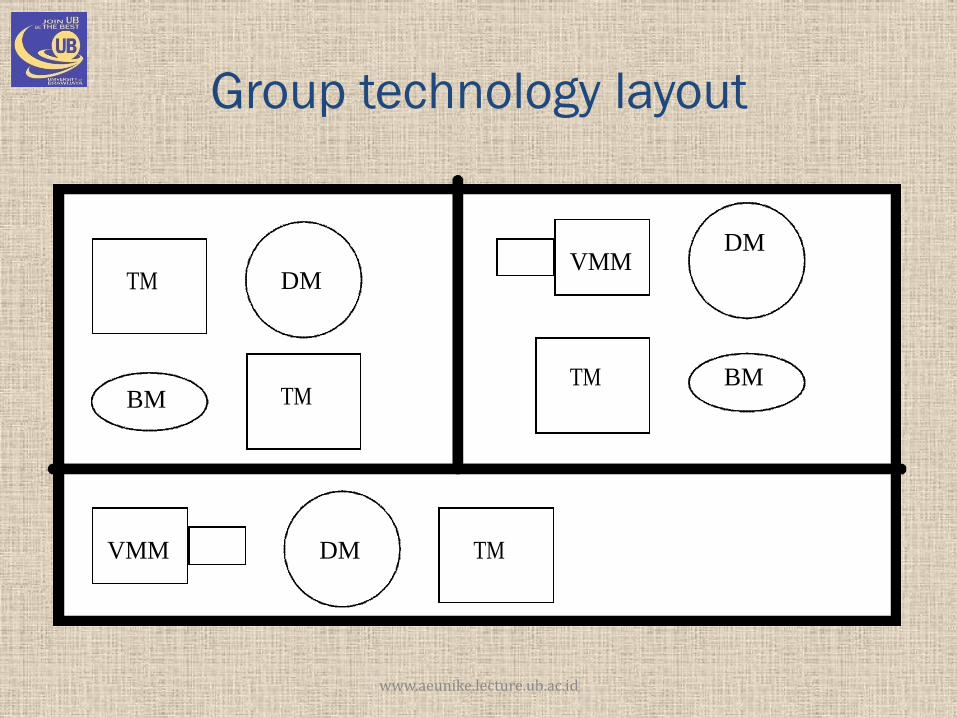
Group technology layout
TM
TM
TM
TM
DM
DM
DM
VMM
VMM
BM BM
www.aeunike.lecture.ub.ac.id
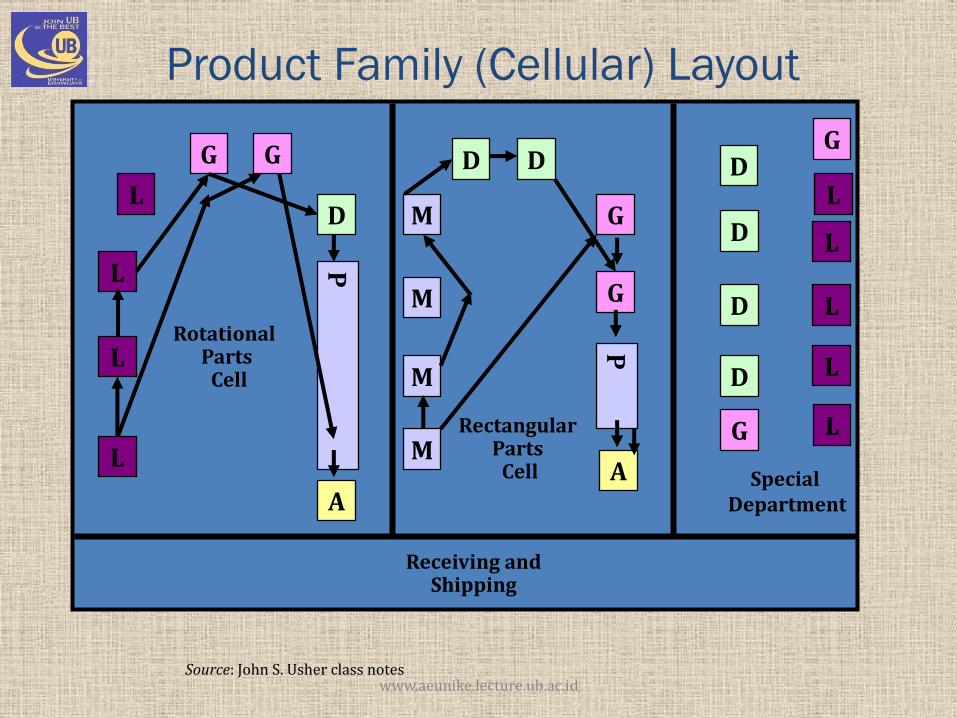
Product Family (Cellular) Layout
L
L
L
L
L
L
L
L
L M
M
M
M
D D
D D
D
D
D
G
G
G G
G
G
A A
Receiving and Shipping
Special Department
Rotational Parts Cell
P
P
Rectangular Parts Cell
Source: John S. Usher class notes www.aeunike.lecture.ub.ac.id
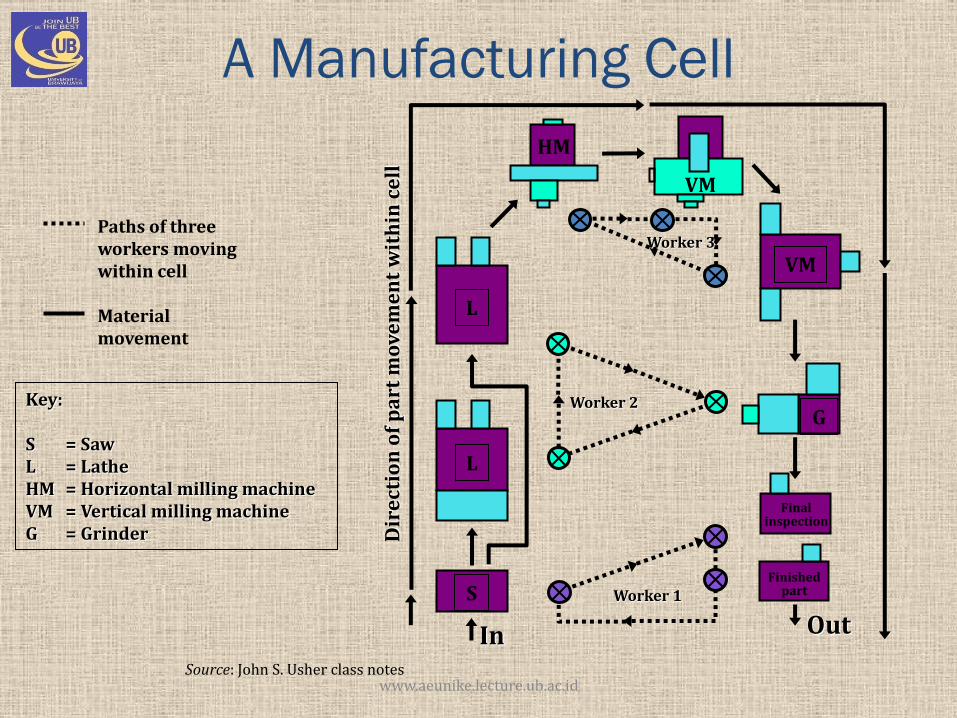
A Manufacturing Cell
Key: S = Saw L = Lathe HM = Horizontal milling machine VM = Vertical milling machine G = Grinder
Paths of three workers moving within cell Material movement
In Out Worker 1
Worker 2
Worker 3
Dir
ect
ion
of
pa
rt m
ov
em
en
t w
ith
in c
ell
S
L
HM
VM
G
VM
L
Final inspection
Finished part
Source: John S. Usher class notes www.aeunike.lecture.ub.ac.id
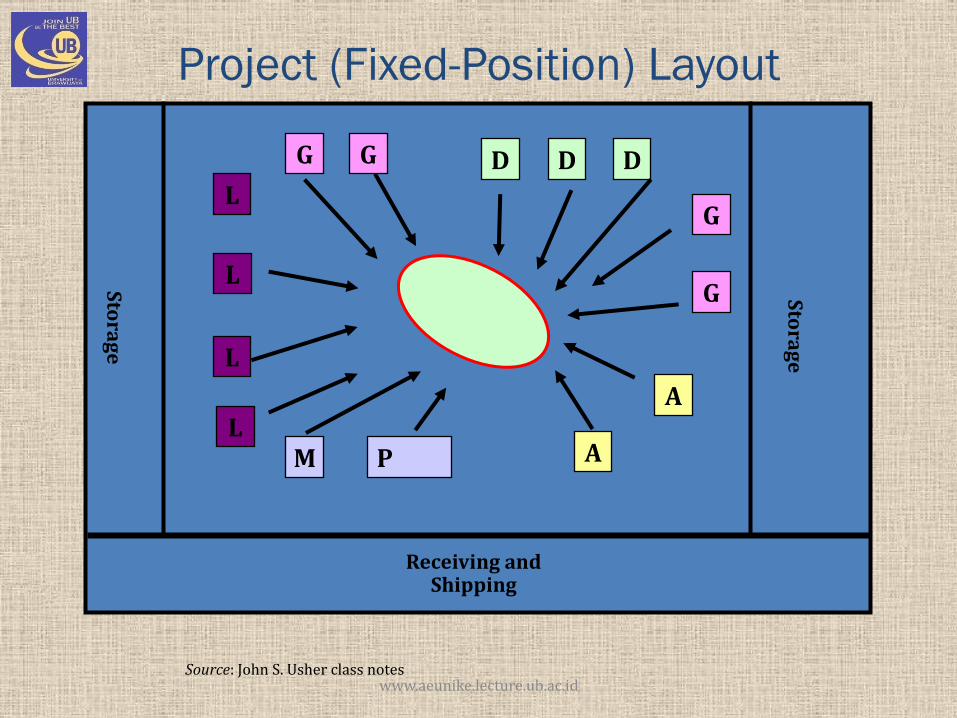
Project (Fixed-Position) Layout
L
L
L
L
M
D D D
G
G G
G
A
A
Receiving and Shipping
P
Sto
rag
e
Sto
rag
e
Source: John S. Usher class notes www.aeunike.lecture.ub.ac.id
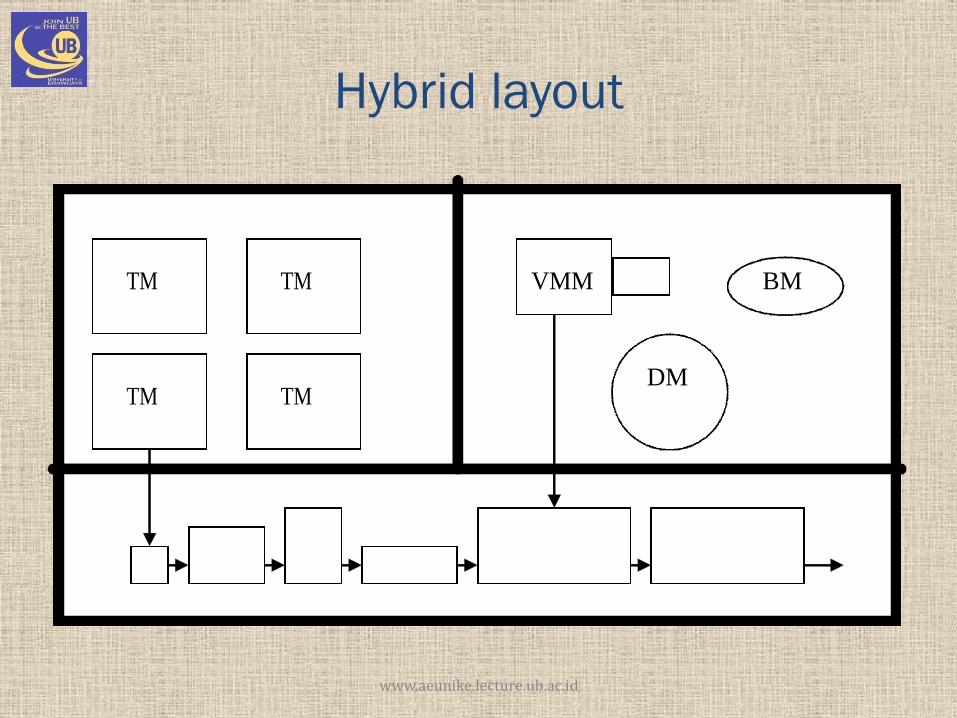
Hybrid layout
TM
TM TM
TM
DM
VMM BM
www.aeunike.lecture.ub.ac.id
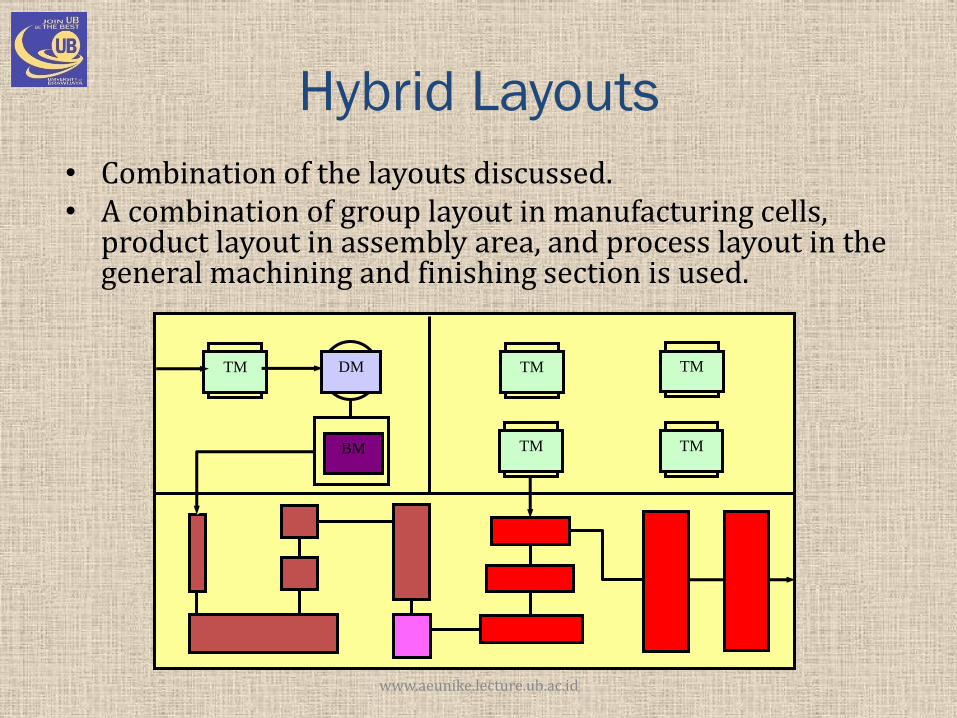
Hybrid Layouts
• Combination of the layouts discussed. • A combination of group layout in manufacturing cells,
product layout in assembly area, and process layout in the general machining and finishing section is used.
TM
TM TM
TM TM DM
BM
www.aeunike.lecture.ub.ac.id
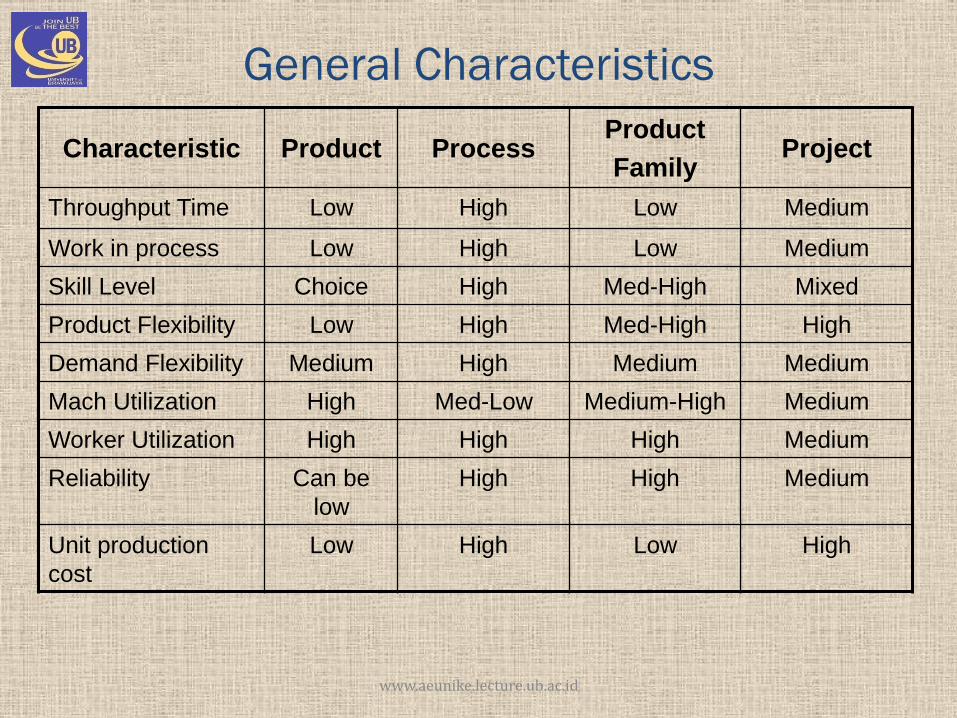
General Characteristics
Characteristic Product Process Product
Family Project
Throughput Time Low High Low Medium
Work in process Low High Low Medium
Skill Level Choice High Med-High Mixed
Product Flexibility Low High Med-High High
Demand Flexibility Medium High Medium Medium
Mach Utilization High Med-Low Medium-High Medium
Worker Utilization High High High Medium
Reliability Can be
low
High High Medium
Unit production
cost
Low High Low High
www.aeunike.lecture.ub.ac.id
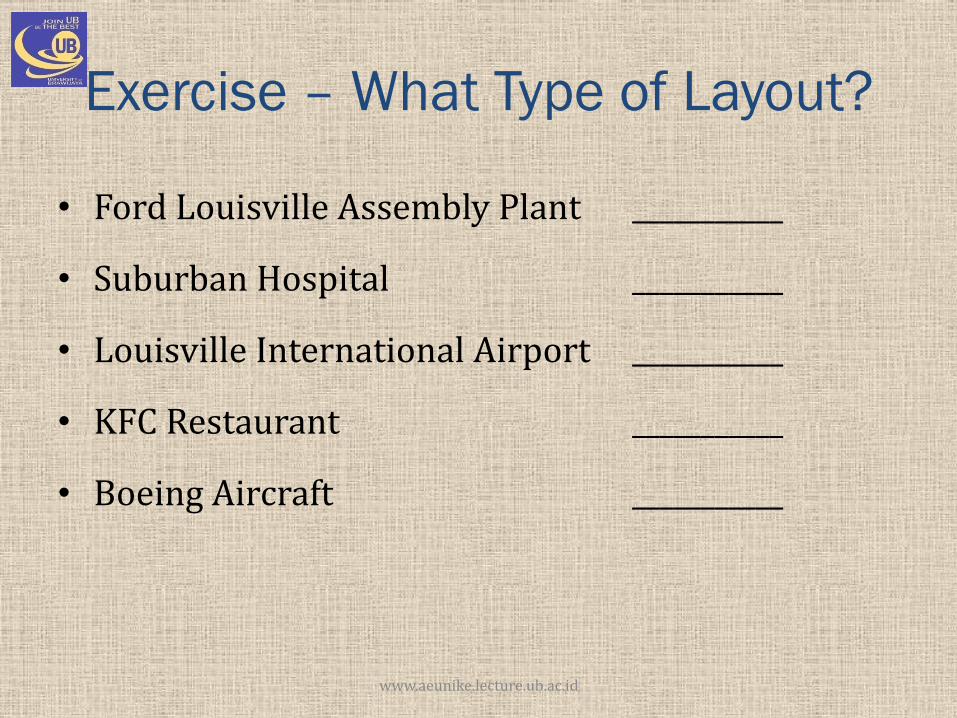
Exercise – What Type of Layout?
• Ford Louisville Assembly Plant ___________
• Suburban Hospital ___________
• Louisville International Airport ___________
• KFC Restaurant ___________
• Boeing Aircraft ___________
www.aeunike.lecture.ub.ac.id
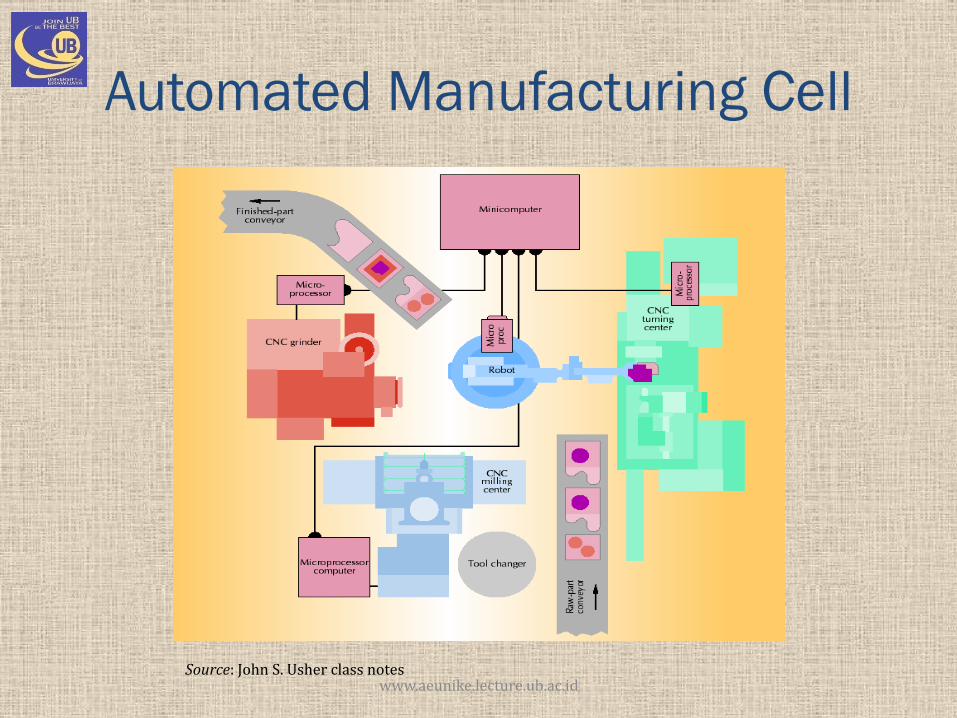
Automated Manufacturing Cell
Source: John S. Usher class notes www.aeunike.lecture.ub.ac.id
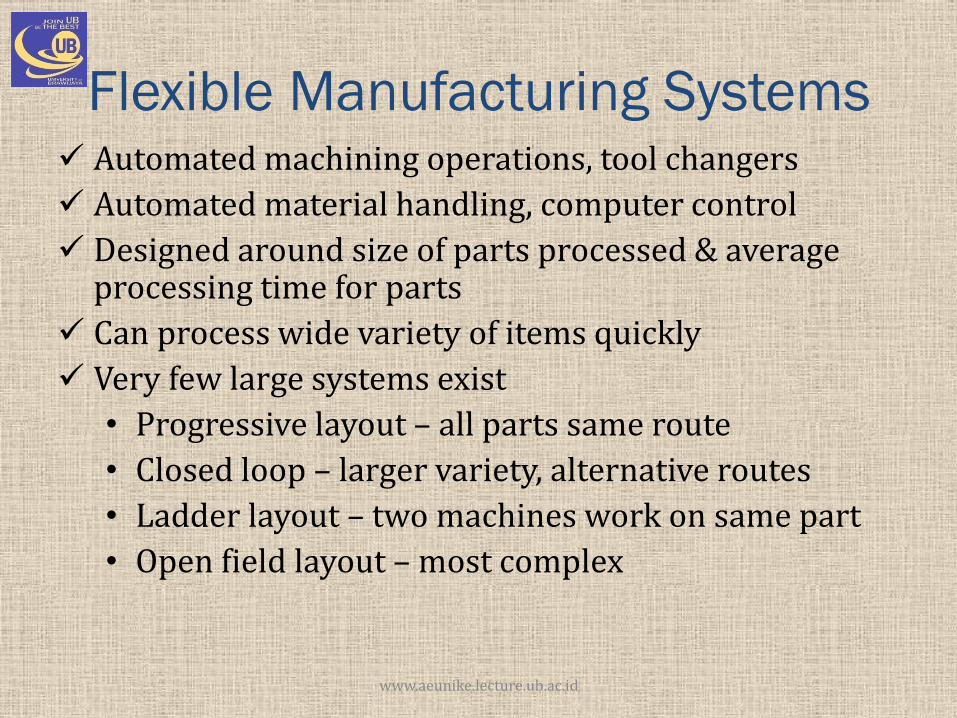
Flexible Manufacturing Systems Automated machining operations, tool changers
Automated material handling, computer control
Designed around size of parts processed & average processing time for parts
Can process wide variety of items quickly
Very few large systems exist
• Progressive layout – all parts same route
• Closed loop – larger variety, alternative routes
• Ladder layout – two machines work on same part
• Open field layout – most complex
www.aeunike.lecture.ub.ac.id
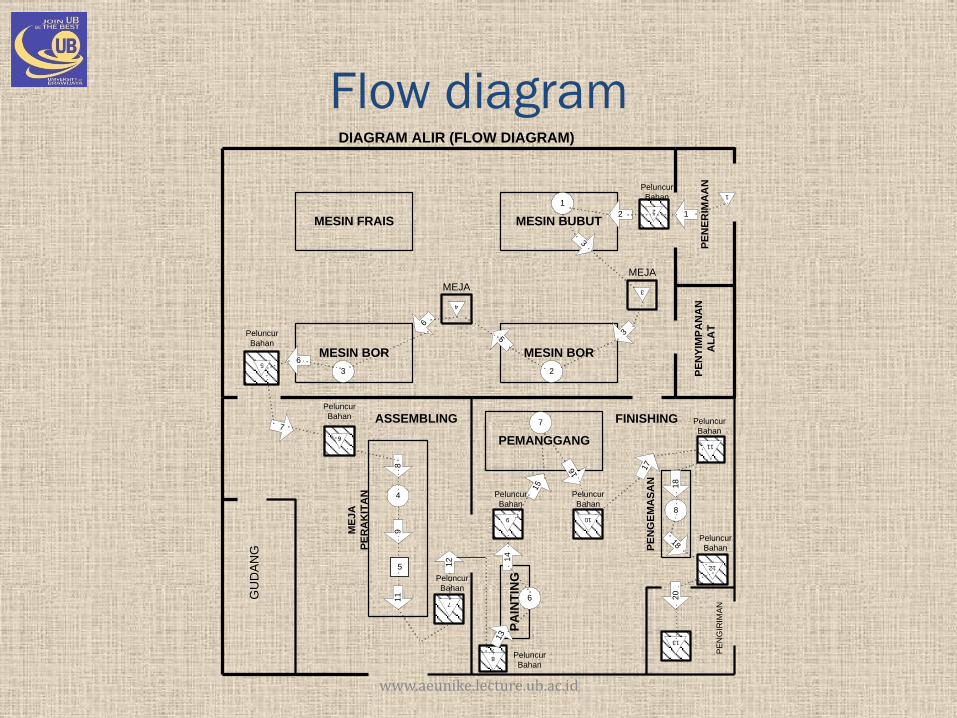
Flow diagram
www.aeunike.lecture.ub.ac.id
MESIN FRAIS MESIN BUBUT
MESIN BORMESIN BOR
MEJA
PE
NE
RIM
AA
NP
EN
YIM
PA
NA
N
AL
AT
ME
JA
PE
RA
KIT
AN
Peluncur
Bahan
Peluncur
Bahan
PEMANGGANG
PA
INT
ING
PE
NG
EM
AS
AN
Peluncur
Bahan
Peluncur
Bahan
Peluncur
Bahan
Peluncur
Bahan
Peluncur
Bahan
Peluncur
Bahan
Peluncur
Bahan
1
1
2
2
1
3
MEJA
3
3
2
5
4
6
3
65
7
6
8
4
9
5
11
7
12
8
13
6
14
9
15
7
10
16 1
7
11
18
8
18
12
20
13
PE
NG
IRIM
AN
FINISHINGASSEMBLING
GU
DA
NG
DIAGRAM ALIR (FLOW DIAGRAM)
FLOW PLANNING
www.aeunike.lecture.ub.ac.id
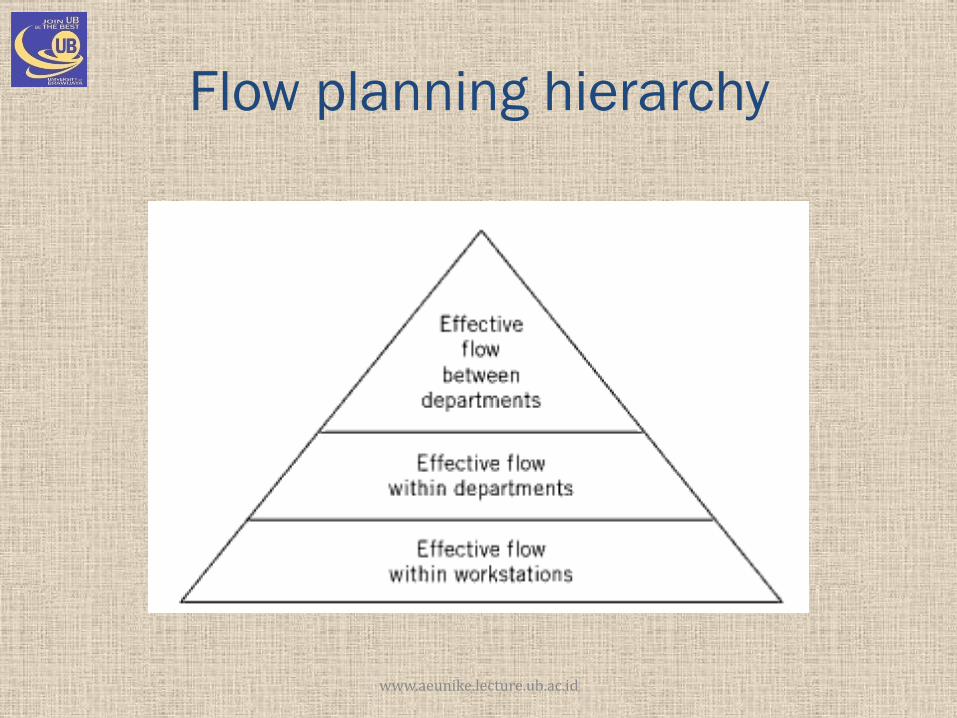
Flow planning hierarchy
www.aeunike.lecture.ub.ac.id
Flow Measurement
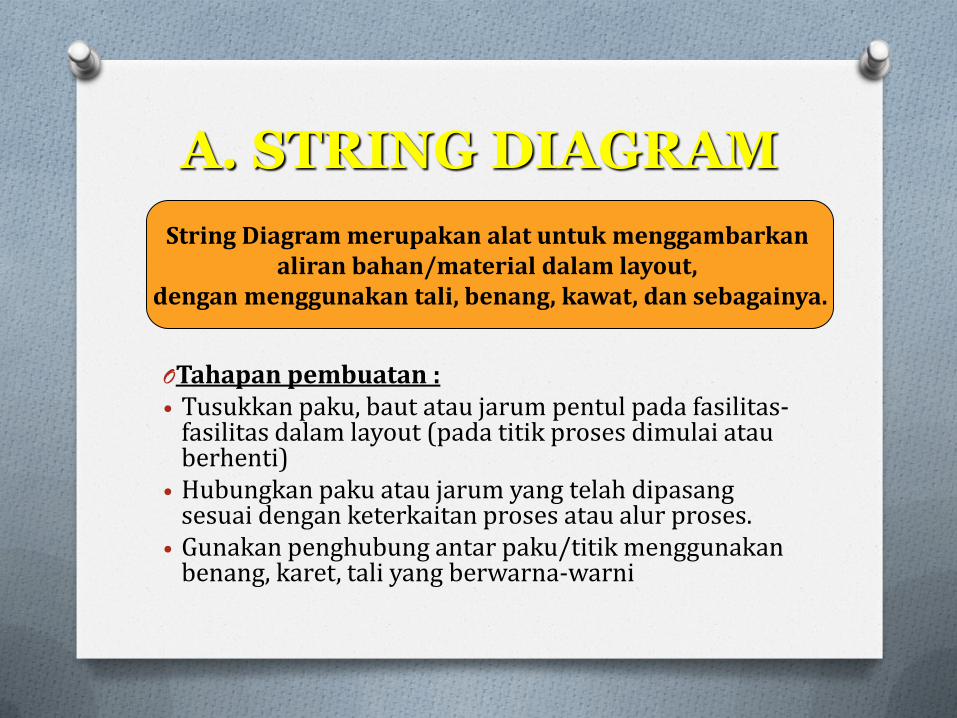
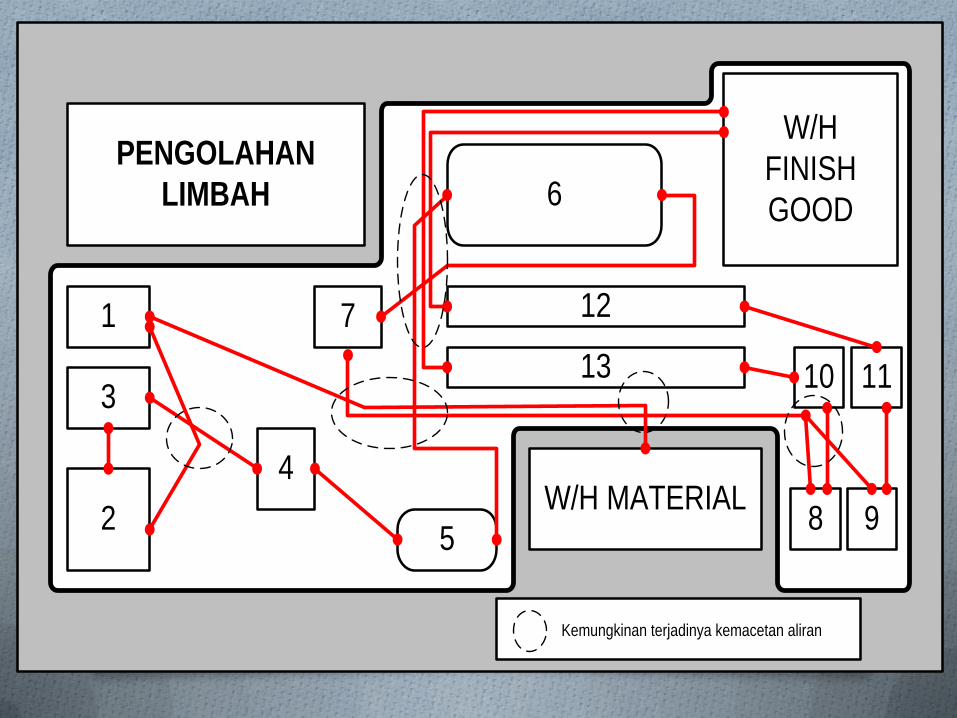
String Diagram merupakan alat untuk menggambarkan aliran bahan/material dalam layout,
dengan menggunakan tali, benang, kawat, dan sebagainya.
A. STRING DIAGRAM
OTahapan pembuatan : • Tusukkan paku, baut atau jarum pentul pada fasilitas-
fasilitas dalam layout (pada titik proses dimulai atau berhenti)
• Hubungkan paku atau jarum yang telah dipasang sesuai dengan keterkaitan proses atau alur proses.
• Gunakan penghubung antar paku/titik menggunakan benang, karet, tali yang berwarna-warni
1
3
2
7
W/H
FINISH
GOOD
5
6
W/H MATERIAL8 9
10 11
12
13
4
PENGOLAHAN
LIMBAH
Kemungkinan terjadinya kemacetan aliran
B. FROM TO CHART
O Dikenal juga sebagai Travel Chart O Suatu teknik konvensional yang umum
digunakan untuk perencanaan tata letak pabrik dan pemindahan bahan dalam suatu proses produksi.
O Sangat berguna dalam menganalisa aliran bahan pada proses dengan banyak item yang mengalir melalui suatu area.
O Teknik ini akan menunjukkan total berat beban yang harus dipindahkan, jarak perpindahan dan volume perpindahan
LANGKAH PENYELESAIAN
PRODUK VOLUME OF HANDLING
% VOLUME OF
HANDLING
ALUR PROSES
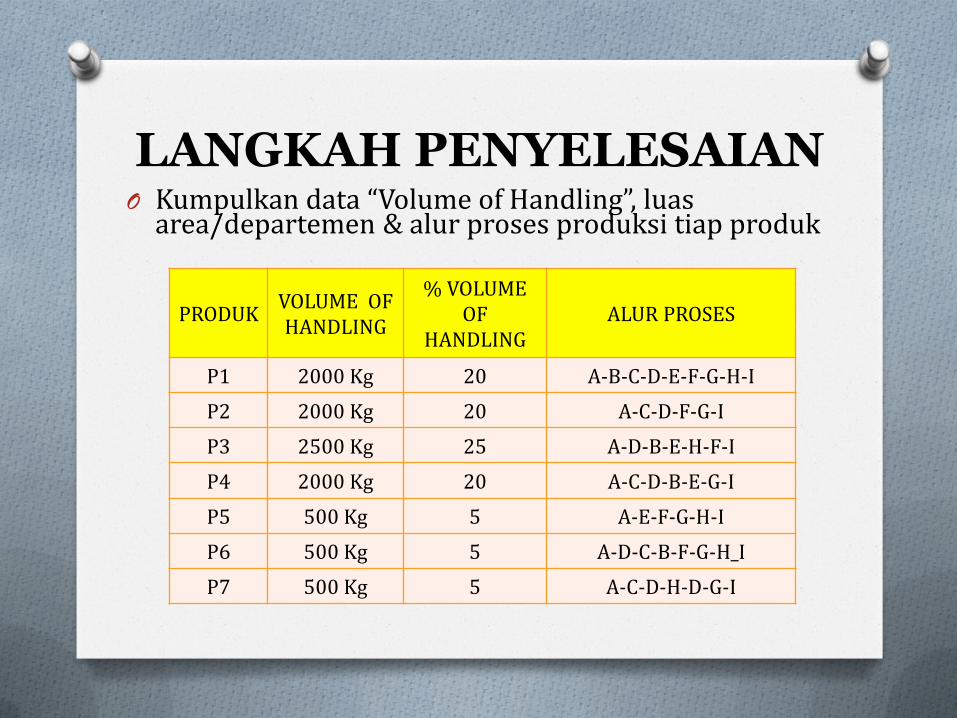
P1 2000 Kg 20 A-B-C-D-E-F-G-H-I
P2 2000 Kg 20 A-C-D-F-G-I
P3 2500 Kg 25 A-D-B-E-H-F-I
P4 2000 Kg 20 A-C-D-B-E-G-I
P5 500 Kg 5 A-E-F-G-H-I
P6 500 Kg 5 A-D-C-B-F-G-H_I
P7 500 Kg 5 A-C-D-H-D-G-I
O Kumpulkan data “Volume of Handling”, luas area/departemen & alur proses produksi tiap produk
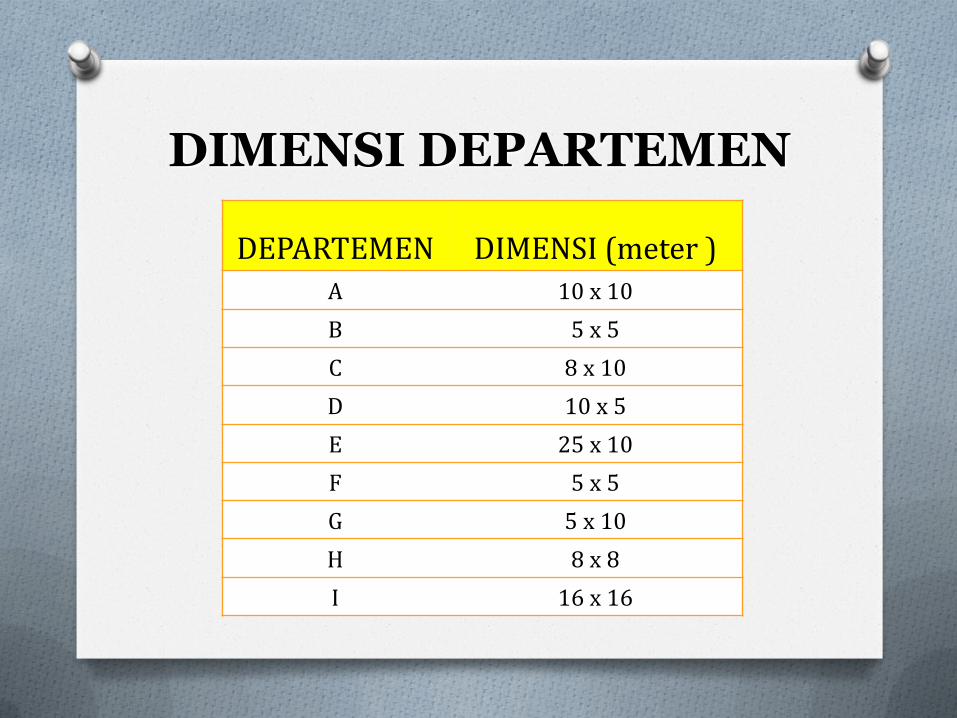
DIMENSI DEPARTEMEN
DEPARTEMEN DIMENSI (meter )
A 10 x 10
B 5 x 5
C 8 x 10
D 10 x 5
E 25 x 10
F 5 x 5
G 5 x 10
H 8 x 8
I 16 x 16
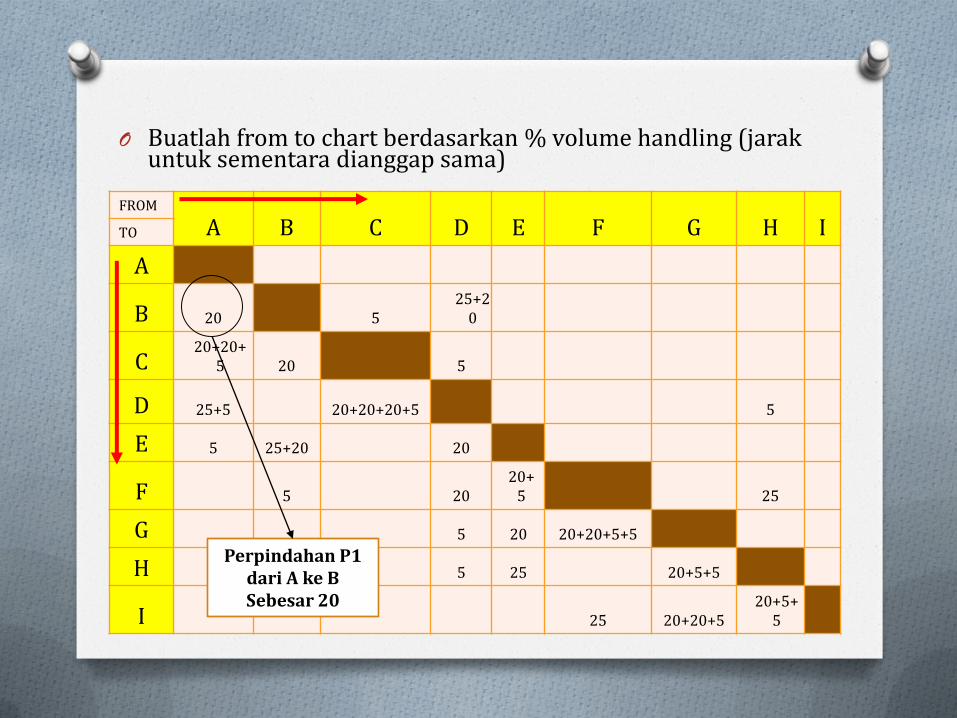
O Buatlah from to chart berdasarkan % volume handling (jarak untuk sementara dianggap sama)
FROM
A B C D E F G H I TO
A
B 20 5
25+20
C 20+20+
5 20 5
D 25+5 20+20+20+5 5
E 5 25+20 20
F 5 20
20+5 25
G 5 20 20+20+5+5
H 5 25 20+5+5
I 25 20+20+5
20+5+5
Perpindahan P1 dari A ke B Sebesar 20
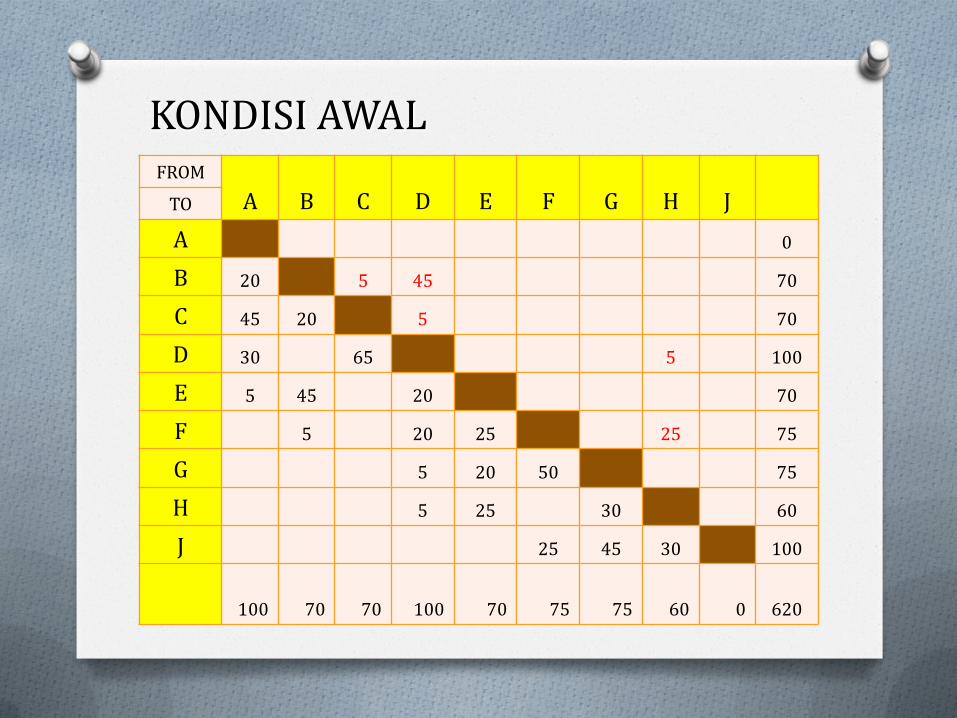
FROM
A B C D E F G H J TO
A 0
B 20 5 45 70
C 45 20 5 70
D 30 65 5 100
E 5 45 20 70
F 5 20 25 25 75
G 5 20 50 75
H 5 25 30 60
J 25 45 30 100
100 70 70 100 70 75 75 60 0 620
KONDISI AWAL
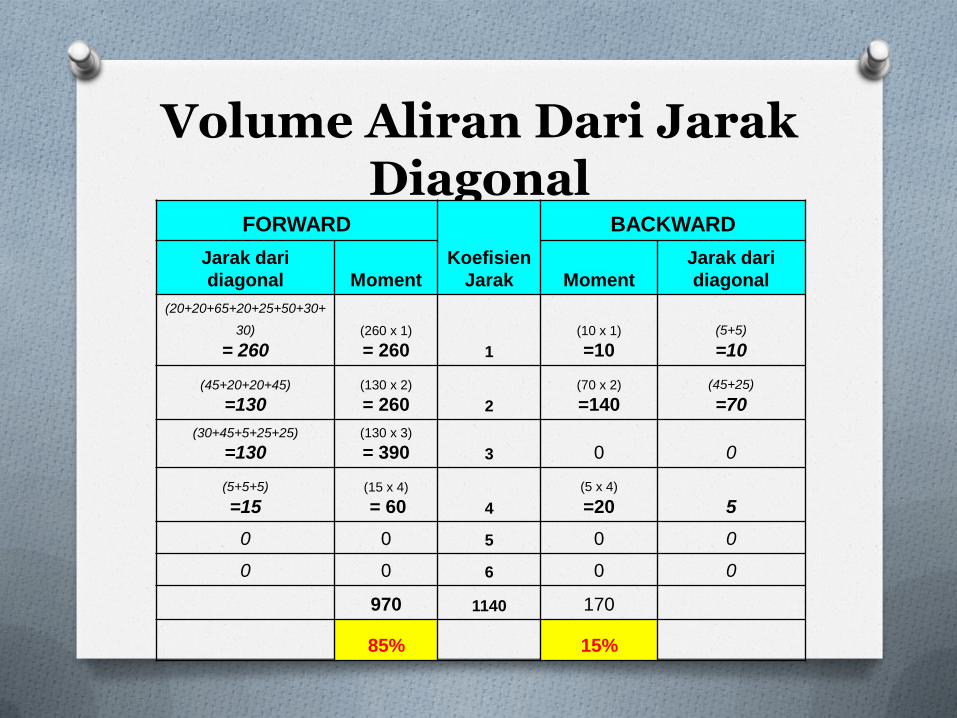
Volume Aliran Dari Jarak Diagonal
FORWARD
Koefisien
Jarak
BACKWARD
Jarak dari
diagonal Moment Moment
Jarak dari
diagonal
(20+20+65+20+25+50+30+
30)
= 260 (260 x 1)
= 260 1
(10 x 1)
=10 (5+5)
=10
(45+20+20+45)
=130 (130 x 2)
= 260 2
(70 x 2)
=140 (45+25)
=70
(30+45+5+25+25)
=130 (130 x 3)
= 390 3 0 0
(5+5+5)
=15 (15 x 4)
= 60 4
(5 x 4)
=20 5
0 0 5 0 0
0 0 6 0 0
970 1140 170
85% 15%
BACK TRACKING
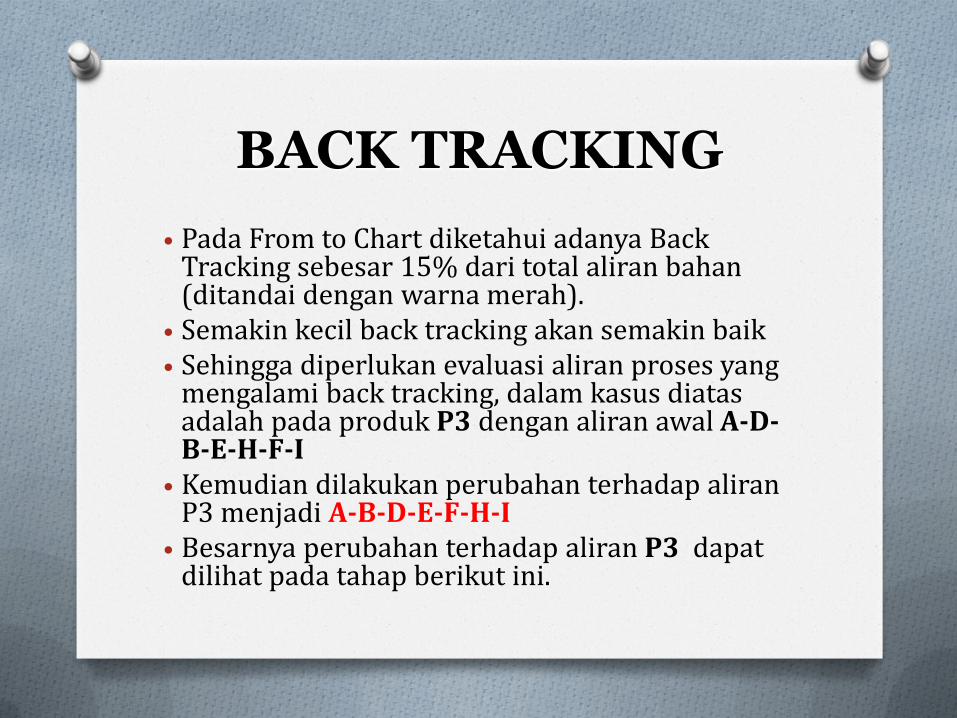
• Pada From to Chart diketahui adanya Back Tracking sebesar 15% dari total aliran bahan (ditandai dengan warna merah).
• Semakin kecil back tracking akan semakin baik • Sehingga diperlukan evaluasi aliran proses yang
mengalami back tracking, dalam kasus diatas adalah pada produk P3 dengan aliran awal A-D-B-E-H-F-I
• Kemudian dilakukan perubahan terhadap aliran P3 menjadi A-B-D-E-F-H-I
• Besarnya perubahan terhadap aliran P3 dapat dilihat pada tahap berikut ini.
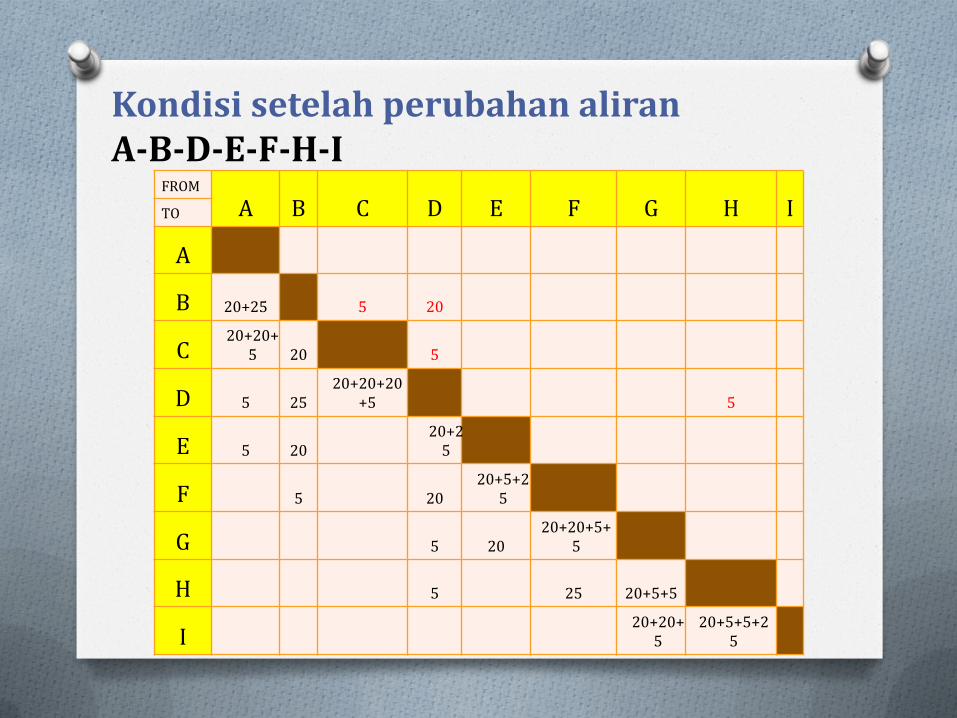
FROM
A B C D E F G H I TO
A
B 20+25 5 20
C 20+20+
5 20 5
D 5 25
20+20+20+5 5
E 5 20 20+2
5
F 5 20
20+5+25
G 5 20
20+20+5+5
H 5 25 20+5+5
I 20+20+
5
20+5+5+25
Kondisi setelah perubahan aliran A-B-D-E-F-H-I
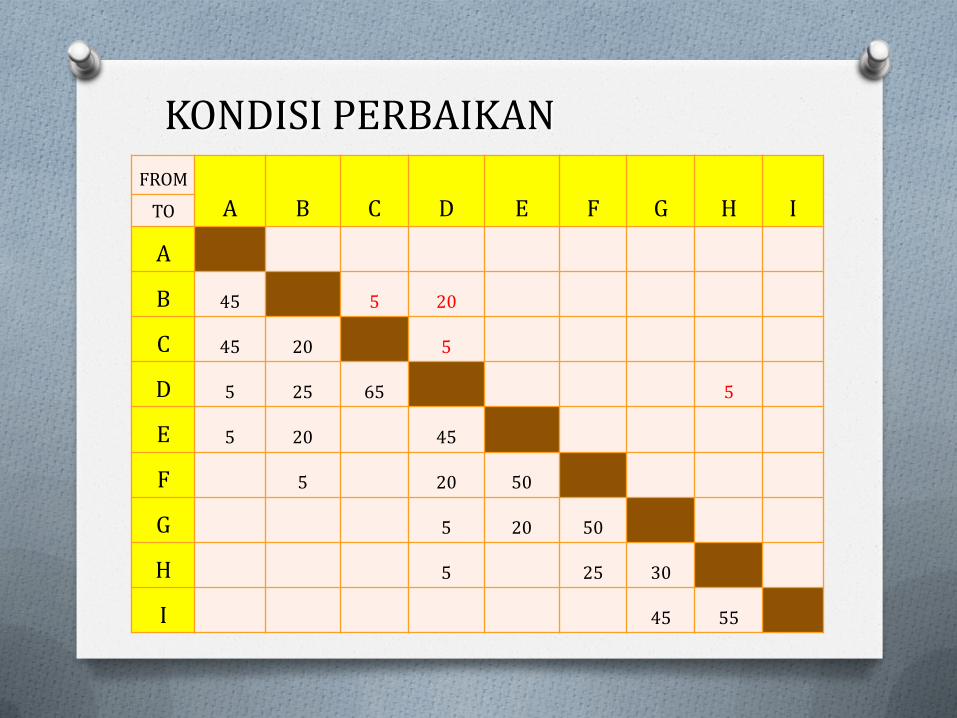
FROM
A B C D E F G H I TO
A
B 45 5 20
C 45 20 5
D 5 25 65 5
E 5 20 45
F 5 20 50
G 5 20 50
H 5 25 30
I 45 55
KONDISI PERBAIKAN
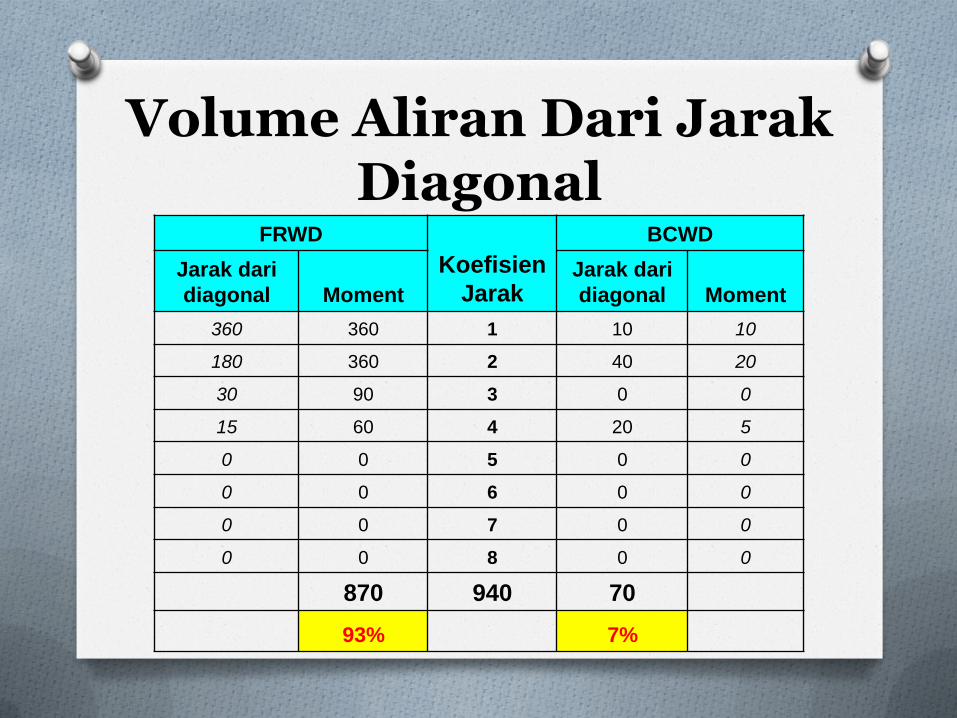
Volume Aliran Dari Jarak Diagonal
FRWD
Koefisien
Jarak
BCWD
Jarak dari
diagonal Moment
Jarak dari
diagonal Moment
360 360 1 10 10
180 360 2 40 20
30 90 3 0 0
15 60 4 20 5
0 0 5 0 0
0 0 6 0 0
0 0 7 0 0
0 0 8 0 0
870 940 70
93% 7%
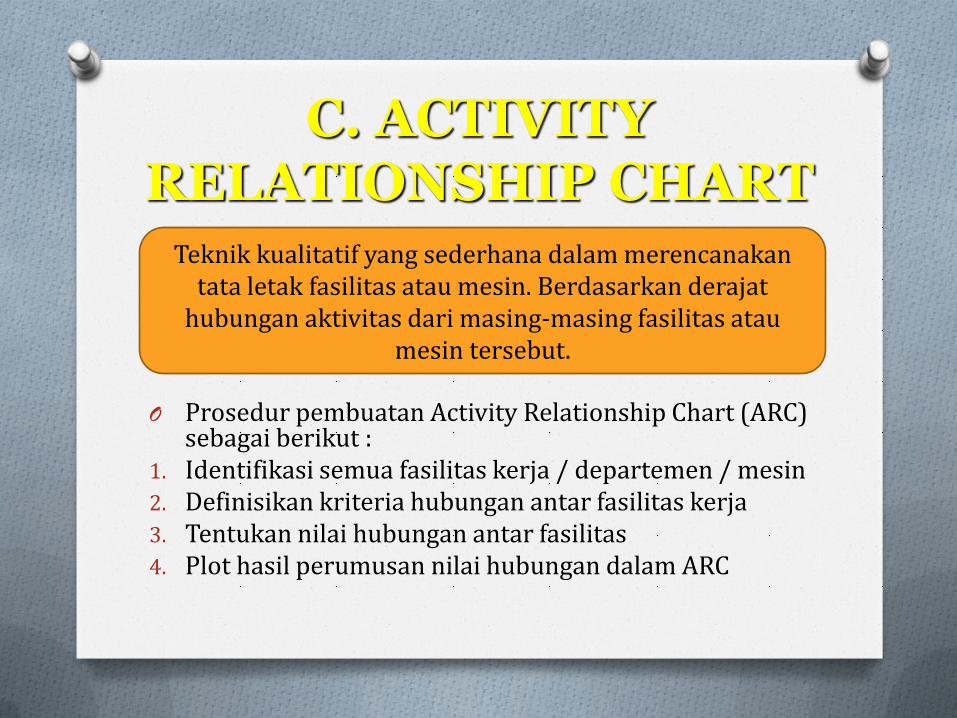
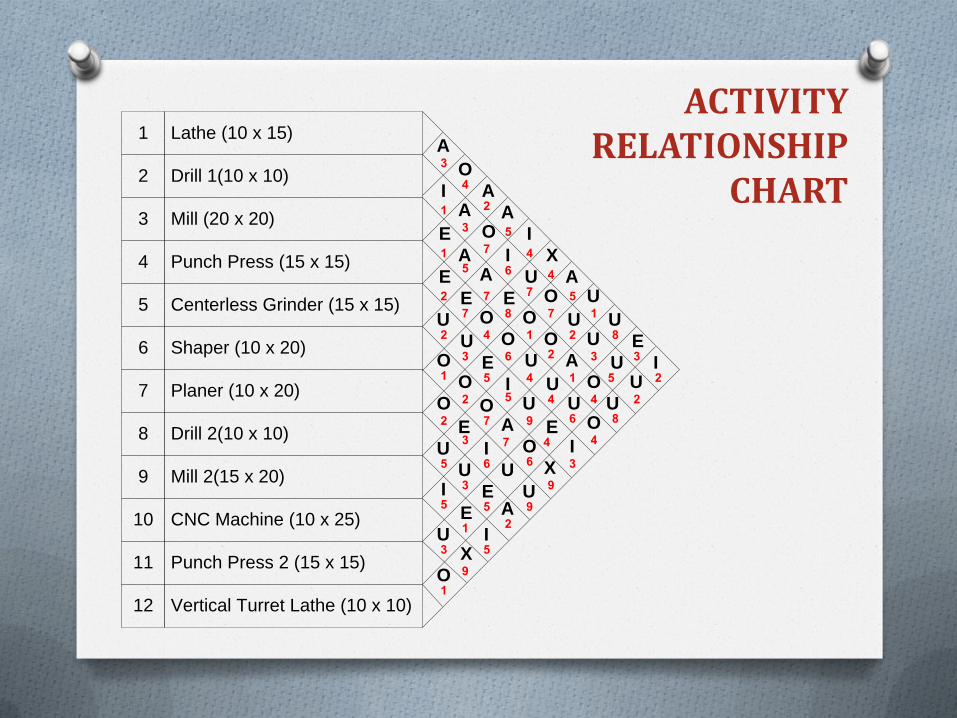
C. ACTIVITY RELATIONSHIP CHART
O Prosedur pembuatan Activity Relationship Chart (ARC) sebagai berikut :
1. Identifikasi semua fasilitas kerja / departemen / mesin 2. Definisikan kriteria hubungan antar fasilitas kerja 3. Tentukan nilai hubungan antar fasilitas 4. Plot hasil perumusan nilai hubungan dalam ARC
Teknik kualitatif yang sederhana dalam merencanakan tata letak fasilitas atau mesin. Berdasarkan derajat
hubungan aktivitas dari masing-masing fasilitas atau mesin tersebut.
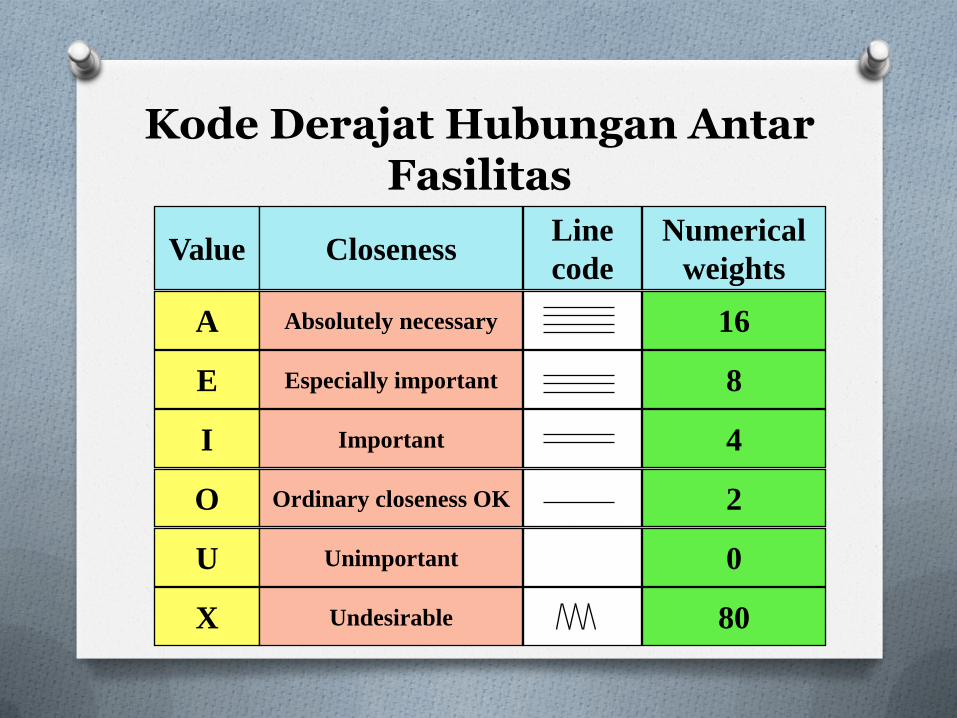
Kode Derajat Hubungan Antar Fasilitas
Value
A
E
I
O
U
X
Closeness Line
code
Numerical
weights
Absolutely necessary
Especially important
Important
Ordinary closeness OK
Unimportant
Undesirable
16
8
4
2
0
80
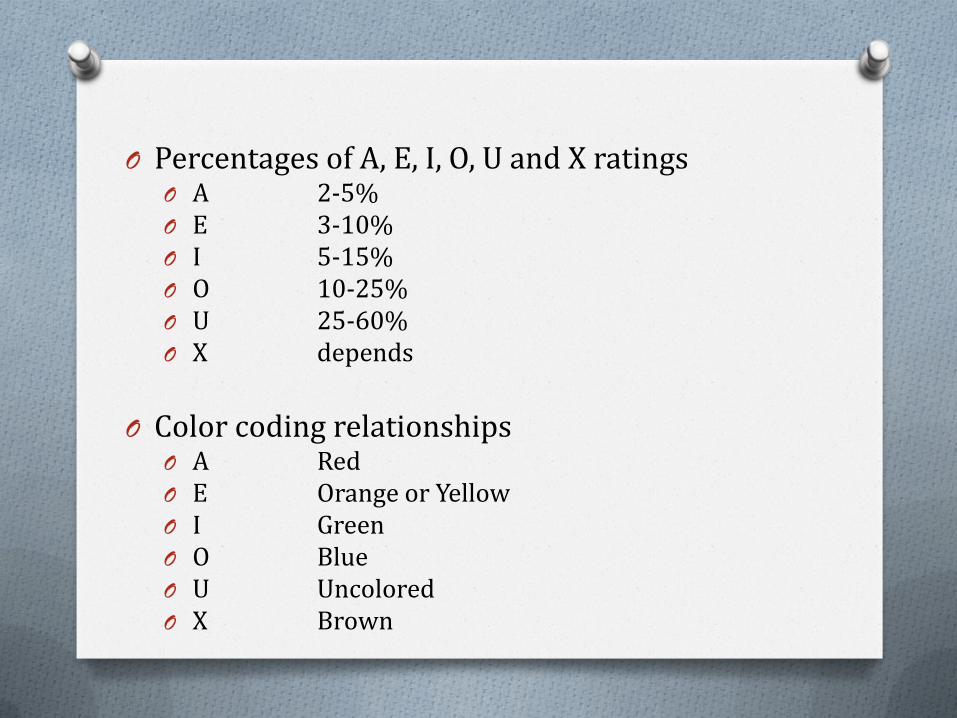
O Percentages of A, E, I, O, U and X ratings O A 2-5% O E 3-10% O I 5-15% O O 10-25% O U 25-60% O X depends
O Color coding relationships
O A Red O E Orange or Yellow O I Green O O Blue O U Uncolored O X Brown
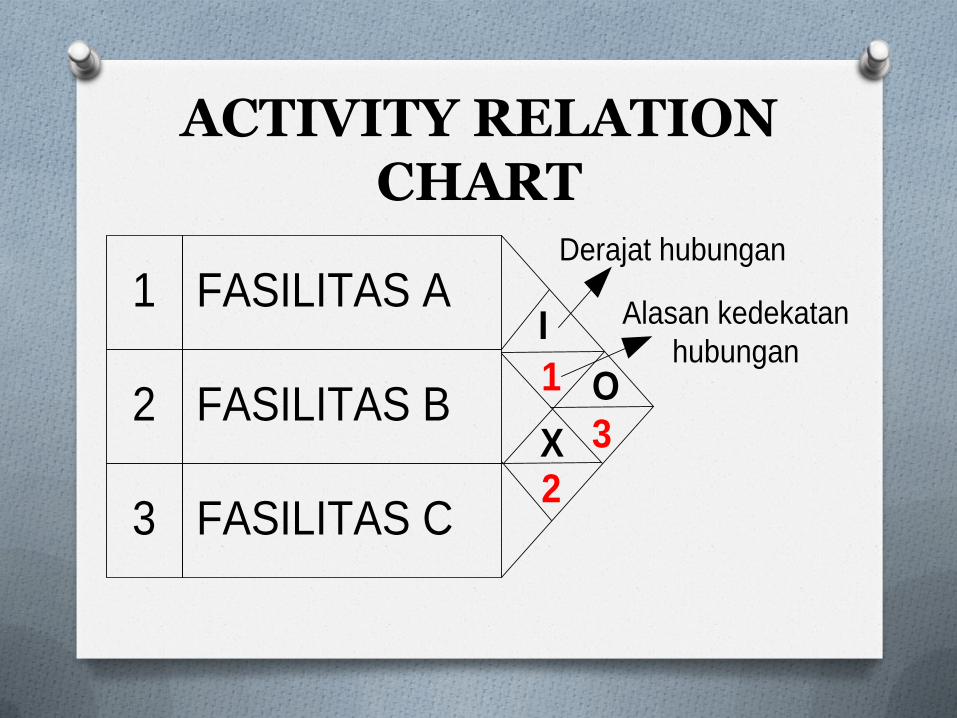
I
X
O
FASILITAS A
FASILITAS B
FASILITAS C
1
2
3
1
3
2
Derajat hubungan
Alasan kedekatan
hubungan
ACTIVITY RELATION CHART
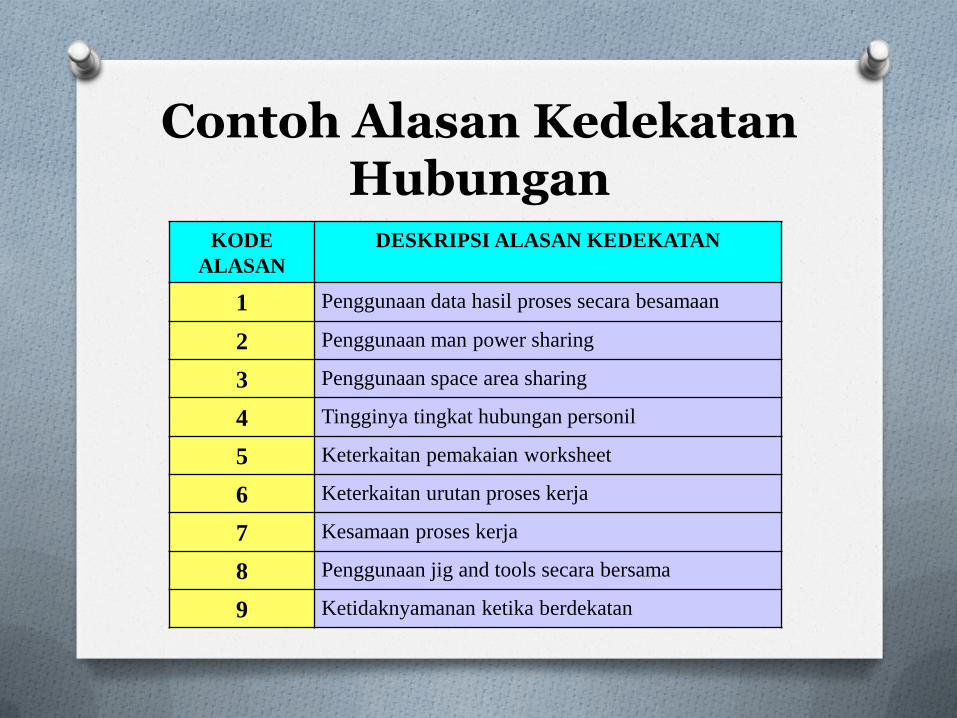
Contoh Alasan Kedekatan Hubungan
KODE
ALASAN
DESKRIPSI ALASAN KEDEKATAN
1 Penggunaan data hasil proses secara besamaan
2 Penggunaan man power sharing
3 Penggunaan space area sharing
4 Tingginya tingkat hubungan personil
5 Keterkaitan pemakaian worksheet
6 Keterkaitan urutan proses kerja
7 Kesamaan proses kerja
8 Penggunaan jig and tools secara bersama
9 Ketidaknyamanan ketika berdekatan
A
I
E
E
U
O
O
U
I
U
O
O
A
A
E
U
O
E
U
E
X
A
O
A
O
E
O
I
E
I
A
I
E
O
I
A
U
A
I
U
O
U
U
O
U
X
O
O
U
E
X
A
U
A
U
I
U
O
O
U
U
U
U
E
UI
CNC Machine (10 x 25)
Punch Press 2 (15 x 15)
Vertical Turret Lathe (10 x 10)
Lathe (10 x 15)
Drill 1(10 x 10)
Mill (20 x 20)
Punch Press (15 x 15)
Centerless Grinder (15 x 15)
Shaper (10 x 20)
Planer (10 x 20)
Drill 2(10 x 10)
Mill 2(15 x 20)
10
11
12
1
2
3
4
5
6
7
8
9
3
4
2
1
3
7
1
5
4
2 7
4
6
5
8 1
2 4
6 2
1
1 5
3
14
9
2
2
3
44
8
2
7
7
2
2
4
3
5
7 4
6 8
9
36
9
1
7
3
6
5
2
9
5
1
5
3
3
5
5
5
7
ACTIVITY RELATIONSHIP
CHART
SPACE REQUIREMENT
www.aeunike.lecture.ub.ac.id
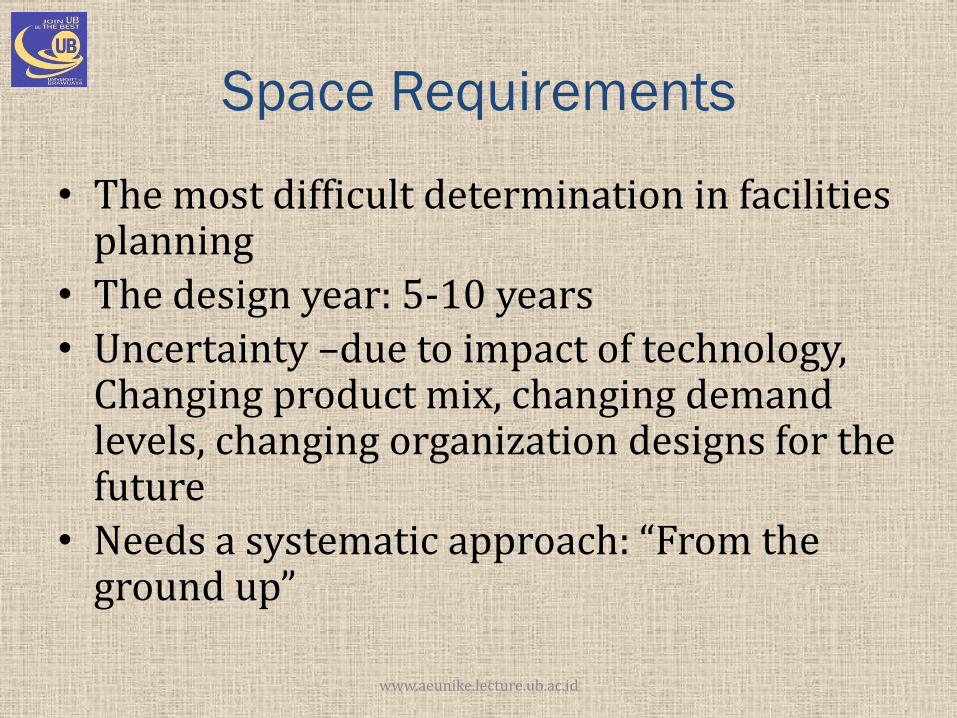
Space Requirements
• The most difficult determination in facilities planning
• The design year: 5-10 years
• Uncertainty –due to impact of technology, Changing product mix, changing demand levels, changing organization designs for the future
• Needs a systematic approach: “From the ground up”
www.aeunike.lecture.ub.ac.id

• In manufacturing and office environments, space requirements should be determined first for individual workstations; next, departments, etc.
• Modern manufacturing approaches can reduce space requirements.
– Products are delivered to the points of use in smaller lot and unit load size
– Decentralised storage areas
– Less inventories (using a pulled system)
– Manufacturing cells
– Companies are downsizing
www.aeunike.lecture.ub.ac.id
Space Requirements
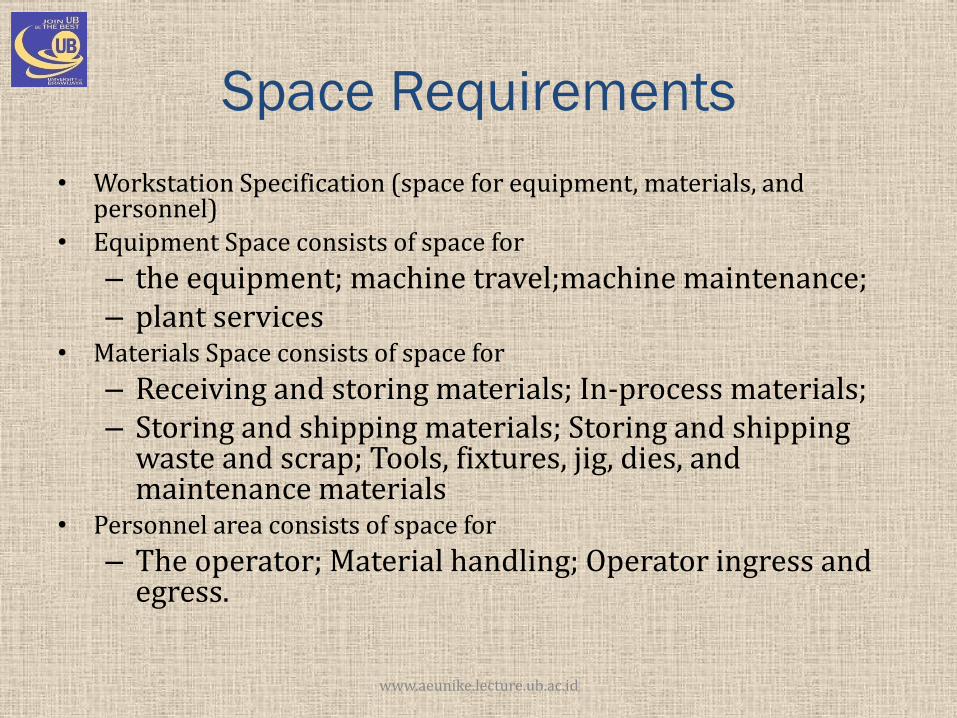
Space Requirements
• Workstation Specification (space for equipment, materials, and personnel)
• Equipment Space consists of space for
– the equipment; machine travel;machine maintenance; – plant services
• Materials Space consists of space for
– Receiving and storing materials; In-process materials; – Storing and shipping materials; Storing and shipping
waste and scrap; Tools, fixtures, jig, dies, and maintenance materials
• Personnel area consists of space for
– The operator; Material handling; Operator ingress and egress.
www.aeunike.lecture.ub.ac.id
Space Requirements
• Department Specification
• Aisle Arrangement
• Visual Management and Space Requirement
www.aeunike.lecture.ub.ac.id
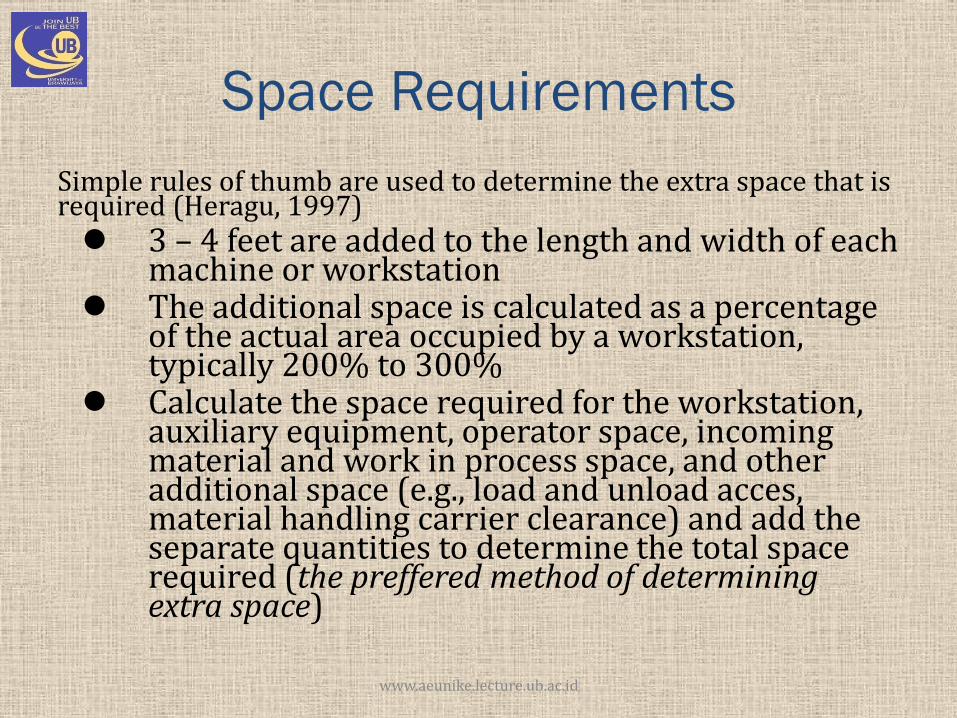
Space Requirements
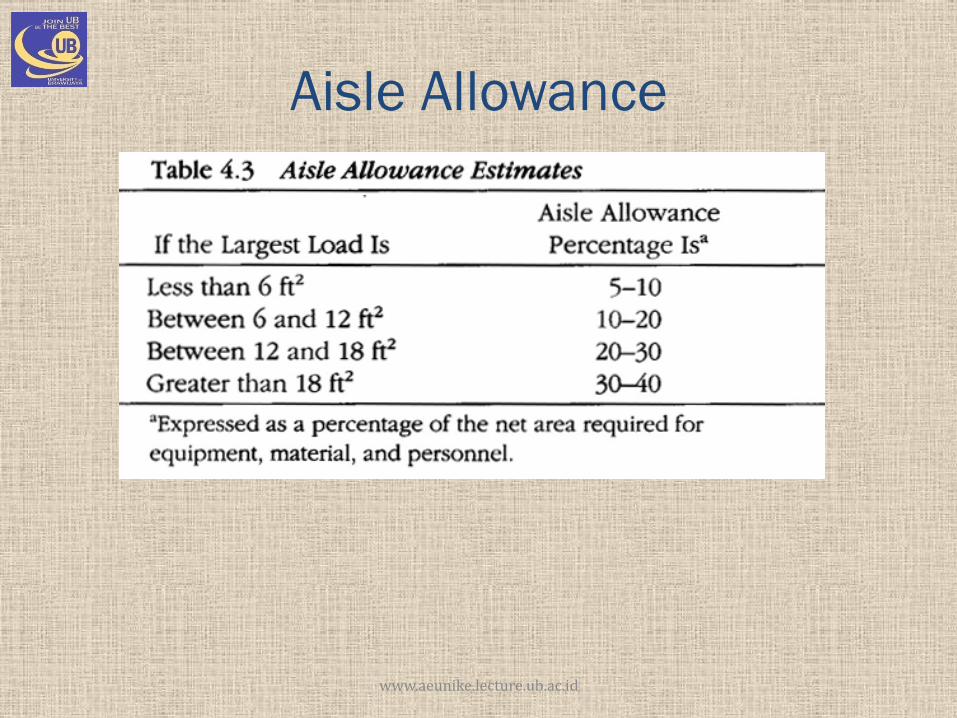
Simple rules of thumb are used to determine the extra space that is required (Heragu, 1997) 3 – 4 feet are added to the length and width of each
machine or workstation The additional space is calculated as a percentage
of the actual area occupied by a workstation, typically 200% to 300%
Calculate the space required for the workstation, auxiliary equipment, operator space, incoming material and work in process space, and other additional space (e.g., load and unload acces, material handling carrier clearance) and add the separate quantities to determine the total space required (the preffered method of determining extra space)
www.aeunike.lecture.ub.ac.id
Space Requirements
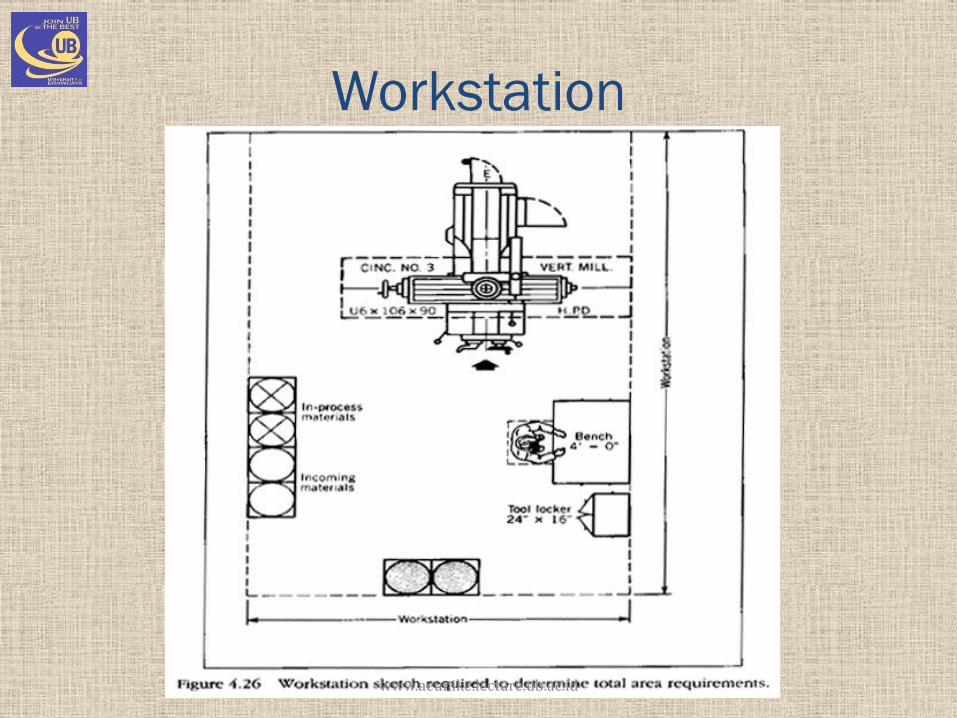
Workstation
www.aeunike.lecture.ub.ac.id
www.aeunike.lecture.ub.ac.id
Aisle Allowance
www.aeunike.lecture.ub.ac.id
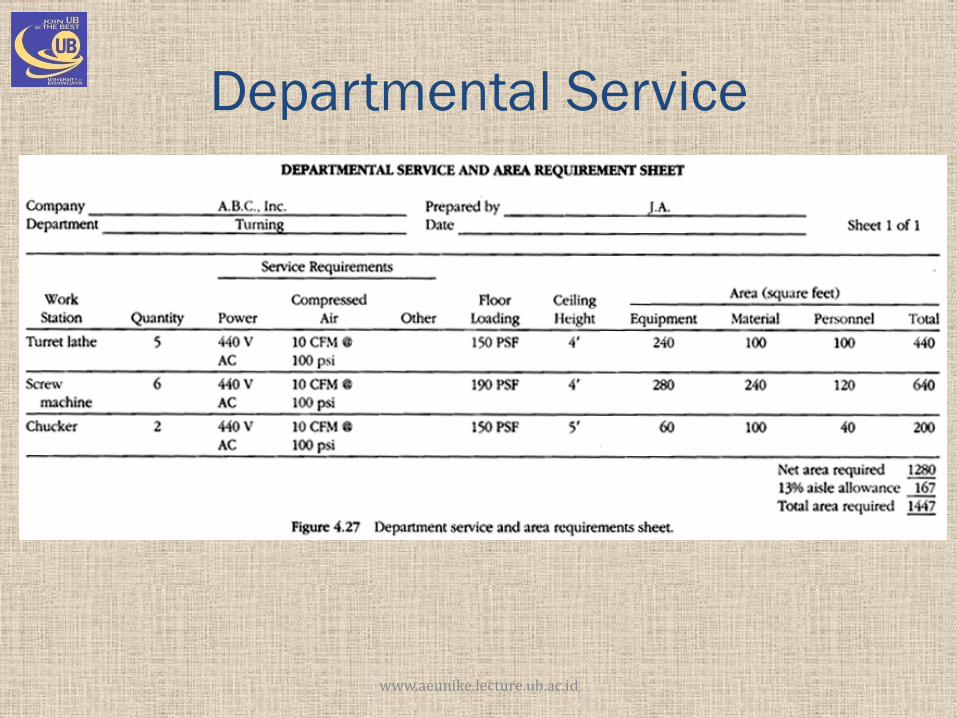
Departmental Service
www.aeunike.lecture.ub.ac.id
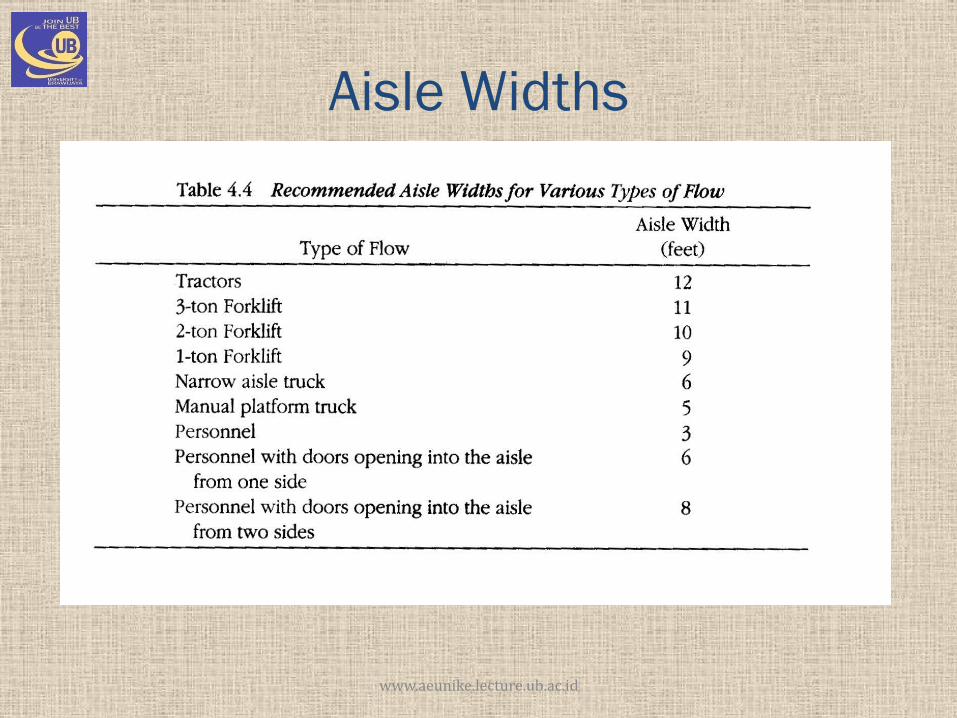
Aisle Widths
www.aeunike.lecture.ub.ac.id
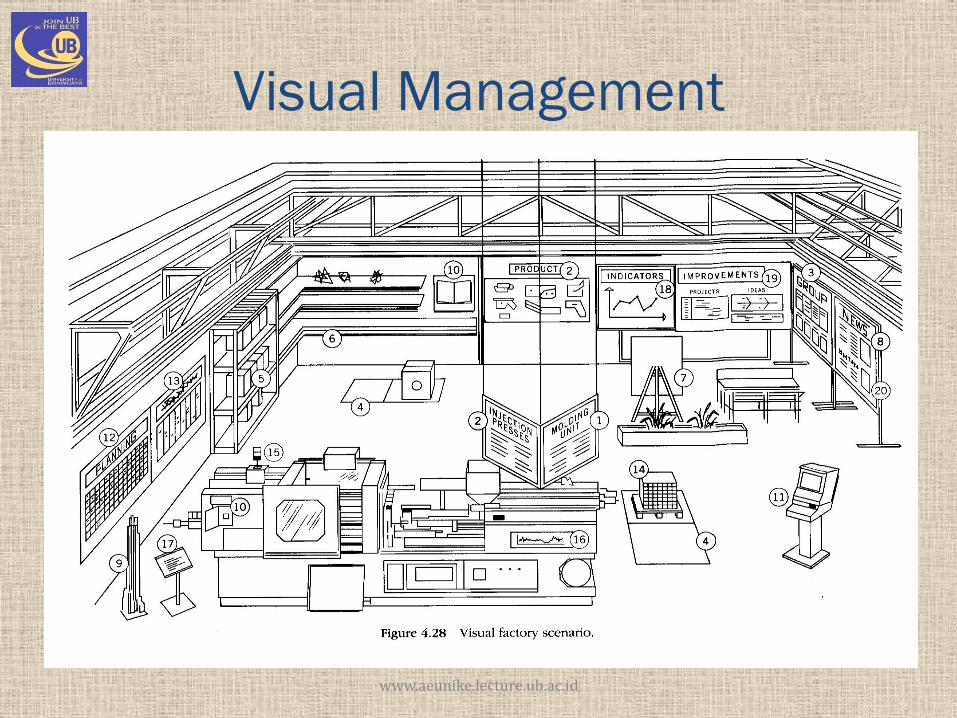
Visual Management
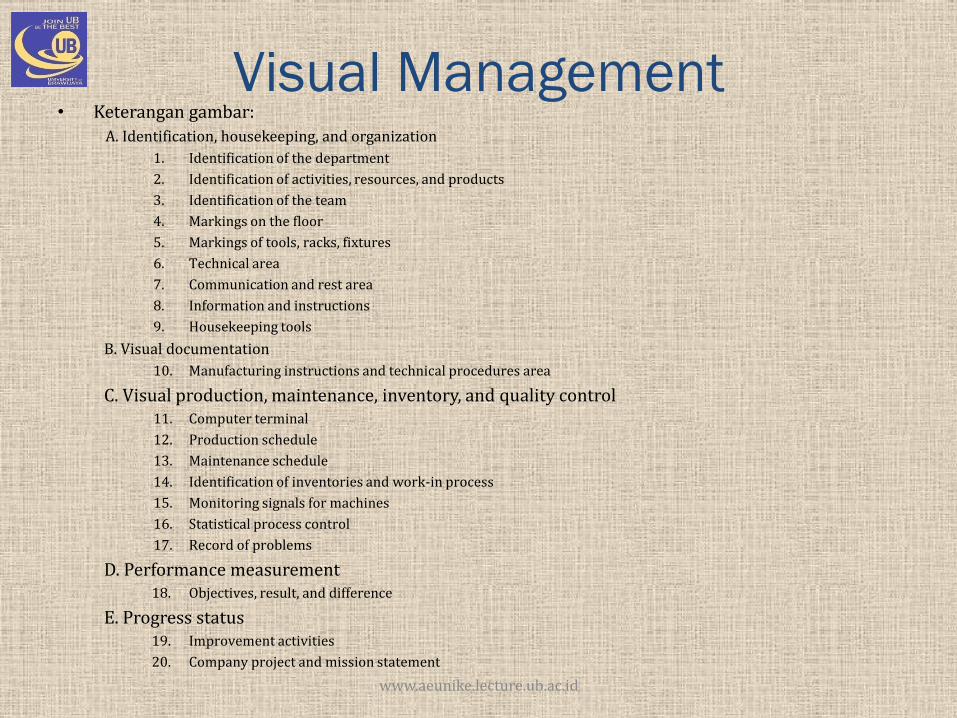
Visual Management • Keterangan gambar:
A. Identification, housekeeping, and organization
1. Identification of the department
2. Identification of activities, resources, and products
3. Identification of the team
4. Markings on the floor
5. Markings of tools, racks, fixtures
6. Technical area
7. Communication and rest area
8. Information and instructions
9. Housekeeping tools
B. Visual documentation
10. Manufacturing instructions and technical procedures area
C. Visual production, maintenance, inventory, and quality control 11. Computer terminal
12. Production schedule
13. Maintenance schedule
14. Identification of inventories and work-in process
15. Monitoring signals for machines
16. Statistical process control
17. Record of problems
D. Performance measurement 18. Objectives, result, and difference
E. Progress status 19. Improvement activities
20. Company project and mission statement
www.aeunike.lecture.ub.ac.id

References
• Heragu, S. (2008). Facilities Design (3rd Ed.). CRC Press.
• Tompkins, White, Bozer and Tanchoco. (2010). Facilities Planning (4th Ed.). New York: Wiley.
• Wignjosoebroto, S. (1996). Tata Letak Pabrik dan Pemindahan Bahan. Surabaya: Guna Widya.