MAT Conference May, 2012 Resampling with TinkerPlots Jane Watson University of Tasmania 1.
19
MAT Conference May, 2012 Resampling with TinkerPlots Jane Watson University of Tasmania 1
-
Upload
lizbeth-carpenter -
Category
Documents
-
view
215 -
download
0
Transcript of MAT Conference May, 2012 Resampling with TinkerPlots Jane Watson University of Tasmania 1.
MAT ConferenceMay, 2012
Resampling with TinkerPlots
Jane Watson
University of Tasmania1
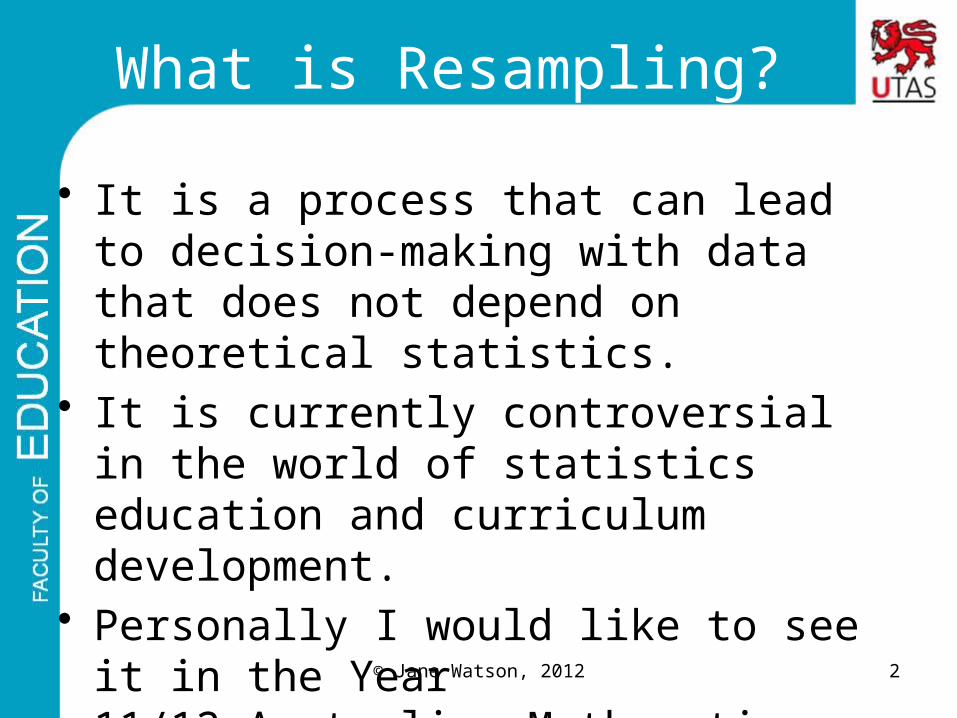
What is Resampling?
• It is a process that can lead to decision-making with data that does not depend on theoretical statistics.
• It is currently controversial in the world of statistics education and curriculum development.
• Personally I would like to see it in the Year11/12 Australian Mathematics Curriculum.
2© Jane Watson, 2012

Decision Making in Statistics• Statistics is about carrying out investigations
with data from samples to answer questions about populations or with data from experiments to draw causal inferences.
• At some point in the development of understanding of the inferential process, probabilistic reasoning becomes involved because the decisions about the questions cannot be made with certainty.
• The question is: what processes are used?
3© Jane Watson, 2012

Inference: Formal and Informal• Formal inference is what statisticians do based
on the assumptions underlying the normal distribution to carry out hypothesis tests, etc.
• Informal inference is what school students do when evidence is used to make a generalisation beyond the data with an acknowledgement of uncertainty.─Evidence: height data from my Grade 5 class─Generalisation: what can I say about all
Grade 5 students in Australia?─Uncertainty: How confident am I about this?
4© Jane Watson, 2012
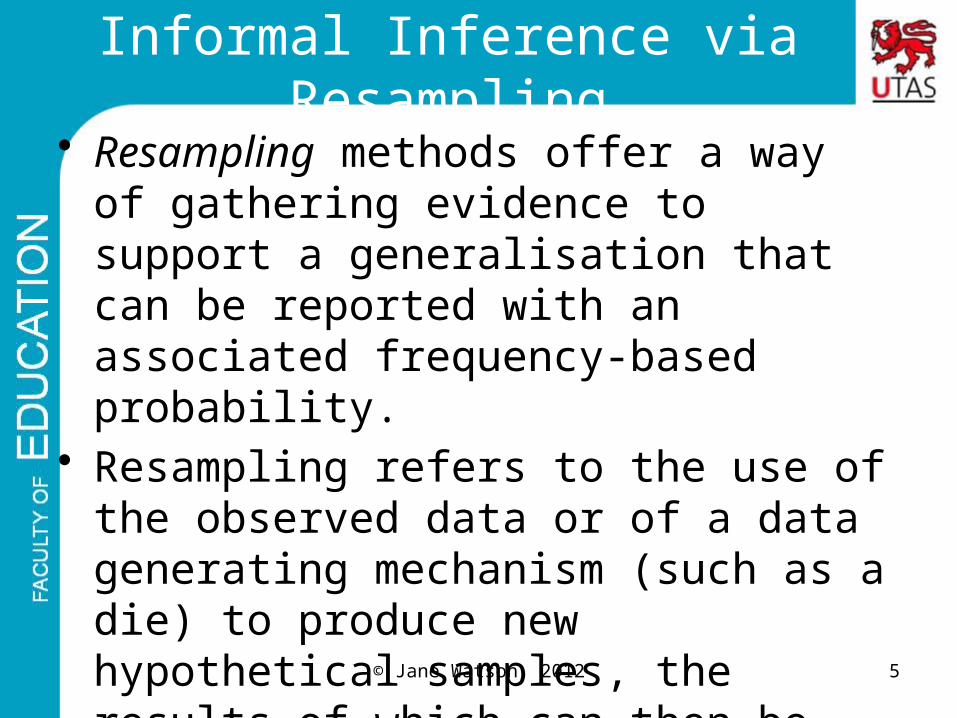
Informal Inference via Resampling• Resampling methods offer a way of
gathering evidence to support a generalisation that can be reported with an associated frequency-based probability.
• Resampling refers to the use of the observed data or of a data generating mechanism (such as a die) to produce new hypothetical samples, the results of which can then be analysed (Simon, 1997).
5© Jane Watson, 2012

Informal Inference via Resampling• The process then recalculates the value of
the statistic of interest for the resampled data, perhaps the difference in the group means or medians.
• This is done many times to estimate the relative frequency (probability) with which the original difference (or more extreme) would be expected to occur compared to the differences with random reallocation.
6© Jane Watson, 2012
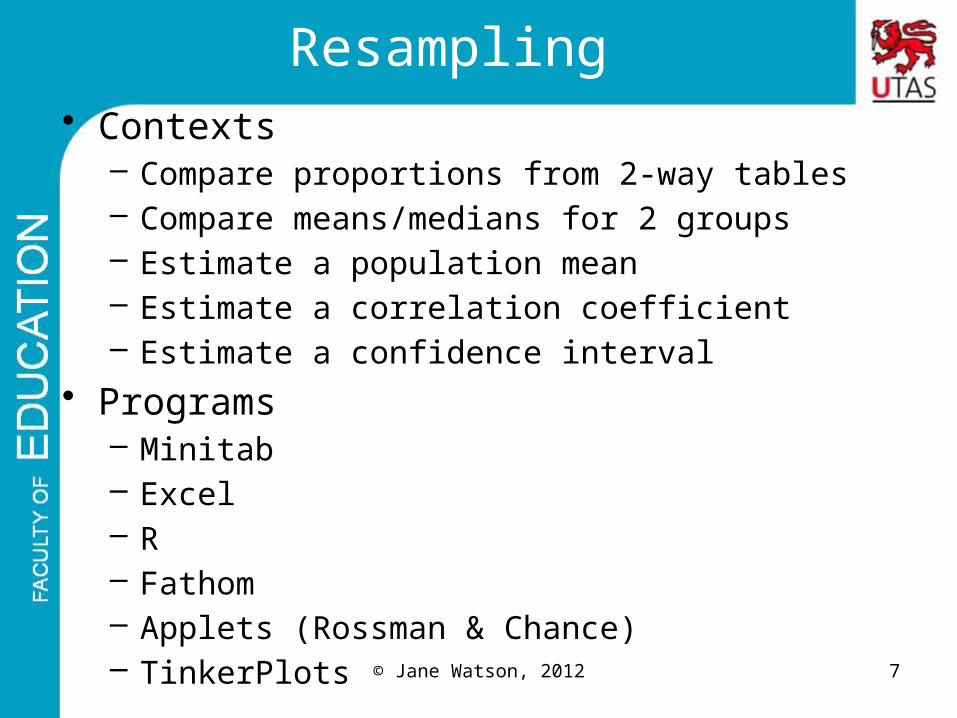
Resampling• Contexts
– Compare proportions from 2-way tables– Compare means/medians for 2 groups– Estimate a population mean– Estimate a correlation coefficient– Estimate a confidence interval
• Programs– Minitab– Excel– R– Fathom– Applets (Rossman & Chance)– TinkerPlots 7© Jane Watson, 2012

Example using TinkerPlots(Shaughnessy et al., 2009)
• Is it easier for people to memorise meaningful words than nonsense words?
• Two lists of 3-letter words: one a list of meaningful words and the other nonsense words.
• The lists are randomly distributed face-down to members of the class, one to a student.
• Students are told to turn the sheet over and spend 30 seconds memorising the words.
• They then turn the sheet over and write as many words as they can remember on the back of the sheet. 8© Jane Watson, 2012

Compare performances on the two lists
• Class data: Is it easier to remember meaningful or nonsense words?
• How unusual is the difference?
9© Jane Watson, 2012

Using box plots from Year 10Using Chris Wild’s criteria, no overlap of the boxes means 3/4 of “Nonsense” are to the left of 3/4 “Meaningful.” There appears to be evidence for a difference.
10© Jane Watson, 2012

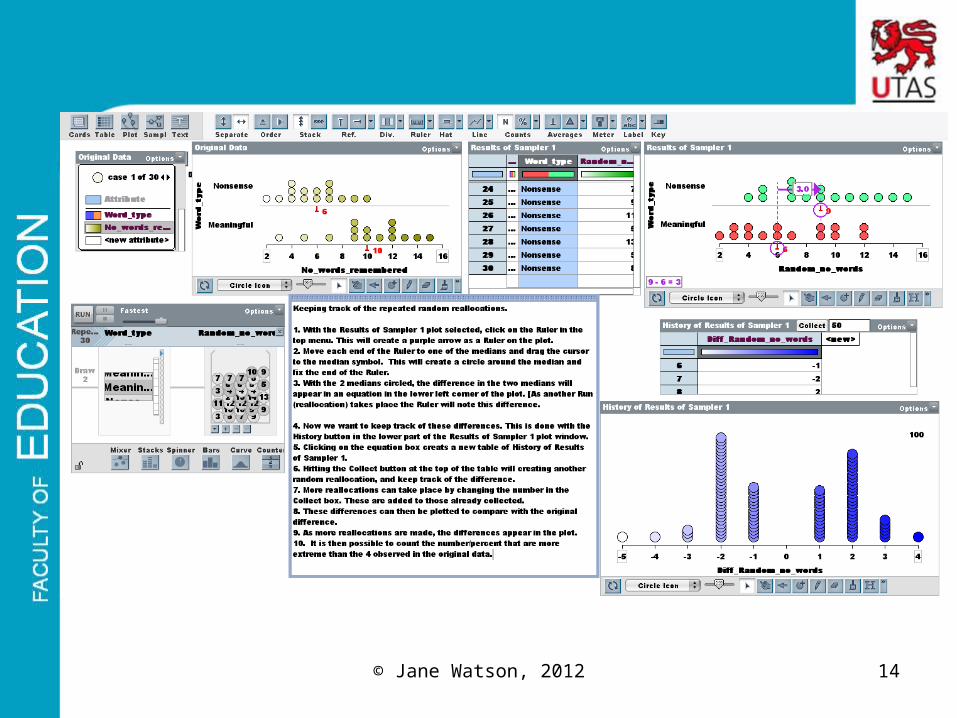
Resampling with TinkerPlots• Data from class in Data Cards and Table.• Set up Sampler to reassign the data
randomly (No_words_remembered) without replacement to the two conditions.
• Use the Ruler to measure the “new” difference in medians.
• Use the History button to record this and repeat “many” times.
• See how many times the difference is at least as large as the class difference of 4. 11© Jane Watson, 2012

12© Jane Watson, 2012
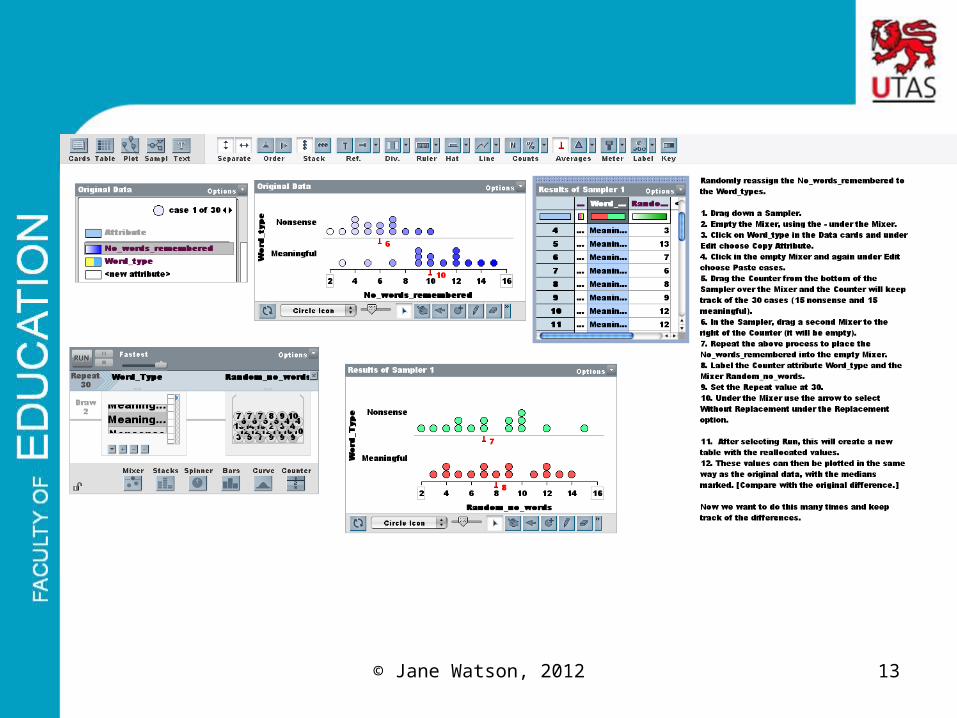
13© Jane Watson, 2012
14© Jane Watson, 2012
A Second Example: Swimming with Dolphins
• 30 patients diagnosed with mild to moderate depression were randomly allocated to two treatment groups where they engaged in the same amount of time swimming and snorkelling each day for four weeks.
• One group participated in the presence of bottlenose dolphins and the other did not. The patients had no other treatment.
15© Jane Watson, 2012

A Second Example: Swimming with Dolphins
16© Jane Watson, 2012
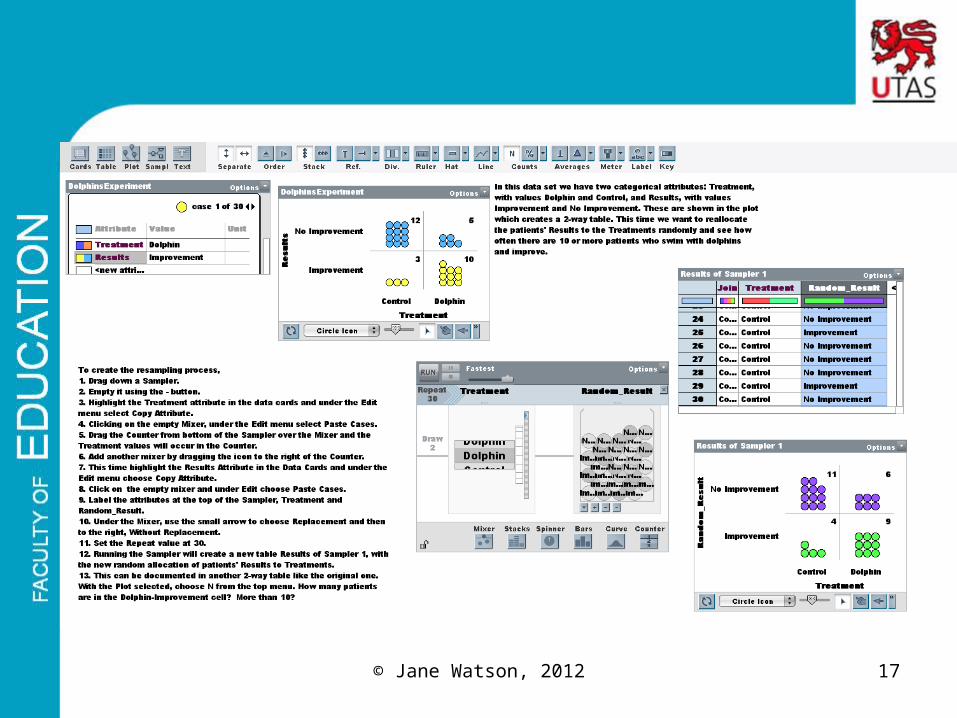
17© Jane Watson, 2012
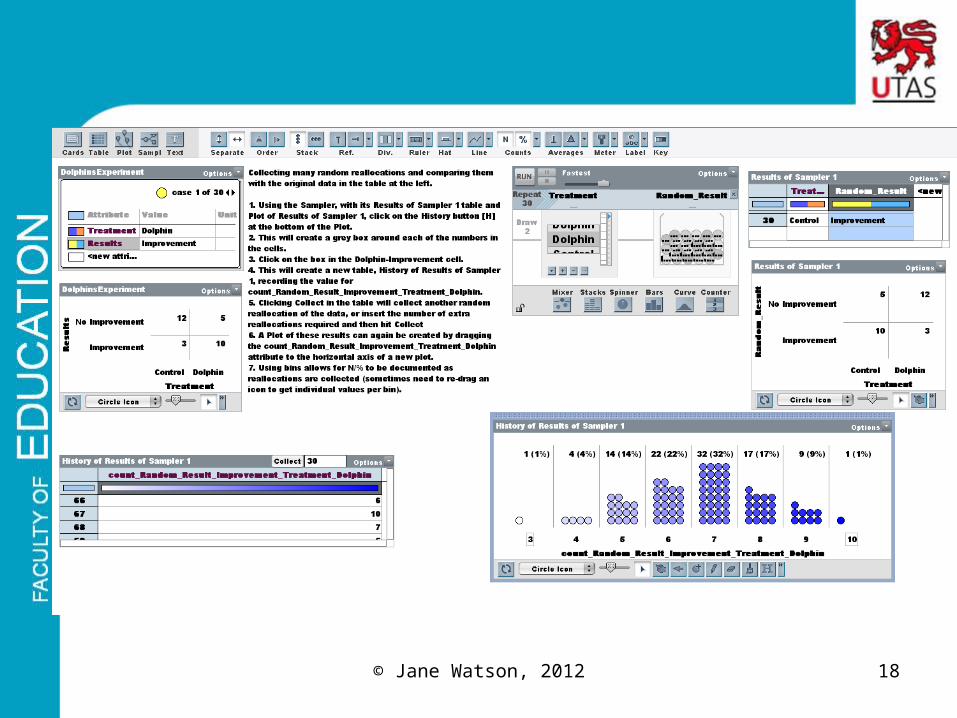
18© Jane Watson, 2012
Benefits of Resampling
• Concrete – can be done “by hand first.”
• Students can “see” how unlikely (or otherwise) an outcome is.
• There is no theoretical baggage beyond random sampling.
• Put it in the Year 11/12 curriculum.
19© Jane Watson, 2012