MASTER THESIS - upcommons.upc.eduupcommons.upc.edu/bitstream/handle/2099.1/11991/memoria.pdf ·...
95
MASTER THESIS Photochemical nanomodification of polymer surfaces: Aerospace applications Eduard F. Aymerich SUPERVISED BY Ignasi Casanova Universitat Politècnica de Catalunya Master in Aerospace Science & Technology September 2010
-
Upload
nguyenthuy -
Category
Documents
-
view
217 -
download
1
Transcript of MASTER THESIS - upcommons.upc.eduupcommons.upc.edu/bitstream/handle/2099.1/11991/memoria.pdf ·...

MASTER THESIS
Photochemical nanomodification of polymer surfaces: Aerospace
applications
Eduard F. Aymerich
SUPERVISED BY
Ignasi Casanova
Universitat Politècnica de Catalunya
Master in Aerospace Science & Technology
September 2010

ii Photochemical nanomodification of polymer surfaces: Aerospace applications
This Page Intentionally Left Blank
Photochemical nanomodification of polymer surfaces: Aerospace applications iii
Photochemical nanomodification of polymer surfaces: Aerospace applications
BY
Eduard F. Aymerich
DIPLOMA THESIS FOR DEGREE
Master in Aerospace Science and Technology
AT
Universitat Politècnica de Catalunya
SUPERVISED BY:
Ignasi Casanova Institut de Tècniques Energètiques (INTE-UPC)

iv Photochemical nanomodification of polymer surfaces: Aerospace applications
This Page Intentionally Left Blank

Photochemical nanomodification of polymer surfaces: Aerospace applications v
ABSTRACT Polymers are widely used in the space sector since the first launch in the 1960’s. Their specific characteristics make them one of the most important and most used materials. Hence the necessity of understand, comprehend and master their science and the characterization they are suitable to accept. This work studies the effect of high intensity UV light on the surface of a polymer with the objective of changing the surface roughness characteristics to achieve a level of boost dyeability (either through a pre-primer paint layer or directly painting) and reflexivity of Polypropylene (PP). This change must be achieved in micro-nano scale, and thus keeping the same initial appearance at first glance. The main reason to perform this study is that when a polymer is used for space applications it has to resist very hard conditions such as UV, Atomic oxygen, X-Ray… PP, itself, is not a common polymer used for space applications. However if the interaction between the UV light and the surface is understood and the result is the desired, changes in the roughness at nano or micro level and the surface activation, it could be found a space application, direct o indirect, for this kind of polymer. The exposition is performed with a high intensity UV lamp, controlling the time and varying the distance between the source and the sample. For the surface analysis, when measuring the surface roughness average, before and after the UV treatment, it was used an interferometric microscope and when it was just needed an image of the surface it was used an optical microscope. The reflexivity study is done with an UV-Vis-NIR spectrometer. The result obtained is that the proposed UV treatment gives to this PP polymer the modification necessary to increase the surface roughness and the surface activation in such a manner that improves the dyeability tests. This corresponds to an improvement of the coating characteristics of the PP, a polymer very difficult to attach any kind of particle, either chemically or mechanically; however is an interesting polymer in many fields due to its good mechanical characteristics and its economic ratio. Consequently the procedures used in this project may be used to be able to apply a coating to a PP based application.

vi Photochemical nanomodification of polymer surfaces: Aerospace applications
This Page Intentionally Left Blank

Photochemical nanomodification of polymer surfaces: Aerospace applications vii
Project Statement
…modify a polymer surface with UV light, in a controlled way, to change its dyeability characteristics... Modify the surface of two different polymers, proposed and proportioned by the industry interested in this project. Those polymers are going to be PP and PC/PBT, and its surface average roughness has to be increased at the nano and micro level, by using high intensity UV light, enough to brake O-O bonds of the oxygen present in the air and promoting the natural production of ozone, an extreme oxidizing agent that has to be really taken into account. This photochemical modification must be done under controlled and reproducible conditions, and in an iterative way with the purpose of being able to compare results under same conditions. This change in surface roughness is going to be analyzed and quantified in order to end up with a result of how much energy is given to a particular polymer (PP and PC/PBT) to obtain which amount of roughness average change. After the whole process is under control (the pre analysis, the treatment and the post analysis); some samples are going to be treated with the same conditions as the ones analyzed and are going to be sent to the companies in charge of performing the dyeability tests, to contrast if there is any supposed improvement or not. Once the results from this dyeability test are received, conclusions are extracted and possible aerospace applications are proposed.

viii Photochemical nanomodification of polymer surfaces: Aerospace applications
This Page Intentionally Left Blank

Photochemical nanomodification of polymer surfaces: Aerospace applications ix
…for those that expand human knowledge.
Acknowledgements This work would not have been possible without the priceless help of my family; my father Jordi Ferreté taught me how to love science and technology, my mother Elisabet Aymerich taught me to love the well done job and my brother Sergi Ferreté still does not realize how much he helps me to forget about the problems. Míriam’s daily support helped me to overcome difficult moments. The constant support of my supervisor, Dr. Ignasi Casanova, who believed in me when he didn’t had to, and has always been correcting me at the right time. I am very lucky to work with him. Colleagues group from nAuto project, Andrea Jaime, Sergi Galindo, Alberto Pacheco and Alejandro Sandoval, with whom I could share knowledge, experiences and opinions, which in many cases have been basic to the development of this work. Fellows of nanoparticles group, Cristian, Núria, Eduardo, Raúl, César and Vanessa, who have always responded with a smile on any question or problem I have had and I went to ask for help. CRnE laboratory technicians, Montse Domínguez, Néstor Veglio (in memoriam) and Trifon Trifonov, for their patience, support and help they have given me throughout the project, which certainly made the job easier.
x Photochemical nanomodification of polymer surfaces: Aerospace applications
This Page Intentionally Left Blank

Photochemical nanomodification of polymer surfaces: Aerospace applications xi
Table of Contents INTRODUCTION ....................................................................................................................................21
CHAPTER 1. INTRODUCTION TO THE PROJECT ............................................. 23
1.1. Study approach .............................................................................................................................24
1.2. Relevance .......................................................................................................................................25 1.2.1. General relevance ........................................................................................................................25 1.2.1. Relevance in automotive and space ............................................................................................25
1.3. Objectives ......................................................................................................................................26
CHAPTER 2. STATE OF THE ART ...................................................................... 27
2.1. Polymers ........................................................................................................................................27 2.1.1. Scientific principles .......................................................................................................................27
2.2. Polymer degradation .....................................................................................................................31 2.2.1. UV degradation .............................................................................................................................33 2.2.2. Polymers in Space ........................................................................................................................35
2.3. Related Studies ..............................................................................................................................38
CHAPTER 3. WORK METHODOLOGY ................................................................ 45
3.1 Inventory .........................................................................................................................................45
3.2. Experimental Methodology ..........................................................................................................46 3.2.1. Scientific Instrumentation for measuring the surface roughness .................................................48 3.2.2. Equipment used ............................................................................................................................55 3.2.3. Sample preparation ......................................................................................................................65 3.2.4. Tests .............................................................................................................................................65
CHAPTER 4. RESULTS ........................................................................................ 67
4.1. UV treatments ................................................................................................................................67
4.2. UV-Vis analysis ..............................................................................................................................83
4.3. Energetic approach .......................................................................................................................87
CHAPTER 5. DISCUSSION .................................................................................. 89
CHAPTER 6. CONCLUSIONS .............................................................................. 91
CHAPTER 7. RECOMMENDATIONS FOR FUTURE WORK ............................... 92
CHAPTER 8. REFERENCES ................................................................................ 93

xii Photochemical nanomodification of polymer surfaces: Aerospace applications
This Page Intentionally Left Blank

Photochemical nanomodification of polymer surfaces: Aerospace applications xiii
List of Figures 2.1 Ethylene monomer schema …………………………………………………………..28
2.2 Formation of a free radical…………………………………………………………….28
2.3 Initiation schema……………………………………………………………………….29
2.4 Propagation schema…………………………………………………………………...29
2.5 Nylon 66 formation schema…………………………………………………………...30
2.6 Different copolymer configurations…………………………………………………...31
2.7 Electromagnetic spectrum…………………………………………………………….34
2.8 The roughness parameters of untreated and treated PET films with 9.5 J/cm2 ,
where a, Rq, Rp, Rv and Rpv, denote roughness of average, root mean square,
peak, valley and peak-to-valley, respectively………………………………………..…..39
2.9 Three dimension views of non-contact mode AFM images of PET films. (a)
Untreated surface; (b) UV/ O3 irradiated surface (9.5 J/cm2……………………...…..39
2.10 Effect of UV/O3 irradiation on the reflectance of treated PET fabrics………..…40
2.11 Reflectance changes of treated PET fabrics………………………………………40
3.1 PP+0.0046% nanofluor, Ø: 2.5cm, ASCAMM…………………………………...….45
3.2 PP CNT MB 5%, Ø: 2.5cm, ASCAMM……………………………………………….46
3.3 PP, 10 x 10 cm, Plastal…………………………………………………………….….46
3.4 PC/PBT, Plastal………………………………………………………………………...46
3.5 Nickel mask, used to create a treatment pattern……………………………………47
3.6 AFM……………………………………………………………………………………...48
3.7 Block diagram of an atomic force microscope………………………………………49
3.8 AFM cantilever deflection measurement ........................................................50
3.9 AFM tip…………………………………………………………………………………..50
3.10 Optical arrangement for registering a single partial image for interferometric
microscopy…………………………………………………………………………………..51
3.11 Working schema of the holographic recording process………………………….53
3.12 Representation of the interferometric microscope located at the CRnE, with its
main parts remarked……………………………………………………………………….55
3.13 Example of measure. Two images of the nickel mask……………………………57
3.14 Power UV lamp generator…………………………………………………………...58

xiv Photochemical nanomodification of polymer surfaces: Aerospace applications
3.15 Cooling system………………………………………………………………………..58
3.16 Total spectral radiant flux…………………………………………………………….59
3.17 Structure protecting the UV lamp…………………………………………………59
3.18 Sample container, with some guides in it. Right image is the box lid with an
special crystal to look through it…………………………………………………………..60
3.19 The box completely closed (left), and completely opened (right)……………….61
3.20 Fume cupboard schema……………………………………………………………..62
3.21 The equipment assembly (left) the lamp + the box + the blower and (right) the
fume cupboard + the power generator…………………………………………………...62
3.22 Types of reflectance in function of the material surface………………………...63
3.23 Integrating sphere parts……………………………………………………………...64
4.1 Burned paper, at 9cm and 5s ………………………………………………………...67
4.2 Plastic below the paper also burned…………………………………………………67
4.3 PP + 0.0046 nanofluor, observed with PSI mode and 0.8 of threshold. Image
size: 638.1 x 478.5 um………………………………………………………………….....68
4.4 PP CNT MB 5%, observed with PSI mode and 0.1 of threshold. Image size:
638.1 x 478.5 um…………………………………………………………………………...69
4.5 Nickel mask used to create the treatment pattern. Image size 638.1 x 478.5
um……………………………………………………………………………………………70
4.6 PP observed with VSI 20.40.7, before treating. Image size: 638.1 x 478 um…...71
4.7 PP, treated at 9 cm and 5 s…………………………………………………………...71
4.8 PP, no treated. Image scale 200 um…………………………………………………72
4.9 PP, no treated. Image scale 20 um…………………………………………………..72
4.10 PP, treated at 9 cm and 5s. Image from optical microscope. Image scale 200
um…………………………………………………………………………………………….73
4.11 PP, treated at 9 cm and 5s. Image from optical microscope. Image scale 200
um (left image) and 20 um (right image)…………………………………………………73
4.12 PP, treated at 9cm and 10 s, transition. Image scale 500 um…………………...74
4.13 PP, treated at 9cm and 10 s, transition. Image scale 200 um…………………...75
4.14 PP, treated at 17 cm and 5 s. Image size 638.1 x 478.5 um…………………….76
4.15 PP, treated at 17 cm and 5 s. Image scale 20 um………………………………..76
4.16 PP, treated at 17 cm and 10 s. Image size 638.1 x 478.5 um…………………..77
4.17 PP, treated at 17 cm and 5 s, with mask. Image size 638.1 x 478.5 um……….77

Photochemical nanomodification of polymer surfaces: Aerospace applications xv
4.18 PP, treated at 17 cm and 10 s, with the mask on the above. Image scale 500
um…………………………………………………………………………………………….78
4.19 PP, treated at 17 cm and 10 s, with the mask on the above. Image scale 200
um…………………………………………………………………………………………….78
4.20 PP, treated at 17 cm and 20 s. Image scale 200 um……………………………..79
4.21 PP, treated at 17 cm and 20 s. Image scale 200 um……………………………..79
4.22 PP, treated at 17 cm and 20 s. Image scale 50 um………………………………80
4.23 PC/PBT, no treated. Image size 638.1 x 478.5 um……………………………….81
4.24 PC/PBT, treated at 17 cm and 5 s………………………………………………….82
4.25, PC/PBT, treated at 17 cm, and 5 s………………………………………………...82
4.26 PC/PBT, treated at 17 cm and 10 s. Image size 638.1 x 478.5 um…………….82
4.27 PP referred reflectance between untreated and two different treatments……..84
4.28 Difference in referrered reflectance from a treatment of 5 s and one of 10 s….85
4.29 PP referred reflectance between untreated and a third different treatment……85
4.30 PC/PBT referred reflectance between untreated and a third different
treatment…………………………………………………………………………………….86

xvi Photochemical nanomodification of polymer surfaces: Aerospace applications
This Page Intentionally Left Blank

Photochemical nanomodification of polymer surfaces: Aerospace applications xvii
List of tables 3.1 Inventory………………………………………………………………………………...45
4.1. Summary table…………………………………………………………………………83
4.2 Energetic approach…………………………………………………………………….88

xviii Photochemical nanomodification of polymer surfaces: Aerospace applications
This Page Intentionally Left Blank

Photochemical nanomodification of polymer surfaces: Aerospace applications xix
List of equations
(3.1)…………………..54
(3.2) ………………….54 (3.3) ………………….54
(4.1) ………………….68
(4.2) ………………….68
(4.3) ………………….87

xx Photochemical nanomodification of polymer surfaces: Aerospace applications
This Page Intentionally Left Blank

Introduction 21
INTRODUCTION Ultraviolet light from the sun is one of the factors that must be taken into account in the atmospheric degradation of any material. If this material is in the outer space, this effect is much more transcendent. In the Earth, there is the natural barrier protection of the atmosphere, that reduces the amount of incident rays, however once beyond this natural barrier, the effects are faster, harder and dangerous. This work attempts to use the power of UV light in order to take profit of it. There is one study (ref. 1) that shows that for some specific polymers (PET and PTT in their case) the effect of a controlled amount of UV light modifies its surface roughness, at nanoscale, and this phenomenon modifies the texture of the polymer changing also the percentage of reflectance depending on the amount of UV doses. This surface modification changes the reflectance of the material and can also modify the dyeability properties, because of mechanical enhancement, as much roughness it exists much probability of having a dye or a pigment trapped by this “mountains”. If it can be promoted the adhesion of dyes and pigments, it could be useful for painting polymers difficult to paint. This project works with a high intensity UV lamp, 120 W/cm (this UV wave at the same time creates O3 around that has to be taken into account, because it can be determinant). The materials used in this project comes from the automotive industry, those are basically polymers used in some parts of the cars. These polymers have been mainly Polypropylene (PP) and some derivatives. Their surface roughness is been analyzed, afterwards they were treated in a certain distance from the source and a particular time, those are the variables if the material is taken as a constant, and finally analyze the surface roughness again to quantify the change. In particular the distance work has been 9 cm and 17 cm (sizes of the box where the samples are been located, which has been designed and built specifically for this project) and the exposure time 5, 10 and 20 seconds. To do this observations, analysis and measurements of the surface roughness, it has been used an interferometric microscope, so it means that it has been used light to analyze. However sometimes there has been some problems to obtain reliable parameters, either by the equipment operation or the fact that the materials have changed so much that the resolution is lost and it cannot be guaranteed an outcome; for this reason it has have used an optical microscope that has not the ability to measure the average roughness, but it is useful to make a visual idea of how it has changed the morphology or topography of the area analyzed.

22 Photochemical nanomodification of polymer surfaces: Aerospace applications
In this table behind, It can be seen the most outstanding results.
Behind this subject there are still many open doors especially talking about this variables (time and distance, as the light intensity is fixed and the material should be fixed for a range of tests), to end up with a accurate conclusion depending on each variable. This work has been emphasized in the PP, treated at 17 cm and 5, 10 and 20 seconds of exposure, getting results, as shown in the table, of changes in Ra (roughness average) of the order of µm. After having the feedback from the preliminar painting tests, it has been seen that those UV doses may help to paint this kind of polymers. Not in a direct way, but it can be used in an indirect way. In any case, the objective of modifying the roughness has been accomplished and now is time to see if this phenomenon is the one that finally seems to help during the painting process, and can give answers about the range where this work should proceed, in time, in distance and in analysis scales. An aerospace analysis is also done in this project in order to try to give an answer on how these results may become an aerospace application.

Introduction to the project 23
Chapter 1. Introduction to the project
This report is part of nAuto project and it has been realized in the Research Center for Nanoengineering (CRnE) from the Universitat Politècnica de Catalunya (UPC). The project has been divided into five parts, based on the different studies of the polymer properties. Specifically, this report is one part of the project, a part commissioned to study the effect of the UV light that can have on the surface of a polymer to promote some interesting properties in the automobile field, or in this case also useful for aerospace applications. The structure of this document focuses primarily on literary aspects to understand why it is interesting to do research in this direction that is somehow to look for the justification. Commenting on the relevance of this issue both from a general standpoint and in particular for an automotive company or aerospace industry, by pursuing with the general and specific objectives of this project. Afterwards it is exposed a brief explanation about polymers and the current state of the art of this technology for this specific benefit, because there has been found some references that discusses the use of UV light, but most of them to perform other studies that are far from the scope of this work. In chapter 3, it is explained in an extensive manner the working methodology, the used equipment, the inventory available for the project and the procedure used for the experimentation. Important information if it wants to be understood how the tests are developed and the material used in each case and the scientific instrumentation, that always determine in a perceptible way the outcome. Later on, the obtained results in different experiments are presented and it is made an analysis to be able to extract finally valid conclusions. However as this was an innovative experimentation some conclusions and analysis are based on assumptions and comparisons with the document (ref. 1). The discussion and the conclusions are also focused on the aerospace application of this technique that can be used in some parts of the polymer protection against UV radiation in the outer space or even inside the Earth atmosphere, or in this particular case it also can be a benefit in a painting process for this automotive purposes exposed above. Finally, some recommendations are proposed as a view to possible future ways of working in the same direction, in fact, there is still much work to do if it is really wanted to know why these effects occur and how to produce them in a controlled way.

24 Photochemical nanomodification of polymer surfaces: Aerospace applications
1.1. Study approach
Everything starts when Ignacio Valero writes the first version of the nanotechnological observatory, compressed in the first part of the nAuto project, and finds out a study done by Jinho Jang and Youngjin Jeong at School of Advanced Materials and System Engineering, National Institute of Technology Kumoh, (ref. 1) talking about treating the materials, in their case polyester, with UV/O3 light ( is a UV light treatment, but so powerful and not done in vacuum that there is O3
created around the sample and it has to be considered as it is very oxidizing). The conclusion that they extract is that these materials experienced a change in its surface roughness, which directly influence the reflectance of itself, especially in the near ultraviolet bands, and it could enhance the ability of the material to be painted, as it increased the nanoroughness and this could make this paint particles to adhere more easily to the polymer surface in a mechanical and not chemical, as is now seeking.
Therefore, for this specific project it has been necessary to create a new experiment and consequently look in the market for such required equipment. The market is not so varied so basically a UV lamp of the same or practically identical conditions of the study (ref. 1) was searched. In their case it was a lamp from Fusion UV Systems Inc, with an intensity of 240 W/cm, the one that has been able to obtain for this project comes from the same company and the same model, but half of the intensity, 120 W/cm. Once obtained the proper equipment, it was time to proceed with the experimentation, always analyzing the roughness before and after, in order to compare. The probes that have received treatment should have some minimum requirements to be able to be worked out at the research center, since the work is done to analyze nano and micro level and some probes are too big for the equipment there is. In this case, there was little dimension restriction, but especially low thickness and flat sample were required. If all this is not acquired it will difficult the surface instruments observation and analysis work. The interaction between us and the companies has been fundamental, since they provided the probes in which it have been applied the appropriate treatment and were then returned to them to see if the effects are the ones desired or otherwise they are far from the desired; first results that in an innovative project like this, are likely not satisfactory, at least for all parts involved. Then, according to the response of the company that makes the tests with the treated samples, UV treatments continue in their initial direction or not, or are emphasized in one objective or another. It is important the relationship business - research center, for the proper development of the global project.

Introduction to the project 25
1.2. Relevance
References found talked about the possibility of using UV light to modify adequately and satisfactory the surface roughness of a polymer. It is always important to know how important or relevant is the subject of investigation to end up seeing, planning or imagining its real potential. It is also quite important to observe the research field or other research centers, universities or institutions, not just to check if someone is doing the same job, but to have a look for where are you moving inside this nanotechnological world. This job is basically function of the person making the investigation, but in this case, for this particular project inside the nAuto, the first general overview was performed by Ignacio Valero with the first version of the nanotechnological observatory; and later on, more specifically, Andrea Jaime, who had worked in the second version of nanotechnological observatory, where she has emphasized more in the works that have been developed within this nAuto project.
1.2.1. General relevance
Master the materials and its characteristics, is essential today. Science and technology are advancing together in this race that is the knowledge. The materials have a relatively important role throughout history, there are eras of iron, copper, steel, silicon ... Now is the time of polymers, materials that can be found in nature or can be created almost like a menu. Moreover, their structural characteristics can be modified and enhanced with properties more common on other materials families. It has been achieved that something that a few years ago was rather to make bags or boxes may now become artificial mussels, smart textiles, car chassis ... and a very long etcetera. Therefore this study implies that the polymer surface characterization and the nanotechnology, in this case trying to enhance a material that itself is very difficult to paint it, to make it easier, just with a treatment of UV light during a particular time and a specific distance.
1.2.1. Relevance in automotive and space
Every day the industry is trying to change some materials for lighter, cheaper and more functional materials. It is a natural process; the same natural evolution makes companies working with technology to look for optimum solutions and better outputs for their products and processes. In fact those two industries (automotive and space) are the ones maybe more updated with regard to innovation because they must maintain latent changes and technological advances occurring around them; one because is one of the main producers and investigators of new technologies and the other because it is maybe the first consumer and direct user.

26 Photochemical nanomodification of polymer surfaces: Aerospace applications
The materials winning the race today are the polymers in their immense variety. The arrival of the polymer has evolved rapidly aesthetics, accessories, sensors, pieces... among other things that we don’t even know. Those are materials which can be given the needed shape in an easy manner and that can be treated in several ways to try to imitate other materials. The material price, the production cost, the low difficulty of the polymer machinability, are those factors that makes the polymers as the fashion materials, able of replacing for example some metals. The differences between the automotive and the space sector may lead to exterior ambient factors, because the interior of both cars and spacecrafts… could be done in the same direction. The problems comes in the outside materials, the exterior part is in both cases under the sun radiation, but the light intensity received from the cars in the earth are much lower than the one received in the outer space. The industry, in this case the automotive, suggest us about trying to solve the problem of some of the polymers when they have to be painted and also to try to find a way to change the reflectivity in a simple way. This is where it is found appropriate to relate this problem with the literature, this treatment of UV light, that it is supposed to permit modifying the surface properties to promote these two prerequisites. And later on it can be used directly also for aerospace applications.
1.3. Objectives
The main objective of this project is changing in a controlled way the nano or micro surface roughness of a determined polymer by UV light doses and obtaining a possible benefit in terms of dyeability and reflectance. Within this concept, these are other specific objectives:
It has to be taken into account the surface activation, at least theoretically.
It has to be thought, designed and built a new experiment
It has to be controlled the used technology.
This change in the surface roughness must be invisible at first glance.
It has to be a close collaboration with the company, they by providing samples and us by returning them to check the dyeability.
It has to be documented the done work at the end of the project.
Direct or indirect space applications must be found. It is very important to take security measures necessary to carry out experiments under appropriate conditions and transmit it to those who want to use this technology.

State of the art 27
Chapter 2. State of the art
2.1. Polymers
Polymers are materials containing a large number of repeating structural units (monomers) joined by the same type of linkage. This linkages are typically covalent chemical bonds and the linked backbone of a polymer used for plastics consists mainly of carbon atoms, however other structures such as i.e. silicon based polymers (silicones) or our DNA which its backbone are based on a phosphodiester bond, and repeating units of polysaccharides (cellulose) are joined together by glycosidic bonds via oxygen atoms. When we hear about polymers we think in plastics; however we first have to distinguish between natural and synthetic polymers. Natural polymeric materials such as amber and natural rubber have been used in the human beings history. Biopolymers such as proteins and nucleic acids are crucial in our biological processes. Whereas synthetic polymers (man-made polymers studied since 1832) are those who we have to call plastics and there is a never-ending list. Polymers are applied to more areas than any other material available, because of its appropriate properties also variable in function of the necessity. Current applications extend from adhesives, coatings, foams, and packaging materials to textile and industrial fibers, elastomers and structural plastics. Polymers are also used for most composites, electronic devices, biomedical devices, optical devices, and precursors for many newly developed high-tech ceramics
2.1.1. Scientific principles
Scientific principles give us the opportunity to understand the behavior of processes and properties. We are talking about polymers which field is so vast (over 60,000 different plastics vying for a place in the market) and the applications, so varied that comes more important yet. Over 30 million tons of plastics are manufactured each year, being invested large amounts of money in research, development and more efficient recycling methods. Here there are some of the scientific principles, involved in the production and processing of these fossil fuel derived materials known as polymers.
2.1.1.1. Polymerization Reactions
The chemical reaction in which high molecular mass molecules are formed from monomers is known as polymerization.

28 Photochemical nanomodification of polymer surfaces: Aerospace applications
There are two basic types of polymerization:
a) Chain-Reaction Polymerization
One of the most common types of polymer reactions is chain-reaction (addition) polymerization. This type of polymerization is a three step process involving two chemical entities. The first, known simply as a monomer, can be regarded as one link in a polymer chain (it initially exists as simple units). In nearly all cases, the monomers have at least one carbon-carbon double bond. Ethylene (figure 2.1) is one example of a monomer used to make a common polymer.
C C
H H
H H
Ethylene
Fig. 2.1 Ethylene monomer schema
The other chemical reactant is a catalyst. In chain-reaction polymerization, the catalyst can be free-radical peroxide added in relatively low concentrations. A free-radical is a chemical component that contains a free electron that forms a covalent bond with an electron on another molecule. The formation of a free radical from organic peroxide is shown below:
R RROO O + R Owith ( )
representing the free electron
Fig. 2.2 Formation of a free radical
In this chemical reaction (figure 2.2), two free radicals have been formed from the one molecule of R2O2. Now that all the chemical components have been
identified, we can begin to look at the polymerization process.
Step 1: Initiation
The first step in the chain-reaction polymerization process, initiation, occurs when the free-radical catalyst reacts with a double bonded carbon monomer, beginning the polymer chain. The double carbon bond breaks apart, the monomer bonds to the free radical, and the free electron is transferred to the outside carbon atom in this reaction (figure 2.3).

State of the art 29
R O C
H
C
H H
H
+ R O C
H
C
H H
H
Fig. 2.3 Initiation schema
Step 2: Propagation
The next step in the process, propagation, is a repetitive operation in which the physical chain of the polymer is formed. The double bond of successive monomers is opened up when the monomer is reacted to the reactive polymer chain. The free electron is successively passed down the line of the chain to the outside carbon atom (figure 2.4).
CH2
CH2
R O + CH2
CH2 CH
2CH
2R O CH
2CH
2
Propagating Polymer chain
Monomer New Polymer chain
Fig. 2.4 Propagation schema
This reaction is able to occur continuously because the energy in the chemical system is lowered as the chain grows. Thermodynamically speaking, the sum of the energies of the polymer is less than the sum of the energies of the individual monomers. Simply placed, the single bounds in the polymeric chain are more stable than the double bonds of the monomer.
Step 3: Termination
Termination occurs when another free radical (R-O.), left over from the original splitting of the organic peroxide, meets the end of the growing chain. This free-radical terminates the chain by linking with the last CH2· component of the polymer chain. This reaction produces a
complete polymer chain. Termination can also occur when two unfinished chains bond together.
This exothermic reaction occurs extremely fast, forming individual chains of polyethylene often in less than 0.1 second. The polymers created have relatively high molecular weights. It is not unusual for branches or cross-links with other chains to occur along the main chain.

30 Photochemical nanomodification of polymer surfaces: Aerospace applications
b) Step-Reaction Polymerization
Step-reaction (condensation) polymerization is another common type of polymerization. This polymerization method typically produces polymers of lower molecular weight than chain reactions and requires higher temperatures to occur. Unlike addition polymerization, step-wise reactions involve two different types of di-functional monomers or end groups that react with one another, forming a chain. Condensation polymerization also produces a small molecular by-product (water, HCl, etc.). There is an example of the formation of Nylon 66 (figure 2.5), a common polymeric clothing material, involving one each of two monomers, hexamethylene diamine and adipic acid, reacting to form a dimer of Nylon 66.
N (CH2)6
N
H
H
H
H
+ C (CH2)
4 C
O
HO
O
HOHexamethylene diamine Adipic acid
N (CH2)6
N
H
H
C (CH2)4 C
O
HO
+ H O2
Hexamethylene adipamide (Nylon 66) water
(This polymer is known as nylon 66 because of the six carbon atoms in both the hexamethylene diamine and the adipic acid.)
H O
Fig. 2.5 Nylon 66 formation schema
At this point, the polymer could grow in either direction by bonding to another molecule of hexamethylene diamine or adipic acid, or to another dimer. As the chain grows, the short chain molecules are called oligomers. This reaction process can, theoretically, continue until no further monomers and reactive end groups are available. The process, however, is relatively slow and can take up to several hours or days. Typically this process breeds linear chains that are strung out without any cross-linking or branching, unless a tri-functional monomer is added.
2.1.1.2. Polymer Chemical Structure
The monomers in a polymer can be arranged in a number of different ways. As indicated above, both addition and condensation polymers can be linear, branched, or cross-linked. Linear polymers are made up of one long continuous chain, without any excess appendages or attachments. Branched polymers have a chain structure that consists of one main chain of molecules with smaller molecular chains branching from it.

State of the art 31
A branched chain-structure tends to lower the degree of crystallinity and density of a polymer. Cross-linking in polymers occurs when primary valence bonds are formed between separate polymer chain molecules. Chains with only one type of monomer are known as homo polymers. If two or more different type of monomers are involved the resulting copolymer can have several configurations or arrangements of the monomers along the chain. The four main configurations are depicted below (figure 2.6):
Random Copolymers: Different monomers
are randomly arranged within the polymer
chains.
Alternating Copolymers: Different monomers
show a definite ordered alternation.
Block Copolymers: Different monomers are arranged in long
blocks of each monomer.
Graft Copolymers: Appendages of one
type of monomer are grafted to a long chain
of the other.
Fig. 2.6 Different copolymer configurations
2.2. Polymer degradation A change in some properties such as color, shape, chemical, mechanical … of a polymer or polymer-based product under the influence of one or more environmental factors such as heat, light or chemicals like acids, alkalis and some salts is known as polymer degradation. These changes are usually undesirable, because they can produce cracking’s or even chemical disintegration of the products. However, sometimes is a desired process, as in biodegradation, or also in some fields it is deliberately used to lower the molecular weight of a polymer for recycling. . However degradation can be useful for recycling/reusing the polymer waste to prevent or reduce environmental pollution. The changes in properties are often termed "ageing". When the polymer is a finished product a change like this is not desired and it has to be prevented or even delayed Degradation can also be induced deliberately to help structure determination. Polymeric molecules are very large (on the molecular scale), and their unique and useful properties are mainly a result of their size. Any loss in chain length lowers tensile strength and is a primary cause of premature cracking.

32 Photochemical nanomodification of polymer surfaces: Aerospace applications
The main six polymers in use are polyethylene, polypropylene, polyvinylchloride, polyethylene terephthalate or PET, polystyrene and polycarbonate. These are nearly the 98% of all polymers and plastics encountered in daily life. Each of these polymers has its own characteristic modes of degradation and resistances to heat, light and chemicals. Polyethylene and polypropylene are sensitive to oxidation and UV radiation, while PVC may discolor at high temperatures due to loss of hydrogen chloride gas, and become very brittle. PET is sensitive to hydrolysis and attack by strong acids, while polycarbonate depolymerizes rapidly when exposed to strong alkalis. Step-growth polymers are degraded by specific chemicals such as strong acids and strong alkalis. They are made by condensation polymerization, so degradation is a reversal of the synthesis reaction. Other degradation routes involve interaction with strong oxidizing agents and interaction with UV radiation.
a) Ozonolysis Ozone attack can form cracks in many different elastomers. Tiny traces of the gas in the air will attack double bonds in rubber chains, with Natural rubber, Styrene-butadiene rubber and NBR being most sensitive to degradation. Products under tension ends to ozone cracks, but the critical strain is very small. The cracks are always oriented at right angles to the strain axis, so will form around the circumference in a rubber tube bent over. Such cracks are very dangerous when they occur in fuel pipes because the cracks will grow from the outside exposed surfaces into the bore of the pipe, so fuel leakage and fire may follow. By adding anti-ozonants to the rubber before vulcanization the problem of ozone cracking can be prevented. Ozone cracks were commonly seen in automobile tire sidewalls, but are now seen rarely thanks to the use of these additives. On the other hand, the problem does recur in unprotected products such as rubber tubing and seals. b) Hydrolysis Some polymers are sensitive to degradation by acids, a process known as hydrolysis. For example nylon is one case and nylon moldings will crack when attacked by strong acids. When a chemical compound is broken down by photons, this is a chemical reaction known as photodissociation, photolysis, or photodecomposition. It is defined as the interaction of one or more photons with one target molecule. Photodissociation is not limited to visible light. Any photon with sufficient energy can affect the chemical bonds of a chemical compound. Since a photon's energy is inversely proportional to its wavelength, electromagnetic waves with the energy of visible light or higher, such as ultraviolet light, x-rays and gamma rays are usually involved in such reactions.

State of the art 33
An explanatory example could be the fracture surface of a fuel connector or any polymer in contact with acids that shows the progressive growth of the crack from acid attack to the final cusp of polymer. The problem is known as stress corrosion cracking. c) Oxidation Many process methods such as extrusion and injection molding involve pumping molten polymer into tools, and the high temperatures needed for melting may result in oxidation unless precautions are taken. Polymers are susceptible to be attacked by atmospheric oxygen, especially at elevated temperatures encountered during shape processing. For example, a forearm crutch suddenly snapped and the user was severely injured in the resulting fall. The crutch had fractured across a polypropylene insert within the aluminum tube of the device, and infra-red spectroscopy of the material showed that it had oxidized, possible as a result of poor molding. The strong absorption of the carbonyl group in the spectrum of polyolefins permits to detect the oxidation in an easy manner. Polypropylene has a relatively simple spectrum with few peaks at the carbonyl position (like polyethylene). Oxidation tends to start at tertiary carbon atoms because the free radicals formed here are more stable and longer lasting, making them more susceptible to attack by oxygen. The carbonyl group can be further oxidised to break the chain, this weakens the material by lowering its molecular weight, and cracks start to grow in the regions affected.
A way to help this weathering is using hindered-amine light stabilizers (HALS) against weathering by scavenging free radicals that are produced by photo-oxidation of the polymer matrix. UV-absorbers stabilizes against weathering by absorbing ultraviolet light and converting it into heat. Antioxidants stabilize the polymer by terminating the chain reaction due to the absorption of UV light from sunlight. The chain reaction initiated by photo-oxidation leads to cessation of crosslinking of the polymers and degradation the property of polymers.
2.2.1. UV degradation
UV light is part of the electromagnetic spectrum. It is at the higher end of energy compared to visible light and is followed in energy by X-rays and the Gamma rays – see diagram (figure 2.7).

34 Photochemical nanomodification of polymer surfaces: Aerospace applications
Fig. 2.7 Electromagnetic spectrum
UV energy absorbed by plastics can excite photons, which then create free radicals. While many pure plastics cannot absorb UV radiation, the presence of catalyst residues and other impurities will often act as free radical receptors, and degradation occurs. It only takes a very small amount of impurity for the degradation to occur, e.g. trace parts per billion values of sodium in polycarbonate (PC) will initiate color instability. All types of UV can cause a photochemical effect within the polymer structure, which can be either a benefit or lead to degradation of some sort to the material. In the presence of oxygen, the free radicals form oxygen hydroperoxides that can break the double bonds of the backbone chain leading to a brittle structure. This process is often called photo-oxidation. The main visible effects are a chalky appearance and a color shift on the surface of the material, and the component surface becomes brittle. However, in the absence of oxygen there will still be degradation due to the cross-linking process, which is the effect for plastics used for the Hubble Space Telescope and International Space Station. Components in the Hubble Space Telescope (HST) and the International Space Station (ISS) require plastics that can survive the demands of outer space. Fluoropolymers such as FEP and polyimides like Kapton are plastics which have been successfully used for the HST and ISS. The effects above are predominantly in the surface layer of the material and are unlikely to extend to depths above 0.5 mm into the structure. There are several ways of trying to avoid UV degradation in plastics by using stabilizers, absorbers or blockers. For many outdoor applications, the simple addition of carbon black at around a 2% level will provide the protection for the structure by the blocking process. Other pigments such as titanium dioxide can also be effective.

State of the art 35
Organic compounds such as benzophenones and benzotriazoles are typical absorbers which selectively absorb the UV and re-emit at a less harmful wavelength, mainly as heat. The other main mechanism for protection is to add a stabilizer, the most common being a HALS (Hindered Amine Light Stabilizer). These absorb the excited groups and prevent the chemical reaction of the radicals. In practice, the various types of additives used are in combinations or are compounded into the original polymer to be produced as a special grade for UV protection. It may be attractive to add antioxidants to some plastics to avoid photo-oxidation, but care must be taken that the antioxidant chosen does not act as an UV absorbent, which will actually enhance the degradation process. If a product is to be exposed to direct sunlight, the designer or engineer must specify suitable testing standards and make sure the plastic has appropriate formulation to maintain the desired long-term properties. Including additives to the polymer melt process may provide protection, or if volumes are sufficiently high, the additives can be pre-compounded into the resin.
2.2.2. Polymers in Space
Polymers are widely used in space vehicles and systems as structural materials, thermal blankets, thermal control coatings, conformal coatings, adhesives, lubricants, etc due to their e.g. light weight, ease of manufacture, flexibility in usage, good thermal and electrical insulation properties, and ease in tailoring. Here there are some of these polymers applications explained, based on the (ref. 30)
In thermal blanket terms, polymers are essential for regulating the spacecrafts temperature. A blanket consists of a polymer thin film. Many layers of these films make up Multi-Layer Insulation (MLI) that constitutes the “blanket”. The layers are also separated by fine scrim cloths made from other polymers. These films are also frequently coated with thin layers (500 Angstroms) of indium tin oxide (ITO) which provides a path for the dissipation of static electricity (ESD). Thermal blankets are a necessity in providing a stable range of operating temperatures, and are used on virtually every spacecraft flown.
For thermal control paints, these paints are either black or white and consist of pigments dispersed in an organic or an inorganic binder. The polymer binders most widely used are urethanes (black paints) or silicones (white paints). White paints have high emissivity and are used for rejecting excess heat back into space. Black paints are virtually all filled with carbon black, which not only provides for good solar absorbance (85%), but serves to protect the binder from ultraviolet light damage. This may be linked directly to polymers dyeability.

36 Photochemical nanomodification of polymer surfaces: Aerospace applications
The polymer based adhesives are widely used throughout most spacecraft. Applications include structural bonding, wire and cable staking, lamination of optical elements, and thread-locking compounds used to prevent loosening of fasteners under high vibration conditions. The intimate surface contact and good adhesion of these specialty polymers is often the only way to achieve thermal or electrical continuity between uneven surfaces. Transparent and ultraviolet curable adhesives constitute another specialty type of adhesive. These adhesives are used for bonding together optical elements, such as lenses and fiber optic devices.
Polymers in one form or another are widely used in electronics components and electronic packaging. These applications include:
o Circuit boards.
o Wire insulation is virtually all based on polymers.
o Conformal coatings are used on almost all circuit board assemblies to provide resistance to chemical corrosion and create an insulating layer across the surface.
Composite materials based on high modulus graphite fibers dispersed in polymer matrix resins have become a standard construction material for spacecraft. Despite the higher cost and more demanding fabrication techniques, composites offer lower mass, high specific stiffness, high specific (tensile) strength and high dimensional stability that is practically unavailable with any other class of materials. In the past decade, composite materials have become a standard replacement for aluminum, titanium and steel in spacecraft with demanding mass and stability requirements.
Thin Films applications of polymeric materials may include extremely thin films for programs such as inflatable antennas, solar sails, very large area reflectors. An additional concept that might further enable this materials challenge is a “fugitive mass” coating. This is a polymer based coating that could be applied to thin films to improve their handling and deployment, but then evaporates from the surface when exposed to the space environment. Both are attacked by ultraviolet light and are degraded to gaseous products and result in decreased mass of thin films used in solar sail applications.
Polymeric materials have played an essential role in spacecraft since the very first launch in the 1960’s. From there until today many more materials became available, with increasing numbers of applications, definitions of their performance and specifications for their use. Typical polymers now used are polysiloxanes (silicones), epoxies, polyurethanes, polyesters, acetals, acrylics, polyamides, fluorocarbons, polyimides, etc. The space environment is especially harsh towards polymers. Depending on the application, materials are exposed to high vacuum, thermal cycling (commonly about +/- 100°C), solar radiation including high energy UV, X-ray, particulate radiation (electrons, protons, heavy ions), and atomic oxygen.

State of the art 37
The low earth orbit (LEO), space environment includes hazards such as atomic oxygen, UV radiation, ionizing radiation (electrons, protons), high vacuum, plasma, micrometeoroids and debris, as well as severe temperature cycles. The LEO space is a complex dynamic environment. The constituents of natural orbital environment vary with position, local time, season and solar activity. The local satellite environment, especially neutral particles and plasmas, may be quite different from the natural one. Effects of different constituents of the space environment on spacecraft materials play a crucial role in determining the system function, reliability and lifetime. These effects will be briefly described below. The total energy provided by the Sun over the wavelength range of 0.115 up to 50 lm (defined as the solar constant) is 1366 W/m2. The total energy provided by solar UV radiation in the range of 100 – 400 nm is only about 8% of the solar constant. UV radiation is energetic enough to break polymers bonds such as C–C, C–O and functional groups. At the near UV range (200–400 nm) the photons energy is Eph > 3 eV, and it increases to Eph > 5 eV for the vacuum UV (VUV) range below 200 nm. VUV effects are characterized by energy loss processes of bond breaking but no direct atomic displacements. Further modification of the polymers may occur through scissioning and the creation of volatile fragments (resulting in mass loss), or through cross linking (resulting in surface modification, but no mass loss). UV radiation may induce degradation of thermo-optical properties, leading to decreased efficiency of the thermal control surfaces and strongly affecting mechanical properties. Individual effects of UV radiation, as well as synergistic effects of UV and other constituents of space environment, especially ATOX, have been extensively studied during in-flight experiments and by using ground simulation techniques. In conclusion the major degradation effects in the space in polymers are due to exposure to ATOX, VUV or synergistic effects. No polymer is generally resistant towards all characteristics of the space environment, and applications depend on specific mission constraints. Ground based simulation experiments lead to a very good understanding of materials stability and degradation, enabling excellent engineering solutions. Nevertheless, fine-tuning of degradation models is only possible with analysis of space retrieved materials, as synergistic effects can only be simulated to a limited degree. In fact there are a great amount of research centers, institutions and universities studying applications, possible applications and innovations around the polymers use in the space sector. For example, the past February 2010, in Hamburg there was the 2nd International Conference on Polymers in Defense and Aerospace applications, with scientist from all over the world. In resume, according to the main scope of this project, the subjects more related that were discussed in this conference where the followings discussed above.

38 Photochemical nanomodification of polymer surfaces: Aerospace applications
Novel processes and applications arising from inkjet printing of functional materials were described with defense related areas ranging from printing adhesives for composites joining, conformal circuitry, flame resistant and camouflage coating, low friction coatings, textured surfaces, flexible displays, integrated electronics and optical engineering. There is a need to have fire resistant substrates for multilayer printed circuit boards in aerospace electronics and the development of new "LuVo" high temperature thermoplastic substrates meeting V-0 classification. The thermo-oxidative stability of their materials and their low moisture uptake point to potential applications including molecular imprinted polymers (MIPs) for nanosensors (explosives sensor), gas sensors, lithographic patterning, solar cells, supercapacitors and batteries and many more. Coatings applications include those requiring corrosion resistance, low surface tension while high discharge energy density leads to performance benefits for capacitors. This material system also supports electroactive polymer variants which can be engineered to have intrinsic piezo, pyro and ferroelectric properties to address opportunities in sensors, actuators ultrasound imaging and non volatile printed memories. There was also presented some models for ageing and performance predictions of polymer nanocomposites for exterior aerospace and defence applications. The conference closed with industrial coatings. One paper described coating technologies which have been developed to reduce the adhesion of ice to aerospace or engineering structures based on silicone formulations which have been shown to offer much lower adhesion levels compared to Teflon coatings. So indeed, polymers are widely used in space sector and a lot of science is behind the polymer coatings, where this project is focused on, trying to apply a dye film on top of some polymers. This can be understood as a coating technique and it will be directly linked with, for example, the control paints the adhesives and the thermal blankets; technologies so needed in the spacecrafts.
2.3. Related Studies
This study is based on research conducted by the scientists J.Jang and Y. Jeong (ref. 1). In their case it has been used poly (ethyleneterpgthalate) (PET) and poly (trimethyleneterephthalate) (PTT). PET is a type of polyester widely used in fibers, films and plastics for its good mechanical and physical properties. However, it is often difficult to obtain colors with a light shade and deep, especially in polyester microfibers, due to the large amount of light reflected. For this reason, they have studied a method of surface modification that increases the hydrophilic with water, the surface energy, as well as improving dyeability and subsequent treatments such as anti-wrinkle. The procedure consists of generating nanoroughness with an ultraviolet light irradiation and ozone (UV/O3).

State of the art 39
They also discuss about this ozone (O3), since because of this high intensity of the UV bulb, the O2 molecules in the air (treatment is not vacuum), it causes some bond breaking of molecules O-O and helping to create O3 molecules, which in fact the corrosive effect is much more effective and accentuated. Therefore the O3 is a parameter to consider while analyzing the results. Figure 2.9 shows clearly how this surface roughness increases with this method. In addition figure 2.8 shows how increases the roughness values measured on the surface of the fibers.
Fig. 2.8 The roughness parameters of untreated and treated PET films with 9.5 J/cm2 , where Ra, Rq, Rp, Rv and Rpv, denote roughness of average, root mean square, peak,
valley and peak-to-valley, respectively.
Fig. 2.9 Three dimension views of non-contact mode AFM images of PET films. (a)
Untreated surface; (b) UV/ O3 irradiated surface (9.5 J/cm2).
This treatment reduces significantly the reflection of visible light in certain wavelengths. The reflectance profile of the surface treated with UV / O3 is shown in figure 2.10. With higher doses of irradiation, the reflectance is reduced proportionately in the region of small wavelengths, particularly in the area around 400 nm.

40 Photochemical nanomodification of polymer surfaces: Aerospace applications
Figure 2.11 shows the difference in reflectance between the untreated PET and treated PET. It can be clearly observed a minimum in the range of 380-400 nm. The authors of the research grant this reduction in light reflection at the created surface nanoroughness.
Fig. 2.10 Effect of UV/O3 irradiation on the reflectance of treated PET fabrics.
Fig. 2.11 Reflectance changes of treated PET fabrics.
In both cases it is easy to see how the sample irradiated with more UV light, shown here with energy radiated per cm2 (J/cm2) decreases the reflectance of the polymer in regions close to 380-400 nm. It also looks like as it receives more energy, more reflectance decreased range grabs, going into the first case 2.4 J/cm2 from the 380 nm to 450 nm to restore normalcy, where in the same place the 9.5 J/cm2 was from 380 nm to 550 nm approximately.

State of the art 41
They can also quantify the roughness change, they change from 58 nm to 122 nm of average roughness (peak-valley) provided with an energy of 9.5 J/cm2. Regarding the polyester dyeability, it is said that does not diminish with respect to the ones that has not been treated, but neither increases dramatically. To conclude they say that this method of creating nanoroughness for polyester fibers may be left behind in the process based on current trends of plasma and sputtering etching techniques, in order to make a good dispersion of the paint on the material. Apart from this experimental work there has been found other references that use UV as a method to modify the surface of a polymer. However these changes are made with UV light in different ways, some works using laser light or some others monochromatic or in other ways... There are not very specific papers such as this mentioned before, talking of using the roughness; but speaking how to degrade the material to see what happens, or use it to join other compounds or even how it affects biologically to the polymer the UV light. Within the range of UV light there is a wide variety of wavelengths. It can be distribute some of these wavelengths with the following applications.
230-400 nm: Optical sensors
230-365 nm: Barcodes
240-280 nm: Disinfection (DNA absorption peak at 260nm in)
250 to 300 nm: Drug detection
270-300 nm: Analysis of proteins, DNA sequencing
280-400 nm: Visualizing cells
300-365 nm: Cured polymers
300-320 nm: Light therapy Other references are found, most of them interesting; here there are summarized three and one is just commented. The first one corresponds to the reference (ref. 2) comparing UV-degradation chemistry of some polymers. The photodegradation mechanism of polymers highly depends on the type and concentration of chromophores present. A chromophore is the part of a molecule responsible for its color. The color arises when a molecule absorbs certain wavelengths of visible light and transmits or reflects others. The chromophore is a region in the molecule where the energy difference between two different molecular orbitals falls within the range of the visible spectrum.
42 Photochemical nanomodification of polymer surfaces: Aerospace applications
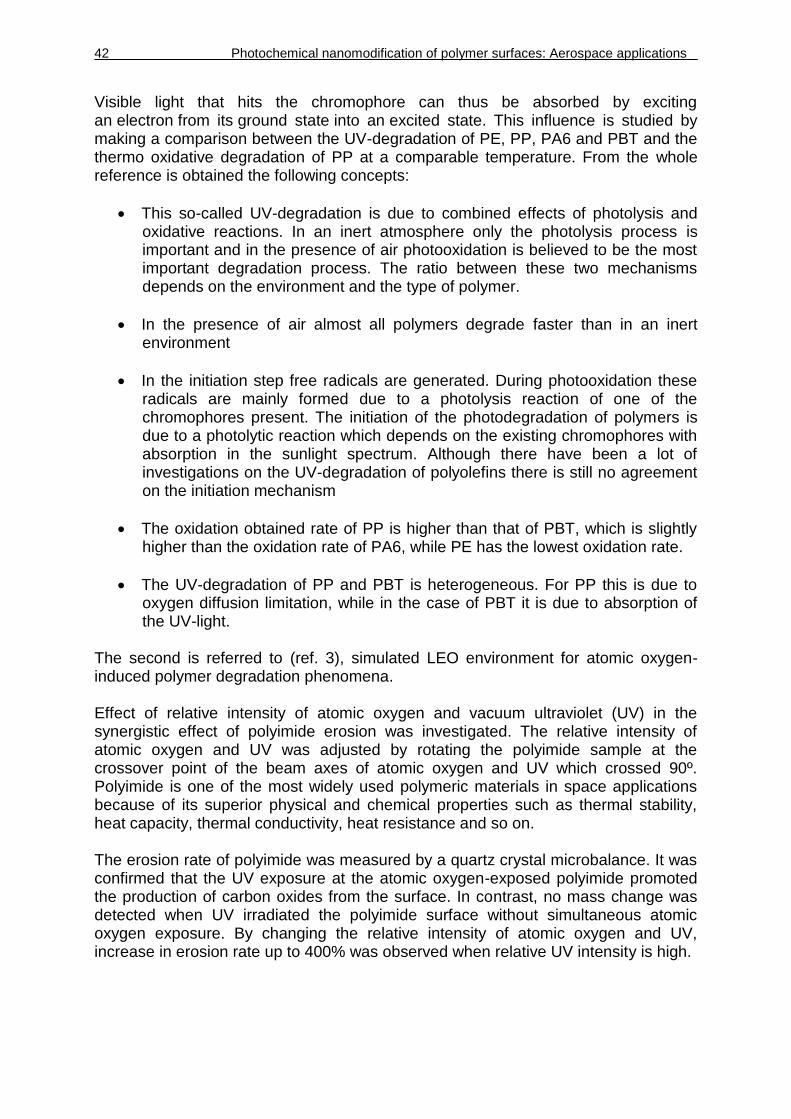
Visible light that hits the chromophore can thus be absorbed by exciting an electron from its ground state into an excited state. This influence is studied by making a comparison between the UV-degradation of PE, PP, PA6 and PBT and the thermo oxidative degradation of PP at a comparable temperature. From the whole reference is obtained the following concepts:
This so-called UV-degradation is due to combined effects of photolysis and oxidative reactions. In an inert atmosphere only the photolysis process is important and in the presence of air photooxidation is believed to be the most important degradation process. The ratio between these two mechanisms depends on the environment and the type of polymer.
In the presence of air almost all polymers degrade faster than in an inert environment
In the initiation step free radicals are generated. During photooxidation these radicals are mainly formed due to a photolysis reaction of one of the chromophores present. The initiation of the photodegradation of polymers is due to a photolytic reaction which depends on the existing chromophores with absorption in the sunlight spectrum. Although there have been a lot of investigations on the UV-degradation of polyolefins there is still no agreement on the initiation mechanism
The oxidation obtained rate of PP is higher than that of PBT, which is slightly higher than the oxidation rate of PA6, while PE has the lowest oxidation rate.
The UV-degradation of PP and PBT is heterogeneous. For PP this is due to oxygen diffusion limitation, while in the case of PBT it is due to absorption of the UV-light.
The second is referred to (ref. 3), simulated LEO environment for atomic oxygen-induced polymer degradation phenomena. Effect of relative intensity of atomic oxygen and vacuum ultraviolet (UV) in the synergistic effect of polyimide erosion was investigated. The relative intensity of atomic oxygen and UV was adjusted by rotating the polyimide sample at the crossover point of the beam axes of atomic oxygen and UV which crossed 90º. Polyimide is one of the most widely used polymeric materials in space applications because of its superior physical and chemical properties such as thermal stability, heat capacity, thermal conductivity, heat resistance and so on. The erosion rate of polyimide was measured by a quartz crystal microbalance. It was confirmed that the UV exposure at the atomic oxygen-exposed polyimide promoted the production of carbon oxides from the surface. In contrast, no mass change was detected when UV irradiated the polyimide surface without simultaneous atomic oxygen exposure. By changing the relative intensity of atomic oxygen and UV, increase in erosion rate up to 400% was observed when relative UV intensity is high.

State of the art 43
In conclusion a quantitative analysis in simultaneous exposure of atomic oxygen and UV on the polyimide erosion was carried out. Experimental results obtained in their study are summarized as follows:
Without UV exposures, atomic oxygen-induced polyimide erosion followed cosine distribution regarding incident angle of atomic oxygen. This experimental result suggested that the reaction probability of atomic oxygen is independent of the incident angle. This is physically explained by the presence of micro-roughness at the polymer surface.
UV-induced enhancement of mass loss phenomenon was observed if the sample was previously oxidized by atomic oxygen. This result suggested that the UV exposure fosters the production of oxide species which is embedded at the polyimide surface.
The third (ref. 4), is just creating nanoroughness, although not made by UV light, to achieve changes in reflective properties, and go back to a figure very similar to the (ref. 1) The last, the most relevant, because it is published in the MSR (Materials Research Science) bulletin and talks specifically about the polymers in the space and how to try to modify its surface to obtain durable materials. (ref. 5). One way proposed to protect those polymers are using coatings to guard the base array, but the UV is used for doing a first coating treatment with protective layer and put back to radiate UV to "dry it out" fast. It is exposed that polymer materials, paints, graphite, and polymer-based composites exposed to space environmental factors such as atomic oxygen (AO), ultraviolet radiation, and extreme thermal cycling conditions in low Earth orbits (LEO’s) and charged particles in geosynchronous orbits (GEO’s) have been shown to undergo significant accelerated deterioration of their major structural and functional properties that include surface erosion, mass loss, and thermal-optical properties changes. Many protective approaches, including protective coatings and mechanical metal especially for synthesized bulk materials, are used to reduce the effects of the space environment. Presently, a number of different technological solutions are offered to solve the problems discussed. Protection is provided by metals or by stable inorganic compounds (mostly by oxides or oxide-based surface structures). An example of protecting measures, for example some oxide coatings are often deposited by one of a few advanced deposition techniques such as electron-beam deposition or magnetron sputtering. Also, specially selected or synthesized materials are used that are able to form oxide(s)-based compounds in a top surface layer under aggressive oxidative environments due to surface conversion processes. Surface modification technologies were developed for protection and for imparting new functional properties to materials and can roughly be divided into two broad categories: processes that were developed for protection of materials, films, and structures, and processes that were developed with the major goal to change or impart new functional properties to the treated surfaces.

44 Photochemical nanomodification of polymer surfaces: Aerospace applications
Protective coatings of oxides, such as silicon and aluminum, deposited on the surface of polymers or composites provide improved erosion resistance. In the chemical approach, the surface modification of space-approved, commonly used polymer-based materials, paints, and carbon-fiber-reinforced polymer composites enriches the top surface layers with specially selected elements that are able to form stable protective oxides or oxide-based protective surface structures in oxidative environments that allow for the prevention of erosion and etching in LEO and in other severe oxidative environments. However most polymers, especially those used in space applications, however, do not contain active functional groups, and a silylating agent will not react with them. A very important process is the surface activation that can be done using processes such as UV-induced oxidation, oxidizing plasmas, flame treatment, ion bombardment, or wet chemical treatment that oxidizes the polymer surface. Photochemical oxidation (physical and chemical changes) involves an increase in concentration of a variety of oxygen groups, cross linking, and chain scission. These reactions as well as the depth of UV penetration and oxidation all depend on the chemical structure of the polymer, the power and wavelength of the excitation source, time of exposure, and the sample temperature during irradiation. Surface modification technologies present a viable alternative for protection and impartation of new functional properties to polymers, paints, and other carbon-based materials and structures used in space. The developed processes allow the atomic oxygen erosion to be reduced drastically by creating a self-healing protective layer that allows, in turn, protection of the major functional properties such as the thermal-optical properties. Ion beam–based surface modification treatments also imparted new functional properties, such as reduced glare or increased surface conductivity, to surfaces that extended the use of traditional space materials in space applications. The surface modification technologies are going to be influenced by new nanomaterials and new technological processes and solutions associated with them. For example, aluminum or boron oxide nanopowders, which are coated with thin polymer films (thickness between 20 and 300 nm) to prevent agglomeration, can be used as solid propellants in rocket engines. This last reference has become important as the project has been developed, because it is dealing with coatings to protect the polymer, and we will see that the final conclusion is that maybe this UV procedure done in this project can be used to help the process of those protective coatings.
Work Methodology 45
Chapter 3. Work Methodology
For this project it had to be thought, designed and built a new experiment. The technology needed was not able to handle the project and it had to be search the device able to give that amount of UV light intensity, also a support to place on the samples safely; (always taking into account all relevant security instructions), and think in which is the most appropriate measurement instrument for the analysis.
3.1. Inventory
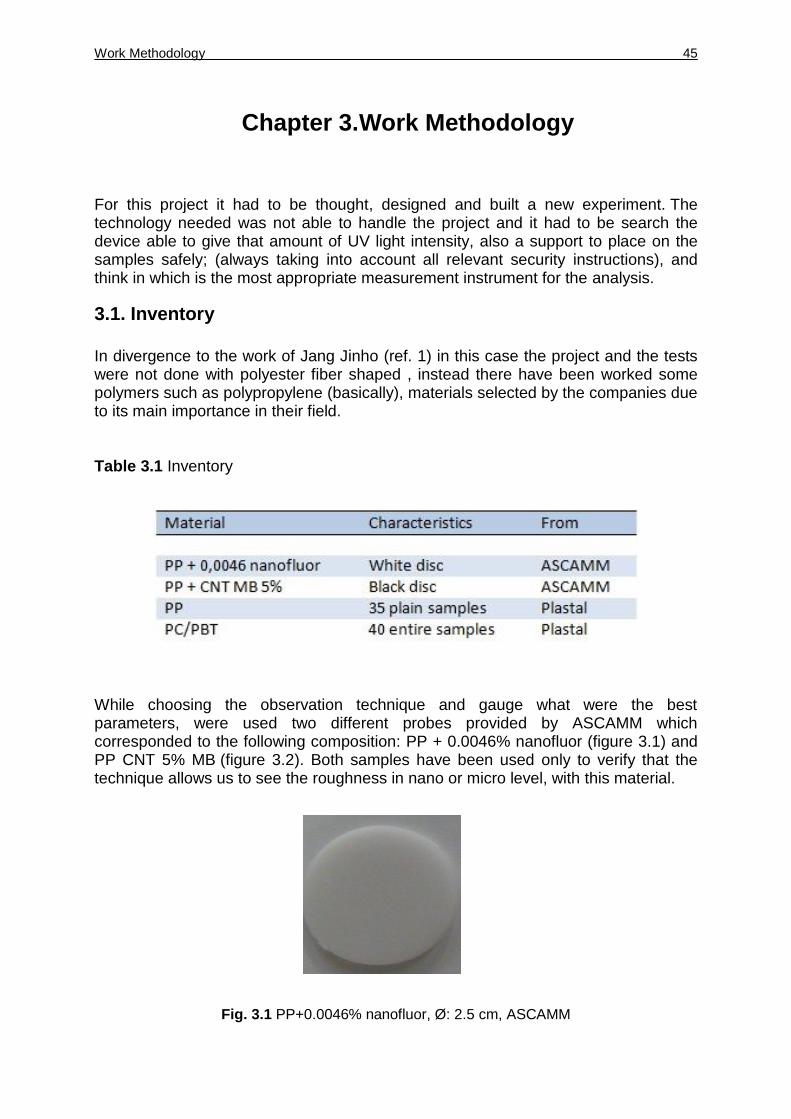
In divergence to the work of Jang Jinho (ref. 1) in this case the project and the tests were not done with polyester fiber shaped , instead there have been worked some polymers such as polypropylene (basically), materials selected by the companies due to its main importance in their field. Table 3.1 Inventory While choosing the observation technique and gauge what were the best parameters, were used two different probes provided by ASCAMM which corresponded to the following composition: PP + 0.0046% nanofluor (figure 3.1) and PP CNT 5% MB (figure 3.2). Both samples have been used only to verify that the technique allows us to see the roughness in nano or micro level, with this material.
Fig. 3.1 PP+0.0046% nanofluor, Ø: 2.5 cm, ASCAMM
46 Photochemical nanomodification of polymer surfaces: Aerospace applications
Fig. 3.2 PP CNT MB 5%, Ø: 2.5 cm, ASCAMM
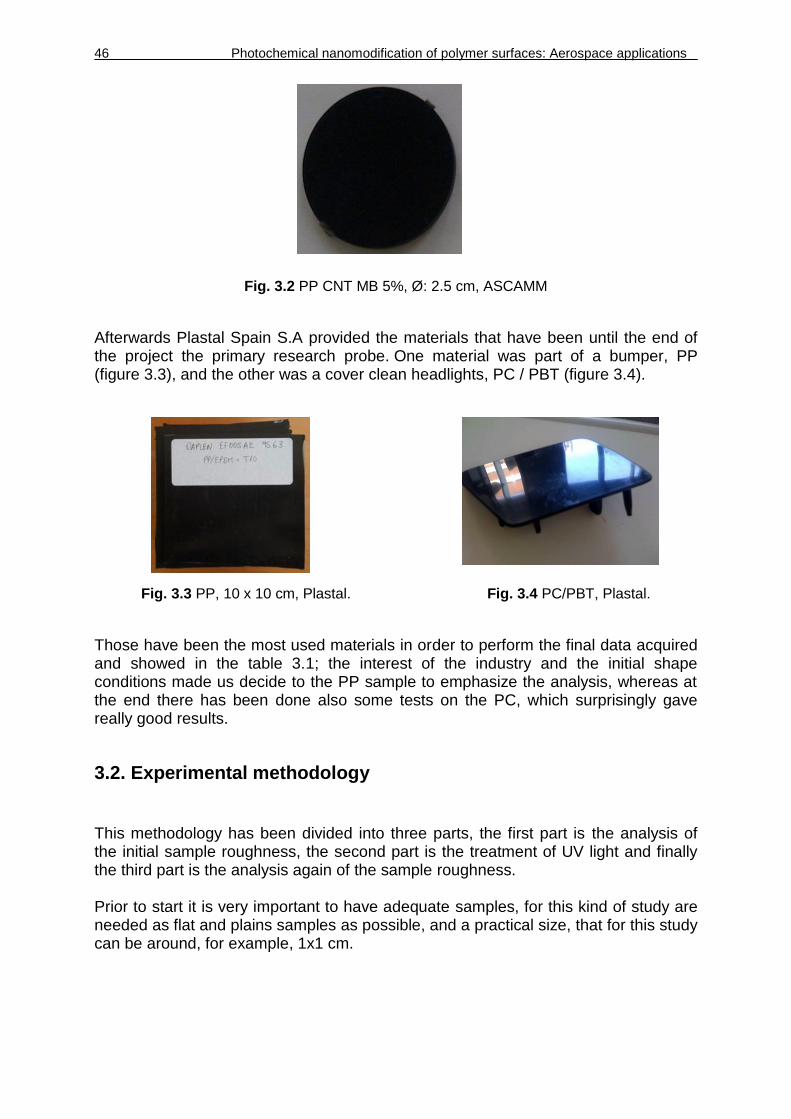
Afterwards Plastal Spain S.A provided the materials that have been until the end of the project the primary research probe. One material was part of a bumper, PP (figure 3.3), and the other was a cover clean headlights, PC / PBT (figure 3.4).
Fig. 3.3 PP, 10 x 10 cm, Plastal. Fig. 3.4 PC/PBT, Plastal.
Those have been the most used materials in order to perform the final data acquired and showed in the table 3.1; the interest of the industry and the initial shape conditions made us decide to the PP sample to emphasize the analysis, whereas at the end there has been done also some tests on the PC, which surprisingly gave really good results.
3.2. Experimental methodology
This methodology has been divided into three parts, the first part is the analysis of the initial sample roughness, the second part is the treatment of UV light and finally the third part is the analysis again of the sample roughness. Prior to start it is very important to have adequate samples, for this kind of study are needed as flat and plains samples as possible, and a practical size, that for this study can be around, for example, 1x1 cm.

Work Methodology 47
Once the proper sample for the experiment is obtained, the surface roughness is analyzed with the interferometric microscope, that is going to give as outputs some interesting parameters, but just the roughness average of the observed area is needed. This area can be significant from the rest of the sample or not. If it is the first observation and analysis of the sample, the correct procedure would be analyzing different areas to see if the values correspond to a same order of magnitude, that way is like doing an average of the roughness average, but just to see the confidentiality of the instrument with that specific sample. Usually if it is possible to find an appropriate zone to do the measures this obtained values could be extrapolated to other areas. However, as the main interest is to see the roughness change, is very important to observe always the same area. To try to be able to observe the same area before and after the treatment a mask is used, a mask like figure 3.5, a mask that can create some references that may help to know after the treatment which areas and are treated or not.
Fig. 3.5 Nickel mask, used to create a treatment pattern.
This is a nickel mask and has a stripes pattern that are actually "holes" in the form of a stripe, this pattern width is approximately 40-50 um depending on which one is taken, because there are other sizes. The fact of being a nickel based mask can permit to locate a magnet below the polymer and the mask above, in such a way that this mask is “attached” magnetically and does not move. So after analyzing the surface roughness average of the samples, a magnet and the mask are located around the polymer and then directly exposed to the UV light. At this part of the process there are some security conditions to apply:
A fume cupboard must always be turned on, at the maximum extraction speed.
Never put your hand under the light if it is switched on.

48 Photochemical nanomodification of polymer surfaces: Aerospace applications
No person will stare to any kind of light that could go out of the box if there is an error.
The sample manipulator will use gloves and long sleeves so that when the samples are worked out inside the box if there is some remnant radiation does not directly touch the skin.
The sample manipulator will use special glasses or at least glass glasses that naturally polarize UV light.
It will be left the equipment a few minutes cooling down before to shut down the fume cupboard and the ventilator.
Always bearing in mind these safety conditions, the sample is placed in the box, between some brands that have been drawn to know where the center of the plate is and therefore control that the radiation touches the surface in the right area. After the box is closed and the lamp is prepared to work doing some series of automated checks such as of the air flow cooling, radiofrequency radiation and other important parameters. If the checks results are not ok the light is not working. Once turned on is controlled the time exposure, in this work is handled manually, and finally the sample is analyzed again with the interferometer, taking great care with not touching the treated area.
3.2.1. Scientific instrumentation for measuring the surface roughness
First of all it was necessary to think about what instrument was going to be used to measure the initial and final roughness, because when the object to be analyzed is a polymer there are some reasons that indicate to not to use mechanical contact and do it by light observation.
3.2.1.1. AFM
A mechanical observation was precisely the one used by the work of reference (ref. 1) an Atomic Force Microscope (figure 3.6).
Fig. 3.6 AFM

Work Methodology 49
One very high-resolution type of scanning probe microscopy is an atomic force microscopy (AFM) or scanning force microscopy (SFM). Feeling the surface with a mechanical probe gives he information and its resolution is demonstrated to be of fractions of a nanometer which routes this technique to be one of the foremost tools for imaging, measuring, and manipulating matter at the nano scale. Also electric potentials can also be scanned using conducting cantilevers and currents can even be passed through the tip to probe the electrical conductivity or transport of the underlying surface.
Fig. 3.7 Block diagram of an atomic force microscope
The working principle of this technique is a cantilever with a sharp tip (probe, figure 3.9) at its end that is used to scan the specimen surface. Normally the cantilever is silicon or silicon nitride with a tip radius of curvature on the order of nanometers. When the tip is brought into proximity of a sample surface, forces between the tip and the sample lead to a deflection of the cantilever according to Hooke's law. Depending on the situation, forces that are measured in AFM include mechanical contact force, van der Waals forces, capillary forces, chemical bonding, electrostatic forces, magnetic forces (see magnetic force microscope, MFM), Casimir forces, salvation forces, etc. The reflection off the back of the cantilever of a laser light from a solid state diode is collected by a position sensitive detector (PSD) consisting of two closely spaced photodiodes whose output signal is collected by a differential amplifier (figure 3.8). Angular displacement of cantilever results in one photodiode collecting more light than the other photodiode, producing an output signal (the difference between the photodiode signals normalized by their sum) which is proportional to the deflection of the cantilever. It detects cantilever deflections <10 nm (thermal noise limited).
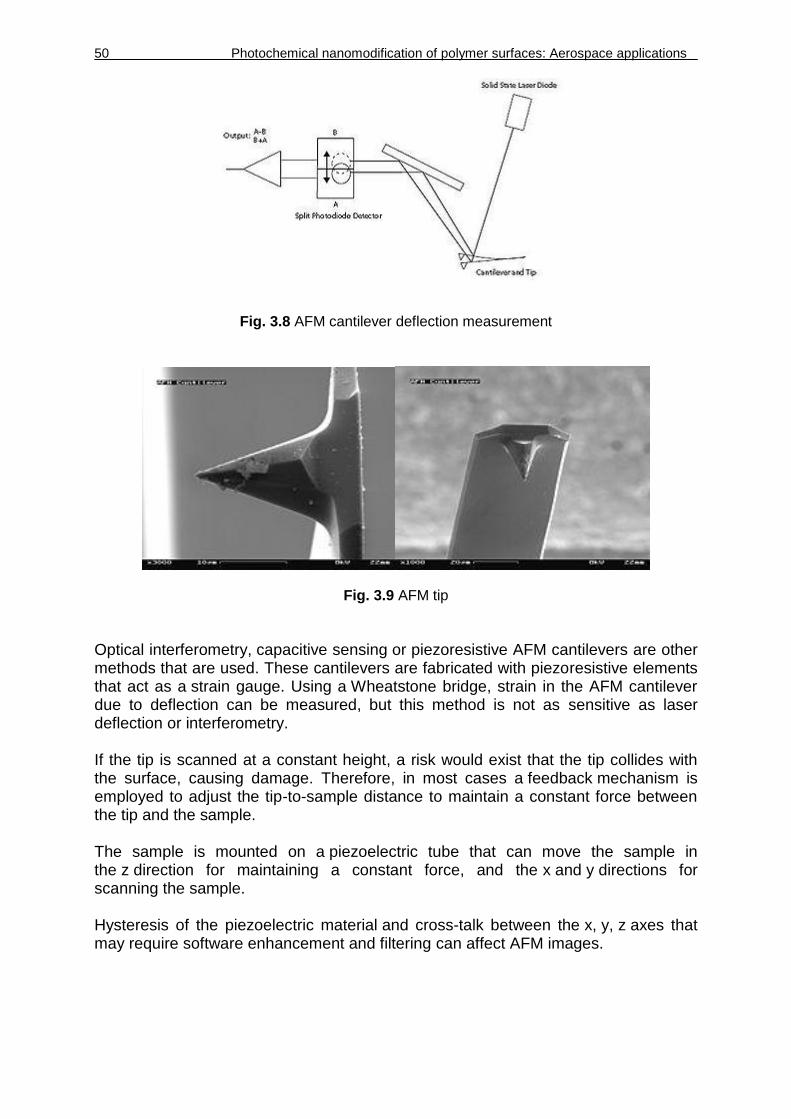
50 Photochemical nanomodification of polymer surfaces: Aerospace applications
Fig. 3.8 AFM cantilever deflection measurement
Fig. 3.9 AFM tip Optical interferometry, capacitive sensing or piezoresistive AFM cantilevers are other methods that are used. These cantilevers are fabricated with piezoresistive elements that act as a strain gauge. Using a Wheatstone bridge, strain in the AFM cantilever due to deflection can be measured, but this method is not as sensitive as laser deflection or interferometry. If the tip is scanned at a constant height, a risk would exist that the tip collides with the surface, causing damage. Therefore, in most cases a feedback mechanism is employed to adjust the tip-to-sample distance to maintain a constant force between the tip and the sample. The sample is mounted on a piezoelectric tube that can move the sample in the z direction for maintaining a constant force, and the x and y directions for scanning the sample. Hysteresis of the piezoelectric material and cross-talk between the x, y, z axes that may require software enhancement and filtering can affect AFM images.

Work Methodology 51
Newer AFM’s make use of closed-loop scanners which practically eliminate these problems. Also separated orthogonal scanners are used (as opposed to a single tube) which also serve to eliminate part of the cross-talk problems. Due to the nature of AFM probes, they cannot normally measure steep walls or overhangs. Specially made cantilevers and AFM’s can be used to modulate the probe sideways as well as up and down (as with dynamic contact and non-contact modes) to measure sidewalls, at the cost of more expensive cantilevers, lower lateral resolution and additional artifacts.
3.2.1.2. Interferometric microscope
However we realized that a mechanical measurement with a physical tip could damage the sample by scratching the surface if this is not hard enough. In our case we are talking about polymers, which are not recommended to be analyzed mechanically, although we did not discarded it at all, just in case the other technique doesn’t work. The work of reference used mechanical analysis (AFM), but they already knew the kind of material they were treating; fibers, polyester… and fibers are sizes so small that maybe it was a good idea to use the AFM, because of its direct good resolution to small sizes like this, whereas in our case the surface area to be treated was not that dramatic, and as the objective was to see a global change in the roughness, it was easy to think in a higher size of the analyzed area. Then it was thought of using another technique to be able to measure the surface roughness at nanoscale without a mechanical behavior, as a result it was decided to use interferometric microscopy, a proper equipment to do this kind of analysis, but it had to be seen if it was good also for these materials. That's why it was chosen to go for an interferometric microscope and an optical microscope for the analysis before and after the treatment; it is possibly better to try to use light, in fact that’s how a scientist works: hipotesis, make mistakes and keep learning. Interferometric microscopy or imaging interferometric microscopy is the concept related to holography. Interferometric microscopy (diagram shown in figure 3.10) allows enhancement of resolution of optical microscopy due to interferometric (holographic) registration of several partial images (amplitude and phase) and the numerical combining. Fig. 3.10 Optical arrangement for registering a single partial image for interferometric microscopy.

52 Photochemical nanomodification of polymer surfaces: Aerospace applications
In this technique, the image of a micro-object is synthesized numerically as a coherent mixture of partial images with registered amplitude and phase. For registration of partial images, the conventional holographic set-up is used, with the reference wave, which is usual for the optical holography. Many expositions allow the numerical emulation of a large Numerical Aperture objective, at moderate values of the Numerical Aperture of the objective used to register partial images. Scanning and precise detection of small particles is done with similar techniques. As the united image keeps both amplitude and phase information, the interferometric microscopy can be especially efficient for the phase objects, allowing detection of light variations of index of refraction, which cause the phase shift or the light passing through for a small fraction of a radian. To better understand the operation of the interferometric microscope, here explained in more detail how the holography technology is. Holography (outline of the operation concept figure 3.11) is a technique that allows the light scattered from an object to be recorded and later reconstructed so that it appears as if the object is in the same position relative to the recording medium as it was when recorded. The image changes as the position and orientation of the viewing system changes.
Fig. 3.11 Working schema of the holographic recording process
Holography is often referred to as 3D photography, this is a misconception. Sound would be a better analogy, recording where the sound field is encoded in such a way that it can later be reproduced. In holography, some of the light scattered from an object or a set of objects falls on the recording medium. A second light beam, known as the reference beam, also illuminates the recording medium, so that interference occurs between the two beams. The resulting light field is an apparently random pattern of varying intensity which is the hologram.
Work Methodology 53
It can be shown that if the hologram is illuminated by the original reference beam, a light field is diffracted by the reference beam which is identical to the light field which was scattered by the object or objects. That way, someone looking into the hologram "sees" the objects even though they are not there. There are a variety of recording materials which can be used, including photographic film. There is a phenomenon known as interference that occurs when one or more wavefronts are superimposed. Diffraction occurs whenever a wave front encounters an object. The process of producing a holographic reconstruction is explained below purely in terms of interference and diffraction. It is somewhat simplistic, but is accurate enough to provide an understanding of how the holographic process works.
3.2.1.2.1. Plane wavefronts
Diffraction harsh is a structure with a repeating pattern. A direct example is a metal plate with slits cut at regular intervals. Light rays travelling through it are bent at an angle determined by λ, the wavelength of the light and d, the distance between the slits and is given by sinθ = λ/d. Superimposing two plane waves from the same light source lies to a very simple hologram can be made. One (the reference beam) hits the photographic plate normally and the other one (the object beam) hits the plate at an angle θ. The relative phase between the two beams varies across the photographic plate as 2π y sinθ/λ where y is the distance along the photographic plate. The two beams interfere with one another to form an interference pattern. The relative phase changes by 2π at intervals of d = λ/sinθ so the spacing of the interference fringes is given by d. Thus, the relative phase of object and reference beam is encoded as the maxima and minima of the fringe pattern. When the photographic plate is developed, the fringe pattern acts as a diffraction grating and when the reference beam is incident upon the photographic plate, it is partly diffracted into the same angle θ at which the original object beam was incident. The diffraction grating created by the two waves interfering has reconstructed the "object beam" and it is therefore a hologram as defined above. Thus, the object beam has been reconstructed.
3.2.1.2.1. Mathematical model
A complex number U which represents the electric or magnetic field of the light wave coud be the way to model it. The amplitude and phase of the light are represented by the absolute value and angle of the complex number. The object and reference waves at any point in the holographic system are given by UO and UR.

54 Photochemical nanomodification of polymer surfaces: Aerospace applications
The combined beam is given be Uo + UR. The energy of the combined beams is proportional to the square of magnitude of the electric wave:
(3.1)
If a photographic plate is exposed to the two beams, and then developed, its transmittance, T, is proportional to the light energy which was incident on the plate, and is given by
(3.2) where k is a constant. When the developed plate is illuminated by the reference beam, the light transmitted through the plate, UH is (3.3) It can be seen that UH has four terms.
The first of these is kUO, since URUR* is equal to one, and this is the reconstructed object beam.
The second term represents the reference beam whose amplitude has been modified by UR
2.
The third also represents the reference beam which has had its amplitude modified by UO
2; this modification will cause the reference beam to be diffracted around its central direction.
The fourth term is known as the "conjugate object beam." It has the reverse curvature to the object beam itself, and forms a real image of the object in the space beyond the holographic plate.
Early holograms had both the object and reference beams illuminating the recording medium normally, which meant that all the four beams emerging from the hologram, were superimposed on one another. The off-axis hologram was developed by Leith and Upatnieks to overcome this problem. The object and reference beams are incident at well-separated angles onto the holographic recording medium and the virtual, real and reference wavefronts all emerge at different angles, enabling the reconstructed object beam to be imaged clearly.

Work Methodology 55
3.2.2. Equipment used
3.2.2.1. Interferometric microscope
Interferometric microscopy, using the hologram, maintains information about the amplitude and phase of the field. Several holograms can maintain information about the same distribution of light emitted in different directions. The numerical analysis of the hologram can reproduce what has been "seen" by the instrument, and you receive an amount of data about the surface. At the CRnE laboratory, there is an interferometric microscope from VEECO model WYKO NT9800/9300 PROFILER (figure 3.12)
Fig. 3.12 Representation of the interferometric microscope located at the CRnE, with its main parts remarked.
Explaining some parts of 3.12, we find that:
The IMOA, the top part of the equipment, contains a CCD camera and a Multiple Magnification Detector (MMD) with Field of View (FOV) lenses. It also contains a scanner assembly that allows for precise movement of the measurement objectives, which are attached to the bottom of the IMOA on a turret or a single objective adapter. Dual LED’s with a filter flipper assembly provide illumination to the IMOA. Light from these LED’s travels through the IMOA and is reflected down to the objective by a beam splitter.

56 Photochemical nanomodification of polymer surfaces: Aerospace applications
Once the light reaches the objective, another beam splitter separates the light into two beams. One beam (the reference beam) reflects from a super smooth reference mirror in the objective, while the other (the test beam) reflects from the surface of the sample and back to the objective.
If the surface of the sample is in focus, the two light beams recombine and form an interference pattern of light and dark bands called fringes. The number of fringes and their spacing depends upon the relative tilt between the sample and the reference mirror. If the sample and the reference are parallel, only one large fringe appears. In this case, the fringes are said to be nulled. The interference pattern is imaged by the CCD camera, and the signal is transferred to the computer, where it is processed by the Vision software. Vision then produces a graphical output display representing a contour map of the sample’s surface.
The Wyko NT9800/9300 system supports two standard measurements: PSI and VSI.
PSI Measurement Mode (Phase-shifting interferometry) (PSI), a mechanical translation system precisely alters the optical path length of the test beam. Each optical path change causes a lateral shift in the fringe pattern. The shifted fringes are periodically recorded by the camera, producing a series of interferograms. Computerized calculations then combine these interferograms to determine the surface height profile.
This mode uses a narrowband light source, is typically used to test smooth surfaces (roughness less than 30 nm), such as mirrors, optics, or other highly polished samples. It is very accurate, resulting in vertical measurements with subnanometer resolution. However, PSI cannot obtain a correct profile for objects that have large step-like height changes, and this method becomes ineffective as height discontinuities of adjacent pixels approach one quarter of the used wavelength (λ/4, or about 135 nm when using a 535-nm filter).
VSI Measurement Mode (Vertical scanning interferometry) (VSI), an internal translator scans vertically during the measurement as the camera periodically records frames. As each point on the surface comes into focus, the modulation on that point reaches a maximum, and then tapers off as the translator passes through focus. By recording the height of the translator at maximum modulation, the system can determine the height of each pixel. The maximum scan length for a VSI scan is 10mm. This method uses a broadband light source, is effective for measuring objects with rough surfaces, and those with adjacent pixel-height differences greater than λ/4. However, it yields precision in the nanometer range, rather than in the subnanometer range, as does PSI.

Work Methodology 57
Z-Axis and Tip/Tilt Cradle. The IMOA is mounted on a motorized Z-axis. By raising or lowering the Z-axis, the system can accommodate samples of many different sizes. The Z-axis is raised and lowered via the Profiler Controls in the Intensity window. The Z-axis has an optical limit switch and a mechanical crash stop to prevent the IMOA and objectives from crashing into the stage. Both the limit switch and the crash stop are initially set at the factory. The IMOA sits in the tip/tilt cradle, which is attached to the Z-axis. The tip/tilt cradle allows ±4° of tip and tilt, accommodating sample surfaces of many different slopes.
Sample Stage. The standard NT9800/9300 system comes with a motorized stage capable of eight inches of travel in both the X and Y directions motion of the motorized stage is controlled using the mouse via the Profiler Controls in the Intensity window.
It is very important the approach that is made to the sample, from there, the parameters of the VSI or PSI can be varied to achieve a better definition for what is the material, as it is not the same to work with metals than plastics. In principle is important, for example that the material is reflective. However, if the material is not very reflective, you can play with the parameters that define the modes, the number of samples should be taken, the distance it must travel while analyzing, etc... In figure 3.13 it is seen some sample images that could be done while the technique was going under control.
Fig. 3.13 Example of measure. Two images of the nickel mask.
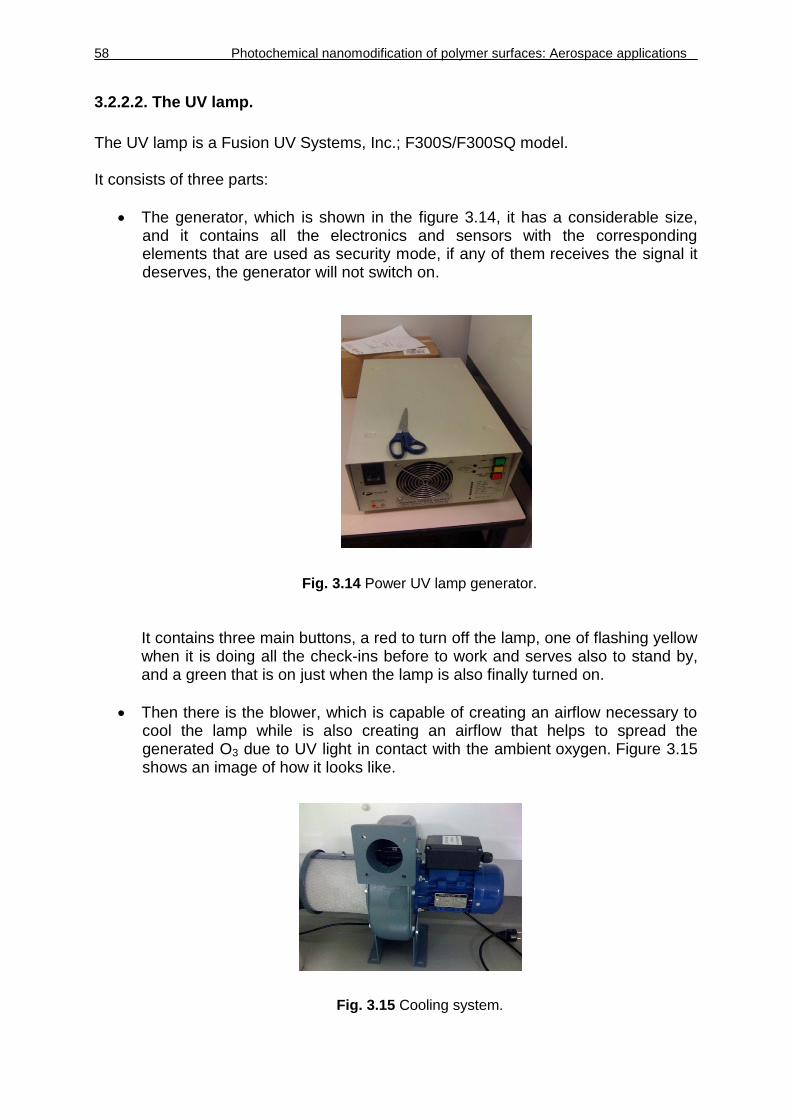
58 Photochemical nanomodification of polymer surfaces: Aerospace applications
3.2.2.2. The UV lamp.
The UV lamp is a Fusion UV Systems, Inc.; F300S/F300SQ model. It consists of three parts:
The generator, which is shown in the figure 3.14, it has a considerable size, and it contains all the electronics and sensors with the corresponding elements that are used as security mode, if any of them receives the signal it deserves, the generator will not switch on.
Fig. 3.14 Power UV lamp generator. It contains three main buttons, a red to turn off the lamp, one of flashing yellow when it is doing all the check-ins before to work and serves also to stand by, and a green that is on just when the lamp is also finally turned on.
Then there is the blower, which is capable of creating an airflow necessary to cool the lamp while is also creating an airflow that helps to spread the generated O3 due to UV light in contact with the ambient oxygen. Figure 3.15 shows an image of how it looks like.
Fig. 3.15 Cooling system.

Work Methodology 59
Third, the most important, the lamp. It is an iron bulb without electrodes, which has an intensity of 120 W/cm. The spectrum of the lamp ranges from 200 nm to 600 nm, with a distribution shown in figure 3.16. This lamp is installed inside a protection box, as seen in figure 3.17 that helps the light emission with an elliptical reflector that concentrates these UV rays into an specific area.
Fig. 3.16 Total spectral radiant flux. Fig. 3.17 Structure protecting the UV lamp
3.2.2.3. The box
All this equipment that generates this UV rays comes without a place to locate the samples to treat them. While considering the procedure to follow, it was been looked at literature how it was resolved in other research centers. All are industrial companies, using a conveyor belt moving the sample when applying the UV light in order to try to control the speed of this belt with the intention of control that way the exposure time in a controlled way. In this case this work was not interested in a conveyor belt, since the samples were small; in fact so small that one can’t be sure of the exact exposure time, because when the sample comes into contact with the non direct light how is it known that this sample is not being treated yet? And neither it can’t be "played", easily with some parameters, the treatment distance for example or control safely the exit of the created O3, it is mandatory to remove it and not to promote danger around. So we ended up with a solution that was a box type such as an oven. For the design of the box, three factors were taken into account. The box itself should be an stainless material (essential considering that is generated some O3), it should also withstand temperatures as in a few seconds of running the light, all is heated up; also that some characteristics could be modified with the aim of being able to extract more data, always safely, and finally it also should try to provide the minimum direct light outside.
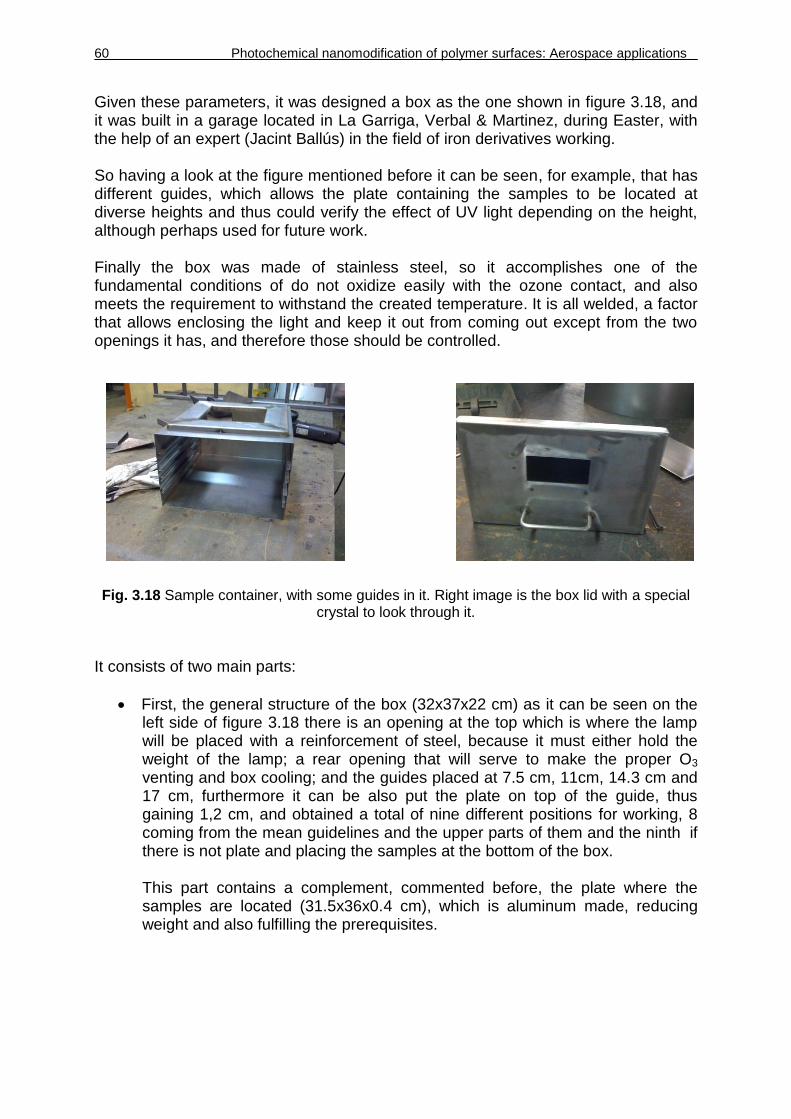
60 Photochemical nanomodification of polymer surfaces: Aerospace applications
Given these parameters, it was designed a box as the one shown in figure 3.18, and it was built in a garage located in La Garriga, Verbal & Martinez, during Easter, with the help of an expert (Jacint Ballús) in the field of iron derivatives working. So having a look at the figure mentioned before it can be seen, for example, that has different guides, which allows the plate containing the samples to be located at diverse heights and thus could verify the effect of UV light depending on the height, although perhaps used for future work. Finally the box was made of stainless steel, so it accomplishes one of the fundamental conditions of do not oxidize easily with the ozone contact, and also meets the requirement to withstand the created temperature. It is all welded, a factor that allows enclosing the light and keep it out from coming out except from the two openings it has, and therefore those should be controlled.
Fig. 3.18 Sample container, with some guides in it. Right image is the box lid with a special crystal to look through it.
It consists of two main parts:
First, the general structure of the box (32x37x22 cm) as it can be seen on the left side of figure 3.18 there is an opening at the top which is where the lamp will be placed with a reinforcement of steel, because it must either hold the weight of the lamp; a rear opening that will serve to make the proper O3 venting and box cooling; and the guides placed at 7.5 cm, 11cm, 14.3 cm and 17 cm, furthermore it can be also put the plate on top of the guide, thus gaining 1,2 cm, and obtained a total of nine different positions for working, 8 coming from the mean guidelines and the upper parts of them and the ninth if there is not plate and placing the samples at the bottom of the box. This part contains a complement, commented before, the plate where the samples are located (31.5x36x0.4 cm), which is aluminum made, reducing weight and also fulfilling the prerequisites.

Work Methodology 61
Second, the box lid, as it is shown on the right side of figure 3.18, consists of a lid with a handle, making it both functional and easy to open and close like a drawer and fits on the front of the box so that it does not allow going light to outside except from a glass that contains the central part. This glass is special to watch high intense lights, used to look directly a welding or for example used also to look at the sun directly without damaging the eyes. It was thought to put this glass with the purpose of being able to watch, if necessary, inside the box during treatment and make sure it works well and there is no problem.
Figure 3.19 shows the box completely closed, with a protecting plate on the top, also made of stainless steel, which will close the entrance of light from the UV lamp, and the right picture is the box completely open.
Fig. 3.19 The box completely closed (left), and completely opened (right).
3.2.2.4. The fume cupboard
As it was mentioned initially, the treatment of the generated ozone is very important so the box that has an opening in the back part to help the venting out of these small concentrations rapidly, but for more security it is recommended to locate the entire experiment in a fume cupboard. A fume cupboard is a place where you can experiment safely working with materials or procedures that may produce gases around and not putting ourselves in danger, is a more secure environment for working a normal experiment, and where it should be worked out some general experiments that are not done this way. Also, it is possible to create an atmosphere of a determined gas, but it always have an opening where the people doing the experiment can work from outside. There is a scheme in figure 3.20 where is shown in different colors the flow of gases.
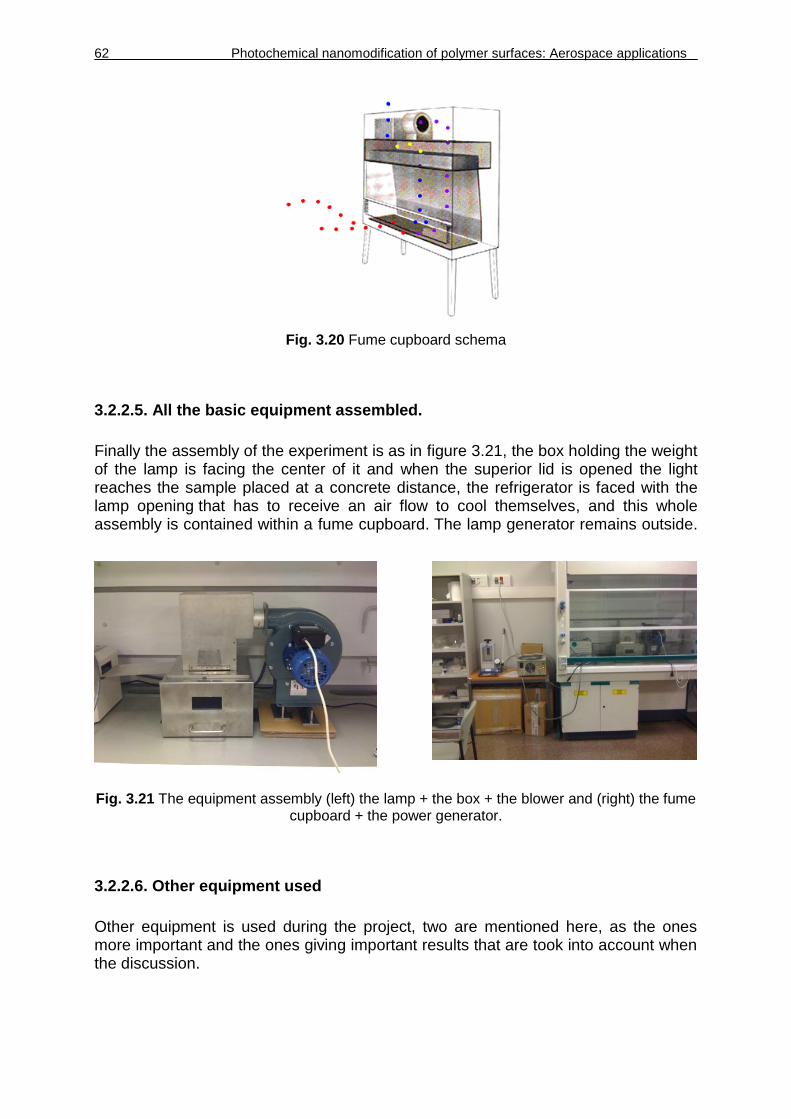
62 Photochemical nanomodification of polymer surfaces: Aerospace applications
Fig. 3.20 Fume cupboard schema
3.2.2.5. All the basic equipment assembled.
Finally the assembly of the experiment is as in figure 3.21, the box holding the weight of the lamp is facing the center of it and when the superior lid is opened the light reaches the sample placed at a concrete distance, the refrigerator is faced with the lamp opening that has to receive an air flow to cool themselves, and this whole assembly is contained within a fume cupboard. The lamp generator remains outside. Fig. 3.21 The equipment assembly (left) the lamp + the box + the blower and (right) the fume
cupboard + the power generator.
3.2.2.6. Other equipment used
Other equipment is used during the project, two are mentioned here, as the ones more important and the ones giving important results that are took into account when the discussion.
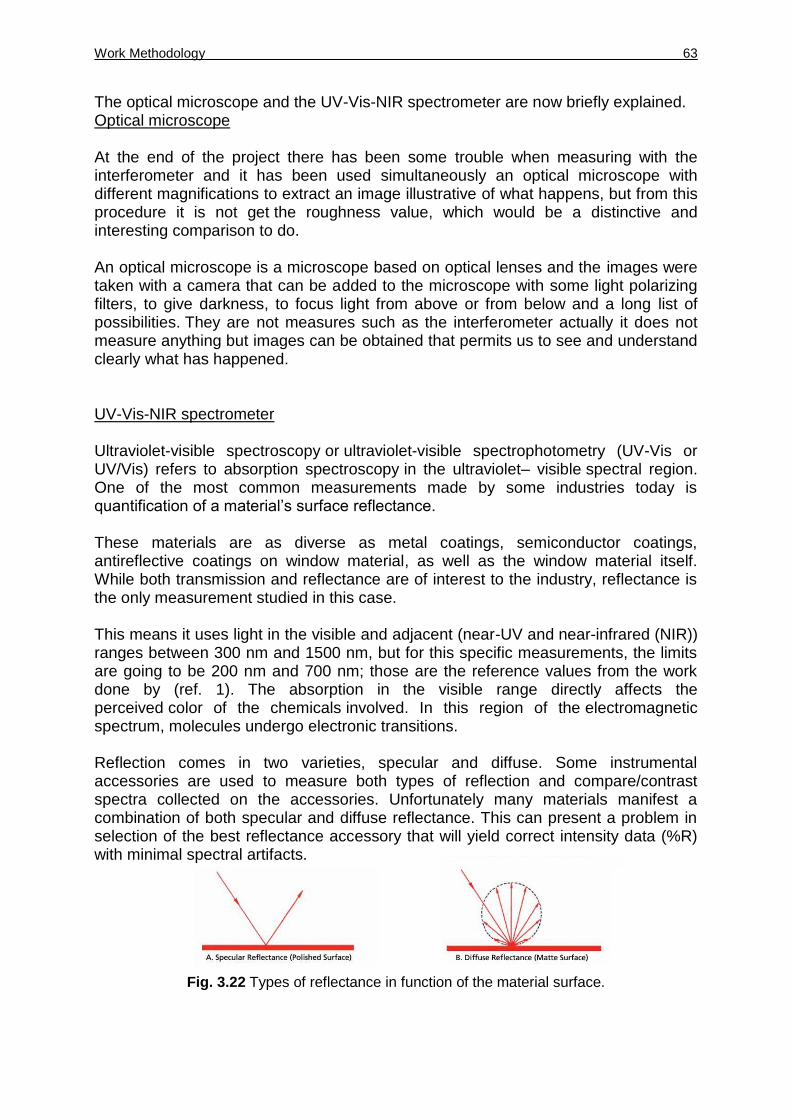
Work Methodology 63
The optical microscope and the UV-Vis-NIR spectrometer are now briefly explained. Optical microscope At the end of the project there has been some trouble when measuring with the interferometer and it has been used simultaneously an optical microscope with different magnifications to extract an image illustrative of what happens, but from this procedure it is not get the roughness value, which would be a distinctive and interesting comparison to do. An optical microscope is a microscope based on optical lenses and the images were taken with a camera that can be added to the microscope with some light polarizing filters, to give darkness, to focus light from above or from below and a long list of possibilities. They are not measures such as the interferometer actually it does not measure anything but images can be obtained that permits us to see and understand clearly what has happened. UV-Vis-NIR spectrometer Ultraviolet-visible spectroscopy or ultraviolet-visible spectrophotometry (UV-Vis or UV/Vis) refers to absorption spectroscopy in the ultraviolet– visible spectral region. One of the most common measurements made by some industries today is quantification of a material’s surface reflectance. These materials are as diverse as metal coatings, semiconductor coatings, antireflective coatings on window material, as well as the window material itself. While both transmission and reflectance are of interest to the industry, reflectance is the only measurement studied in this case. This means it uses light in the visible and adjacent (near-UV and near-infrared (NIR)) ranges between 300 nm and 1500 nm, but for this specific measurements, the limits are going to be 200 nm and 700 nm; those are the reference values from the work done by (ref. 1). The absorption in the visible range directly affects the perceived color of the chemicals involved. In this region of the electromagnetic spectrum, molecules undergo electronic transitions. Reflection comes in two varieties, specular and diffuse. Some instrumental accessories are used to measure both types of reflection and compare/contrast spectra collected on the accessories. Unfortunately many materials manifest a combination of both specular and diffuse reflectance. This can present a problem in selection of the best reflectance accessory that will yield correct intensity data (%R) with minimal spectral artifacts.
Fig. 3.22 Types of reflectance in function of the material surface.

64 Photochemical nanomodification of polymer surfaces: Aerospace applications
Specular reflection (figure 3.22, A) is generated by a smooth surface. The light ray’s angle of incidence is equal to the angle of reflection; therefore, specular materials frequently produce images on their surface (mirror). Specular reflectance is measured by a number of different types of accessories (VW, VN, and Universal Reflectance Accessory). Diffuse reflection (figure 3.21, B) is generated by a rough surface. In this case, the light ray’s incidence angle gives rise to a multiplicity of reflection angles; therefore, images are not produced. Diffuse reflectance is how people see the world since the vast majority of objects in the world are diffuse reflectors. Diffuse reflection is measured by an integrating sphere. After talking to some experts on this technique, Elaine Armelin and Bruno Dias from the CRnE, the integrating sphere is the one selected to perform the reflectance measurements. General Integrating Sphere (figure 3.23) the general optical designs for an integrating sphere. The transfer optics for the reference beam (M3, M4) and the sample beam (M1, M2) direct the light through open holes in the sphere body into the sphere where they strike the sample reflectance port and reference port areas. In the interior of the sphere you can see through the center-mount port the baffles that shield the detectors from first bounce sample reflectance or transmittance. Under normal measurement conditions the sample reflectance port and the reference port are covered by either a plate or sample material. The transmittance port and reference beam entry port are usually open during reflectance measurements and are areas where light diffusely reflected from the sample can escape from the sphere.
Fig. 3.23 Integrating sphere parts.
Two basic characteristics of integrating spheres relate to their photometric accuracy and freedom from such artifacts as steps at filter and detector changes. These are sphere size (diameter) and the presence of internal baffles that protect the detectors from first bounce reflectance from the sample. The nature of the artifacts and inaccuracies depends on the sample’s reflection intensity and properties (specular or diffuse).
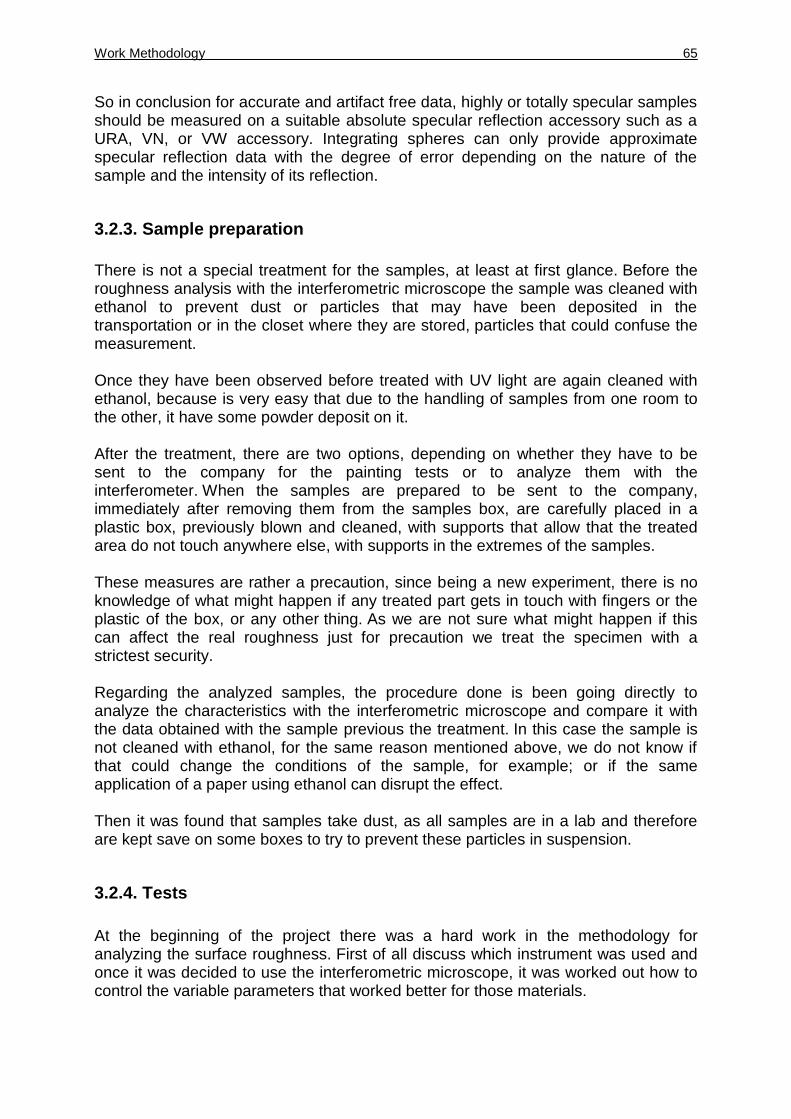
Work Methodology 65
So in conclusion for accurate and artifact free data, highly or totally specular samples should be measured on a suitable absolute specular reflection accessory such as a URA, VN, or VW accessory. Integrating spheres can only provide approximate specular reflection data with the degree of error depending on the nature of the sample and the intensity of its reflection.
3.2.3. Sample preparation
There is not a special treatment for the samples, at least at first glance. Before the roughness analysis with the interferometric microscope the sample was cleaned with ethanol to prevent dust or particles that may have been deposited in the transportation or in the closet where they are stored, particles that could confuse the measurement. Once they have been observed before treated with UV light are again cleaned with ethanol, because is very easy that due to the handling of samples from one room to the other, it have some powder deposit on it. After the treatment, there are two options, depending on whether they have to be sent to the company for the painting tests or to analyze them with the interferometer. When the samples are prepared to be sent to the company, immediately after removing them from the samples box, are carefully placed in a plastic box, previously blown and cleaned, with supports that allow that the treated area do not touch anywhere else, with supports in the extremes of the samples. These measures are rather a precaution, since being a new experiment, there is no knowledge of what might happen if any treated part gets in touch with fingers or the plastic of the box, or any other thing. As we are not sure what might happen if this can affect the real roughness just for precaution we treat the specimen with a strictest security. Regarding the analyzed samples, the procedure done is been going directly to analyze the characteristics with the interferometric microscope and compare it with the data obtained with the sample previous the treatment. In this case the sample is not cleaned with ethanol, for the same reason mentioned above, we do not know if that could change the conditions of the sample, for example; or if the same application of a paper using ethanol can disrupt the effect. Then it was found that samples take dust, as all samples are in a lab and therefore are kept save on some boxes to try to prevent these particles in suspension.
3.2.4. Tests
At the beginning of the project there was a hard work in the methodology for analyzing the surface roughness. First of all discuss which instrument was used and once it was decided to use the interferometric microscope, it was worked out how to control the variable parameters that worked better for those materials.

66 Photochemical nanomodification of polymer surfaces: Aerospace applications
As mentioned before, it is not the same difficulty to work with a highly reflective metal, where the default settings of the interferometric microscope can be used, than work with a little reflective polymeric material. The work to find the variable parameters that optimize the results with the PP received from companies has been quite long and difficult. Once controlled the parameters of the interferometer, or maybe not controlled but obtaining quite encouraging results in measuring the initial roughness of the polymers, is done the treatment with UV light. The parameters that in this case play an important role are: the exposure time and the distance, because the power/intensity given by the lamp and is fixed. Talking about time, standards that have been created are 5, 10 and 20 seconds. In some cases we have exceeded those times to see if it would work as the hypothesis generated from the effect of exposure time or other things happen. The tests that have been carried out, talking of distance are mainly 17 cm (17cm is the distance between the plate surface and the protective glass of the UV light), so it always has to be subtracted the sample thickness. This distance is where most treatments have been performed, as we shall see later, the change is not perceived visually, and the sample does not heats up in a bad manner. It will be commented in another section, but the box and the sample are heated due to the incident UV rays, and this may influence later in the reaction of the sample. There have also done tests at 9 cm (the same concept as before, 9cm is the distance between the plate surface and the glass to the protective glass of the UV light), but in smaller amounts, as in this distance were observed changes in visual level, and later on this distance has been discarded for this project. Those are the main test realized, but also other subtests are done in order to contrast some data. As there have been some problems with the interferometer, for some samples an optical microscope is used in order to see the UV effects on the surface. There is also another performed test, the graph reflectance vs wavelength, a result given by the reference work (ref. 1) and that is considered to be important to replicate for this project with the purpose of having the same data to compare results and polymers. This is done with an UV-Vis-NIR spectrometer, using an integrating sphere with its reference substance that is used to compare with the one analyzed. First the background is computed with two reference substance inside the sphere and once this is completed, one of these reference substances is replaced by the analyzed sample. Some software parameters can be changed, but as it was just to try to obtain the same figure as the other work, the predefined parameters were used.

Results 67
Chapter 4. Results
Once the equipment and the lamp was installed the first operation that was done was to do a primary test of the lamp and it was deposited a laboratory paper on a polystyrene support under UV light at about 5 cm of distance for approximately 1 second, and the result was the figure 4.1 and figure 4.2 . So it really had a high intensity, and protection measures should be taken into account, as it was said in the manual. Fig. 4.1 Burned paper, at 9cm and 5s Fig. 4.2 Plastic below the paper also burned
Later on there has been a lot of hours working on the instrumentation in order to achieve the best parameters to work with, so here are presented the results obtained during the "calibration" of interferometric microscope, to find the optimal parameters to work with a polymer (PP), two models of PP are discussed.
4.1. UV treatments
PP + 0.0046% of nanofluor The first model, PP + 0.0046% of nanofluor, as we have seen in a previous section (figure 3.1), the geometry was suitable for this instrument because it was flat and not too thick, the color of the sample causes the first obstacle, some parameters have to be modified not only for being a very low reflective polymer but to be white, so after trying both methods PSI and VSI with its variations, it was found find a configuration that seemed appropriate: PSI with threshold of 0.8. The threshold is the doorsill level for which we receive that signal to discriminate good or bad points. If we have very reflective displays the threshold must be high, it is important to have a high signal level (10-13) to take it for good, otherwise in non reflecting samples the value should be lower because it does not need a good signal level to accept the point as valid.

68 Photochemical nanomodification of polymer surfaces: Aerospace applications
For this material it was found as the best threshold, the value: 0.8, and the result image is shown in the figure 4.3.
Fig. 4.3 PP + 0.0046 nanofluor, observed with PSI mode and 0.8 of threshold. Image size: 638.1 x 478.5 um.
Colors indicate levels, as warmer the colors higher is the profile, so it would be a mountain; on the contrary cold colors means lower altitudes, so it would be a valley and therefore negative values, taking the 0 as the midline. For this sample it is seen a variety of colors and shapes, so it would be like a topographic map where the color blue is a very deep valley and high peaks are colored yellow, but those texture is not following any pattern. If we talk about the numerical interpretation of the image, the program gives us an enormous amount of information from 2D and 3D data, roughness average, the highest peaks, the maximum distances between peak and valley... numerical parameters on which this study is going to be focusing on are the Ra results, which is the roughness average height calculated averaging the points of an particular area. For two dimensions is calculated with the equation 4.1 and for the 3D with equation 4.2 where M and N are the number of points in x and y and z is the height of the surface relative to the plane.
(4.1)
(4.2)
For this material it was obtained, as a better measure, Ra = 2.17 um, few pages below there is a comparison table with all results found (table 4.1).

Results 69
With this sample there has been no treatment of UV light, however it could be a future work. PP CNT MB 5% The second material used to calibrate the variable parameters of the instrumentation was a PP CNT MB 5%, as can be seen in the figure 3.2; geometry is identical to the first sample worked, so it is also adequate for being flat and not too thick. In this case, the color of the sample is black, which is also the color that it is finally used for the rest of the work, so it is important to control the technology for this sample. The best result for this sample was also using the PSI mode, but with threshold of 0.1, so the signal level is slowed down even more and this means that on one hand the sample is not very reflective and on the other hand that the accuracy of the measure must not be very high. Seeing the figure 4.4 where the resulting image is shown in two dimensions. There is a great variety of colors and they mean a mountainous area with no pattern and range type with high values (warm) and low (cold).
Fig. 4.4 PP CNT MB 5%, observed with PSI mode and 0.1 of threshold. Image size: 638.1 x 478.5 um
Nickel mask. The third material to be used is a nickel mask, which this is indeed metallic and reflective. With this one good quality images could be obtained and finally seen and understood the holes pattern that it has, in order to foresee what it should be seen once completed the treatment. Figure 4.5 shows the image taken from interferometric microscope, where it can be visually appreciated the nickel layer and one of the holes it has, which are the ones allowing light to enter and radiate the sample.

70 Photochemical nanomodification of polymer surfaces: Aerospace applications
Fig. 4.5 Nickel mask used to create the treatment pattern. Image size 638.1 x 478.5 um.
These images do not provide any significant value to the study, but they have been very helpful to see and understand how wide the holes were, so therefore how wide should be the treated lines. It was very useful to know what to expect. PP The fourth material which it has been working with is the one with the most interesting studies result. It is the PP (figure 3.3) material bumper that it is supposed to be difficult to paint and this fact could be improved by this treatment. It is also black and not very reflective, but in this case the most optimal variable parameters found were the mode VSI with the values 20.40.7.
The first number is the BACKSCAN, which is the distance back (above) from the start point that moves before the measurement. Using a BACKSCAN it helps to ensure that all fringes on the surface are viewed by the camera. If it is focused on the highest, the backscan can minimize distance.
The second number is the length field to determine the distance of forward exploration (down) from the initial position.
For example, with the adjustments that we have, the lens rises from 20 microns where it was on focus (without measuring) and descends for 60 (20 of backscan + 40 of the position).
The third is the threshold that has been explained before, that monitors the signal quality that supports, to give a data point for good.
Obtaining that way an image like figure 4.6 where it can be seen a much more uniform roughness than in the other cases (the colors are almost the same tone), this roughness a part from being so much smaller, Ra = 0.77 um, is uniformly distributed, forming these stripes clearly seen in the image. This fact can also hinder the visualization of the mask produced, since there are so many stripes it is not easy to localize one concrete stripe even though you have it localized, so the intention is to cause a perpendicular line to those already there, so that it could be easily appreciate.

Results 71
Fig. 4.6 PP observed with VSI 20.40.7, before treating. Image size: 638.1 x 478 um After that, this material has been subjected to different distances and exposure times that have brought different results. That are now going to be showed but it has to be always taking into account and keeping in mind the reference, figure 4.6 Ra = 0.77 um, since from now on all the results are going to be compared with this figure. Starting with the closest distance that has been worked, 9cm (remember that this distance is between the plate where the sample is resting and the protective glass of the lamp) so the thickness of the sample is subtracted, which is 2.8 mm; at this distance it has been tested a 5s treatment with a visual result quite remarkable. It must be noted that no mask has been used in this case, because it was the first complete test and it was wanted to see the overall effect. As it can be seen in figure 4.7 at a glance is seen the treatment area, so this may not interest the company as they are supposed to want a treatment that does not change the visual conditions at all.
Fig. 4.7 PP, treated at 9 cm and 5 s.

72 Photochemical nanomodification of polymer surfaces: Aerospace applications
When analyzing the roughness with the interferometer, many problems have been found, or the sample contains a roughness out of range or this equipment has no longer enough precision for this material. The numerical results were so different and disparate that it was concluded to be left in case of having enough time once ended the other treatments and dyeability results. At this point we place the results in images of untreated samples observed under the optic microscope so that they also serve as reference from now on, whenever it is referenced any figure to the optical microscopy images. Figure 4.8 and figure 4.9 are showing themselves an untreated sample at different magnification observation and can it be seen that the structure is identical to the one originally shown by the interferometric microscope. Fig. 4.8 PP, no treated. Image scale 200 um Fig. 4.9 PP, no treated. Image scale 20 um. Once we have the reference, in this case by using the optical microscope it could be get the image of figure 4.10, do not care about the color of the image, because is an optical effect of light, the sample is actually black. As mentioned in a previous section, the optical microscope has permitted us to extract images with the intention of seeing what has happened even though it has not the ability to give back the Ra data. Nevertheless it can be clearly seen that the original morphology (figure 4.7) has changed greatly, the stripes have disappeared, although one can still sense them the old pattern has become to a new pattern where there are craters so now it appears much more porous.

Results 73
Fig. 4.10 PP, treated at 9 cm and 5s. Image from optical microscope. Image scale 200 um. If the image is zoomed further and are also taken less magnifications, like figure 4.11 it will be seen in the less magnifications that increases the porosity compared with the original image and contrasted with the image with more magnifications where we see micro sized pores, even though hundreds of nanometers. This is the degradation, the change of roughness that was looked for but maybe not so high level; however we must continue in trough this direction. Although it is not known for sure whether this is enough to improve the dyeability properties, the painting test must be the ones who end up with the answer.
Fig. 4.11 PP, treated at 9 cm and 5s. Image from optical microscope. Image scale 200 um (left image) and 20 um (right image).

74 Photochemical nanomodification of polymer surfaces: Aerospace applications
This surface roughness has changed a lot, but this material at 9 cm and 5 seconds, has a result that is considered negative for the company purposes, which were creating nano roughness without changing the original pattern. However if there is no problem with this change at a first glance, a change acceptable albeit the original pattern is changed, it would be a good work direction to increase research in time at this distance. It has to be careful with the temperature it takes the body and the box, which can cause additional unwanted deformations and degradations. There is one more result to highlight at 9cm, a treatment with the mask during 10 seconds. Here the material is already beginning to degrade in such a way that it is assumed to begin to melt because it was found the mask stuck on the surface and therefore the numbers are completely printed on the polymer contour. Here are some images from this experiment (figure 4.12 figure 4.13) some of them are rather artistic but also interesting because it was found a transition zone between what is original material (shredded) and what should be treated material (porous) but under the mask, so the mask has also influenced in the degradation or change of roughness by heating up, or maybe at this distance light enters through the cracks that exist in the mask and degrades all the material below, because the areas are much more wide than what it should be.
Fig. 4.12 PP, treated at 9cm and 10 s, transition. Image scale 500 um.

Results 75
Fig. 4.13 PP, treated at 9cm and 10 s, transition. Image scale 200 um
Then the research gives a step more and increases the distance of work, direct to the other end, to the 17cm (same distance concept). At this distance are tested three different exposure times, the first during 5 seconds, then 10 seconds and third at 20 seconds, although a single case has reached 30 seconds in order to see what happens. It might also be tried to decrease the exposure time rather than increase the distance, but at this point is easier to control distances than times, so it continues with the idea of varying the distance. The treatment of 5 seconds at 17 cm, done again without any mask, does not cause any noticeable visual change, so it continues with the analysis under the interferometric microscope with the PSI 0.8, obtaining the image figure 4.14 with an roughness average of Ra = 1.81 um. Again colors are read as warm colors meaning mountains and cold colors meaning valleys, so there is a much more mountainous area more than in the original (figure 4.7). It has changed the surface roughness not only numerically, also the scratches that previously dominated the area, now some are modified in different heights and thus producing a noticeable change, although it is just at micro and nano scale as expected. As this change is quite similar to what it was expected the following steps are going into this direction since the concept of do not change anything visually is kept and this encourages. An image of the optical microscope, figure 4.15, shows that they begin to perceive the "craters" those who commented and where confirmed with the result value, Ra = 1.81 um.

76 Photochemical nanomodification of polymer surfaces: Aerospace applications
Fig. 4.14 PP, treated at 17 cm and 5 s. Image size 638.1 x 478.5 um
Fig. 4.15 PP, treated at 17 cm and 5 s. Image scale 20 um.
The following treatment is keeping the working distance but increasing the time to 10 seconds of exposure and still not using the mask during the UV treatment. At first sight is not perceived any noticeable change, so still fulfilling the will of the entrepreneur. The interferometric microscope with PSI mode threshold of 0.2, obtains the figure 4.16. In this case, Ra = 2.63 um and the micrometer morphology and topography has changed a few. If we remember the original it was like figure 4.7, which had that colored striped in a uniform way. In here there is no longer seen so many scratches, though at a macro level is not seen nothing, and the colors are not so uniform distributed. What can be rapidly extracted from this image is that there are created mountains and valleys wider and pronounced with its corresponding sign.

Results 77
Fig. 4.16 PP, treated at 17 cm and 10 s. Image size 638.1 x 478.5 um. The next step was to use the mask as we have explained before used to create a pattern. Then under the same conditions of 17cm and 10 seconds, it is obtained the figure 4.17, where it appears clearly a roughness line different from the rest of the image. It looks wider than previously thought, but perhaps there is some diffusion phenomenon that causes spread around more and this causes a line more bell-shaped than that step-shape. If it is compare with figure 4.6, it can be subtracted that the mask works and has created some treated areas and some not treated. This yellow line may indicate this phenomenon.
Fig. 4.17 PP, treated at 17 cm and 5 s, with mask. Image size 638.1 x 478.5 um

78 Photochemical nanomodification of polymer surfaces: Aerospace applications
There has been also taken two pictures of the mask (figure 4.18 and figure 4.19) with the optic microscope and with the mask placed on top of the sample, where it can be seen the treated part of the polymer and start distinguishing some craters.
Fig. 4.18 PP, treated at 17 cm and 10 s, with the mask on top. Image scale 500 um.
Fig. 4.19 PP, treated at 17 cm and 10 s, with the mask on top. Image scale 200 um And finally this sample has been treated at 17cm and 20 seconds. The good news are that again visually is not perceived anything, the bad news that once again there has been problems with the interferometer measures, and not reliable data is obtained, so a change in the working instrument, to the optical microscope, is been necessary to try to obtain an image (figure 4.20 and figure 4.21) at least to see what was occurring down there.

Results 79
The Ra value is not known, because we have to remember that the optical microscope do not give any approach to this value, so maybe for future work it might be interesting to analyze numerically this value.
Fig. 4.20 PP, treated at 17 cm and 20 s. Image scale 200 um.
Fig. 4.21 PP, treated at 17 cm and 20 s. Image scale 200 um. Having a look at the same image but with much more magnification (figure 4.22) it can begin to be seen the old faded stripes and the inclusion of what seems to be the starting craters creation. It is not very appreciable, but there are some parts where those craters are appearing tending to increase the surface roughness average.

80 Photochemical nanomodification of polymer surfaces: Aerospace applications
Fig. 4.22 PP, treated at 17 cm and 20 s. Image scale 50 um
PC/PBT After ending with this material, and all the processes, the second material provided by Plastal Spain S.A, PC / PBT, is taken to proceed with the same actions. With this material there have not been so many tests as the previous one, for reasons of time and interest issues (there was not so much amount of samples, the handling is more complex and the companies where more interested in controlling the first sample set). In addition there has been sent to the company two variants of treatments, the first during 5 seconds and the second during 10 seconds, but all of them at 17 cm away. So because of all these factors, there have not been so much results talking about number of tests, but despite being a much lower analysis, the results are of much greater talking about precision. This material presents a different aspect with respect to the PP samples previously studied; it seems to have more reflectivity, or a finer finish. This should in theory enhance the capabilities of the interferometric microscope and allow some observations and analysis with a higher precision quality. It would also be interesting to make the observations with the optical microscope to compare and understand what is happening visually on the surface, but this would be only to help and is left as recommendation for the interpretation, the real valuable data is the one coming from the interferometric microscope. One of the most important problems of this sample is its shape (figure 3.4) then once done all the pictures and once studied the sample, in order to be able to do these experimentations it had to be cut, removing the legs and then the size. Firstly the material is the observed with the interferometric microscope. Actually, as expected according to initial expectations that it seemed more reflective, is confirmed by the interferometric microscope because it responds better.
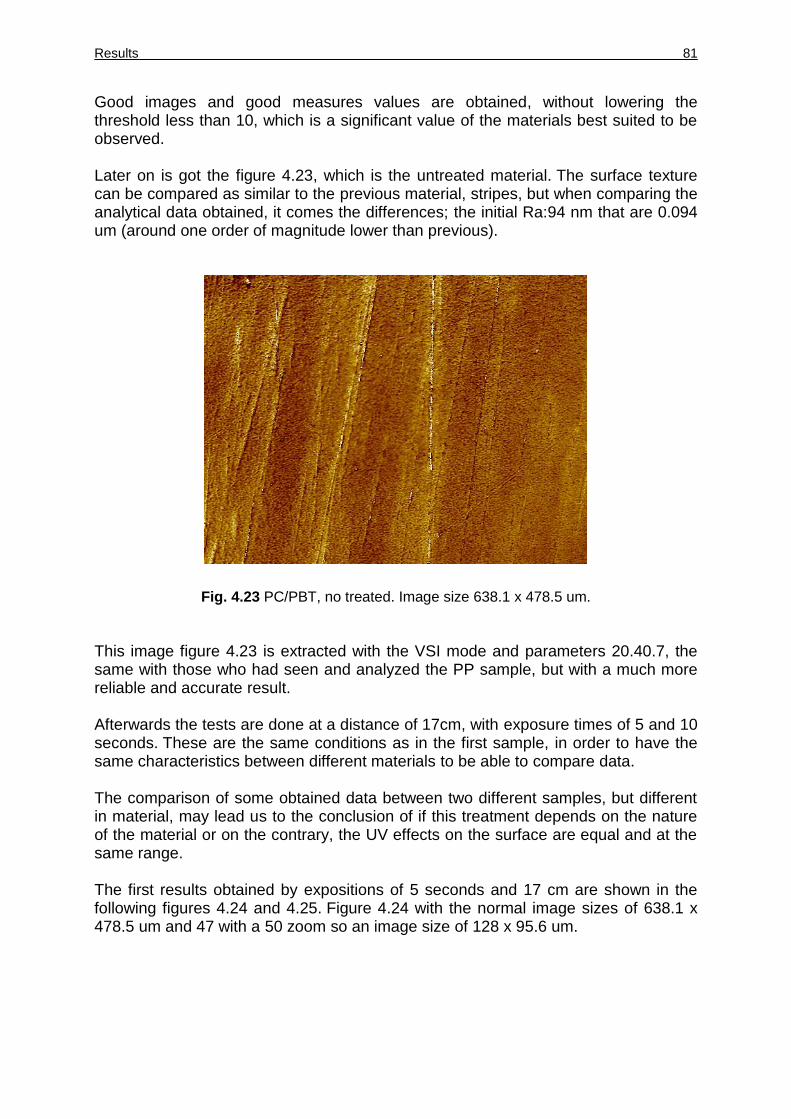
Results 81
Good images and good measures values are obtained, without lowering the threshold less than 10, which is a significant value of the materials best suited to be observed. Later on is got the figure 4.23, which is the untreated material. The surface texture can be compared as similar to the previous material, stripes, but when comparing the analytical data obtained, it comes the differences; the initial Ra:94 nm that are 0.094 um (around one order of magnitude lower than previous).
Fig. 4.23 PC/PBT, no treated. Image size 638.1 x 478.5 um.
This image figure 4.23 is extracted with the VSI mode and parameters 20.40.7, the same with those who had seen and analyzed the PP sample, but with a much more reliable and accurate result. Afterwards the tests are done at a distance of 17cm, with exposure times of 5 and 10 seconds. These are the same conditions as in the first sample, in order to have the same characteristics between different materials to be able to compare data. The comparison of some obtained data between two different samples, but different in material, may lead us to the conclusion of if this treatment depends on the nature of the material or on the contrary, the UV effects on the surface are equal and at the same range. The first results obtained by expositions of 5 seconds and 17 cm are shown in the following figures 4.24 and 4.25. Figure 4.24 with the normal image sizes of 638.1 x 478.5 um and 47 with a 50 zoom so an image size of 128 x 95.6 um.

82 Photochemical nanomodification of polymer surfaces: Aerospace applications
Fig. 4.24 PC/PBT, treated at 17 cm and 5 s. Fig. 4.25, PC/PBT, treated at 17 cm, and 5 s
The average roughness value of these measures has been oscillating between various iterations taken, but clearly points to an average Ra = 110 nm, 0.11 um. The texture visually seems to have not suffered any modification and if we consider the data, from 94 nm to 110 nm, a difference of 16 nm, is undetectable at first sight. The experiment is also done at 17 cm but now at 10 seconds of UV exposure. The result is shown in figure 4.26, with Ra = 130 nm, 0.13 um. A very little change maybe, but perhaps is the desired.
Fig. 4.26 PC/PBT, treated at 17 cm and 10 s. Image size 638.1 x 478.5 um.
Visually there is no change, this is also a positive factor especially for the industry, as they can still sell the product with the same aspect but with a difference that may help them to obtain a benefit and no one can sees it.

Results 83
The roughness changes in this last sample (which has resulted much easier to analyze under the interferometric microscope for its own optical characteristics) have been in much lower factors than those of the other material originated. No mask is used for this second sample set, because of the problems that gives itself the mask and because of this sample shape, so finally the decision was to observe the general surface roughness because if it is geometrically positioned in a controlled manner and within the samples box, the radiation area is fairly predictable. Finally this is a summary table of the most characteristic and reliable parameters that have been determined. Table 4.1. Summary table
It could be made some statistics and probabilities of what can happen with time and a given distance, but it would take many experimental data to minimize the error and therefore a good system to analyze the data. It could be a way to create a probabilistic pattern of a material in such a distance with an exposure time of T; the roughness varies D (giving a specific value).
4.2. UV-Vis analysis
Before to start with the obtained data, there have to be clarified some aspects. The data is showed between 200 and 700 nm, as the reference work (figure 2.10), but the analysis was done with further top limits. Another thing to comment is that the obtained values were not %, so to be able to compare plots; the percentage is done to all the data. This is an important point; the percentage is done always giving the 100% to the maximum reflectance value of the untreated data. So that the treated lines are referred to this value this way if the treated line is under the untreated line indicates that the reflectance has decreased and if it is upper indicates that has increased.

84 Photochemical nanomodification of polymer surfaces: Aerospace applications
The values in the y axis are not real reflectance or even real % of reflective signal from the 100% incident, those are values referred to the maximum reflectance value obtained in the untreated sample, each time. Here is presented the figure 2.10, the curve obtained by the reference work, but it has to be said that those are not real % of reflectance due to the UV dose. Because they treated the samples with UV and then applied some disperse black dyes, and that way they achieved to decrease so much the reflectance index. As much as the treatment was, much disperses black dyes were trapped by the sample and less reflecting became, apart from the intrinsic decrease in the reflective index just with the UV treatment.
Fig. 2.10 Effect of UV/O3 irradiation on the reflectance of treated PET fabrics.
The first graph obtained is the one showed in the figure 4.27, which corresponds to PP untreated compared with two treatments.
Fig. 4.27 PP referred reflectance between untreated and two different treatments.
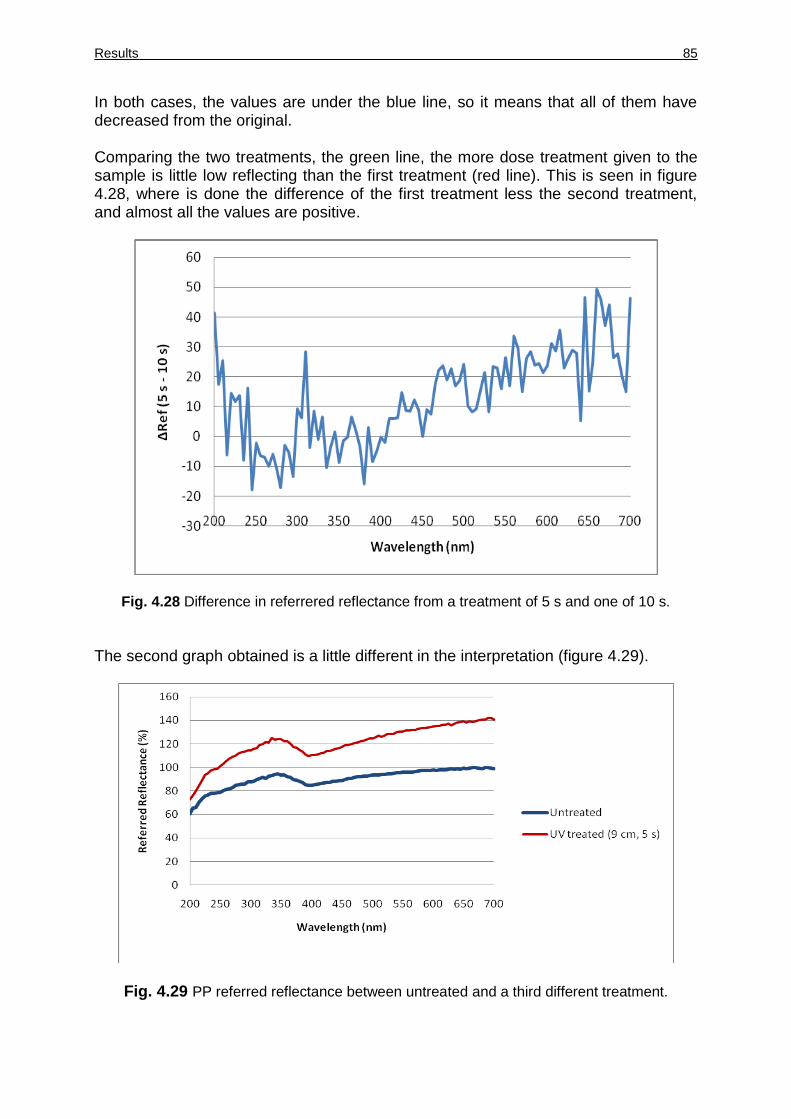
Results 85
In both cases, the values are under the blue line, so it means that all of them have decreased from the original. Comparing the two treatments, the green line, the more dose treatment given to the sample is little low reflecting than the first treatment (red line). This is seen in figure 4.28, where is done the difference of the first treatment less the second treatment, and almost all the values are positive.
Fig. 4.28 Difference in referrered reflectance from a treatment of 5 s and one of 10 s.
The second graph obtained is a little different in the interpretation (figure 4.29).
Fig. 4.29 PP referred reflectance between untreated and a third different treatment.

86 Photochemical nanomodification of polymer surfaces: Aerospace applications
In this case the treated line is above the untreated. This can be confusing, the reflectance is supposed to be increased. However if we have a look again to the figure 4.7, this sample was treated at a distance of 9 cm and 5 seconds of exposition, and visually it appeared a treated area on the surface, that was visible at first glance and it was much more reflecting. The original texture (stripes) was not there any longer, instead there was like a plain surface with some holes (figure 4.10), so it really has increased the reflectance. The “mountains” are disappeared and there has been some craters and plain areas that increases the reflecting parameters. The third graph obtained is done with the PC/PBT samples, figure 4.30.
Fig. 4.30 PC/PBT referred reflectance between untreated and a third different treatment.
For this figure, firstly it can be said that both treatments are below the untreated line, which is the expected result. However the second treatment increases in comparison with the second. Two explanations are found, the first is that maybe during the analysis there was an error, and the second, the most dreaming one; is that the first treatment is able to decrease the surface reflectance but the second is too much and the surface roughness starts to vary too much, maybe obtaining a plane texture and so the reflectance is increased again but not that much as the untreated. In almost all the cases the result is as expected, the reflectance induced by the treatment is low than without it. This is a working filed in order to understand better the phenomenons, but here there is the first approach.

Results 87
4.3. Energetic approach
Here is presented, also, a first approach of the energetic study, in order to try to approach the amount of energy given per squared cm (doses). A calculus done in a very simply way, it is probable that there is another better approach than this, but at least the order of magnitude it seems to be correct. Some approximations where suggested, such as approaching the calculus as a wave radiated by an, in fact radio waves are the same as light but higher wavelength; other suggestions were to approach it as a black body, which was a very theoretic and physicist option, but maybe a little complex for just a first attempt. So finally it was chosen the option of energies, intensities, velocities… the theoretic calculus with the given data. Better or worst intent, it is supposed to be theoretically correct, and then if it has to become real, some corrections should be done. Such as atmosphere corrections, because some intensity is in charge of breaking O2 bonds and creating O3, some other is lost inside the box, and some other is reflected. It is known that the intensity given by the lamp is 120 W/cm, and taking into account the documentation included with the lamp and the equipment, at approximately 15 cm of distance, which is supposed to be the point where converges all the light from the lamp and the reflecting ellipse, leaves a print of 2,5 cm. This means that 2,5 cm are receiving the maximum amount of intensity. As this is an approach, these values are going to be used, so that the maximum supposed doses are the result. As it was mentioned before, all the users of this lamps, where using a conveyor belt so they controlled the exposure by controlling the velocity of this belt. If we have a look at the units, the intensity divided by the velocity gives the dose.
(4.3) In this project there was not any conveyor, but knowing this supposed distance lighted with the maximum intensity and the different exposure times, the following table can be obtained (table 4.2). Doing the calculus with their lamp intensity (240 W/cm) and their conveyor velocity (16.17 cm/s) the dose obtained is 14.4 J/cm2, quite similar to the one provided by the other work (9,5 J/cm2). So this method is supposed to give quite precise data, at least in the order of magnitude, because there are, as mentioned before, some extra impediments that should be taken into account, that are not.

88 Photochemical nanomodification of polymer surfaces: Aerospace applications
Table 4.2 Energetic approach
Those are theoretical and maximum values of energy arriving to the sample, not energy absorbed by the sample; this depends on other thinks not taken into account in this approach. So if these values are compared with the ones given by the reference work, they end up with a dose of 9.5 J/cm2. Consequently it can be thought that this calculus is wrong, but it has to be taken into account that they used times such as 0.4 s, always under 1 second. For this project, there has been time just to analyze at higher exposition times. So these are all the relevant results obtained from the equipments and the experiments done within this project. Some other results have to be mentioned; the ones from the dyeability tests performed by the industry to the UV treated samples. It seems that it cannot substitute directly the actual painting process, so these UV treatments do not make the polymer directly suitable to be painted. However, they have seen that it can be substituted one part of the painting process. They use a flame to activate the surface, then they apply a primer and then they can paint those polymers difficult to paint. Within the results of these tests done to the UV treated samples, it looks like this activation flame could be replaced by UV light. In fact it has the same result to use UV + primer + paint, than the flame. Maybe economically is not feasible, that’s the industry compromise, production, cost and benefits. But for this project is an enormous new, and also controversial. Because it means that the generated roughness does not help the dyes somehow mechanically to get trapped, but this UV radiation has activated the surface, as mentioned in other references, and this permits those primer dyes to get attached chemically.

Discussion 89
Chapter 5. Discussion
A misinterpretation of the results would be to say that it is completely controlled the roughness change with a certain distance and a concrete time. It is not easy to extract a logical behavior, even if it is true that the longer the sample is exposed the higher Ra is obtained; but this increase is not in a linear manner and there are few data to extract another kind of mathematical model. In addition, it has to be said that the use of the interferometric microscopy, although it has been a big advantage because of its use of light instead of mechanic analysis that make sure to not being damaging the material or roughness that is created; the measure depends too much on the accuracy moment of the measurement, the type of approach, the environment and especially of the sample. If the sample is good as it is in shape because it is flat, but it is not very reflective as we saw earlier, then for example if the analysis is done with PSI mode the threshold values have to be between 0 and 1 to have and acceptable signal, that means lowering the requirement reflected signal. If all this problems are added to the problem of the base material, the initial average roughness of a sample, 0.77 um, and we want to be able to be precise enough to see changes 100 times smaller, it is maybe not reachable with the interferometer. Maybe if other techniques are tried, such as the AFM (atomic force microscope), mechanical analysis and polymer samples seems to be incompatible but working carefully it may be obtained, however also requires a considerably lower initial roughness, which is not the case. Another noted factor is the exposure time that has been applied, has created some um roughness, so it is relatively simple to think that instead of going to longer times perhaps the objective should be to go to less exposure times, even reaching tenths of a second maybe. According to the calculations made using data from literature, they exposed the samples tenths of a second, but were polyester fibers and in our case are polypropylene plates. Therefore one could not directly extrapolate that in this study it had better to go down in time, besides the difficulty of controlling these times. Regarding the mask, generally it has not created the pattern that was supposed to create, or perhaps it has not been appreciable at all, especially with the treated lines that were expected to leave on the surface. Some positive images and data has been obtained but less than expected. Moreover, to all this it should have to be added a fact that is not taking into account or at least not giving too much importance, the sample temperature reached because of the entire process, a temperature produced by the molecules excited by UV rays. For this project it is still believed that it is not determinant because of the exposition times used, but it is demonstrated that as much time was exposed the sample much heated up became those samples; in one particular case the exposure time was around 30 seconds (at 17 cm) and the hole sample began to bend.

90 Photochemical nanomodification of polymer surfaces: Aerospace applications
In fact there is a case showed before, were a sample was treated at 9 cm and 10 seconds with the mask on top of the sample ended the treatment really hot. It can be seen in figure 4.12 a perceptible change between the treated and untreated areas, a change that didn’t had to occur under the mask. But it happened and as it can be seen, with a very curve zone, which may lead to think of some kind of diffusion process produced by the heated up mask or maybe is real treatment because of an error in the subjection of the mask. In general, these last data found (the PC / PBT and the PP) merely confirmed that the roughness varies with the effect of UV light, but varies differently depending on the material. Talking about the images extracted from the interferometer, we have to consider that the more variety of colors there are, means more roughness or more mountainous areas. That does not mean a higher value in surface roughness it means at least that is not flat. An example to understand better this concept might be a wood floor or asphalt, both are flat surfaces and not very hilly, but one would have a lot more varied colors because it is composed of little rocks and the other would be more monochromatic because everything would be rather uniform, although the two may have a roughness average equal. The images taken from optical microscope, it must be remembered that the color is not identifying the real color of the sample; it has been used only with the intention of seeing what happened with the roughness, because sometimes images are better than theory. The reflectance analysis is already discussed, but it has to be highlighted that the result, in general, was the one expected. The reflectance decreased simply because of the UV light radiation, and this can be interpreted directly as a change in the surface roughness, a change maybe nanoscale or microscale but no visible at all. This could lead to a potential use of some products interested in decrease the reflectance; this was one of the objectives. But it is easy to say that this reflectance values are representing a decrease in the 0.01% referred to the untreated samples, so this change is very low, although it can be useful for some applications maybe. Talking about the results obtained in the dyeability test performed by the industries, some references are now becoming more important, as it was mentioned before in this document. This work gives a 90º turn, not 180º because it was one of the objectives but not the one focused on. So this turn goes from the mechanical behavior between those new nanoroughness with the paint dyes, that mechanically could be trapped; to this surface activation produced by the UV exposure, and the effect of the UV rays on the polymer surface, braking some bond and leaving free radicals that have reacted with the primer dyes used by the companies to help the dyeability of the posterior painting. This change is not undesired, because there are some documents (ref. 4 and 30) that talks of protecting polymers, from the space conditions, with some procedures such as coatings, over layers or nanoparticles deposition, those procedures could take profit of this surface activation to benefit the whole process.

Conclusions 91
Chapter 6. Conclusions
It has succeeded in changing the surface roughness of a polymer by UV light and that this roughness would be nano or micro scale. At micro level, it has been found that it can be modified the average surface roughness of the PP with UV light and not be perceived at first glance. The UV treatment of the PP samples have ended positive in the dyeability tests, not directly but indirectly. Moreover the PC roughness modifying has approached more to the tens of nm, and also modified somehow the dyeability conditions properly. Similar rates are achieved compared to those of previous works consulted in the literature; where in this other works the roughness is increased by a factor of 2 and in our project it have been achieved factors of 2.3 and 3.5 for PP at micro level and factors of 1.17 and 1.38 for PC / PBT at nano level. However it is really clear that the effects of the treatment depend directly to the material composition. The nickel mask used in this study worked well, ensured by a magnet preventing it from not moving during the UV exposition, but it has been also a negatively influence for the treatment, adding heat to the system. It’s been successful in reproducing the work (ref. 1) starting with the search and development of the equipment, until the results, which in our case were obtained using a different polymer and technique but were successful at all. The whole conclusion, after the reception of the results from the dyeability tests, is that the objective of modifying the surface roughness (and achieved objective) is not enough to give good results. However another objective, the surface activation it has become the attention point in the last part of the work, because the surface is activated enough to be able to trap some primer dyes that permit the correct polymer painting. This activation is useful, looking for space applications, in many processes to protect polymers from space environment (Atomic oxygen and UV basically). Those processes consist on applying a coating, a covering, a layer on top of the polymer to protect it from these agents. So this surface activation produced by the UV treatments explained in this project can be useful for some polymer protection processes applied to aerospace. Furthermore, this activation may be due to the effect of the O3 created. It could be said that the UV light produces the roughening and some activation but the real activation may be promoted by the ozone; at least it is sure a synergistic effect of both phenomenons. Within this work it has been very important the interaction between all projects involved in nAuto and its managers, it is recommended to all a good work environment and a good partner’s level.

92 Photochemical nanomodification of polymer surfaces: Aerospace applications
Chapter 7. Recommendations for future work
Polypropylene is an excellent material for automotive applications due to its great mechanical characteristics, the low weight and the production cost. However if there is something clear from the results of this project is that it is probably a bad material for outer space uses. Within the atmosphere protection the UV intensity reaching the surface is minimum in short periods of time, but the problems of this kind of material are the long time exposures to the sun. PP is a simple polymer, easy and cheap to produce, with any kind of additive to improve its characteristic, basically because it already has good ones. The main problem is the impossibility to paint it easily and in addition the high difficulty of adding a coating to the surface. For outer space applications materials must stand some hard conditions and radiations and from the results of this project it is seen that natural PP is not a solution. Firstly, because of the problematic with the main material, it is shown in the project that the UV radiation affects the surface and when the radiation is intense and applied few seconds the material starts to modify its shape and its good characteristics. Within this project it is achieved to change the surface to end up with a possibility to paint it or apply a coating to protect it for a specific agent. So it could be used for outer space applications if some investigations in these coatings are done and if some particles added to this surface permits having a real material PP based in use. However it is also clear that for space applications, the cost is not very restrictive in materials science whereas for automotive it is an industrial production where they must save money. If this concept is taken into account, other expensive materials are used nowadays with better results and already excellent properties. So actually, PP is probably not going to become a revolution in the space sector until some protection coatings are found to make this polymer better than the ones in use. When talking of PC/PBT, a polymer much more complete, worked out and the one that has given better results in the UV test, could also be used (always under some protection coatings) for space applications. It has different characteristics, but also interesting for many fields. Polymer science has begun some decades ago, but it is still a never ending innovation field that directly affects and provides solutions to the human society.

References 93
Chapter 8. References
(1) Jang, J. and Jeong, Y.: Nano roughening of PET and PTT fabrics via continuousUV/O3 irradiation. Dyes and Pigments, vol. 69, no. 3, 2006, pp. 137-143.
(2) Pieter Gijsman , Guido Meijers, Giacomo Vitarelli: Comparison of the UV-degradation chemistry of polypropylene, polyethylene, polyamide 6 and polybutylene terephthalate. PDS, 1999, pp. 433.
(3) Masahito Tagawa, K.: Atomic oxygen-induced polymer degradation phenomena in simulated LEOspace environments:Howdo polymers react in a complicated space environment? Acta Aeronautica, 2007,
(4) Sharon K.R. Miller, Bruce Banks: Degradation of Spacecraft Materials in the Space Environment . MRS BULLETIN, vol. VOLUME 35, 2010, pp. 20.
(5) J.I. Kleiman: Surface Modification Technologies for Durable Space Polymers. MRS BULLETIN, vol. VOLUME 35, 2010, pp. 55.
(6) WYKO NT9800/9300 PROFILER - SETUP AND OPERATION GUIDE. 2007 (7) A.L Andrady, S.H Hamid, X. Hu, A. Torikai: Effects of increased solar ultraviolet radiation on materials. no. 7 (8) A.V. Shyichuk, J.R. White, I.H. Craig, I.D. Syrotynska: Polymer Degradation and Stability, 2005 (9) Athanassiou, A.; Andreou, E.; Bonarou, A.; Tornari, V.; Anglos, D.; Georgiou, S.; and Fotakis, C.: Examination of chemical and structural modifications in the UV ablation of polymers. Appl. Surf. Sci., vol. 197-198, 2002, pp. 757-763. (10) Athanassiou, A.; Lassithiotaki, M.; Anglos, D.; Georgiou, S.; and Fotakis, C.: A comparative study of the photochemical modifications effected in the UV laser ablation of doped polymer substrates. Appl. Surf. Sci., vol. 154-155, 2000, pp. 89-94. (11) D. Praschak, T. Bahners, E. Schollmeyer: PET surface modifications by treatment with monochromatic excimer UV lamps. Applied Physics A, vol. 66, no. 1, 1998, pp. 69--75. (12) Daniloska, V.; Blazevska-Gilev, J.; Dimova, V.; Fajgar, R.; and Tomovska, R.: UV light induced surface modification of HDPE films with bioactive compounds. Appl. Surf. Sci., vol. 256, no. 7, 2010, pp. 2276-2283. (13) Dayss, E.; Leps, G.; and Meinhardt, J.: Surface modification for improved adhesion of a polymer–metal compound. Surface and Coatings Technology, vol. 116-119, 1999, pp. 986-990.

94 Photochemical nanomodification of polymer surfaces: Aerospace applications
(14) E. Grossman, I. G.: Space environment effects on polymers in low earth orbit. NIMB, 2003, pp. 48. (15) Gumpenberger, T.; Heitz, J.; Bäuerle, D.; and Rosenmaver, T. C.: Modification of expanded Plytetrafluorethylene by UV irradiation in reactive and inert atmosphere. Applied Physics A: Materials Science and Processing, vol. 80, no. 1, pp. 27--33. (16) Hiroyuki Shimamura, I. Y.: Degradation of Mechanical Properties of Polyimide Film Exposed to Space Environment. Journal of Spacecraft and Rockets, vol. 46, no. 1, 2009. (17) J.E.Guillet: Fundamental processes in the UV degradation and stabilization of polymers. (18) Jeffrey L. Taylor: Reflectanc Measurements of Materials Used in the Solar Industry. (19) Kaczmarek, H. and Chaberska, H.: The influence of UV-irradiation and support type on surface properties of poly(methyl methacrylate) thin films. Appl. Surf. Sci., vol. 252, no. 23, 2006, pp. 8185-8192. (20) Kenneth Rasmussen, Guenter Grampp, Marc van Eesbeekand Thomas Rohr: Thermal and UV Degradation of Polymer Films Studied In situ with ESR Spectroscopy. ACS, 2010, (21) Kumagai, H.; Kusunoki, T.; and Kobayashi, T.: Surface Modification of Polymers by thermal Ozone Treatments. vol. 3, 2007, (22) Maria E. Fortunato, Massoud Rostam-Abadi‡§ and Kenneth S. Suslick: Nanostructured Carbons Prepared by Ultrasonic Spray Pyrolysis. 2010, pp. 1610–1612. (23) Michael W. Sayers, Steven M. Karamihas: The Little Book of Profiling - Basic Information about Measuring and Interpreting Road Profiles. 1998. (24) Mikulikova, R.; Moritz, S.; Gumpenberger, T.; Olbrich, M.; Romanin, C.; Bacakova, L.; Svorcik, V.; and Heitz, J.: Cell microarrays on photochemically modified polytetrafluoroethylene. Biomaterials, vol. 26, no. 27, 2005, pp. 5572-5580. (25) Pan, F.; Wang, K. L.; Turro, N. J.; and Koberstein, J. T.: Photochemical Modification and Petterning of Polymer Surfaces by Surface Adsoroprtion of photactive BLack Copolymers. American Chemical Society, vol. 21, no. 8, 2005, pp. 3065--3612. (26) T.Rohr, M. v. E.: Polymer Materials in the Space Environment. 8th Polymers for Advanced Technologies International Symposium, 2005,

References 95
(27) Vorburger, T.; Rhee, H.; Renegar, T.; Song, J.; and Zheng, A.: Comparison of optical and stylus methods for measurement of surface texture. Int J Adv Manuf Technol, vol. 33, no. 1-2, 2007, pp. 110-118. (28) Yuliya Kuznetsova, Alexander Neumann, and Steven R. J. Brueck: Imaging interferometric microscopy. J. Opt. Soc. Am. A, vol. Vol. 25, no. No. 3, 2008, pp. 811. (29) ZEUS Industrial Products, I.: UV Properties of Plastics: Transmission & Resistance 2005, (30) Williw, Paul B.; Hsieh, Chend-Hsien.: Space Applications of Polymeric Materials. California Institute of Technology