MASTER THESIS OF RISHI CHANDI - TU Delft
118
CB&I Lummus B.V. – Delft University of Technology MASTER THESIS OF RISHI CHANDI Key Performance Indicators Measuring Performance in the Oil & Gas EPC Industry COMPANY : CB&I Lummus B.V. COMPANY SUPERVISOR : J. Kruidenier AUTHOR : R. Chandi STUDENT NO : 1000144 UNIVERSITY : Delft University of Technology FACULTY : Technology, Policy and Management SECTION : Policy Analysis PROFESSOR : W. Thissen FIRST SUPERVISOR : B. Enserink SECOND SUPERVISOR : Z. Lukszo DATE : May-2009 STATUS FILE : Master_Thesis_R.Chandi_Final.doc STATUS THESIS : Final
Transcript of MASTER THESIS OF RISHI CHANDI - TU Delft

CB&I Lummus B.V. – Delft University of Technology
MASTER THESIS OF RISHI CHANDI
Key Performance Indicators
Measuring Performance in the Oil & Gas EPC Industry
COMPANY : CB&I Lummus B.V.
COMPANY SUPERVISOR : J. Kruidenier
AUTHOR : R. Chandi
STUDENT NO : 1000144
UNIVERSITY
:
Delft University of Technology
FACULTY : Technology, Policy and Management
SECTION : Policy Analysis
PROFESSOR : W. Thissen
FIRST SUPERVISOR : B. Enserink
SECOND SUPERVISOR : Z. Lukszo
DATE
:
May-2009
STATUS FILE : Master_Thesis_R.Chandi_Final.doc
STATUS THESIS : Final


CB&I Lummus B.V. – Delft University of Technology
MASTER THESIS OF RISHI CHANDI
“If you don’t know where you are, then you can’t know where you’re going and you certainly can’t get to where you want to be. It’s akin to traveling in unknown territory without a compass or a map. You’re totally lost.”
Mark Graham Brown (Performance Measurement Expert)


i
PREFACE
This is the final report, intended for my Master Thesis, which is carried out at CB&I Lummus (former ABB
Lummus Global) in The Hague. This final Thesis represents the end of my Masters at the faculty
Technology, Policy and Management of the Delft University of Technology.
First, I want to thank all members of the graduation committee for their assistance in carrying out my
Master Thesis. I owe a large debt of gratitude to Jako Kruidenier for offering me the opportunity of fulfilling
my Masters at the company and for the advice and guidance during the execution of this Thesis. Finally, I
want to thank the respondents at CB&I Lummus for their valuable input.
The members of the graduation committee are:
Delft University of Technology W. Thissen Professor
Delft University of Technology B. Enserink First Supervisor
Delft University of Technology Z. Lukszo Second Supervisor
CB&I Lummus J. Kruidenier Company Supervisor
CB&I Lummus R. Chandi Student
The Hague, May 2009
Rishi Chandi


ii
TABLE OF CONTENTS
Preface ..................................................................................................................................................... i Table of Contents.................................................................................................................................... ii List of Tables and Figures..................................................................................................................... iv Executive Summary ................................................................................................................................ v 1 Introduction...................................................................................................................................... 1
1.1 CB&I Lummus BV......................................................................................................................... 1 1.2 Project Context............................................................................................................................. 1 1.3 Project Scope & Limitations .......................................................................................................... 2
1.3.1 Research objective............................................................................................................... 3 1.3.2 Formulation of Research Questions...................................................................................... 4
1.4 Research Setup............................................................................................................................ 5 1.5 Research Strategy........................................................................................................................ 5 1.6 Research Tools ............................................................................................................................ 6
1.6.1 Interviews............................................................................................................................. 6 1.6.2 The Decision Chart .............................................................................................................. 7
1.7 Report structure............................................................................................................................ 7 2 CB&I Lummus .................................................................................................................................. 9
2.1 Chicago Bridge & Iron Company N.V. (CB&I)................................................................................ 9 2.2 CB&I Lummus B.V........................................................................................................................ 9 2.3 Matrix Organization .................................................................................................................... 10
2.3.1 Line Organization ............................................................................................................... 10 2.3.2 Project Organization........................................................................................................... 11
3 Performance Measurement............................................................................................................ 13 3.1 Introduction ................................................................................................................................ 13 3.2 Need for measuring Performance ............................................................................................... 13 3.3 Requirements for Performance Measurement............................................................................. 15 3.4 Conclusions................................................................................................................................ 15
4 Key Performance Indicators.......................................................................................................... 16 4.1 KPI Definition and Composition .................................................................................................. 16 4.2 Views on Key Performance Indicators......................................................................................... 17 4.3 “Good” Indicators........................................................................................................................ 21 4.4 The Performance Measure Record Sheet ................................................................................... 21 4.5 KPI’s: Lessons Learned.............................................................................................................. 22 4.6 Conclusions................................................................................................................................ 23
5 Performance Measurement Frameworks ...................................................................................... 25 5.1 Most prominent Frameworks for measuring Performance............................................................ 25
5.1.1 Balanced Scorecard (BSC)................................................................................................. 26 5.1.2 Strategy Map...................................................................................................................... 28 5.1.3 Performance Prism ............................................................................................................ 32
5.2 Quality Programs........................................................................................................................ 33 5.2.1 EFQM Business Excellence Model ..................................................................................... 33 5.2.2 Malcolm Baldrige National Quality Award (MBNQA) ........................................................... 34
5.3 Key Performance Indicators in the Construction Industry ............................................................ 35 5.4 Recapitulation on Frameworks.................................................................................................... 36 5.5 Conclusions................................................................................................................................ 38
6 Important Factors (Potential CSF’s).............................................................................................. 39 6.1 Source 1: The Strategic Plan ...................................................................................................... 39
6.1.1 Mission .............................................................................................................................. 40 6.1.2 Vision................................................................................................................................. 40 6.1.3 Values................................................................................................................................ 41 6.1.4 Organizational Objectives................................................................................................... 42 6.1.5 Strategy ............................................................................................................................. 42
6.2 Source 2: Interviews ................................................................................................................... 42
iii
6.3 Source 3: Perception of Employees ............................................................................................ 43 6.4 Potential CSF’s........................................................................................................................... 44
7 Determination Final CSF’S & KPI’s ............................................................................................... 47 7.1 Decision Chart............................................................................................................................ 47
7.1.1 X-, Y-axis and Bubble Size................................................................................................. 47 7.1.2 Results............................................................................................................................... 48
7.2 The final CSF’s........................................................................................................................... 49 7.3 The final KPI’s ............................................................................................................................ 50 7.4 Conclusions................................................................................................................................ 53
8 What to do with the KPI’s? ............................................................................................................ 54 8.1 Establishment and validation of cause-and-effect relationships ................................................... 54 8.2 KPI’s and Accountability ............................................................................................................. 59
8.2.1 Accountability at CB&I Lummus.......................................................................................... 59 8.2.2 Single Point Ownership of cross-functional KPI’s................................................................ 60
8.3 Iterative and adaptive character of performance measurement ................................................... 61 8.4 Implementation Plan................................................................................................................... 63 8.5 Reservations on managing with KPI’s ......................................................................................... 67
9 Conclusions and Recommendations ............................................................................................ 68 9.1 Conclusions................................................................................................................................ 68 9.2 Recommendations...................................................................................................................... 70 9.3 Validity & Reliability .................................................................................................................... 72
10 Reflection.................................................................................................................................. 73 11 References................................................................................................................................ 74 APPENDIX A Abbreviations and Keywords.................................................................................. 77 APPENDIX B Research Material .................................................................................................... 78 APPENDIX C Leading questions Strategy Map ............................................................................ 79 APPENDIX D Factors linked to the four measurement criteria .................................................... 81 APPENDIX E PMRS Criteria........................................................................................................... 82 APPENDIX F Form to determine CSF’s......................................................................................... 83 APPENDIX G Elaborated KPI’S (according to the PMRS)............................................................. 84

iv
LIST OF TABLES AND FIGURES
Table 1-1 Specific research issues....................................................................................................... 4 Table 1-2 Interviewees and their relevancy to the perspectives of the Strategy Map............................. 7 Table 2-1 Project variables for required execution configuration ......................................................... 10 Table 4-1 List of the views on Indicators............................................................................................. 20 Table 5-1 The 4 perspectives of the BSC including the corresponding strategy and main question ..... 27 Table 5-2 Description of the organizational assets according to Marr et al. (2004) .............................. 29 Table 5-3 The 5 perspectives of the Performance Prism (Neely, 2002)............................................... 32 Table 5-4 A description of the 9 EFQM criteria (EFQM, 2003) ............................................................ 34 Table 6-1 Potential Critical Success Factors (source: identified by the author, based on this chapter). 46 Table 7-1 Number of factors per perspective, per section................................................................... 48 Table 7-2 Views on KPI’s on organizations......................................................................................... 50 Table 7-3 Final Critical Success Factors and allocated Key Performance Indicators (source: author).. 51
Figure 1-1 The context of the Research Objective ................................................................................. 3 Figure 1-2 Applied Research Framework according to Verschuren and Doorewaard (2005) .................. 5 Figure 1-3 Report Structure (source: author) ......................................................................................... 8 Figure 2-1 Organization Chart CB&I (source: intranet)........................................................................... 9 Figure 2-2 CB&I Lummus’ Matrix organization (source: de Bruijn and ten Heuvelhof (1999), modified by
author) .......................................................................................................................................... 10 Figure 2-3 Functional organization (source: Company Management Manual, 2007)............................. 11 Figure 2-4 Typical EPC project organization (Company Management Manual, 2007) .......................... 12 Figure 4-1 Elements and level of processes (source: Nieuwenhuis, 2003) and the transformation
process within organizations (source: Artley and Stroh, 2001) ................................................................. 18 Figure 4-2 Key project stages (source: Blumenthall et al, 2000)........................................................... 19 Figure 4-3 CB&I Lummus’ project stages (source: Company Management Manual (2007), modified by
author) .......................................................................................................................................... 20 Figure 5-1 Number of most frequently cited authors (source: Marr and Schiuma, 2003)....................... 25 Figure 5-2 Percentage of most frequently cited authors in 2002 (source: Marr and Schiuma, 2003) ..... 26 Figure 5-3 The Strategy Map (source: Kaplan and Norton (2000/ 2004), modified by author)............... 30 Figure 5-4 The 5 dimensions of the Performance Prism (source: Neely, 2002) .................................... 32 Figure 5-5 The EFQM model for Business Excellence (source: www.efqm.org) ................................... 34 Figure 5-6 Core values & concepts and criteria ................................................................................... 35 Figure 6-1 Strategic Plan pyramid (source: author).............................................................................. 39 Figure 6-2 Factors to join, stay and reapply (based on Hooft et al., 2007) ............................................ 43 Figure 6-3 Key factors of Lummus perceived by employees (based on Hooft et al., 2007) ................... 44 Figure 6-4 Primary dimensions valued by employees (source: Walton, 1973) ...................................... 44 Figure 7-1 Decision Chart ................................................................................................................... 47 Figure 8-1 Strategy Map/ Cause-and-effect relationship diagram for EPC Contractors......................... 56 Figure 8-2 Headline, Operational and Diagnostic level of KPI’s............................................................ 58 Figure 8-3 Ongoing process of performance measurement and improvement (source: author) ............ 62


v
EXECUTIVE SUMMARY
In order to sustain a competitive advantage and therefore to survive as an organization, companies should
be capable of continuously improving their performance. This has never been more applicable than in today’s complex, dynamic and confusing business environment which requires better decisions and improved execution. Managing business performance effectively firstly requires measurement of the current performance and from that point on, the company can make decisions in order to improve its performance in those areas where needed.
Some years ago, CB&I Lummus, an Engineering, Procurement and Construction (EPC) contractor,
acknowledged this and decided on measuring their performance. However, performance measurement was not sufficient as it did not lead to making decisions which increased business performance. Therefore, the research in this thesis is aimed at the design of a method that ensures continuous performance measurement at company level for Engineering, Procurement and Construction Contractors in order to continually improve their performance.
As many other companies, CB&I Lummus used Key Performance Indicators (KPI’s) to measure their performance. Literature study shows that there is nothing wrong with using KPI’s to measure organizational performance, as long as they are designed and used correctly. Imagine an airplane’s instrument panel (dashboard) consisting of instrument dials and gauges. Like pilots are able to process
information from a large number of indicators to navigate their airplane, organizations need instrumentation (KPI’s) about many aspects of their environment to keep track of their journey towards excellent performance. Theoretically, using KPI’s correctly can be approached from different point of views. Firstly, KPI’s are
directly related to the organization’s strategy and/ or directly contribute to the organization’s strategic objectives. This requirement enables KPI’s both on company and project level. The company’s ‘dashboard’ consists of several KPI’s. When determining these KPI’s it is of importance that there is an appropriate mix with respect to the way KPI’s can be viewed in organizations. This will enable the determination of KPI’s which represent different aspects of business processes. In this KPI determination process, KPI’s also
need to be ‘good’ and designed in a structured way. In measuring performance, organizations need to approach KPI’s from a broader point of view where many factors are related, e.g. KPI’s are not isolated measurements. Just like dials and gauges are
instrumentation which make up a whole, namely the airplane’s dashboard, every KPI is part of a whole, namely the company’s performance measurement dashboard (can you imagine boarding an airplane of which the pilot is only interested in the speed and does not pay attention to the amount of fuel, the altitude, etc.?). This holistic approach argues for the use of a framework which functions as a basis in organizational performance measurement. There are several frameworks available in the literature.
Deciding on which framework to apply should not be done by analyzing which framework fits best to a specific Industry, because frameworks approach organizations from a high abstraction level. Therefore a framework needs to be determined on the basis of theoretically valid criteria. Enhanced by a comparison of the frameworks amongst each other, this study argues to use the Strategy Map of Kaplan & Norton, regardless of the Industry an organization is active in.
One of the main characteristic of the Strategy Map is the approach of organizations from perspectives.
Kaplan & Norton argue that these perspectives should be in balance. However, an important conclusion of
this study is that this balance is not as important as the fact that the Strategy Map should represent a
balance between the needs and requirements vital to the success of the company. These needs and
requirements are represented by the Critical Success Factors (CSF’s). Basically, the perspectives are only
used to sort CSF’s and to make sure you do not leave out any important ones. So, it is not a requirement
of the Strategy Map that all perspectives contain the same number of CSF’s, as long as important ones are
not left out. After determining which CSF’s are the most business critical and measurable, one or more
KPI’s have been allocated to the CSF’s. These KPI’s are designed in such a way that they comply with the
theoretical requirements. CB&I Lummus and other companies in the EPC contracting business are advised
to implement these KPI’s, which all together will function as the dashboard for their journey towards
excellent performance.

vi
Reflecting on the KPI’s used by CB&I Lummus up till now, it can be concluded that these KPI’s are hardly
linked to the strategy and do not make up an integrated whole. Also, the KPI’s provide only a partial picture
of performance that reflects what is easy to measure in stead of what is important to measure. This
resulted in KPI’s which were used reactively: checking whether targets on project level were achieved. The
concept of KPI’s is broader than only monitoring, it needs to enable company management to enrich their
decision making process.
In order to use the dashboard for management purposes, in stead of only as a monitoring tool, this study
emphasizes on cause-and-effect relationships between all KPI’s of the dashboard (by using System
Dynamics modeling techniques). These relationships indicate how KPI’s influence each other. Imagine
again the airplane’s dashboard: if for whatever reason the travel time needs to be shortened, the pilot can
decide to increase speed, which will decrease the fuel amount faster, increase environmental impact,
increase the rotation speed, etc. In this thesis, potential relationships are given, which are subject to be
tested thoroughly in additional research. But these relationships are not sufficient to understand why
certain changes may have occurred in KPI’s and to analyze areas for improvement in more detail. An
answer given in this study is to acknowledge different levels of KPI’s, where the big picture should be
bared in mind first and then the focus can be concentrated on the pieces that fit into that picture. Advised is
to implement KPI’s of all levels in a System Dynamics model in order to understand the changes in the
KPI’s due to change in policies and actions. An additional advantage of modeling is that ‘what if’ scenarios
can be tested.
Another shortcoming in the current KPI concept is the lack of a direct link between (not) meeting KPI
targets and incentives/ penalties. This study recommends a proactive accountability policy which is based
on incentives. Awarding incentives needs to be part of a continual process: this study recommends an
ongoing process which takes into account all iterative steps to be taken in the performance measurement
and improvement journey of companies. An important note is that this ongoing process has an adaptive
character; it needs to be reviewed regularly on validity.
Because any concept can still fail in the implementation phase (or even in an earlier phase when it is not
clear who needs to do what and when), a pragmatic plan has been designed in this study specifically for
CB&I Lummus. This plan indicates what needs to be done stepwise in order to increase the probability of
the KPI-concept to succeed. Also (for companies in general), based on the knowledge gained in this study,
the development process of performance measurement and improvement is given.
“Like pilots are able to process information from a large number of indicators to navigate their airplane,
organizations need instrumentation (KPI’s) about many aspects of their environment to keep track of their
journey towards excellent performance.”
“…can you imagine boarding an airplane of which the pilot is only interested in the speed and does not pay
attention to the amount of fuel, the altitude, etc.?...”

1
1 INTRODUCTION
This chapter is an introduction of this master thesis and can be considered to be the guideline of this
research. First, brief background information is given of the company where the master thesis is executed,
CB&I Lummus BV. The second section includes the context of this research to discuss why this research is
necessary, followed by the scope of the research in the third section. The scope description makes sure
that all involved parties have the same understanding with regard to this thesis. The fourth section
describes the steps that are taken during the research and the fifth section discusses how the steps will be
taken. Section 6 will elaborate on the two main tools that have been used to retrieve valuable information.
Finally, the last section gives the structure for the following chapters of this research.
1.1 CB&I Lummus BV
CB&I Lummus is an international Engineering, Procurement and Construction (EPC) Contractor, providing
a full range of services to the oil and gas, petroleum refining and petrochemical industries worldwide (both
onshore and offshore). CB&I Lummus is a 100% owned CB&I company with headquarters in Texas. CB&I
Lummus’ headquarter is located in The Hague, CB&I Lummus Netherlands (CLN), and shares work with
other CB&I Lummus companies in order to execute multiple large projects concurrently. Presently the
Home Office in The Hague has a staff of approx. 800 employees and together with the other offices,
approx. 2700 employees. In 2007 the revenue was approx. USD 105 million (CB&I Annual Report, 2007).
CB&I Lummus’ main focus is on executing EPC projects. In addition to the EPC work CB&I Lummus also
provides other engineering related services, such as:
1. Project Management Contractor,
2. Front End Engineering Design,
3. Basic Design and Engineering Package,
4. Feasibility studies,
5. Technology development,
6. Authority coordination,
7. Health, Safety and Environmental studies.
Chapter 2 will elaborate more on business specific features of CB&I Lummus.
1.2 Project Context
The Master Thesis is executed within the Project Services department at CLN. This department provides
services to projects, containing the following disciplines: Estimating, Cost Control, Planning & Scheduling,
Material Control and Project Engineering Management and counts approx. 80 employees. The director
Project Services is a member of the Company Management Team (CMT) and reports directly to the
General Manager.
Faced with the increasingly competitive and dynamic business environment, both nationally and
internationally, the Company Management of CB&I Lummus agreed upon a set of Key Performance
Indicators1 (KPI’s) to help them manage more effectively. This decision has been included as part of the
values in the Company Management Manual (2007), being “a systematic planned and controlled approach
towards executing work and measuring performance to improve consistency and efficiency”.
Hence, now approximately 6 years ago, KPI’s were defined to measure company performance based on
the Project Management Triangle. The Project Management Triangle measures performance on quality in
terms of time, cost and scope. As mentioned above the KPI’s were defined to measure the company
performance. The aim of Company Management was to use the outcomes of the measurements to
manage business processes in order to improve business effectiveness. However, this aim of using the
measurements to improve business effectiveness by Company Management is not being fully
accomplished, primarily caused by the fact that the current KPI’s do not capture all aspects related to the
business strategy:
1 See section 4.1 for a definition of Key Performance Indicators.

2
� The KPI’s are only used to measure the performance of a single entity and therefore do not meet the
requirements to measure the performance in a multi office project environment. Sieval (2006) notes
that due to the Multi Office Project Execution (MOPEX)2 strategy, firstly the managerial control can be
seen from various stakeholder perspectives. Secondly, the dependencies across various business
units increase and finally due to the various stakeholders, each manager acts to its own strategy,
which gives rise to sub-optimization and unfortunately conflict of interest. To cope with these plural
strategies one of the advices given is to define strategic metrics on corporate level.
� The KPI’s are mainly based on cost driven measures, while an adequate business strategy contains
more aspects to create future value through investment in customers, suppliers, employees,
processes, technology and innovation (Kaplan and Norton, 1996).
� The KPI’s are an ad hoc collection of measures, whereas they should describe a coherent business
strategy (Kaplan and Norton, 2000).
� The KPI’s measure the performance in the past to date, whereas the measurement of value drivers for
long-term (strategic) competitive performance in the future is even more important.
� Failing to base strategic business decisions on the retrieved data.
� The KPI’s are outcomes of what happened in a business process. They cannot fully explain what
happened in the process in order to form a basis for strategic decisions.
� KPI’s are designed on project level; in case of deviation from the standards the explanation is given in
terms of project related issues, what therefore do not enable management to use the KPI’s for decision
making. The KPI’s should be on a higher business level, related to the strategy.
� Another dimension of the strategy is that the current complexity and size of projects require a Joint
Venture approach; hence alliances with other companies are also significant for realizing
organizational goals and its measurement.
The consequence is that, in the cycle of continual improvement, the identification and prioritization of
opportunities for performance improvement are partly being missed by CB&I Lummus. This has also been
included in the Company Management Manual (2007) as a value, being “a culture of continual
improvement recognizing that suggestions and learnings are opportunities towards excellence and
improved competitiveness”. This value complies with the ISO 9001 certification of CB&I Lummus,
according to which the company is required to facilitate continual improvement by monitoring, measuring
and analyzing performance and by implementing necessary actions.
Although ad hoc initiatives to improve the performance have been initiated, the KPI’s are lacking a
structured process towards concrete performance improvement (lack of a continual process of
performance measurement and performance improvement). It is also not possible to determine what the
effects are of the ad hoc initiatives up till now. Considering the (international) competitive business
environment of CB&I Lummus, this lack of not improving to the full extent will have far-reaching
consequences. Especially due to the fact that low cost competitors imitate the services and are penetrating
into the markets of CB&I Lummus. Also, the function of the KPI’s to identify and track progress against
organizational goals is not being realized adequate. Hence, Company Management can not determine to
what extent the company strategy is sufficient for the organizational goals. And the benchmarking aspect,
comparing performance against both internal and external standards is also not achieved to its full extent.
Using lessons from incomplete, incorrect or disputable measures will not lead to (targeted) improvements.
1.3 Project Scope & Limitations
The scope of the Master Thesis is primarily to re-design the KPI package to enable performance
measurement on corporate level and secondly on the criteria for effective use of these KPI’s. The study is
limited to one company, namely CB&I Lummus. This limitation is firstly due to the need of Company
Management, as discussed in the project context above. The second reason is a practical one: Company
Management has agreed on time availability for interviews and surveys, both for the respondents and the
2 The purpose of multi-office execution is to achieve optimum synergism of project activities executed across multiple
internal and external offices while maintaining cost, schedule and quality of the project as a whole (ABB Lummus
Global – Best Practice, 2006).

3
author. Consequently, the study is also limited to a single Industry, namely the Industry where CB&I
Lummus is active in: Engineering, Procurement and Construction Contracting. Despite of the focus on one
company, the results can be assumed to be representative for this business and therefore the results of
this research can be implemented for all contractors competing in this business (this also stimulates the
benchmark of performance in this Industry). The justification can be found in the extensive (theoretical)
literature studies conducted. Also, the line of business CB&I Lummus operates in, is limited to a few
companies with the same main characteristics and processes. It is not a strange phenomenon that
employees rotate every few years from one company to the other in this Industry and even return to one of
the earlier companies (‘it is a small world’).
Inclusion
� Redesigned package with elaborated KPI’s.
� Performance measurement concept (framework) with sufficient basis for strategic purposes.
� Procedure for execution of performance measurement.
� Implementation of the KPI concept as a Management Tool.
Exclusion
� Implementation of the new concept throughout the whole CB&I Lummus organization (including CLN).
� Elaborated strategic choices based on performance measurement to implement organizational
improvements.
1.3.1 Research objective
The relation between continual improvement and KPI’s is illustrated in Figure 1-1. In order to continually
improve, the organizational performance needs to be managed effectively by making the correct decisions.
In order to make the correct decisions, organizations need to measure their performance which will provide
them the necessary input. The widely accepted business tool to measure performance is a set of Key
Performance Indicators.
Figure 1-1 The context of the Research Objective
Following from the project context and the description above, the research objective of this thesis can be
given:
To design a method that ensures continuous performance measurement at company level for Engineering,
Procurement and Construction Contractors in order to continually improve their performance.
4
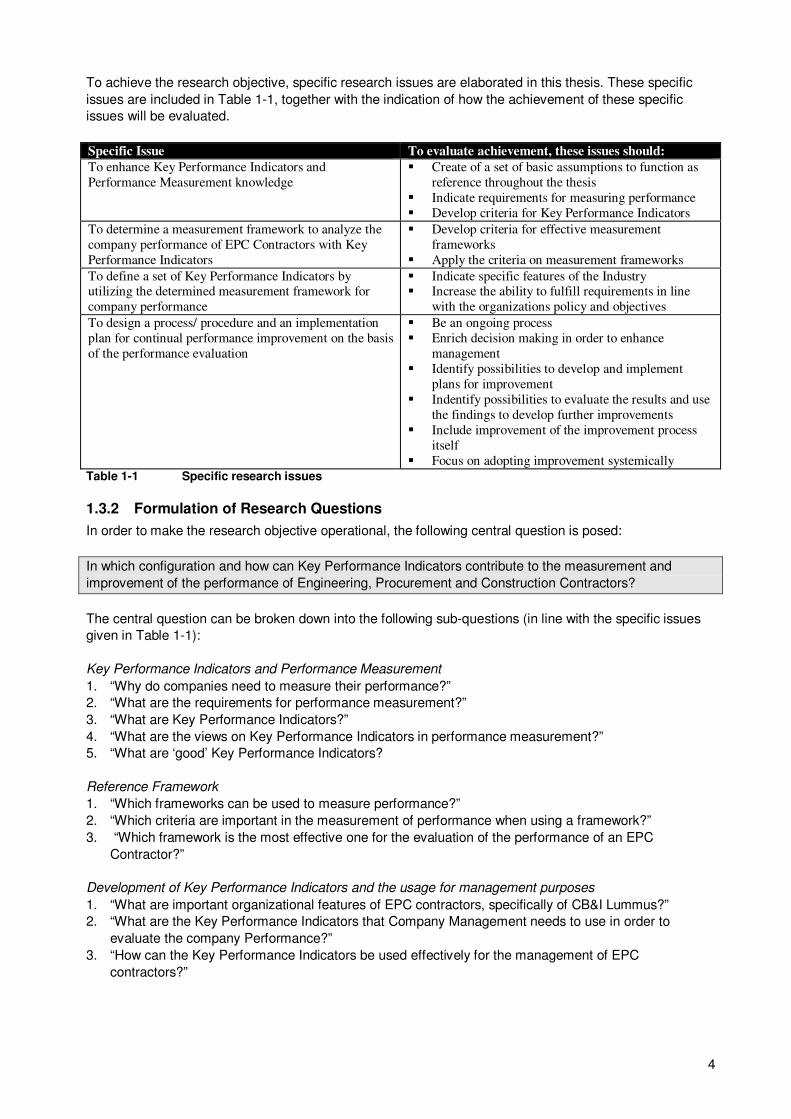
To achieve the research objective, specific research issues are elaborated in this thesis. These specific
issues are included in Table 1-1, together with the indication of how the achievement of these specific
issues will be evaluated.
Specific Issue To evaluate achievement, these issues should:
To enhance Key Performance Indicators and
Performance Measurement knowledge
� Create of a set of basic assumptions to function as
reference throughout the thesis
� Indicate requirements for measuring performance
� Develop criteria for Key Performance Indicators
To determine a measurement framework to analyze the
company performance of EPC Contractors with Key
Performance Indicators
� Develop criteria for effective measurement
frameworks
� Apply the criteria on measurement frameworks
To define a set of Key Performance Indicators by utilizing the determined measurement framework for
company performance
� Indicate specific features of the Industry � Increase the ability to fulfill requirements in line
with the organizations policy and objectives
To design a process/ procedure and an implementation
plan for continual performance improvement on the basis
of the performance evaluation
� Be an ongoing process
� Enrich decision making in order to enhance
management
� Identify possibilities to develop and implement
plans for improvement
� Indentify possibilities to evaluate the results and use
the findings to develop further improvements
� Include improvement of the improvement process
itself
� Focus on adopting improvement systemically
Table 1-1 Specific research issues
1.3.2 Formulation of Research Questions
In order to make the research objective operational, the following central question is posed:
In which configuration and how can Key Performance Indicators contribute to the measurement and
improvement of the performance of Engineering, Procurement and Construction Contractors?
The central question can be broken down into the following sub-questions (in line with the specific issues
given in Table 1-1):
Key Performance Indicators and Performance Measurement
1. “Why do companies need to measure their performance?”
2. “What are the requirements for performance measurement?”
3. “What are Key Performance Indicators?”
4. “What are the views on Key Performance Indicators in performance measurement?”
5. “What are ‘good’ Key Performance Indicators?
Reference Framework
1. “Which frameworks can be used to measure performance?”
2. “Which criteria are important in the measurement of performance when using a framework?”
3. “Which framework is the most effective one for the evaluation of the performance of an EPC
Contractor?”
Development of Key Performance Indicators and the usage for management purposes
1. “What are important organizational features of EPC contractors, specifically of CB&I Lummus?”
2. “What are the Key Performance Indicators that Company Management needs to use in order to
evaluate the company Performance?”
3. “How can the Key Performance Indicators be used effectively for the management of EPC
contractors?”

5
1.4 Research Setup
This research meets the definition that Verschuren and Doorewaard (2005) give for a practically-oriented
research, namely the aim to contribute to an intervention which will lead to a change in an existing practice
situation. Furthermore, Verschuren and Doorewaard (2005) divide practically-oriented researches in fives
phases for problem solving acting. Two of these phases are relevant in this research:
� Design: this is the primary focus of this research. In the design-oriented phase the new KPI’s and the
use of it will be discussed, based on research material (theoretical and practical).
� Diagnostic: this is the secondary focus of this research. The first step in the diagnostic phase is a
further analysis of the problem and the context in which it occurs. The second step in the diagnostic
phase is the background of KPI’s and the configuration of the current KPI’s.
Figure 1-2 Applied Research Framework according to Verschuren and Doorewaard (2005)
Figure 1-2 introduces the research framework3 of this thesis. The 5 columns in this model, (a) – (e), are the
steps to be taken in the line of the research project and can be expressed as:
(a) With the elaboration of the problem context and a further analysis of the organization of CB&I Lummus
the basis of this thesis will be set. From this basis, research on (b) performance measurement,
management and strategy, the information need of Company Management and benchmark information will
provide (c) the model/ framework for measuring performance, design criteria’s for KPI’s, success factors in
measuring performance and the effective application of the measurements for management purposes. The
theoretical frame of reference set in step (c) will be referred to in the (d) determination and design of the
revised set of KPI’s and elaboration of the usage of the KPI’s for management purposes, which will lead to
(e) recommendations with regard to the performance measurement at CB&I Lummus and other EPC
Contractors.
1.5 Research Strategy
Verschuren and Doorewaard (2005) define a research strategy as a whole of coherent decisions with
regard to the way by which the research will be executed. The strategy of this research first contains desk
research by literature studies of performance measurement and management/ business strategies related
to performance measurement. A benchmark of performance measurement is also part of the strategy and
will give criteria’s for performance measurement as used in the industry (as far as available). Furthermore,
other literature like internal documents and procedures will be analyzed for better insight in business 3 Research framework: a schematic representation of the research objective and a broad outline of the steps to be
executed in order to achieve this objective (Verschuren and Doorewaard, 2005).

6
processes of CB&I Lummus. The second part of the research will be an empirical (practical) research by
executing surveys for:
1. The analyses of the problem situation and the information need of Company Management.
2. The determination of the KPI’s.
The sources of information and the methods applied to gather the information are identified in Appendix B.
1.6 Research Tools
As mentioned in section 1.4 this thesis is practically-oriented. The empirical sources in this part of the
thesis are persons/ employees of CB&I Lummus. Verschuren and Doorewaard (2005) argue that persons
(1) provide a large diversity of information and (2) the information can, compared with other sources, be
retrieved quickly. Furthermore, Verschuren and Doorewaard (2005) advise either to use interviews or
observations if the sources of the practical research are persons. Observations are advised when the
behavior of persons are important and interviews when it is useful to know how people think about certain
issues and how they (want to) act with regard to certain subjects. Based on these arguments, the author
has chosen for interviews and surveys as research tools for the practical part of this thesis.
1.6.1 Interviews
In the following part of this paragraph the objective and design of the interviews, used to gain knowledge
about contextual Critical Success Factors4 (CSF’s) and KPI’s, will be discussed.
1.6.1.1 Interview Objectives
The main objective of the interviews is to retrieve the important factors in order to design the Strategy Map5
for EPC contractors operating in the Oil & Gas Industry and specifically for CB&I Lummus. Actually, the
Strategy Map as designed by Kaplan and Norton will be challenged thoroughly to check the validity for the
business context of CB&I Lummus by utilizing the varied knowledge and perspectives of the interviewees.
Therefore, the final framework will not only be based on extensive literature study, but will also be firmly
rooted in CB&I Lummus’ business context.
The second objective of the interviews is to collect proposed KPI’s (in relation with CSF’s) that can be
taken into account when determining the KPI’s. This will result in KPI’s that will not only have theoretical,
but also business specific bases.
1.6.1.2 Interview Design
The Strategy Map contains 4 perspectives (will be discussed in chapter 5). Therefore, questions have been
developed for each perspective, which are also considered to be leading in the interviews, see Appendix
C. The basis of these questions is the theoretical design of the Strategy Map, complemented with the
theories discussed in this thesis. This will ensure that the CSF’s retrieved will be on strategic level.
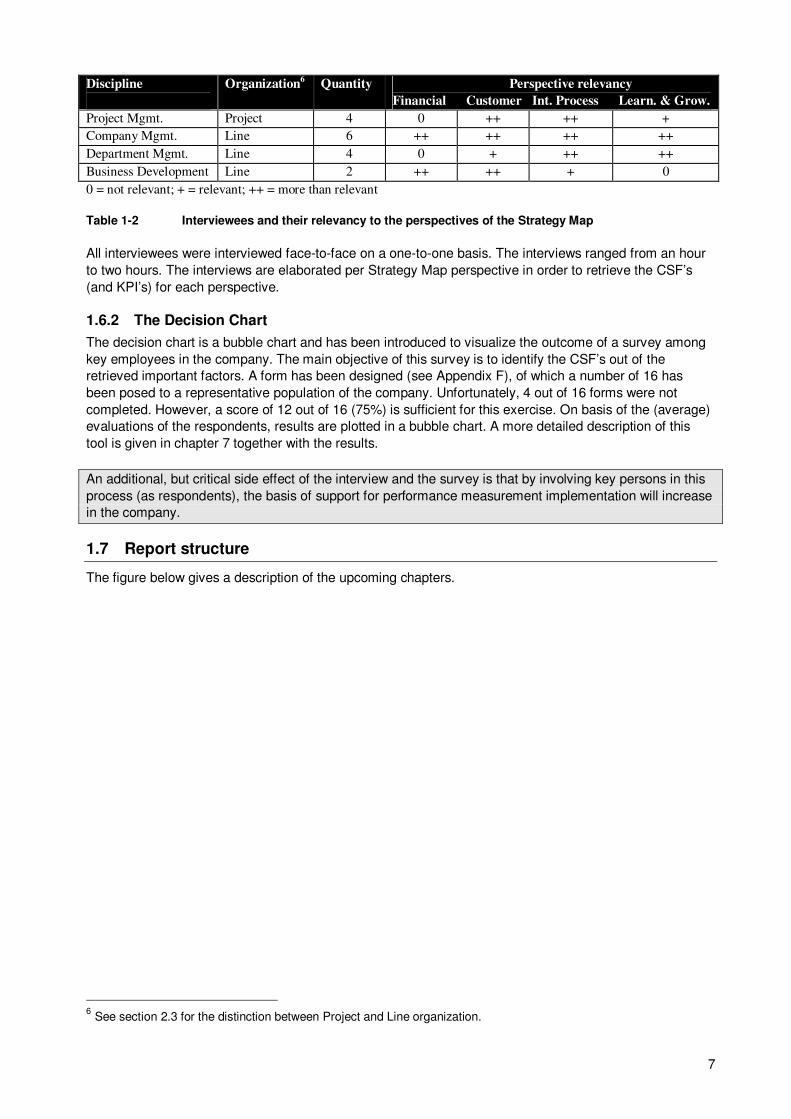
In order to retrieve balanced feedback with regard to the 4 perspectives, interviews haven been executed
with interviewees originating from disciplines of which can be expected to deliver valuable information for
these perspectives, see Table 1-2. This Table also indicates the extent to which the disciplines are
expected to be relevant with regard to the perspectives. Furthermore, the interviewees are considered to
be senior in their respective discipline, what should increase the quality of the feedback.
4 See section 5.1.2.2 for a definition of Critical Success Factors.
5 The Strategy Map is a performance measurement framework: see section 5.1.2 for a description of the Strategy Map.
7
Discipline
Organization6 Quantity Perspective relevancy
Financial Customer Int. Process Learn. & Grow.
Project Mgmt. Project 4 0 ++ ++ +
Company Mgmt. Line 6 ++ ++ ++ ++
Department Mgmt. Line 4 0 + ++ ++
Business Development Line 2 ++ ++ + 0
0 = not relevant; + = relevant; ++ = more than relevant
Table 1-2 Interviewees and their relevancy to the perspectives of the Strategy Map
All interviewees were interviewed face-to-face on a one-to-one basis. The interviews ranged from an hour
to two hours. The interviews are elaborated per Strategy Map perspective in order to retrieve the CSF’s
(and KPI’s) for each perspective.
1.6.2 The Decision Chart
The decision chart is a bubble chart and has been introduced to visualize the outcome of a survey among
key employees in the company. The main objective of this survey is to identify the CSF’s out of the
retrieved important factors. A form has been designed (see Appendix F), of which a number of 16 has
been posed to a representative population of the company. Unfortunately, 4 out of 16 forms were not
completed. However, a score of 12 out of 16 (75%) is sufficient for this exercise. On basis of the (average)
evaluations of the respondents, results are plotted in a bubble chart. A more detailed description of this
tool is given in chapter 7 together with the results.
An additional, but critical side effect of the interview and the survey is that by involving key persons in this
process (as respondents), the basis of support for performance measurement implementation will increase
in the company.
1.7 Report structure
The figure below gives a description of the upcoming chapters.
6 See section 2.3 for the distinction between Project and Line organization.

8
Analysis KPI’s
Chapter 4
Introduction
Performance
Measurement
Chapter 3
Company
Features
Chapter 2
Project Scope
Chapter 1
Performance
Mesurement
Framework
Chapter 5
Important Factors
in the Industry
Chapter 6
Final CSF’s &
KPI’s
Chapter 7
What to do with
KPI’s?
Chapter 8
Conclusions and
recommendations
Chapter 9
In this chapter the Master thesis has been introduced. The sections describe why
this research is necessary, what the projects exactly covers and how it will be
executed.
In chapter 2 the line of business where CB&I Lummus is active in as well as the
organizational features are discussed. This will enlarge the knowledge of the Oil &
Gas EPC Industry. In chapter 3 Performance Measurement is introduced. Several
aspects are elaborated to gain knowledge about what exactly performance is, why
companies need to measure this and what the requirements are.
With chapter 3 as a basis, the indicators to measure performance (KPI’s) will be
discussed in chapter 4. First a clear definition is given of KPI’s, followed by
sections which discuss which views on KPI’s exist, what ‘good’ KPI’s are, how to
design KPI’s in a structured way and the experiences with KPI’s in the past.
Based on the conclusions of chapter 4 several frameworks will be discussed in
chapter 5. This chapter will be concluded with a substantiated choice for a
framework in the last section.
Following from the conclusions in chapter 5, the elements for a measurement
framework are CSF’s. In order to determine these, first the important factor in this
line of business are retrieved, which are potential CSF’s. These factors are
retrieved from different sources.
Once the potential CSF’s are retrieved in chapter 6, the final CSF’s are determined
in chapter 7. Also, KPI’s will be allocated to these CSF’s in this chapter.
KPI’s are worthless if they are not used to make decisions. This chapter will
indicate how the KPI’s, determined in the previous chapters, can be used to
improve performance.
Based on the arguments given in this study, conclusions are given in this chapter
by answering the posed research questions. This will also be the basis for the
recommendations.
Figure 1-3 Report Structure (source: author)
9
2 CB&I LUMMUS
In the previous chapter (section 1.1) a brief description is given of CB&I Lummus (former ABB Lummus
Global). In order to gain more knowledge of the internal and external (as part of CB&I) organizational
context, this chapter will elaborate more on these aspects. This will be of use in the process of designing
the KPI’s and can also function as benchmark for other contractors in the business. Chicago Bridge & Iron
Company N.V. (CB&I) is the parent company of CB&I Lummus B.V., which is introduced in the first section.
The second section gives a description of the line of business where CB&I Lummus is active in, followed
by the organizational features in the third section.
2.1 Chicago Bridge & Iron Company N.V. (CB&I)
CB&I, with headquarters in Woodland, Texas, combines proven process technology with global capabilities
in engineering, procurement and construction to deliver comprehensive solutions to customers in the
energy and natural resource industries. CB&I is positioned to carry out projects from conceptual design,
through technology licensing, engineering and construction and final commissioning. CB&I's scope of
technical capabilities spans the full range of oil & gas projects, from onshore and offshore oilfield
development; through gathering, separation and transportation; to refining, downstream processing and
petrochemicals; and through to storage and distribution. CB&I is divided in three operating units, (1) CB&I,
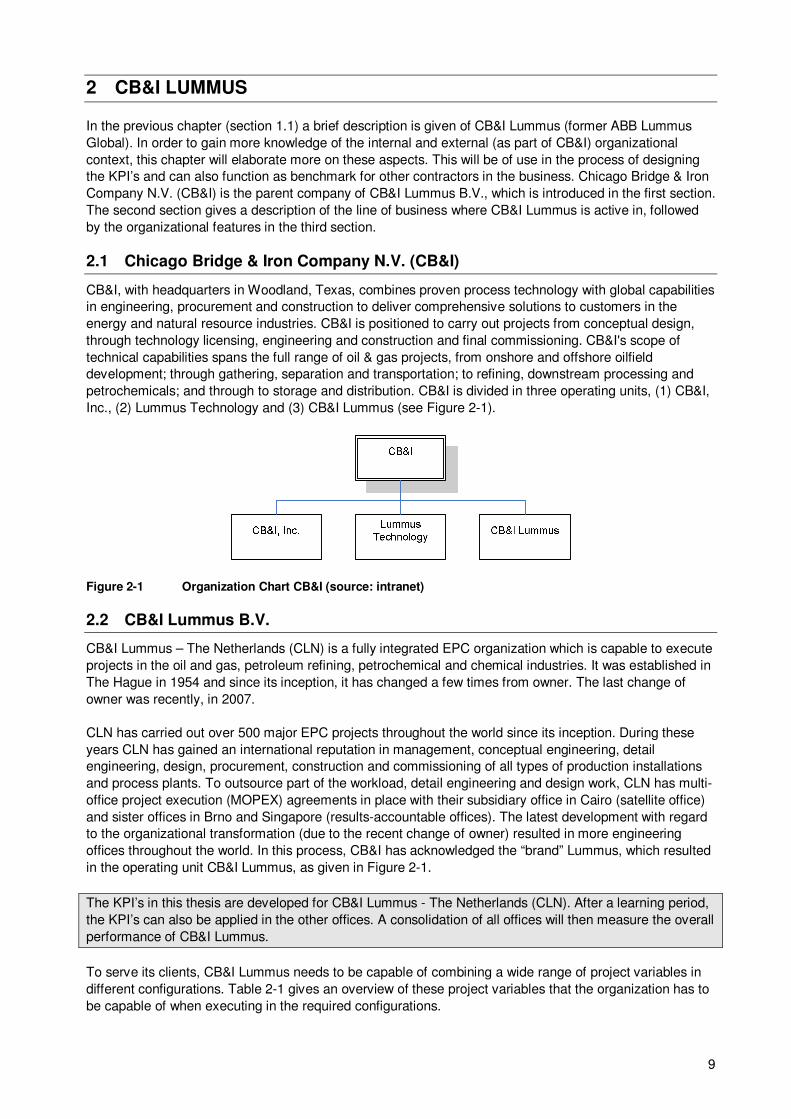
Inc., (2) Lummus Technology and (3) CB&I Lummus (see Figure 2-1).
Figure 2-1 Organization Chart CB&I (source: intranet)
2.2 CB&I Lummus B.V.
CB&I Lummus – The Netherlands (CLN) is a fully integrated EPC organization which is capable to execute
projects in the oil and gas, petroleum refining, petrochemical and chemical industries. It was established in
The Hague in 1954 and since its inception, it has changed a few times from owner. The last change of
owner was recently, in 2007.
CLN has carried out over 500 major EPC projects throughout the world since its inception. During these
years CLN has gained an international reputation in management, conceptual engineering, detail
engineering, design, procurement, construction and commissioning of all types of production installations
and process plants. To outsource part of the workload, detail engineering and design work, CLN has multi-
office project execution (MOPEX) agreements in place with their subsidiary office in Cairo (satellite office)
and sister offices in Brno and Singapore (results-accountable offices). The latest development with regard
to the organizational transformation (due to the recent change of owner) resulted in more engineering
offices throughout the world. In this process, CB&I has acknowledged the “brand” Lummus, which resulted
in the operating unit CB&I Lummus, as given in Figure 2-1.
The KPI’s in this thesis are developed for CB&I Lummus - The Netherlands (CLN). After a learning period,
the KPI’s can also be applied in the other offices. A consolidation of all offices will then measure the overall
performance of CB&I Lummus.
To serve its clients, CB&I Lummus needs to be capable of combining a wide range of project variables in
different configurations. Table 2-1 gives an overview of these project variables that the organization has to
be capable of when executing in the required configurations.
10
Project Element Range returning in projects
1. Projects Refineries, Petrochemical Plants, Offshore Platforms, Floating Production
2. Geographical Europe, Africa, Middle East, Russia, Asia
3. Clients
Oil and gas companies, state oil, gas and power enterprises, (petro)chemical
companies
4. Scope
From relatively simple study to full EPC contract including installation,
commissioning and Start-Up
5. Size
Euro From 7.000 to several billion
Office manpower Anywhere between 2 and 500 people
Construction Manpower Anywhere between 150 and 10.000 people
Timeframe Between a week and 4 years
6. Number of Execution Centers From 1 to 4 on different continents
7. Alliances Single or in Joint Ventures with 1, 2 or more partners
8. Contract
From fully reimbursable to Lump Sum Turn Key and may include incentive
payments
9. Market
Upstream, Downstream, Refining, Petrochemicals, Process Technology and
Power
Table 2-1 Project variables for required execution configuration
CB&I Lummus’ business is the Execution and Management of Capital Investment Projects. The focus is to
work with those projects and in those markets where competitive business solutions are presented to the
clients from conceptual design and Project Management Contracting (PMC) services through full EPC
execution.
2.3 Matrix Organization
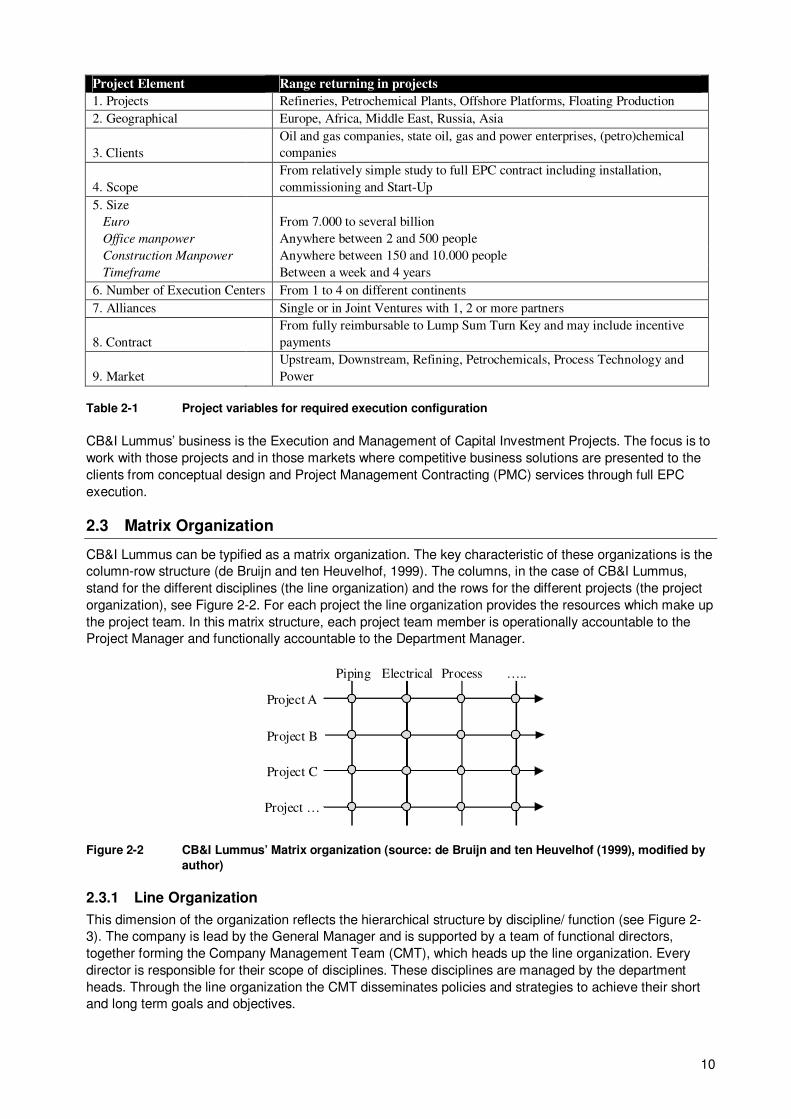
CB&I Lummus can be typified as a matrix organization. The key characteristic of these organizations is the
column-row structure (de Bruijn and ten Heuvelhof, 1999). The columns, in the case of CB&I Lummus,
stand for the different disciplines (the line organization) and the rows for the different projects (the project
organization), see Figure 2-2. For each project the line organization provides the resources which make up
the project team. In this matrix structure, each project team member is operationally accountable to the
Project Manager and functionally accountable to the Department Manager.
Project A
Project B
Project C
Project …
Piping Electrical Process …..
Figure 2-2 CB&I Lummus’ Matrix organization (source: de Bruijn and ten Heuvelhof (1999), modified by
author)
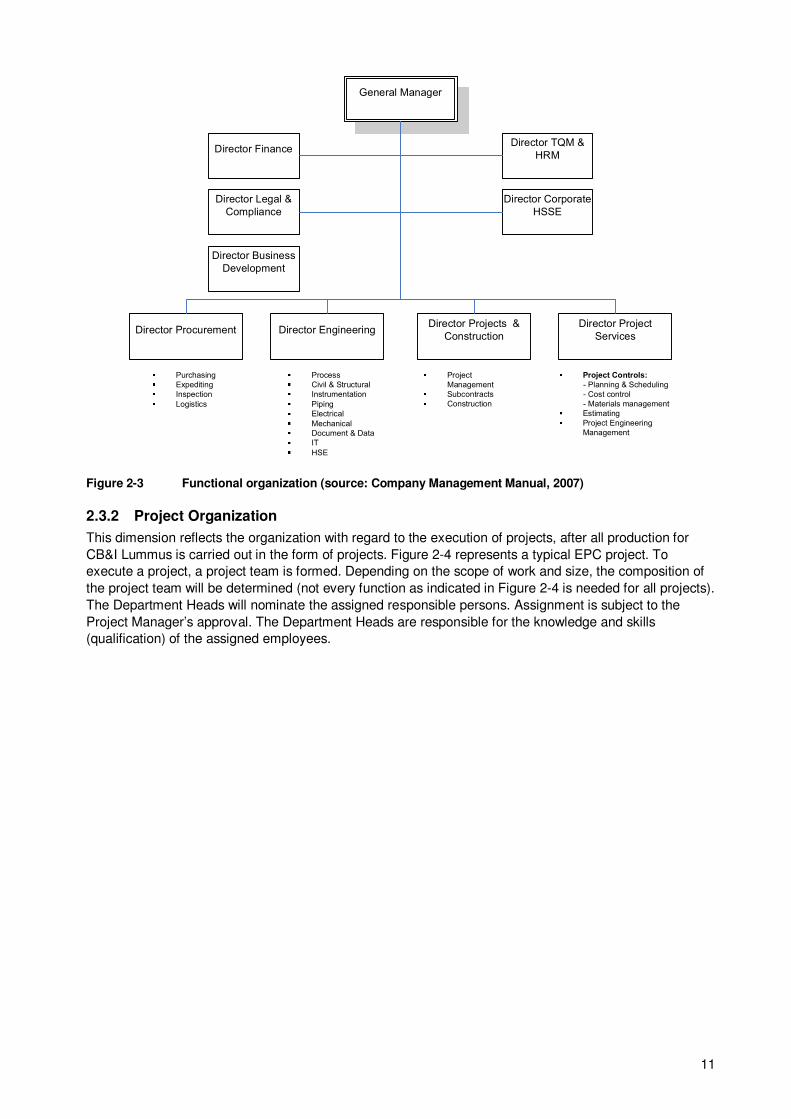
2.3.1 Line Organization
This dimension of the organization reflects the hierarchical structure by discipline/ function (see Figure 2-
3). The company is lead by the General Manager and is supported by a team of functional directors,
together forming the Company Management Team (CMT), which heads up the line organization. Every
director is responsible for their scope of disciplines. These disciplines are managed by the department
heads. Through the line organization the CMT disseminates policies and strategies to achieve their short
and long term goals and objectives.
11
General Manager
Director Procurement Director EngineeringDirector Projects &
Construction
Director TQM &
HRM
Director Corporate
HSSE
Director Finance
Director Legal &
Compliance
Director Project
Services
Director Business
Development
Process
Civil & Structural
Instrumentation
Piping
Electrical
Mechanical
Document & Data
IT
HSE
Purchasing
Expediting
Inspection
Logistics
Project
Management
Subcontracts
Construction
Project Controls:
- Planning & Scheduling
- Cost control
- Materials management
Estimating
Project Engineering
Management
Figure 2-3 Functional organization (source: Company Management Manual, 2007)
2.3.2 Project Organization
This dimension reflects the organization with regard to the execution of projects, after all production for
CB&I Lummus is carried out in the form of projects. Figure 2-4 represents a typical EPC project. To
execute a project, a project team is formed. Depending on the scope of work and size, the composition of
the project team will be determined (not every function as indicated in Figure 2-4 is needed for all projects).
The Department Heads will nominate the assigned responsible persons. Assignment is subject to the
Project Manager’s approval. The Department Heads are responsible for the knowledge and skills
(qualification) of the assigned employees.

12
Figure 2-4 Typical EPC project organization (Company Management Manual, 2007)
Besides the business specific features, an important feature of Contractors operating in the Oil & Gas EPC
Industry is that executing projects is the core business, after all projects guarantee production. Therefore in
the determination (process) of the KPI’s later in this research there should be considerable notice for the
performance on project level besides the performance on corporate level (line organization).

13
3 PERFORMANCE MEASUREMENT
This chapter outlines the basic assumptions of performance measurement, which will function as a frame
of reference during the elaboration of this research. First will be discussed what exactly performance is and
secondly why it should be measured. The last section discusses some basic requirements when
measuring performance.
3.1 Introduction
The environment within which most organizations operate is changing rapidly: increasing higher users’
requirements, higher customers’ requirements, Safety, Health & Environmental awareness, quality
awareness, and limited or merger resources on one side, and increased competition among organizations,
the increased risk in contracting and accelerated emergency of new technology on the other side.
Organizations failing to adapt and respond to the complexity of the new environment tend to experience
survival problems, sooner or later. In this climate of change, EPC Contractors have to be capable of
continuously improving their performance in order to sustain a competitive advantage.
‘Performance’ is difficult to define due to the multidimensionality of this term. In dictionaries the following
definition is given to performance7: “the execution or accomplishment of work” or “the manner in which or
the efficiency with which something reacts or fulfills its intended purpose”. Lebas and Euske (2002) also
provide a definition of performance: “doing today what will lead to measured value outcomes tomorrow.”
Performance Measurement then is concerned with measuring this performance relative to some
benchmark, be it a competitor’s performance or a pre-set target. Looking at organizations, the following
definition is probably the most relevant: organizational performance is defined in terms of the value that an
organization creates using its productive assets in comparison with the value that the owners of these
assets expect to obtain (van den Berghe & Verweire, 2004).
To make the comparison mentioned above, the created value (Performance) should be measured. The
next section will elaborate more on this need for organizations to measure Performance.
3.2 Need for measuring Performance
Measuring organizational performance can be considered as the formal, information-based routines and
procedures managers use to maintain or alter patterns in organizational activities (Simmons, 2000). Artley
and Stroh (2001) provide the following definition for performance measurement: “performance
measurement is the ongoing monitoring and reporting of program8 accomplishments, particularly progress
towards pre-established goals.”
Several authors have mentioned what the benefits are of measuring performance of organizations. In order
to get a complete view of the benefits, some of these authors will be referred to below:
� A typical performance measurement helps businesses in periodically setting business goals and then
providing feedback to managers on progress towards those goals. The time horizon for these goals
can typically be about a year or less for short-term goals or span several years for long-term goals
(Simmons, 2000).
� The purpose of measuring performance is providing (useful) information that leads to taking (the right)
decisions and proper management (van Aken & van Goubergen, 2000). It provides us with the
information necessary to make intelligent decisions about what we do.
� Kellen (2003) looks at the organization as a complex organism seeking to survive or thrive in its
competitive environment. From this point of view performance measurement serves as a key
contributor to the perceptual and coordination/ control capabilities of the organization. Organizations
use measurements not only to help monitor and control specific activities, but also to predict future
7 Source: http://dictionary.reference.com.
8 A “program” may be any activity, project, function, or policy that has an identifiable purpose or set of objectives.
14
internal and external states, to monitor state and behavior relative to its goals, to make decisions within
needed time frames and to alter the firm’s overall orientation and/ or behavior.
� Reviewing the performance of an organization is also an important step when formulating the direction
of the strategic activities. It is important to know where the strengths and weaknesses of the
organization lie, and as part of the ‘Plan –Do – Check – Act’ cycle (Deming’s cycle of continual
improvement), measurement plays a key role9:
− Identifying and tracking progress against organizational goals,
− Comparing performance against both internal and external standards,
− Identifying and prioritizing opportunities for performance increase.
The main reasons it is needed are:
− To ensure customer requirements have been met.
− To be able to set sensible organizational goals and objectives and comply with them.
− To provide standards for establishing comparisons.
− To provide visibility and a “scoreboard” for people to monitor their own performance level.
− To highlight quality problems and determine areas for priority attention.
− To provide feedback on how well we are doing for driving the improvement effort (Bititci et al.,
2002).
− To maximize the effectiveness of the improvement effort.
� In their report, Artley and Stroh (2001) refer to several sources which have provided the need for
Performance Measurement:
− One of the benefits is that it provides a structured approach for focusing on a program’s strategic
plan, goals, and performance. Another benefit is that measurement provides a mechanism for
reporting on program performance to upper management.
− Measurement focuses attention on what is to be accomplished and compels organizations to
concentrate time, resources, and energy on achievement of objectives. Measurement provides
feedback on progress toward objectives. If results differ from objectives, organizations can analyze
gaps in performance and make adjustments.
− Performance measurement improves the management and delivery of products and services. In a
world of diminishing resources, improving management of programs and services is critical.
− Performance measurement improves communications internally among employees, as well as
externally between the organization and its customers and stakeholders. A results-oriented
organization requires timely and accurate information on programs and supporting services,
whether at headquarters, field elements, or contractor locations. Collecting and processing
accurate information depends on the effective communication of mission-critical activities.
− Performance measurement helps justify programs and their costs.
− Measurement reduces emotionalism and encourages constructive problem solving. Measurement
provides concrete data on which to make sound business decisions, thus reducing the urge to
manage by “gut feeling” or intuition.
− Measurement increases one’s influence. Measurement identifies areas needing attention and
enables positive influence in that area. Also, employees “perform to the measurement,” an
example of how measurement influences employee performance.
− Improvement is impossible without measurement. If you don’t know where you are, then you can’t
know where you’re going and you certainly can’t get to where you want to be. It’s akin to traveling
in unknown territory without a compass or a map. You’re totally lost.
� Performance can be ascribed to corporations, business units, support or functional units, teams and
workgroups and individuals, both national and international (consequently, measuring performance
needs to provide insight into different units or levels of analysis). The key benefit of performance
measurement in this context lies in the ability to help align these different levels of analysis in the firm.
Many corporations consist of several business units or divisions that compete in different markets with
differing strategies. Corporate-wide measurement can help articulate the theory of the firm (why
different business units exist within the corporation) and improve overall performance by exploiting
9 Source: www.dti.gov.uk/quality/performance.

15
synergies between the business units (Kaplan and Norton, 2001). At the lowest level of analysis lies
measurement of human performance, for which the literature and examples are rich and long. In
between the business unit and the individual lay other layers, such as the functional or service group,
workgroup or team and the business activity. Performance Measurement often is designed to be a
vehicle for strategic dialog within the firms. Therefore, performance measures and scorecards
scattered horizontally and vertically across a corporation, need to be coherent so that the
conversations between people about the strategy is consistent and all the different measurement units
contribute to the performance of the corporation overall (Haas, de & Kleingeld, 1999).
Performance measurement has several benefits as indicated in this section. It is worthwhile to point out the
last one mentioned, e.g. performance can not only be ascribed to corporate level and/ or project level, but
also to business units and support or functional units. The key benefit of performance measurement in this
context lies in the ability to help align the different levels in the global CB&I Lummus company so that the
perception of the strategy is consistent and all the different offices contribute to the performance of the
corporation overall.
After reviewing these benefits it becomes obvious for companies to measure performance if they want to
manage their organization effectively. And when a company decides to measure their performance, it
needs to comply with some basic requirements, which are discussed in the next section.
3.3 Requirements for Performance Measurement
Performance Measurement should comply with some basic requirements in order to manage companies
effectively. The requirements (see Appendix D for the factors per requirement) are (Kellen, 2003):
1. Measuring performance should help the firm accurately perceive relevant internal and external
phenomenon. These include threats and opportunities, shortcomings in its ability to perceive
phenomenon as well as shortcomings in its ability to control its actions (breadth, depth, coherence and
predictability).
2. Measurement information needs to be delivered, processed and acted upon within the time frame
needed for market survival (latency: propagation and response).
3. Performance measurement must aid the decision-making process (provability, explainability,
believability, communicability).
4. Performance measurement needs to operate self-reflexively and largely below the threshold10
of the
firm's awareness (adaptability, measurability, autonomic).
3.4 Conclusions
In order to sustain a competitive advantage and therefore to survive as an organization, companies should
be capable of continuously improving their performance. If a company wants to improve its performance, it
will first have to measure what the current performance is. From that point on, the company can make
decisions in order to improve its performance in those areas where needed. So, the information gained
needs to be useful and therefore should encourage constructive problem solving and not only to provide
feedback to managers on progress towards pre-set goals. Simultaneously, measuring performance has
additional benefits (which enhance the need of it) and when a company decides to implement performance
measurement, some basic requirements need to be complied with (see section 3.3 above). The concept of
‘measurement frameworks’ will be introduced in chapter 5 in order to comply with the first requirement. The
second basic requirement will be divided in 2 parts: (1) the delivery and processing elements and (2) the
acting upon element. The first part will be discussed in the next chapter as part of criteria for ‘good’
indicators. The second part will be discussed in chapter 8. Chapter 8 will also cover the third and fourth
basic requirement as given in section 3.3.
Performance is measured by using measures, metrics or indicators; the next chapter will therefore further
discuss this by starting with a clear definition.
10
The point at which something begins to take effect or be noticeable (source: www.thefreedictionary.com).


16
4 KEY PERFORMANCE INDICATORS
As stated in the previous chapter, performance is measured by using measures, metrics or indicators. But,
what are measures, metrics or indicators? The fist section in this chapter will answer this. The second,
third and fourth sections will discuss criteria upon which to determine these measures, metrics or indicators
and how to design them. The usage of measures, metrics or indicators is not a new phenomenon. So,
what are the lessons learned from a historical point of view? The last section will answer this.
4.1 KPI Definition and Composition
Although measures, metrics or indicators are different terms, the usage and the purpose are the same.
When being referred to these terms in this thesis, all will have the same meaning. But to avoid any
confusion it is needed to set a clear definition. In literature the following definitions are used:
� Performance measures can be defined as a measuring point that gives a good indication of the
success or failure of a success determining factor or of the functioning of a process (Ahaus, 1999).
� Simmons (2000) defines a measure as a quantitative value that can be used for purposes of
comparison.
� Bititci et al. (2002) define performance measures as measurable characteristics of products, services,
processes and operations that an organization uses to track performance. They may address the type
or level of program activities conducted (process), the direct products and services delivered by a
program (outputs), and/ or the results of those products and services (outcomes).
� On corporate level organizations use Key Performance Indicators (KPI’s) or Corporate Performance
Measures. Key Performance Indicators are directly related to the organization’s strategy and are
critical for its successful execution of its strategy (Kellen, 2003).
The subject of this thesis is on Key Performance Indicators, which means that especially the latter
definition is relevant. But also the other definitions should be considered, which leads to the following
definition for Key Performance Indicators:
Key Performance Indicators are measurable characteristics of products, services, processes and
operations directly related to the organizations’ strategy, that give a good indication of the success (or
failure) of success determining factors that are critical for the execution of the organizations’ strategy.
Following Artley and Stroh (2001), KPI’s are composed of a number and a unit of measure:
� The number gives us a magnitude (how much); KPI’s are always tied to a goal or an objective (the
target). Since a measure is used for the purpose of comparison, it need not represent an absolute
value. For example, in measuring customer profitability, knowing the relative distance in profitability
between two customers may be as valuable (and more easily gotten) than knowing the absolute value
for a customer’s profitability. Moreover, many measures are normalized into a value that promotes
comparison not just with itself, but also with other measures.
� The unit of measure gives the number a meaning (what); KPI’s can be represented by single-
dimensional units like hours, meters, dollars, number of errors, number of certified employees, length
of design time, etc. They can show the variation in a process or deviation from design specifications.
Single-dimensional units of measure usually represent very basic and fundamental measures of some
process or product. More often, multidimensional units of measure are used. These measures are
expressed as ratios of two or more fundamental units. They may be units such as miles per gallon (a
KPI of fuel economy), number of accidents per million hours worked (a KPI or the companies safety
program), or number of on-time vendor deliveries per total number of vendor deliveries. KPI’s
expressed this way almost always convey more information than the single-dimensional or single-unit
KPI’s. Ideally, KPI’s should be expressed in units of measure that are the most meaningful to those
who must use or make decisions based on those measures. A specific KPI can be compared to itself
over time, compared with a preset target or evaluated along with other measures.

17
Also, when evaluating organizational performance, the number and unit of measure can apply to a specific
element or the relations between elements, see Figure 4-1. Artley and Stroh (2001) describe these
relations, based on the transformation within organizations:
� Effectiveness: a process characteristic indicating the degree to which the process output (work
product) conforms to requirements/ process outcome: are we doing the right things?
� Efficiency: a process characteristic indicating the degree to which the process produces the required
output at minimum resource cost/ process input: are we doing things right?
In this research, performance is measured by means of KPI’s and the definition given for KPI’s in this
section holds throughout the whole thesis. CB&I Lummus already used KPI’s to measure their
performance. There is nothing wrong with this, as long as the KPI’s are designed and used correctly.
Imagine an airplane’s instrument panel (dashboard) consisting of instrument dials and gauges. Like pilots
are able to process information from a large number of indicators to navigate their airplane, organizations
need instrumentation (KPI’s) about many aspects of their environment to keep track of their journey
towards excellent performance: the organization’s performance dashboard.
To start with, correctly is taking into account the different point of views from which KPI’s can be
approached. These views of KPI’s will be discussed in the next section. With this knowledge a basic set of
understanding will be created with regard to KPI’s and their categories.
4.2 Views on Key Performance Indicators
The first view on KPI’s is the Implication they have. The KPI’s are leading or lagging. Lagging measures
give feedback on past performance, such as last month’s profit, and typically do not provide insight into
future performance. Leading indicators, in contrast, are designed to measure future performance, and
more often than not, future financial performance. Some leading indicators to future performance might
include customer defection rate, customer satisfaction scores or changes in consumer confidence. Lagging
KPI’s without leading KPI’s do not communicate how the outcomes are to be achieved. They also do not
provide an early indication (warning) about whether the strategy is being implemented successfully and
whether strategic objectives are achieved. On the other hand, leading KPI’s without lagging KPI’s may
enable companies to achieve short-term operational improvements, but will fail to indicate whether the
operational improvements have been translated into long-term (strategic) objectives, and, eventually, to
enhanced financial performance.
An appropriate mix between lagging and leading KPI’s is necessary to include KPI’s which respectively
show outcomes, and KPI’s which show the performance drivers.
The second view is the Responsiveness of KPI’s. KPI’s are responsive or not responsive. Individuals can
directly influence responsive measures, whereas non-responsive measures are outside the direct influence
or control of an individual (such as consumer confidence).
An appropriate mix between responsive and non-responsive KPI’s is necessary to include KPI’s which
respectively are manageable internally, and KPI’s which act on the company externally. This represents
the actual environment companies operate in.
The third view is the Nature of KPI’s. KPI’s can refer to tangible (hard) things, often recorded in the chart of
accounts, such as inventory levels, accounts receivable balances, employee headcount, or can refer to
intangibles (soft) such as level of skill or knowledge, creativity and innovation.
An appropriate mix between tangible and intangible KPI’s is necessary, because decision-making is often
based on both hard and soft factors.
The fourth view is the Location in the processes (which are chains of logical arranged activities aimed at
achieving results). For CBI& Lummus the distinction can be made between the line organization process
and project organization process (actually, there is not a strict separation between these ‘organization’s’,
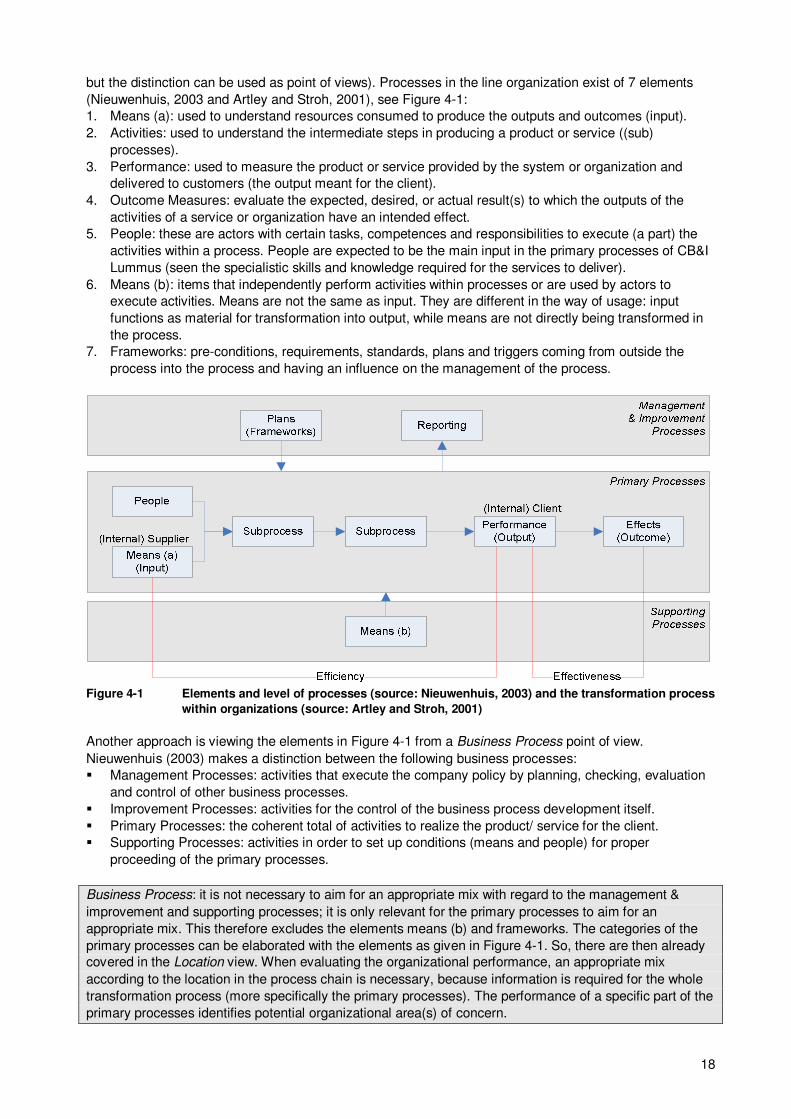
18
but the distinction can be used as point of views). Processes in the line organization exist of 7 elements
(Nieuwenhuis, 2003 and Artley and Stroh, 2001), see Figure 4-1:
1. Means (a): used to understand resources consumed to produce the outputs and outcomes (input).
2. Activities: used to understand the intermediate steps in producing a product or service ((sub)
processes).
3. Performance: used to measure the product or service provided by the system or organization and
delivered to customers (the output meant for the client).
4. Outcome Measures: evaluate the expected, desired, or actual result(s) to which the outputs of the
activities of a service or organization have an intended effect.
5. People: these are actors with certain tasks, competences and responsibilities to execute (a part) the
activities within a process. People are expected to be the main input in the primary processes of CB&I
Lummus (seen the specialistic skills and knowledge required for the services to deliver).
6. Means (b): items that independently perform activities within processes or are used by actors to
execute activities. Means are not the same as input. They are different in the way of usage: input
functions as material for transformation into output, while means are not directly being transformed in
the process.
7. Frameworks: pre-conditions, requirements, standards, plans and triggers coming from outside the
process into the process and having an influence on the management of the process.
Figure 4-1 Elements and level of processes (source: Nieuwenhuis, 2003) and the transformation process
within organizations (source: Artley and Stroh, 2001)
Another approach is viewing the elements in Figure 4-1 from a Business Process point of view.
Nieuwenhuis (2003) makes a distinction between the following business processes:
� Management Processes: activities that execute the company policy by planning, checking, evaluation
and control of other business processes.
� Improvement Processes: activities for the control of the business process development itself.
� Primary Processes: the coherent total of activities to realize the product/ service for the client.
� Supporting Processes: activities in order to set up conditions (means and people) for proper
proceeding of the primary processes.
Business Process: it is not necessary to aim for an appropriate mix with regard to the management &
improvement and supporting processes; it is only relevant for the primary processes to aim for an
appropriate mix. This therefore excludes the elements means (b) and frameworks. The categories of the
primary processes can be elaborated with the elements as given in Figure 4-1. So, there are then already
covered in the Location view. When evaluating the organizational performance, an appropriate mix
according to the location in the process chain is necessary, because information is required for the whole
transformation process (more specifically the primary processes). The performance of a specific part of the
primary processes identifies potential organizational area(s) of concern.

19
The best way to approach the project organizational processes is the lifetime of a project. Five key stages
in the project lifetime cycle have been identified by Blumenthall et al (2000), see also Figure 4-2:
1. Commit to Invest: the point at which the client decides in principle to invest in a project, sets out the
requirements in business terms and authorizes the project team (e.g. CB&I Lummus) to proceed with
the conceptual design.
2. Commit to Construct: the point at which the client authorizes the project team (e.g. CB&I Lummus) to
start the construction of the project.
3. Available for Use: the point at which the project is available for substantial occupancy or use. This may
be in advance of the completion of the project.
4. End of Defect Liability Period: the point at which the period within the construction contract during
which the contractor (e.g. CB&I Lummus) is obliged to rectify defects ends (often 12 months from point
C).
5. End of Lifetime of Project: the point at which the period over which the project is employed in its
original or near original purpose ends. As this is usually many years after the project’s completion, this
is a theoretical point over which concepts such as full life costs can be applied.
Figure 4-2 Key project stages (source: Blumenthall et al, 2000)
In the key stages identified by Blumenthall et al (2000) the emphasis is on execution of the project after it
has been awarded. However, a crucial stage prior to project execution is the bidding phase. CB&I Lummus
has acknowledged this stage in the work processes and has also elaborated more on the project execution
stages in the project lifetime, see Figure 4-3.

20
Figure 4-3 CB&I Lummus’ project stages (source: Company Management Manual (2007), modified by
author)
The fifth view is the Level of Management in an organization (De Leeuw, 1990). There are various levels
and each level in an organization has its own (management) tasks that follow from the level of complexity
and focus. These levels are:
I. Strategic: management of those aspects which are crucial for the continuity of the organization.
II. Tactical: the total of organizational and structuralizational tasks.
III. Operational: the total of management tasks for proper proceeding of the daily routine.
As mentioned earlier, KPI’s are directly related to the organization’s strategy. The emphasis will therefore
be on measurement on (I) strategic level. Although the (II) tactical (departmental) level is important, it will
not be taken into account in this research. It should be subjected for additional research or assigned to the
departments. On (III) operational level, project execution is crucial. When evaluating the organizational
performance, a balance is therefore also necessary according to the location in project execution, because
information is required for the whole project lifetime cycle. In order to cover the whole range of the project
lifetime cycle, additional research is recommended (except for the ‘Lifetime of Project’ stage, as CB&I
Lummus stops at the ‘End of Defects Liability Period’, see Figure 4-2).
A recapitulation of the views on KPI’s which require an appropriate mix is given in Table 4-1.
View Categories
1. Implication Leading (future), Lagging (past)
2. Responsiveness Responsive, Non-Responsive
3. Nature Tangible, Intangible
4. Location Input, People, (sub)Process, Output, Outcome
Table 4-1 List of the views on Indicators
Allocating KPI’s to all categories per view will create a balanced set of KPI’s, which is crucial if an
organization aims to cover all important aspects. The categories of these views will be used later in this
research for the allocation of KPI’s.

21
In the designing process of the KPI’s it is also important to obtain knowledge with regard to when a KPI
can be considered to be “good”, which will increase the functionality of the KPI’s. This will be discussed in
the next section.
4.3 “Good” Indicators
When working with performance indicators, companies should apply well-designed indicators. But what is
a well-designed (‘good’) performance indicator? A common used set of criteria is designed by Drucker
(1954)11
, for which he extensively elaborated the concept of Management by Objectives. In this concept
the SMART criteria are introduced:
� Specific
� Measurable
� Achievable
� Relevant
� Time framed
Also, Aalberts et al (1999), introduce validity and reliability which can be used complementary to the
SMART criteria. They define these 2 criteria as:
� Validity: a performance indicator can be considered valid if it actually represents the reality that it is
assumed to measure (do I really measure what I think to measure?)
� Reliability: a performance indicator can be considered reliable if there are sufficient guarantees that the
measurement has been executed accurately, objectively and is auditable (could I find out what I think
to know now?).
These 7 criteria will be used as a checklist in the process of determining the KPI’s for measuring
performance. Besides these criteria, there is also the need for knowledge in order to design these KPI’s
pragmatically and in a structured way. For this purpose, the next section will introduce the Performance
Measure Record Sheet.
4.4 The Performance Measure Record Sheet
In their working paper, Neely et al. (1997) seek to answer the following question: what are the prescribing
criteria for designing effective indicators? In order to discuss this they have introduced the Performance
Measure Record Sheet (PMRS) that is based on an extensive review of the performance measurement
literature. Also, the PMRS was tested through a series of action research studies and to date has been
used successfully implemented by over 200 managers from 50 different types of companies.
The literature review and implementations has enabled Neely et al. (1997) to summarize 22
recommendations see Appendix E. The PMRS consists of ten elements of which the rationale and their
relationship to the recommendations above are explained below:
1. Measure (recommendations 2, 9, 21); the title of the measure should be clear. A good title is one that
explains what the measure is and why it is important. It should be self-explanatory and not include
functionally specific jargon.
2. Purpose (recommendations 7, 14): if a measure has no purpose then one can question whether it
should be introduced. Hence the rationale underlying the measure has to be specified.
3. Relates to (recommendations 1, 6, 7, 11): as with purpose, if the measure being considered does not
relate to any of the business objectives then one can question whether the measure should be
introduced. Hence the business objectives to which the measure relates should be identified.
4. Target (recommendations 4, 6, 7, 8, 11, 14, 20): the objectives of any business are a function of the
requirements of its owners and customers. The levels of performance the business needs to achieve
to satisfy these objectives are dependent on how good its competitors are. Without knowledge of how
good the competition is, and an explicit target, which specifies the level of performance to be achieved
and a time scale for achieving it, it is impossible to assess whether performance is improving rapidly
enough and hence whether the business is likely to be able to compete in the medium to long term. An
11
Source: http://www.rapidbi.com.

22
appropriate target for each measure should therefore be recorded (this enhances the internal and
external benchmark function).
5. Formula (recommendations 2, 4, 5, 9, 15, 16, 19, 21, 22): this is one of the most challenging elements
to specify because the formula – the way performance is measured – affects how people behave.
6. Frequency (recommendations 3, 12, 13, 18, 20): the frequency with which performance should be
recorded and reported is a function of the importance of the measure and the volume of data available.
7. Who measures (recommendations 4, 17): the person who is to collect and report the data should be
identified.
8. Source of data (recommendations 15, 16, 17, 18, 19, 21): the source of the raw data should be
specified. The importance of this question lies in the fact that a consistent source of data is vital if
performance is to be compared over time.
9. Who acts on the data (recommendations 4, 6, 10, 20): the person who is to act on the data should be
identified.
10. What do they do (recommendations 4, 6, 10, 20): this is probably the most important element
contained on the performance measure record sheet, not because it contains the most important
information, but because it makes explicit the fact that unless the management loop is closed, there is
no point in having the measure. It is not always possible to detail the action that will be taken if
performance proves to be either acceptable or unacceptable, as this is often context specific. It is,
however, always possible to define in general the management process that will be followed should
performance appear to be either acceptable or unacceptable.
The PMRS is valuable because it facilitates and can function as a practical guide for the design and
elaboration of performance indicators. Every KPI will be elaborated by means of this sheet. The record
sheet can also be valuable in the learning process as it provides a reference which can be used to explore
what constitutes a well-designed performance measure.
KPI’s are already for many years part of organization’s management. As with every concept, lessons are
learned throughout the years. The next section will discuss this and also what the path forward will be to
measure performance in a more effective way.
4.5 KPI’s: Lessons Learned
Historically, companies applied performance measurement based on financial performance for internal
guidance, as the investors of companies (and regulators) emphasized the use of financial measures. They
have always measured performance on operational level or, if applied on corporate level, on only
traditional financial (accounting) measures of past performance, be this success by profit, failure through
liquidation, operating margin or return on investments. On of the most prominent financial KPI is Economic
Value Added (EVA). Developed by the Stern Stewart Corporation as an overall measure of financial
performance, EVA is both a specific performance measure and the basis for a larger performance
measurement framework (Otley, 2002). EVA is a financial performance metric that is most directly linked to
the creation of shareholder value, over time (Kellen, 2003). EVA is net operating profit less an appropriate
charge for the opportunity cost of all capital invested in an enterprise. In other words, EVA is profit the way
shareholders define it. Mathematically it is:
EVA = Net Operating Profit After Taxes – Capital Charges
EVA helps managers incorporate two basic principles of finance into their decision making. The first is that
the primary financial objective of any company should be to maximize the wealth of its shareholders. The
second is that the value of a company depends on the extent to which investors expect future profits to
exceed or fall short of the cost of capital. By definition, a sustained increase in EVA will bring an increase
in the market value of a company.
But in the current business environment, financial performance indicators (solely) are not sufficient. From
different sources, the following reasons are given (Neely et al. (1997), Artley and Stroh (2001), Zairi
(1994), The Boston Consulting Group (1991) and van Aken & van Goubergen (2000)):

23
� Provide little information to support organizations on their quality journey, because they do not map
process performance and improvements seen by the customer and other stakeholders. Management
often wants to focus measurement only on an organization’s internal components and processes. That
way they can “command and control” it. However, in an organization that has to maintain
competitiveness, it has become evident that performance will be measured by the improvements seen
externally by the customer as well as by the results delivered to other stakeholders, such as the
shareholders. This has necessitated a shift of emphasis from financial figures to a broader perspective
because business competition is now on the basis of product quality, delivery, reliability, after sales
services, competitive capabilities and customer satisfaction;
� Are generally outcomes of what happened in a business process, the focus is then on bottom-line
results. In this case they cannot fully explain what happened in the process in order to form a basis for
future actions. They are not capable of explaining what is happening because they are final outcomes
of the business process, nor are they a position of forecasting what the organization is going to do in
the future. These traditional measures have not been linked to the process where the value- adding
activities take place. A continuous feedback to the process for improvement has been lacking, thus
providing little motivation to support attempts to introduce continuous improvement programs because
of their inability to map process performance. Many in the performance measurement arena call this
“driving through the rear-view mirror.” The focus is not on where you’re going, only on where you have
been. And, if you’re driving through the rearview mirror, you won’t see the large hole in the road until
you’ve driven right into it. So, the critical things that impact the results should be measured, not just the
results themselves;
� Were sufficient in an Industrial environment where investments in long-term capabilities and customer
relationships were not critical for success. With the emergence of the Information era and competitive
(international) environments, value drivers for long-term competitive performance became necessary.
� Are not manageable, whereas non-financial Indicators are manageable;
� Fail to define performance operationally;
� Fail to expose poor performance which disables the introduction of tighter management controls;
� The absence of approaches to assist decision maker to understand, organize and use the large and
complex amount of information to manage organizational performance and guide the measurement
process.
� The imbalance with regard to the different aspects of performance of the organization (data tunnel
vision). Management and/ or stakeholders focus only on one piece or area of measurement data on
which to base their decisions, completely forgetting about the consequences of doing so (sub-
optimization). Focusing on only revenue, could lead to compromising employee and public safety,
jeopardizing client health, and dissatisfying the client. Also, exceptional financial performance could be
disastrous in another and/ or often at the expense of overall business goals.
The main point made in the discussion above is that in measuring performance a broader point of view is
needed and that many factors in performance measurement are related. For example, with regard to EVA,
this concept can function as part of a larger performance measurement model by including it as a financial
indicator.
4.6 Conclusions
The most crucial characteristic of KPI’s is its relation with the organizations’ strategy (and consequently
mission and vision). This characteristic needs to be considered throughout the continuation of this
research.
Key Performance Indicators can be approached from different point of views. In this chapter the common
views used in literature have been reviewed. This knowledge about Key Performance Indicators should be
taken into account in the process of determination of KPI’s. Another, at first sight obvious aspect of
indicators is that they should be ‘good’. Several authors have discussed this, which resulted in a checklist
for ‘good’ by means of criteria. For the guidance of structuring and presenting the KPI’s consistently, the
PMRS is assigned. The knowledge of all these design-oriented aspects of KPI’s will be helpful to ensure
successful implementation and execution of KPI’s.

24
The lessons learned discussed in this chapter, enhanced by the arguments in chapter 3, emerge that in
measuring performance of organizations several aspects have to be taken into account, which are all
related and can not be separated (KPI’s are not on them selves, but are part of a broader context). This
leads to the conclusion that corporate performance measures should be approached in a more holistic12
way, in stead of randomly defining KPI’s. This holistic approach enables the analysis from a higher
abstraction level, of which the next chapter will discuss the possibilities.
12
Emphasizing the importance of the whole and the interdependence of its parts (source: www.thefreedictionary.com)
/ consisting of entities which can be considered to be autonomously as well as depending parts of even more larger
entities (Eijnatten et al., 2002).

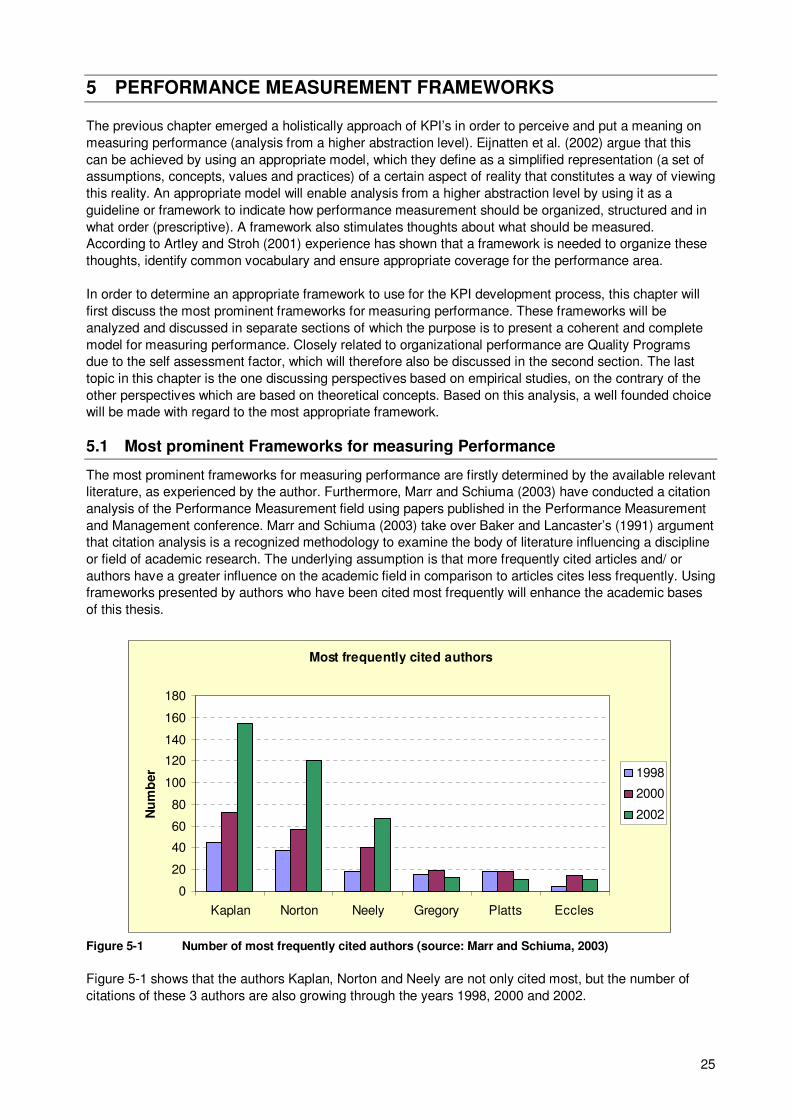
25
5 PERFORMANCE MEASUREMENT FRAMEWORKS
The previous chapter emerged a holistically approach of KPI’s in order to perceive and put a meaning on
measuring performance (analysis from a higher abstraction level). Eijnatten et al. (2002) argue that this
can be achieved by using an appropriate model, which they define as a simplified representation (a set of
assumptions, concepts, values and practices) of a certain aspect of reality that constitutes a way of viewing
this reality. An appropriate model will enable analysis from a higher abstraction level by using it as a
guideline or framework to indicate how performance measurement should be organized, structured and in
what order (prescriptive). A framework also stimulates thoughts about what should be measured.
According to Artley and Stroh (2001) experience has shown that a framework is needed to organize these
thoughts, identify common vocabulary and ensure appropriate coverage for the performance area.
In order to determine an appropriate framework to use for the KPI development process, this chapter will
first discuss the most prominent frameworks for measuring performance. These frameworks will be
analyzed and discussed in separate sections of which the purpose is to present a coherent and complete
model for measuring performance. Closely related to organizational performance are Quality Programs
due to the self assessment factor, which will therefore also be discussed in the second section. The last
topic in this chapter is the one discussing perspectives based on empirical studies, on the contrary of the
other perspectives which are based on theoretical concepts. Based on this analysis, a well founded choice
will be made with regard to the most appropriate framework.
5.1 Most prominent Frameworks for measuring Performance
The most prominent frameworks for measuring performance are firstly determined by the available relevant
literature, as experienced by the author. Furthermore, Marr and Schiuma (2003) have conducted a citation
analysis of the Performance Measurement field using papers published in the Performance Measurement
and Management conference. Marr and Schiuma (2003) take over Baker and Lancaster’s (1991) argument
that citation analysis is a recognized methodology to examine the body of literature influencing a discipline
or field of academic research. The underlying assumption is that more frequently cited articles and/ or
authors have a greater influence on the academic field in comparison to articles cites less frequently. Using
frameworks presented by authors who have been cited most frequently will enhance the academic bases
of this thesis.
Most frequently cited authors
0
20
40
60
80
100
120
140
160
180
Kaplan Norton Neely Gregory Platts Eccles
Nu
mb
er 1998
2000
2002
Figure 5-1 Number of most frequently cited authors (source: Marr and Schiuma, 2003)
Figure 5-1 shows that the authors Kaplan, Norton and Neely are not only cited most, but the number of
citations of these 3 authors are also growing through the years 1998, 2000 and 2002.

26
Analyzing the work of Marr and Schiuma (2003) from a slightly different point of view shows that almost
75% of all papers quoted Kaplan and Norton, followed by Neely with a citation percentage of 18% of all
papers (see Figure 5-2). The other authors can be neglected in this comparison due to the minor number
of citations.
Most frequently cited authors in 2002
41%
32%
18%
3% 3% 3%Kaplan
Norton
Neely
Gregory
Platts
Eccles
Figure 5-2 Percentage of most frequently cited authors in 2002 (source: Marr and Schiuma, 2003)
Based on the arguments above (citation analysis) and the author’s literature study, the next sections will
discuss works of Kaplan and Norton, the Balanced Scorecard (BSC) and the Strategy Map, and Neely’s
Performance Prism.
5.1.1 Balanced Scorecard (BSC)
The Balance Scorecard (BSC), proposed by Kaplan and Norton, translates a company’s vision, mission
and strategy into a coherent set of performance measures.
Initially focused on finding a way to report on leading indicators (the performance drivers) of a business’s
health rather than traditional accounting measures which are lagging indicators (the outcomes), the
balanced scored was refocused to measure the firm’s strategy. Instead of measuring anything, firms
should measure those things that directly relate to the firm’s strategy (Kaplan & Norton, 2001). This thesis
is on KPI’s, which are used on corporate level. As mentioned earlier KPI’s are measurable characteristics
of products, services, processes and operations directly related to the organizations’ strategy, that gives a
good indication of the success (or failure) of success determining factors that are critical for the successful
execution of the organizations’ strategy.
The ultimate purpose of KPI’s can be considered to be to check whether what the organization is doing is
going well or not, in other words: is the strategy being implemented effectively? Consequently, the
framework used to measure performance should be based on the organization’s strategy. Also mentioned
in section 1.2, the current KPI’s of CB&I Lummus do not capture all aspects related to the business
strategy, consequently Company Management can not determine to what extent the company strategy is
sufficient for the organizational goals. This adds weight to the argument that frameworks used to measure
performance should be based on the organizations’ strategy.
The BSC consists of four perspectives which permit a balance between (1) short- and long-term objectives,
between (2) outcomes desired and the performance drivers of those outcomes, and between (3) hard
objectives measures and softer, more subjective measures. The balanced scorecard proposes a holistic
view of the organization by integrating four perspectives of performance: financial, customer, internal
business process, and learning & growth (Kaplan and Norton, 1996). These perspectives are based on
four strategies related to corporate performance and provide answers to four basic questions about
corporate performance:

27
Perspective Strategy Main Question
Financial Growth, profitability and risk from the shareholder’s perspective
What financial performance must be delivered to investors or the owners to meet their expectations and to survive as ongoing concern?
Customer Creating value and differentiation from the perspective of the customer
On which critical factors do customers judge us?
Internal Business Process
Priorities for various business processes that create customer and shareholder satisfaction
To satisfy our shareholders and customers, what business processes must we excel at?
Learning and Growth
The priorities to create a climate that supports organizational change, innovation and growth
What do we have to do to continually innovate and add value to the overall operations?
Table 5-1 The 4 perspectives of the BSC including the corresponding strategy and main question
The goals from the financial perspective tend to be the ones that are the most lagged in a cause-and-effect
relationship amongst the four perspectives. If one were to monitor strategic goal performance only by
evaluating progress against financial goals, it would be too late in the game (these are results of past
business activities). The drivers of financial goal achievement are actually the goals from the other three
perspectives. Financial goal achievement maybe the ultimate desired outcome, but it is critical that a
balanced set of goals is developed that are linked to each other and ultimately the financial goals. Ideally,
one should be able to state how each customer, internal process or learning and growth goal will lead,
directly or indirectly, to achieving a financial goal. A set of financial goals would typically begin by targeting
rates of revenue growth in the company’s product or service lines of business. They would also include
long term improvement in profit margins or cost related areas for the lines of business. Establishing and
achieving goals in the remaining perspectives (customer, internal process, learning and growth) is where
the business game is really won or lost (Kali, 2003). Again, achieving these goals should lead or cause the
achievement of the lagged financial goals. Valid measurement is demonstrated by the cause and effect
linkage that is established amongst the balanced set of performance measurement goals.
The checklist for goals from the customer perspective concerns current business activities and includes
those goals related to improving customer acquisition and retention, increasing market share,
understanding customer needs, selling the optimum product mix, improving customer satisfaction and
company reputation, and increasing customer profitability.
The typical checklist for goals related to internal process concerns also current business activities and
includes improving employee productivity, reducing process cycle times, reducing product or service cost,
reducing inventory levels, and increasing service response times.
Goals established for the final perspective, namely learning and growth, are usually the most leading of the
four perspectives and possibly the most effective drivers of long term results (business activities aimed at
the future). Because they have largely intangible13
benefits that are not immediately apparent, these goals
are the most difficult to justify investing time and money in achieving. These goals have to do with
advancing the company’s intellectual assets and may begin with simply better training to upgrade the
competency of staff employees. Recognizing and rewarding employees for innovative contributions as well
as retention and motivation of key contributors to making the company more competitive are all strategies
in this perspective to be considered (Kali, 2003).
Over all, the BSC determines the knowledge, skills and systems that the employees will need (learning and
growth) to innovate and build the right strategic capabilities and efficiencies (the internal processes) that
deliver specific value to the market (the customers), which will eventually lead to higher shareholder value
(the financials). Kaplan and Norton elaborated this concept by introducing the Strategy Map, which is
discussed in the next section.
13
Something that cannot be seen or physically touched (source: www.investorwords.com).

28
5.1.2 Strategy Map
According to Kaplan and Norton (1996), strategy is a set of hypothesis about cause-and-effect. As
mentioned in section 5.1.1 above, properly constructed scorecards should reveal the business unit’s
strategy through such a sequence of cause-and-effect relationships, because measures without linkage
are useless and they’re not going anywhere. “Every measure selected for a BSC should be an element of
a chain of cause-and-effect relationships that communicates the meaning of the business unit’s strategy to
the organization.” Kaplan and Norton (2000) visualize this chain with the Strategy Map.
A Strategy Map is a diagram that describes how an organization will convert its initiatives and resources
(including intangible assets), by connecting strategic objectives in explicit cause-and-effect relationship
with each other in the four BSC perspectives, into tangible outcomes in order to drive organizational
performance. The Strategy Map is the link between the strategy on the one hand and the measurable
indicators and tangible actions in line with the strategy on the other hand (Kerklaan, 2006).
The Strategy Map should be built from the top and cascading down into the organization (horizontal and
vertical linkage) by starting with the destination and then charting the routes that will lead there. Typically
the Strategy Map starts with a financial strategy for increasing shareholder value (Kaplan and Norton,
2000).
Financial Perspective: companies have two basic goals for the financial strategy: (1) revenue growth and
(2) productivity/ efficiency. Revenue growth generally has two components: (a) value from new markets,
new products and new customers and (b) increase value to existing customers by deepening relationships
with them through expanded sales. Productivity/ efficiency usually also has two parts: (c) improve the
company’s cost structure by reducing direct and indirect expenses and (d) use assets more efficiently by
reducing the working and fixed capital needed to support a given level of business.
Customer Perspective: this perspective starts with the selection of the customer segments on which the
organization wants to aim at (the strategy of the company should contain a description of these specific
customer segments). This perspective contains the core of any business strategy, the customer value
proposition. The customer value proposition describes the unique mix of product and service attributes,
customer relations and corporate image that a company offers. It defines how the organization will
differentiate itself from competitors to attract, retain and deepen relationships with targeted customers.
Internal Process Perspective: once an organization has a clear picture of its customer and financial
perspectives, it can then determinate the means by which it will achieve the differentiated value proposition
for customers and the productivity improvements to reach its financial objectives. The internal process
perspective captures these critical organizational activities, which fall into four high-level processes: (1)
innovation with new products and services and by penetrating new markets and customer segments; (2)
increase customer value by deepening relationships with existing customers; (3) achieve operational
excellence by improving supply chain management, the cost, quality and cycle time of internal processes,
asset utilization and capacity management; (4) become a good corporate citizen by establishing effective
relationships with external stakeholders.
Learning & Growth Perspective: the foundation of any Strategy Map is the learning & growth perspective,
which defines the core competencies and skills (human capital), the technologies (information capital) and
the corporate culture (organization capital) needed to support an organization’s strategy. These objectives
enable a company to align its human resources and information technology with its strategy. Specifically,
the organization must determine how it will satisfy the requirements from critical internal processes, the
differentiated value proposition and customer relationships.
The company’s strategy map should be kept on the strategic level - it is not supposed to illustrate how
everyone’s job is linked to the strategy (Markus, 2004). The strategy map can help a company to find out
whether there are gaps between the strategy and actions to implement the strategy and strategic goals.

29
Overall, the financial objectives can only be achieved and sustained through satisfying customers, which
can only be achieved through effective and efficient processes. In addition, efficiency of processes also
contributes directly towards financial objectives. The efficiency and effectiveness of the internal business
processes can only be improved through development of competencies and capabilities of the
organizations internal resources.
Literature regarding the Strategy Map clearly describes what the concept of it is and what the main issues
are per perspective. However, not much attention is dedicated to the interpretation of these main issues. In
other words, literature does not elaborate on how to retrieve and/ or define those factors that really matter
for individual organizations, e.g. that give a good indication of the success (or failure) of success
determining factors that are critical for the execution of that specific organizations’ strategy. Therefore it is
not possible to design the Strategy Map for an organization on the level of the possible factors other than
indicated in the standard model as presented by Kaplan and Norton. A solution of this shortcoming is
making use of Critical Success Factors. Another shortcoming, which is acknowledged by the authors of the
Strategy Map, is the content of the Learning & Growth perspective. Both shortcomings are discussed in the
next sub-sections.
5.1.2.1 Intangible Assets
This section discusses the first shortcoming, addressed by the author, with regard to the Strategy Map. In
Kaplan and Norton’s publication in 2000 they state that the learning & growth perspective defines the core
competencies and skills, the technologies and the corporate culture that are needed to support an
organization’s strategy. Unfortunately, this definition did not enable organizations to apply the learning &
growth perspective successfully, as admitted by Kaplan and Norton (2004). Therefore Kaplan and Norton
(2004) state, in their most recent publication, that the learning and growth perspective consists of the
following intangible assets: (1) Human Capital, (2) Information Capital and (3) Organization Capital.
But Adams and Marr (2004) state that Kaplan and Norton do not acknowledge the collective wisdom that
has been developed and published on the subject of intangible assets. Due to the fact that there are many
definitions of what intangible assets are, the author refers to a publication of Marr et al. (2004). They
provide, based on extensive literature review, a classification of organizational assets. These assets
contain all aspects related to the learning & growth perspective. The organizational assets are included in
Table 5-2.
Organizational Asset Description
Financial assets Money, as one of the invisible assets of an organization, is in fact a necessary input as well as an output of operations in form of cash flow.
Physical assets Comprise all tangible infrastructure assets, such as structural layout and information and communication technology. It includes databases, servers, and physical networks like intranets.
Relationship assets The relationship between an organization and its external stakeholders as well as in the exchange of knowledge between them.
Human assets Include employee’s skills, competences, commitment, motivation and loyalty.
Culture assets Provide employees with a shared framework to interpret events; a framework that encourages individuals to operate both as an autonomous entity and as a team in order to achieve the company’s objectives.
Practices and routines as assets Determine how processes are being handled and how work flows through the organization.
Intellectual property assets The tools and enablers that allow a company to gain a protected competitive advantage.
Table 5-2 Description of the organizational assets according to Marr et al. (2004)

30
To cope with the shortcoming in this sub-section, the author has adjusted the Learning & Growth
perspective in the Strategy Map as included in Figure 5-3. Also, taking into account that the EPC
Contracting business is based on service, rather than products, the Human assets should be emphasized
within this perspective. The Human assets have been emphasized by firstly treating it as a separate topic
in the interviews (see Appendix C) and secondly by elaborating on possible aspects which are valued by
the employees of CB&I Lummus in section 6.3.
Improve Shareholder Value
Value from new
Products and
Customers
Increase
Customer Value
Improve Cost
Structure
Improve Use of
Assets
Revenue Growth Productivity
FINANCIAL
PERSPECTIVE
Product/ Service
AttributesRelationship
CUSTOMER
PERSPECTIVE
The drivers of
shareholder
value
The
differentiating
value proposition
Image
INTERNAL
PROCESS
PERSPECTIVE
How value is
created and
sustained
Innovate:
processes that create
new products and
services
Increase Customer
Value:
customer
management
processes
Achieve Operational
Excellence:
operations and
logistics processes
Be a Good
Neighbour:
regulatory &
environmental
processes
LEARNING &
GROWTH
PERSPECTIVE
Role for
intangible assets:
people, systems
and organization
Financial Physical Relationship Human
CulturePractices and
Routines
Intellectual
Property
Figure 5-3 The Strategy Map (source: Kaplan and Norton (2000/ 2004), modified by author)
5.1.2.2 Critical Success Factors (CSF’s)
As already stated, the second shortcoming is the translation of the main issues of the Strategy Map into
company specific factors. These company specific factors should determine whether the strategy is
effective by (not) realizing the set objectives. This information is provided by Critical Success Factors
(CSF’s). CSF’s define key areas of performance that are essential for the organization to accomplish its
mission (Caralli, 2004). The CSF’s are therefore essential for the achievement of the set objectives,
derived from the strategy. They are a limited number of factors that, if evaluated with satisfactory results,
will ensure a successful competitive performance for the organization (factors that really can make the
difference between business success and failure). Related to organizational goals, these factors are the
few key areas of activity in which favorable results are absolutely necessary for managers to reach their
goals. They are also factors on the bases of which an organization can distinguish itself from the
competition in order to establish a sustainable, positive relation with the market (Vrisou van Eck, 2003). An
example of a CSF is the training of staff, which can be measured with the KPI: average number of training
hours per employee.
These factors are also referred to as Value Drivers. Bourne et al. (2003) have evaluated the best practices
in performance measurement and state that there is a growing trend towards managing performance
improvement through focusing on the value drivers. Marr et al. (2004) state that organizations perform well

31
and create value when they implement strategies that respond to market opportunities by exploiting their
internal resources and capabilities. Therefore, managers need to understand what the key resources and
drivers of performance and value in their organizations are.
By defining a few numbers of key areas, CSF’s are limited. But they should not measure too little, because
this would disable effective decision making. On the other hand, too much data results in ‘information
overload’, what can be so much that managers and employees either will ignore the data or use it
ineffectively.
For each CSF’s it is possible to develop one or more KPI’s to inform what the status is of that specific CSF;
from this point of view KPI’s are measurable translations of a specific CSF.
Taking CSF’s as a starting point in performance measurement, enables the company to first analyze what
they want to measure and then how they want to measure it (by allocating KPI’s to the CSF’s).
Rockart and Bullen (1981) have introduced the concept of CSF’s. They define five specific sources or
types of CSF’s for an organization:
1. Industry CSF’s: every organization inherits a particular set of operating conditions and challenges that
are inherent to the industry (or segment of the industry) in which it chose to do business. This results in
a unique set of CSF’s that organizations in a particular industry must achieve to maintain or increase
their competitive positions, achieve their goals, and accomplish their missions.
2. Competitive Position or Peer CSF’s: peer-group CSF’s are a further delineation of industry-based
CSF’s. They define those CSF’s that are specific to the organization’s unique position relative to their
peer group in the industry in which they operate or compete.
3. Environmental CSF’s: environmental CSF’s reflect the environmental factors over which the
organization has very little control or ability to actively manage. By making these factors explicit, the
organization can at least be mindful of them and actively monitor their performance relative to them.
4. Temporal CSF’s: temporary conditions or situations can result in temporal CSF’s. These are areas in
which the organization must temporarily perform satisfactorily in order to ensure that its ability to
accomplish its mission is not impeded.
5. Management Position CSF’s: managers have different focuses and priorities depending on the layer of
management in which they operate. This translates into a set of CSF’s that reflect the type of
responsibilities required by the manager’s position in the organization. In fact, the CSF’s that are
inherent to the level of management may be universal across different organizations in the same
industry.
These 5 sources/ types of CSF’s indicated above should be considered as background information when
determining the CSF’s. They do not add value to the Strategy Map with regard to the point of view
(perspectives); the contribution of CSF’s is the concept that by determining those factors that really matter
for individual organizations, a specific interpretation can be given to the Strategy Map for that organization.
The CSF’s should primarily comply with the following criteria:
� Both observable and measurable in certain respects such that it would be easier to focus on these
factors.
� Actuality, i.e. having the largest impact on an organization’s performance (the criticality of success
factors).
The secondary focus of CSF’s should be on the following criteria:
� Essential for the organization to accomplish its mission.
� Essential for the achievement of the set organizational objectives.
� Be the bases of which an organization can distinguish itself from the competition.
� Enabling a sustainable, positive relation with the market.
� Not only aimed at organizational bottlenecks.
� Focused on the future by formulating in results terms (improvement): this is not really a focus of CSF’s,
but more a formulation rule which will be taken into account later in this study.

32
It can be acknowledged that the Strategy Map adds value to the BSC by making the cause-and-effect
relationships explicit and by visualization of it in a diagram. In order to increase the effectiveness of the
Strategy Map the following issues should be taken into account:
1. Improvement of the Learning & Growth perspective,
2. Introduction of CSF’s in order to elaborate the Strategy Map for a specific organization.
Besides the works of Kaplan and Norton (the BSC and the Strategy Map), Neely’s Performance Prism can
be considered to be prominent in the field of Performance Measurement. This framework will be discussed
in the next section.
5.1.3 Performance Prism
Neely and his colleagues (2002) introduced the Performance Prism in order to satisfy the demand for a
multi faceted, yet highly adaptable framework which will address the needs for performance measurement
within the new competitive environment of the 21st century. Where the BSC derives its measures from the
company strategy, the Performance Prism is based on the assumption that although the strategy is
undoubtedly of value, they are not the end goal. In this framework the first and fundamental perspective on
performance is the stakeholder perspective. This measurement framework is built around five interrelated
perspectives on performance, see Figure 5-4.
Figure 5-4 The 5 dimensions of the Performance Prism (source: Neely, 2002)
The five perspectives all pose specific vital questions, as stated in Table 5-3.
Perspective Vital Question
Stakeholder Satisfaction Who are the key stakeholders and what do they want and need?
Strategies What strategies do we have to put in place to satisfy the wants and needs of these key stakeholders?
Processes What critical processes do we require if we are to execute these strategies?
Capabilities What capabilities do we need to operate and enhance these processes?
Stakeholder Contribution What contributions do we require from our stakeholders if we are to maintain and develop these capabilities?
Table 5-3 The 5 perspectives of the Performance Prism (Neely, 2002)

33
Neely et al. (2002) have identified the following set of stakeholders in the model:
1. Investors
2. Customers
3. Regulators
4. Suppliers
5. Employees
Overall, this framework provides a balanced picture of the business (Neely, 2002) highlighting external
(stakeholder) and internal (strategy, process and capability) measures, as well as integrating financial and
non-financial measures.
As mentioned above, the fundamental perspective on performance of the Performance Prism is the
stakeholder perspective. For the context of EPC Contractors, regulators will not have an influence of
significance. The other 4 stakeholders can easily be integrated into the Strategy Map with regard to what
they want and need:
� Investors’ wants and needs correspond with the Strategy Map’s financial perspective
� Customers’ wants and needs correspond with the Strategy Map’s customer perspective
� Suppliers’ wants and needs correspond with the Strategy Map’s internal process perspective
� Employees’ wants and needs correspond with the Strategy Map’s Learning & Growth perspective
With regard to the other perspective of the Performance Prism, these do not add value compared to the
Strategy Map.
Organizational performance is closely related to Quality Programs due to the self assessment factor of
these Programs. This chapter will therefore also discuss in the next section the EFQM Business
Excellence Model and the Malcolm Baldrige National Quality Program, self-assessment frameworks
related to the way of managing business excellently.
5.2 Quality Programs
The BSC, for example, can be best described as a framework directly related to performance
(prescriptive14
). However, in the past years several Quality Programs have been developed where the
emphasis is on self-assessment related to the way of managing business excellently (non-prescriptive).
The most prominent programs are the EFQM Business Excellence Model and the Malcolm Baldrige
National Quality Program (MBNQP).
5.2.1 EFQM Business Excellence Model
The Business Excellence Model (BEM), developed by the European Foundation for Quality Management
(EFQM), is a non-prescriptive framework based on nine criteria that can be used to assess an
organization’s progress towards Business Excellence (see also Figure 5-5).
14
Related to giving directives or rules (source: www.thefreedictionary.com) / outlines how reality could be represented
(Eijnatten, van et al., 2002).

34
Figure 5-5 The EFQM model for Business Excellence (source: www.efqm.org)
This model is not designed as a performance measurement framework, but it gives many insights that
affect performance measurement (Neely, 2002). The model is a broad management model that explicitly
highlights the enablers of performance improvement and indicates result areas that should be measured
(Neely, 2002). The Enablers are concerned with how the organization undertakes key activities and the
Results are concerned with what results are being achieved (EFQM, 2003). Excellent results with respect
to Performance, Customers, People and Society (the Results) are achieved through Leadership driving
Policy and Strategy, that is delivered through People, Partnerships and Resources and Processes (the
Enablers). A description of these nine criteria is given in Table 5-4.
Criteria Description
Leadership How behavior/ actions support a culture of “Excellence”.
Policy and Strategy How policy and strategy are formulated and deployed into plans/ actions.
People How the organization realizes the potential of its people.
Partnerships and Resources
How the organization manages resources, including external resources, effectively and efficiently.
Enablers
Processes How the organization manages and improves its processes.
Customer Results What is the customers’ perception of the organization and how good are the drivers of customer satisfaction?
People Results What are the employees’ perceptions of the organization and how good are the drivers of employee satisfaction?
Society Results How does society and the local community perceive the organization and what results have been achieved relating to community and environmental concerns?
Results
Key Performance Results What is the organization achieving in relation to its planned performance?
Table 5-4 A description of the 9 EFQM criteria (EFQM, 2003)
By defining performance indicators per Result and subsequently measuring these, enables the feedback of
control information to the five Enablers. Through Measurement and analysis the organization will be
capable to learn (Bour, 1998). Within the model it is the purpose to determine the objectives per Enabler in
line with the chosen strategic direction. For all of these objectives it is indicated what the related activities
and the aimed Results are. By linking objective, activity and Result on a consistent manner the possibility
will rise to monitor the progress of the organization.
5.2.2 Malcolm Baldrige National Quality Award (MBNQA)
The recognition that total quality management is a broad culture change vehicle with internal and external
focus embracing behavioral and service issues, as well as quality assurance and process control,

35
prompted the USA to develop one of the most famous and now widely used frameworks, the Malcolm
Baldrige National Quality Program (MBNQP). Similar to the EFQM, actually being the American
counterpart of the EFQM, this framework consists of criteria. The 7 criteria are the basis for conducting
organizational self-assessments, for making Awards, and for giving feedback to applicants. The Criteria
are designed to help organizations use an integrated approach to organizational performance
management that results in (BNQP, 2007):
� Delivery of ever-improving value to customers and stakeholders, contributing to organizational
sustainability,
� Improvement of overall organizational effectiveness and capabilities,
� Organizational and personal learning.
The 7 Criteria are built on a set of interrelated Core Values and Concepts, see Figure 5-6.
Figure 5-6 Core values & concepts and criteria
The overall goal is the delivery of customer satisfaction and market success leading, in turn, to business
results.
The EFQM Business Excellence Model and the Malcolm Baldrige National Quality Program both
emphasize an integrated approach to business excellence by application of a broad management model
which is based on Quality Management. Although these Programs give insights that affect performance
measurement, they can not function sufficiently as guidance in the process of developing KPI’s and
measuring performance (see section 5.4).
An opposite approach to the discussed conceptual models is that of KPI groups determined on the bases
of empirical research. The next section will elaborate on these empirical groups.
5.3 Key Performance Indicators in the Construction Industry
The frameworks presented earlier in this chapter all are theoretical concepts applicable on all kind of
organizations. Specifically for the Construction industry, the KPI Working Group and the Construction
Products Association also have developed perspectives based on empirical studies. Clients of the
construction industry want their projects delivered (Blumenthall et all, 2000): (1) on time, (2) on budget, (3)
free from defects, (4) efficiently, (5) right first time, (6) safely, (7) by profitable companies15
. The purpose of
these requirements within the construction industry is on the one hand to enable measurement of project
and organizational performance and on the other hand it will be a key component of any organization’s
move towards achieving best practice. Blumenthall et all (2000) therefore have introduced the
measurement framework, which consists of seven main groups:
15
Contractors’ inability to make a profit has been identified as a major reason for project cost and time overruns
(Blumenthall et all, 2000).

36
1. Time
2. Cost
3. Quality
4. Client Satisfaction
5. Client Changes
6. Business Performance
7. Health and Safety
Within these groups, a range of indicators have been developed to analyze either project or company
performance, or both. The indicators are classified in:
� Headline Indicators; provide a measure of the overall, rude state of health of a firm.
� Operational Indicators; bear on specific aspects of a firm’s activities and should enable management to
identify and focus on specific areas for improvement.
� Diagnostic Indicators; provide information on why certain changes may have occurred in the headline
or operational indicators and are useful in analyzing areas for improvement in more detail.
The indicators are identified as applicable at project and/ or company levels. In some cases the company
indicator is the average value of that company’s project indicators. The indicators are identified as
appropriate to the various members of the supply chain to which they could be applied. For all indicators
an organization may have to use estimated, predicted or actual data depending on the stage of progress
on the project.
The Construction Products Association (2007) makes a distinction between Key Performance Indicators
(KPI’s) and Secondary Performance Indicators (SPI’s). KPI’s are measures of factors critical to success.
SPI’s are indicators of the performance of an activity that is of secondary importance to success (an SPI
often provides some diagnosis of the result of a KPI). Both KPI’s and SPI’s were developed following
extensive stakeholder dialogue and based on the objective of measuring the performance within areas that
were core to the business values. The key areas where performance should be measured easily and
without unnecessary administrative burden were identified. The KPI’s and SPI’s are based on 3 aspects:
1. Customer Satisfaction
2. People
3. Environment
This section discusses main groups of KPI’s used by organizations operating in a project context in the
Construction Industry (unfortunately no framework has been developed specifically for the EPC
Contracting business). This Industry is not equal to the EPC Contracting business: where the Construction
Industry embodies the actual construction work, the EPC Contracting business embodies for example the
Engineering of a refinery, the Procurement of equipment and materials for that refinery and the
management of subcontractors which construct the refinery. However, the empirical groups could be of
use in determining important factors in the operations of the EPC Contracting business. Furthermore,
another point of view in measuring performance has been introduced: the distinction between headline,
operational and diagnostic indicators and KPI‘s and SPI’s. After determination of the overall status of the
organization with the factors critical to success (level 1), it should be possible to zoom in on the details in
order to identify and focus on specific areas (level 2) and to provide information on why certain changes
may have occurred and what to change on detail level (level 3).
5.4 Recapitulation on Frameworks
Seen the characteristics of the frameworks mentioned above, in general the purpose of a performance
measurement framework is to design a consistent approach for systematically collecting, analyzing,
utilizing and reporting on the performance of a company. The framework is a tool that will enhance the
management of business processes by measuring the organization's level of achievement of results.
The discussions have also emerged that, from a theoretical point of view, there are some criteria to which
a framework has to comply if it wants to be effective:
� Approach of organizations by perspectives that give a “whole picture” of the health of the organization,

37
� Organizational perspectives are recognizable and applied in balance with regard to the different
aspects of performance of the organization,
� Enable translation of the strategic plan in one way or another as far as all parts of the organization,
� Ability to also map process performance, which means that organizational outcomes desired as well as
the performance drivers of these outcomes are required,
� Short- and long-term organizational performance should be taken into account,
� Not only ‘hard’ business aspects are important, but also ‘softer’ issues,
� The perspectives are applied in coherence (cause-and-effect linkages),
� Basis of the framework is the organizations’ strategy,
� The presented KPI’s should be manageable for the responsible manager(s),
� Not only the shareholders are important, all relevant stakeholders should be taken into account with
regard to their expectations,
� The ability, especially seen the organizational set-up of EPC Contractors, to enable the measurement
of both project and organization performance,
� Enabling different levels of detail,
� Prescriptive characteristic,
� Not measuring too little data, as well as not measuring too much data.
Deciding on which framework to apply should not be done by analyzing which framework fits best to this
specific Industry/ line of business, because the frameworks approach organizations from a high abstraction
level. This means that each framework is applicable to every organization regardless of the Industry/ line of
business they operate in. The criticality of a measurement framework emerges in its application process:
the way it can be elaborated for Industries/ companies. Deciding on a framework will therefore be done by
comparing them against the criteria mentioned above. Also, a comparison of the frameworks amongst
each other will contribute to the process of deciding on a framework.
Strategy is the starting point of the BSC and the Strategy Map; they enable the translation of the strategic
plan as far as all parts of the organization. With regard to the Quality Programs and the Performance
Prism, strategy is only a part of these concepts and not the starting point.
The Strategy Map is based on the BSC, but elaborated on the connecting of the strategic objectives in
explicit cause-and-effect relationships with each other in the four BSC perspectives. Therefore, the
Strategy Map will be preferred above the BSC.
The Performance Prism adopts a seemingly complementing perspective compared to the Strategy Map,
namely the stakeholders. Earlier has been indicated that the interests of the stakeholders can be
incorporated into the perspectives of the Strategy Map. Also, the Strategy Map has been applied
successfully in many organizations (and have proven their validity) and enjoyed worldwide recognition and
acceptance, while the Performance Prism is only a theoretical concept. With regard to the Performance
Prism, in the literature study executed for this thesis, there is no literature available with proven validity of
this model, as also stated by Berrah et al (2004). Furthermore, earlier mentioned is that the usage of
frameworks presented by authors who have been cited most frequently will enhance the academic bases
of this thesis. With a percentage of citations of almost 75% for Kaplan and Norton against 18% for Neely,
enhanced by incorporating Neely’s stakeholders perspective in the Strategy Map and the proven validity of
the Strategy Map, it can be concluded that the Strategy Map will be preferred above the Performance
Prism.
The Strategy Map and the Quality Programs are complementary frameworks rather than competing. They
have the advantage of helping companies to better understand the need to look at activities as well as
results. In this view, the Strategy Map could be part of the Quality Programs by emphasizing on measuring
performance, but for the purpose of this research the Strategy Map fits best:
� The Strategy Map is primarily concerned with results indicating the performance and goals for each
perspective (starting point is (managing) the results of activities/ processes), which is due to the
leading and lagging concept. The Quality Programs on the other hand use enablers criteria to
determine how a company does what it does and the results criteria to determine what companies

38
have actually achieved or are achieving (emphasis on (managing) the work processes which lead to
results),
� The categories for measurement of the Quality Programs provide a very broad and coherent set of
assumptions about what is required for a good organization and its management, limiting the guidance
it gives to defining specific areas of measurement (which makes it not easy to measure). Therefore,
the Quality Programs are more holistic than the Strategy Map by considering the ‘hows’ rather than
just the ‘whats’ (seen the objective of this research, the Quality Programs are too holistic),
� The Strategy Map is more an objective measurement framework (prescriptive) by involving and strictly
following a set of rules or standards. The Quality Programs on the other hand are frameworks that
recognize that there are many approaches to achieving sustainable excellence (non-prescriptive),
� The Strategy Map is very useful as a high-level strategic measurement framework, but it does not
really tell how to improve, what the Quality Programs do on the contrary. In order to handle the lack of
the Strategy Map of not telling how to improve, more levels should be built in to zoom in on the details
to identify and focus on specific areas and to provide information on why certain changes may have
occurred and what to change on detail level. The levels depend on the purpose of the KPI’s,
� Also, the Strategy Map is more forward looking, what means that the Quality Programs tell you where
you have come from and where you are now (are regarded as excellent tools for self-assessment),
while the Strategy Map emphasizes on what the company needs to achieve if it is to be successful in
the (near) future.
5.5 Conclusions
In general multiple, seemingly conflicting, measurement frameworks exist because they all add value; they
all provide unique perspectives on performance and approach organizations from a different point of view
to cover business activities. These frameworks all have their strengths and weaknesses; as long as it is
acknowledged that performance measurement should be executed according to a framework. The
traditional way of measuring performance according to a framework had shortcomings in guiding the
measurement process. The main shortcoming is that they are based on financial performance measures.
These measures provide little information to support organizations on their quality journey, because they
do not map process performance and improvements seen by the customer and other stakeholders, they do
not capture value drivers for long-term competitive performance and are not manageable.
To cope with these shortcomings the last few years several frameworks and methodologies have been
developed of which the most prominent have been discussed in this chapter. When comparing the
frameworks against the criteria recapitulated in the previous section, it can be concluded that the Strategy
Map complies most. This conclusion is enhanced by the critical comparison of the frameworks amongst
each other in the previous section. Secondly ranked is the BSC followed by the Performance Prism and
then the Quality Programs.
The main critics received with regard to the Strategy Map are the lack of specific guidelines for successful
implementation and not telling how to improve. However, based on the suggestions in this chapter to cope
with these shortcomings (application of CSF’s and introduction of levels) and the arguments above, the
Strategy Map is the framework that will be used to determine the KPI’s for the EPC Contracting Industry,
which will enable specific, customized performance measurement.
Besides the conclusion in this chapter that frameworks are valuable tools for performance measurement,
another conclusion is that prior to elaborating any framework, the company needs to have a clear,
preferably written, vision, mission and strategy (the strategic plan) in place. If not, the company has to
focus on this aspect before applying a performance measurement framework. The next chapter discusses
the strategic plan of CB&I Lummus.
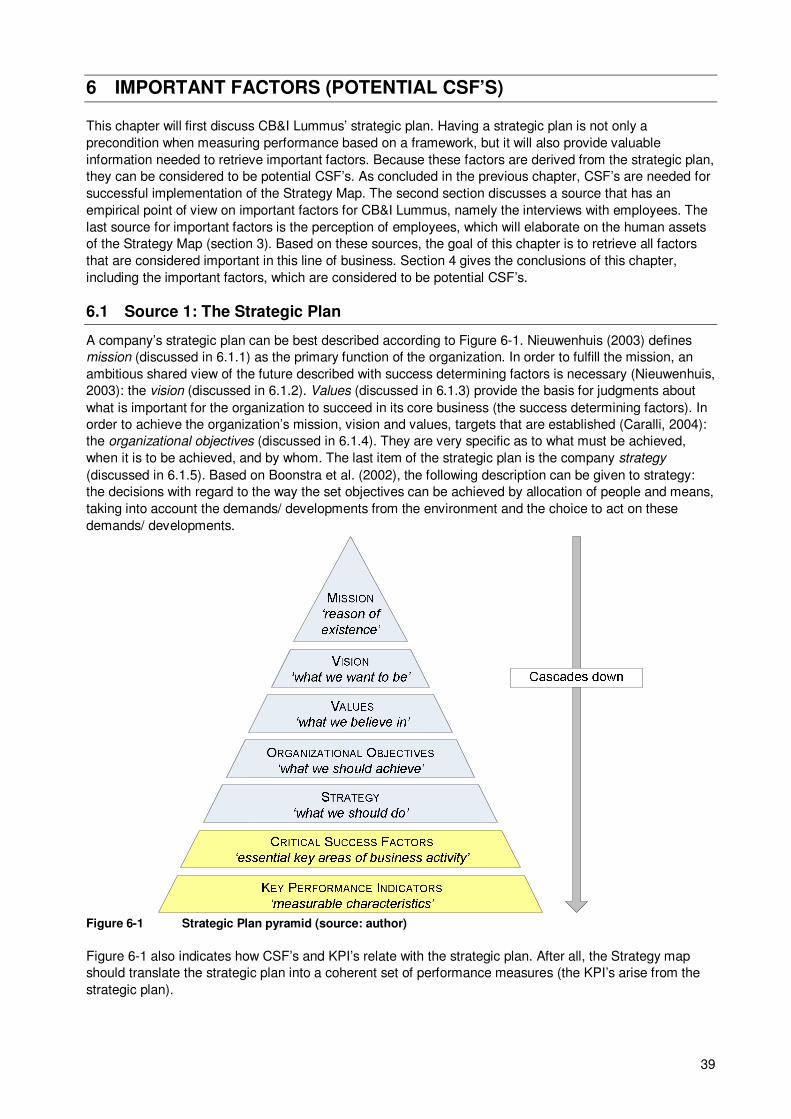
39
6 IMPORTANT FACTORS (POTENTIAL CSF’S)
This chapter will first discuss CB&I Lummus’ strategic plan. Having a strategic plan is not only a
precondition when measuring performance based on a framework, but it will also provide valuable
information needed to retrieve important factors. Because these factors are derived from the strategic plan,
they can be considered to be potential CSF’s. As concluded in the previous chapter, CSF’s are needed for
successful implementation of the Strategy Map. The second section discusses a source that has an
empirical point of view on important factors for CB&I Lummus, namely the interviews with employees. The
last source for important factors is the perception of employees, which will elaborate on the human assets
of the Strategy Map (section 3). Based on these sources, the goal of this chapter is to retrieve all factors
that are considered important in this line of business. Section 4 gives the conclusions of this chapter,
including the important factors, which are considered to be potential CSF’s.
6.1 Source 1: The Strategic Plan
A company’s strategic plan can be best described according to Figure 6-1. Nieuwenhuis (2003) defines
mission (discussed in 6.1.1) as the primary function of the organization. In order to fulfill the mission, an
ambitious shared view of the future described with success determining factors is necessary (Nieuwenhuis,
2003): the vision (discussed in 6.1.2). Values (discussed in 6.1.3) provide the basis for judgments about
what is important for the organization to succeed in its core business (the success determining factors). In
order to achieve the organization’s mission, vision and values, targets that are established (Caralli, 2004):
the organizational objectives (discussed in 6.1.4). They are very specific as to what must be achieved,
when it is to be achieved, and by whom. The last item of the strategic plan is the company strategy
(discussed in 6.1.5). Based on Boonstra et al. (2002), the following description can be given to strategy:
the decisions with regard to the way the set objectives can be achieved by allocation of people and means,
taking into account the demands/ developments from the environment and the choice to act on these
demands/ developments.
Figure 6-1 Strategic Plan pyramid (source: author)
Figure 6-1 also indicates how CSF’s and KPI’s relate with the strategic plan. After all, the Strategy map
should translate the strategic plan into a coherent set of performance measures (the KPI’s arise from the
strategic plan).

40
6.1.1 Mission
Koster & Stolze (2007) make a distinction between 5 aspects regarding a mission:
1. Business Scope
2. Organizational Purpose
3. Meaning for Stakeholders
4. Values and Beliefs
5. Intentions and Ambitions
CB&I Lummus mission has been described as (Company management Manual, 2007): to serve the
petrochemical and chemical industries through designing and constructing production facilities, on- and
offshore, on an EPC project basis, which includes project management, engineering, procurement,
construction and commissioning.
This mission fits within CB&I’s overall mission, which is16
: we will be the preferred supplier of process and
storage facilities worldwide by:
� Providing innovative and safe solutions through engineering, fabrication and construction
� Recognizing and delivering the products and solutions that our customers value
� Delivering results that repeatedly bring customers back to CB&I
� Creating an ethical, safe and enabling environment for our employees to prosper
� Leveraging the reputation and equity of our brands
� For the purpose of achieving sustainable, profitable revenue growth
Based on the above, the author has broken down the mission into the following important factors:
To serve the chosen markets Aim at EPC projects Enabling employee prosperity
Providing innovative and safe
solutions
Meeting customer requirements
Leveraging the reputation and
equity of the brands
To be the preferred supplier in
the Industry
Delivering results that repeatedly
bring customers back
Achieving sustainable, profitable
revenue growth
6.1.2 Vision
Koster & Stolze (2007) make a distinction between 3 aspects regarding a vision:
1. Environmental View
2. Corporate Dreams
3. Success Formula
CB&I Lummus’ vision has been described as (Company management Manual, 2007): CB&I Lummus
strives to be the global partner of choice to its clients in the hydrocarbon and related industries, by:
� Capturing the energy and creativity of its people to deliver projects that meet its clients’ and
stakeholders’ objectives and expectations
� Offering its employees challenging opportunities to develop and grow
� Demonstrating exemplary performance in safety, quality and sustainability as an integral part of its
culture
This vision fits within CB&I’s overall vision, which is16
: to be the leader in providing innovative and value-
added engineering and construction solutions to customers worldwide while creating superior shareholder
value.
Based on the above, the author has broken down the vision into the following important factors:
To be the global partner of choice to clients in the
chosen Industries
Demonstrating exemplary performance in safety,
quality and sustainability
Capturing the energy and creativity of employees Creating superior shareholder value
16
Source: intranet CB&I Lummus.

41
To deliver projects that meet clients’ and
stakeholders’ objectives and expectations
Achieving sustainable, profitable revenue growth
Offering employees challenging opportunities to
develop and grow
To be the leader in providing innovative and value-
added engineering and construction solutions to
customers worldwide
6.1.3 Values
Values are the embodiment of what an organization stands for and should be the basis for the behavior of
its members (Cowings, 2002).
CB&I Lummus’ values are (Company management Manual, 2007):
� Client focus at all stages through understanding client requirements and listening to client satisfaction
feedback.
� Leadership and consistency of purpose through clear vision, objectives, policies and strategies.
� A working environment conducive to team working, job satisfaction, achievement of each individual’s
potential and providing the opportunity to learn and develop skills.
� Focus and stimulus on key issues such as health, safety, welfare and environmental care.
� A systematic planned and controlled approach towards executing work and measuring performance to
improve consistency and efficiency.
� Win-win relationships with sellers and contractors.
� A responsibility to the public in general and an acceptable presence in the community by adopting an
ethical and moral approach to concluding business.
� A culture of continual improvement recognizing that suggestions and learnings are opportunities
towards excellence and improved competitiveness.
� A culture of continual improvement recognizing that suggestions and learnings are opportunities
towards excellence and improved competitiveness
These values fit within CB&I’s overall values, which are16
:
� Focus: encompasses our passionate focus on safety, on our employees and on our customers
� Innovation: drives us to deliver creative solutions, to have empowered leadership and to apply key
technologies
� Accountability: allows us to leverage our culture of individual accountability to achieve profitability,
perform with excellence and bind us to ethical behavior
Based on the above, the author has broken down the values into the following important factors:
Client focus Leadership To achieve profitability Measuring performance
Understanding client
requirements
Client satisfaction
feedback
Suggestions and
learnings
Deliver creative
solutions
Consistency of purpose
through clear vision,
objectives, policies and
strategies
A working environment
conducive to team
working, job
satisfaction,
achievement of each
individual’s potential
Focus and stimulus on
key issues such as
health, safety, welfare
and environmental care
An ethical and moral
approach to concluding
business
Providing the
opportunity to learn and
develop skills
A systematic planned
and controlled approach
towards executing work
Focus on safety,
employees and
customers
Win-win relationships
with sellers and
contractors
A culture of continual
improvement
To improve consistency
and efficiency
To apply key
technologies
To perform with
excellence
Excellence and
improved
competitiveness
To have empowered
leadership
To leverage the culture
of individual
accountability
To bind employees to
ethical behavior

42
6.1.4 Organizational Objectives
Organizational Objectives are measurable final results that should be achieved within a certain period,
typically a timeframe of two to four years, depending on the rapidity of the changes in the environment
(Koster & Stolze, 2007).
CB&I Lummus’ prime organizational objective is (Company management Manual, 2007): business
continuity in a lead position in the industry, by satisfying the needs of its clients and other stakeholders.
Subject to this prime organizational objective are the following objectives:
� Increased Profitability
� Balanced Risk Profile (through a mix of Reimbursable, Lump Sum Turn Key (LSTK) and Partnership
contracts
Based on the above, the author has broken down the organizational objectives into the following important
factors:
Business continuity
Lead position in the industry
Satisfying the needs of its clients and other stakeholders
Increased Profitability
Balanced Risk Profile
6.1.5 Strategy
CB&I Lummus’ strategy is described as (Company management Manual, 2007):
� Building on Strengths (market): Regions, Products and Key Accounts
� Innovative Development: New Markets, New Opportunities and Sustainable Business
� Improve and Perform on “Operational Excellence”: Multi Office Project Execution (MOPEX), Critical
Chain and Resource Planning (CCRP) and Work Process Improvement
To support the strategies above, the following supplementing strategies haven been formulated:
� Employee Development: programs that are aligned to and will support the strategic objectives.
� Internal Communications: processes that inform and enable employees to align with the objectives
Based on the above, the author has broken down the strategy into the following important factors:
Building on Strengths Innovative Development Employee Development
Work Process Improvement Internal Communications Perform on “Operational
Excellence”
Focus on key regions, products
and accounts
Improve on “Operational
Excellence”
Multi Office Project Execution
(MOPEX)
Exploring new markets, new
Opportunities and sustainable
business
Inform and enable employees to
align with the objectives
Critical Chain and Resource
Planning (CCRP)
Additionally to the strategic plan, the ‘All Employee Meetings’ have been used as a source. This is an
important communication tool of Company Management, which is held twice a year. These meetings
inform employees about recent developments, strategic choices, give feedback on project progress, the
financial status, etc. As in the previous sections this information source has been reviewed and the
important factors will be consolidated.
6.2 Source 2: Interviews
The information retrieved from the interviews is from the first hand and therefore very useful. On the other
hand, the information can also be somewhat subjective. This subjectivity needs to be filtered out and that
will result in the important factors without any kind of indication whether the organization is doing well or
not with regard to that particular factor. This chapter will not further discuss the interviews in detail,

43
because this is not the aim of this exercise. The filtered factors will be given in section 6.4, where they will
be reviewed and consolidated together with the factors retrieved from other sources. The next section will
discuss one of the other sources, namely an internal report which had the purpose to identify the key
reasons why employees stay with Lummus.
A lot of the factors retrieved from the strategic plan and the All Employee Meetings have also emerged
from the interviews. This should not be a complete surprise, because the interview is designed on strategic
level, which therefore leads to factors also mentioned in the strategic plan. And the interviews indicate
what the respondents value; these factors are also partly covered in the All Employee Meetings. But an
important conclusion is that the strategic plan is in one way or another translated into parts of the
organization. This should make it easier to implement performance measurement in the organization, on
the basis of the Strategy Map.
6.3 Source 3: Perception of Employees
In section 5.1.2.1 has been concluded that Human assets should be emphasized. After all the employees
are, especially in this line of business, the most valuable assets. To retrieve the factors that the employees
value most, reference can be made to an internal report by Hooft et al. (2007). They have done research to
identify the key reasons why employees stay with the company. To retrieve this information they posed a
questionnaire to employees, which asked for reasons why employees joined Lummus, why employees
stay with Lummus and what the reasons are to reapply with Lummus.
Lummus: Factors to Join, Stay and Reapply
Age: C
lose to P
ensio
n
Appre
cia
ted
Asked
Colle
agues
Develo
pm
ent
Easy C
om
mute
Em
pow
ere
d
Job R
equired
Loyalty
No a
ltern
ativ
e
Open (
Info
rmal)
Prim
ary
Benefit
s
Pro
ject B
asis
Reputa
tion
Secondary
Benefit
s
Tra
vel O
pport
unity
Work
Atm
osphere
Work
Conte
nt
To Join Lummus To Stay w ith Lummus To Reapply w ith Lummus
Figure 6-2 Factors to join, stay and reapply (based on Hooft et al., 2007)
Figure 6-2 shows the factors that are considered by employees to be the most interesting that commits
them to Lummus. Out of all these factors, 2 are the most leading in this analysis:
1. Work Content: technical content related to specific function, this means something different for an
engineer, a buyer or a project manager.
2. Development: available room for development in desired direction.
These factors are also most leading when the results are plotted as totals in a pie chart, see Figure 6-3,
with almost 50% of all factors. Also, this figure shows 4 significant factors for employees that are almost
equally important factors17
with more than 20% of all factors:
1. Work Atmosphere: general atmosphere in the office.
17
Factors of importance less than 3% have been summed up in the category ‘Other’. These are not considered to be
key factors for CB&I Lummus as total.

44
2. Easy Commute: commuting time.
3. Colleagues: colleagues as people.
4. Reputation: reliability and professionalism towards employees and Lummus known as household
name in field relevant for employee.
Key Factors of Lummus Perceived by Employees
Colleagues
5% Development
18%
Work Content
30%
Other
30%
Work Atmosphere
7%
Reputation
4%
Easy Commute
6%
Figure 6-3 Key factors of Lummus perceived by employees (based on Hooft et al., 2007)
The information from the sections above has been retrieved directly from surveys amongst the employees
of CB&I Lummus. From a theoretical point of view, Walton (1973) defines 8 primary dimensions valued by
employees, see Figure 6-4. These 8 factors will be taken into account when defining the potential CSF’s
(but will not have a leading role), together with the 6 factors retrieved by Hooft et al. (2007).
Figure 6-4 Primary dimensions valued by employees (source: Walton, 1973)
6.4 Potential CSF’s
There are many factors that seem to be important for the EPC Contracting industry, not only from a
theoretical point of view, but especially from an empirical point of view. Not all of these factors are equally
important and critical enough to be identified as a CSF. However, in a process of consolidating and filtering
1. Adequate and Fair Compensation
− Adequate Income
− Fair Compensation
2. Safe and Healthy Working Conditions
3. Immediate Opportunity to Use and Develop Human Capacities
− Autonomy
− Multiple Skills
− Information and Perspective
− Whole Tasks
− Planning
4. Future Opportunity for Growth and Security
− Development
− Prospective application
− Advancement opportunities
− Security
5. Social Integration in the Work Organization
− Freedom from prejudice
− Egalitarianism
− Mobility
− Supportive primary groups
− Community
− Interpersonal openness
6. Constitutionalism in the Work Organization
− Privacy
− Free speech
− Equity
− Due process
7. Work and the Total Life Space
8. The Social Relevance of Work Life

45
of the factors, potential CSF’s can be identified, see Table 6-1 below. The potential CSF’s are already
classified according to the perspectives of the Strategy map and are also provided with a certain level
towards improvement (as CSF’s should be defined, conform the secondary focus of CSF’s in section
5.1.2.2). One of the criteria of working with performance measurement frameworks is that it should not
measure too little data, as well as not too much data. Therefore, additional information is required to make
a decision on the identification of the final, most critical CSF’s. The tool to retrieve this information is a
survey, of which will the results will be discussed in the next chapter.

46
FINANCIAL CUSTOMER INTERNAL BUSINESS PROCESS LEARNING & GROWTH
Improve Shareholder Value Meeting Project Preconditions
(Schedule, Budget, Quality, Safety)
Balance between Key and New Expertise of
Technologies
Improve Employee Satisfaction
Assurance of Business Continuity Focus on determined Regions Improve Multi Office Project Execution Capture Lessons Learned
Sustainable Revenue Growth Focus on determined Products/
Technologies
Increase Project Types in line with Strategic
Focus
Employee Development
Profitability Increase application of In-house
Technology Licenses
Increase In-house Knowledge/ Competence
Availability
Alignment of IT Systems/
Applications
Competitiveness Improve Relationship with Client Improve Material Supplier (Work) Processes Improve Employee Performance
Increase (paid) Workload to Jobs Reliability and Integrity as EPC
contractor
Meeting Requirements of Project Execution
Plans
Effective Teamwork
Increase Workload to DEC's One-Stop-Shop EPC Contractor Sufficient Backlog Improve Technical Work Content
Minimize Overhead Cost Innovativeness and Value Adding
Ability
Anticipate on Changes in the Economic
Climate
Stimulate Work Atmosphere
Balanced Project Portfolio (Scope,
Size, Contract)
Improve Quality of the total EPC
Process
Project Efficiency and Effectiveness Improve Knowledge Capturement,
Transfer & Availability
Expand Client Base Optimize Communication with Client Optimize Project Risk Balance Effective usage of IT-tools
Significant Market Share in the
Industry
Improve Ability to handle Client
Specific Requirements
Maximize Scope Capturement during Bidding
Phase
Improve Information Capturement,
Integrity & Flow
More long term Agreements with
Existing Clients
Balanced Client Type Portfolio Scope Management during Project Execution Increase Commitment of People to
the Organization
Focus on Key Clients Increase Flexibility Secure Employee Well Being
Management of Client Knowledge Selective Project Acceptance/ Bidding Alignment of Work Processes
Create Ownership of Total Project Objectives Improve Relationship with DEC's
Improve Quality Basic Engineering Package Available Cash Amount
Sufficient Capacity
Effective Communicating IT Systems
Subcontract Management
Improve Sales Efforts
Focus on Key Suppliers
Table 6-1 Potential Critical Success Factors (source: identified by the author, based on this chapter)

47
7 DETERMINATION FINAL CSF’S & KPI’S
In the previous chapter the potential CSF’s in the EPC Contracting Industry have been determined. But
which of these factors are the most critical ones? And how can they be measured? The first section of this
chapter elaborates on the tool used for determination of the final CSF’s; these final CSF’s are discussed in
the second section. So, which KPI’s can be allocated to the final CSF’s? How to do this? The last section
will discuss this.
7.1 Decision Chart
As indicated in section 1.6.2, respondents have given scores to the potential CSF’s by means of forms.
The results of these scores are represented in a bubble chart, see Figure 7-1. The bubble chart is a tool to
visualize these results; the actual decision making is based on the scores of the potential CSF’s.
- CSF Decision Chart -
IBP22, 1
FIN01, 2
FIN02, 3
FIN03, 3FIN04, 2
FIN06, 1
FIN07, 4FIN08, 1
FIN09, 2
CUS01, 4
CUS08, 1
CUS11, 2
CUS12, 2
CUS13, 1
CUS16, 3CUS02, 2
CUS03, 1CUS04, 2
CUS05, 1
CUS06, 2
CUS07, 1CUS09, 2
CUS10, 1
CUS14, 2
IBP12, 1
IBP15, 2CUS15, 1
IBP01, 1IBP02, 1
IBP03, 4
IBP04, 1
IBP05, 1
IBP06, 1
IBP07, 4
IBP08, 1
IBP09, 4
IBP10, 1
IBP11, 1
IBP13, 1
IBP14, 1
IBP16, 4
IBP17, 4
IBP18, 3
IBP19, 1
IBP20, 1
IBP21, 4
FIN10, 3
L&G01, 2
L&G02, 3
L&G03, 2
L&G04, 2
L&G05, 1
L&G06, 3
L&G07, 2
L&G08, 1
L&G09, 4L&G10, 2
L&G11, 2
L&G12, 4
L&G13, 2
L&G14, 1
FIN05, 2
L&G15, 1
0.0
0.5
1.0
1.5
2.0
2.5
3.0
3.5
4.0
0.0 0.5 1.0 1.5 2.0 2.5 3.0 3.5 4.0
Business Criticality (as experienced by Company)
Me
as
ura
bilit
y (
as
ex
pe
rie
nc
ed
by
Co
mp
an
y)
Figure 7-1 Decision Chart
7.1.1 X-, Y-axis and Bubble Size
In section 5.1.2 has been determined that CSF’s should primarily comply with the following criteria:
1. Both observable and measurable in certain respects such that it would be easier to focus on these
factors; this criteria will be represented by the Y-axis.
2. Actuality, i.e. having the largest impact on an organization’s performance (the criticality of success
factors); this criteria will be represented by the X-axis.
Furthermore, according to section 5.1.2, the secondary focus should be on the following criteria:
a. Essential for the organization to accomplish its mission.
b. Essential for the achievement of the set organizational objectives.
c. Be the bases of which an organization can distinguish itself from the competition.
d. Enabling a sustainable, positive relation with the market.
e. Not only aimed at organizational bottlenecks.
f. Focused on the future by formulating in results terms (improvement): this is not really a focus of CSF’s,
but more a formulation rule which has been taken into account in the previous chapter.

48
These 6 criteria have not been posed to the respondents, but are considered to be the theoretical criteria
which CSF’s should meet. The assessment whether the CSF’s meet these criteria is also plotted in the
bubble chart where they set the size of the bubble. However, seen the practical character of this exercise,
this assessment is informational and will have no significant consequences on the CSF determination.
The bubble chart is divided in five sections:
Section Y-axis
Measurability
X-axis
Business Criticality
1. ‘Most Critical’ Very high Very high
2. ‘Critical’ High High
3. ‘Upgrade’ Low High
4. ‘To Consider’ High Low
5. ‘Forget It’ Low Low
1. ‘Most Critical’: very easy to observe and measure and also having massive impact on performance;
these factors should in any case be identified as CSF.
2. ‘Critical’: easy to observe and measure and also having large impact on performance; these factors
should be identified as CSF.
3. ‘Upgrade’: not easy to observe and measure, but having large impact on performance; because these
are critical to business they can be pointed as CSF’s in case of deficiency, but there should be a work
around to make them easy to observe and measure.
4. ‘To Consider’: easy to observe and measure, but not having that large of impact on performance; can
be considered as CSF to monitor these factors (or in case of deficiency).
5. ‘Forget It’: not easy to observe and measure an also not having large impact on performance; these
factors should be excluded as CSF.
If perspectives of the Strategy Map are not represented at all by CSF’s, an option could be to select
‘Upgrade’ factors if there is a work around available to make them easy to observe and measure. Another
option could be to select ‘To Consider’ factors.
7.1.2 Results
The Decision Chart shows that the majority of the factors are as good as concentrated in the middle of the
business criticality axis, with some exceptions which have high scores on business criticality. The
explanation for this is that the factors used in this analysis are all already considered important in this
Industry. With regard to the measurability axis, the factors are distributed almost throughout the whole axis.
The results can be analyzed from 2 point of views: (1) from the 4 perspectives of the Strategy Map and (2)
from the 5 sections of the decision chart. There are in total 63 factors distributed over the 4 perspectives of
the Strategy Map. Based on the scores, these 63 factors have been allocated to one of the 5 sections. For
every perspective, Table 7-1 gives the number of factors that is allocated to a section.
Perspective Most Critical Upgrade To Forget Total
Critical Consider It
Financial 3 8 1 1 1 14
Customer 0 5 4 2 1 12
Intern. Buss. Pro. 1 6 3 4 7 21
Learn. & Growth 1 1 6 0 8 16
Total 5 20 14 7 17 63 Table 7-1 Number of factors per perspective, per section
7.1.2.1 Point of view 1: Strategy Map’s perspectives
The Financial perspective contains mostly ‘Critical’ factors, followed by ‘Most Critical’ factors secondly.
From this can be concluded that in this Industry the financial perspective is very important. The Customer
perspective contains mostly ‘Critical’ and ‘Upgrade’ factors. Overall, this perspective can be considered to
be important, but not always that easy to measure. The Internal Business Process perspective contains

49
mostly ‘Forget It’ and ‘Critical’ factors. The factors of this perspective are either easy to measure and
business critical, or not easy to measure and not business critical. The Learning & Growth perspective
contains mostly ‘Forget It’ factors, followed by ‘Upgrade’ factors secondly. Apparently, this perspective is
not believed in and if factors are somewhat critical, they are perceived not easy to measure.
The analysis from the Strategy Map’s point of view shows that the perspectives are not equally valued by
the respondents. The perspectives can be ordered according to the following importance:
Financial > Internal Business Process > Customer > Learning & Growth
Kaplan & Norton argue that the perspectives of the Strategy Map should be in balance. However, this
balance is not as important as the fact that the Strategy Map should represent a balance between the
needs and requirements vital to the success of the company. These needs and requirements are
represented by the CSF’s and as concluded above, there seems to be an order of importance between the
perspectives. Basically, the perspectives are only used to sort the CSF’s and to make sure you do not
leave out any important ones. So, it is not a requirement of the Strategy Map that all perspectives contain
the same number of CSF’s, as long as important ones are not left out (a fair balance will be desirable).
7.1.2.2 Point of view 2: Decision Chart’s sections
The ‘Most Critical’ section contains mostly factors from the financial perspective. This emphasizes the
importance of these factors. The ‘Critical’ section also contains mostly financial factors, but also equally
divided customer and internal business process factors. So, this section is almost equal to these 3
perspectives and the learning & growth factors can be neglected to be critical. The ‘Upgrade’ section
contains mostly learning & growth factors, but also equally divided customer and internal business process
factors. So, this section is almost equal to these 3 perspectives and the financial perspective can be
neglected and does not need to be upgraded. The ‘To Consider’ section contains an almost equally
distributed numbers of financial factors, customer and internal business process factors. So, for this
section the learning & growth perspective can be neglected and will not be considered. The ‘Forget It’
section contains mostly internal business process and learning & growth factors. So, for this section, these
factors need to be eliminated.
The analysis from the Decision Chart’s point of view shows that in general:
� ‘Most Critical’ perspective is the financial one,
� ‘Critical’ perspectives are all perspectives, except the learning & growth one,
� To be ‘Upgraded’ perspectives are all perspectives, except the financial one,
� ‘To Consider’ perspectives are all perspectives, except the learning & growth one,
� ‘Forget It’ perspectives are the internal business process and learning & growth factors perspectives.
This analysis has no other results than already concluded from the point of view of the Strategy Map’s
perspectives: it only confirms the relatively high importance of the financial perspective and the relatively
low importance of the learning & growth perspective.
7.2 The final CSF’s
In section 7.1.2.1 (and 7.1.2.2) has been concluded that it is not a requirement of the Strategy Map that all
perspectives contain the same number of CSF’s, as long as important ones are not left out (a fair balance
will be desirable). Therefore, not the perspectives of the Strategy Map should be the starting point in the
CSF selection process, but the sufficient representation of the company’s needs and requirements.
Consequently, the ‘Most Critical’ and ‘Critical’ factors from the organization’s point of view are identified as
CSF’s, which gives a total of number of 25. An additional analysis on the scores of the ‘Upgrade’ and ‘To
Consider’ factors has shown that there are 2 factors which have relative large deviations in the scores,
both on the measurability axis. The scores vary from ‘very difficult to implement’ to ‘very easy to
implement’, the extremes of this axis. Apparently, there are respondents who experience these 2 factors to
be very easy to implement: these 2 factors will also be identified as CSF’s. This results in 11 financial
CSF’s, 5 customer CSF’s, 8 internal business process CSF’s and 3 learning & growth CSF’s.

50
The next step is the identification of KPI’s for these final CSF’s. The first part of this process was:
1. For every CSF has been determined which KPI(‘s) is/ are most representative, based on the extensive
analysis of the company and the Industry in general;
2. Information derived form the literature and empirical surveys: all existing and potential KPI’s (specific
to the Industry) haven been listed.
After this step, the KPI’s have been sorted out to match the CSF’s. For this purpose the 4 views have been
used as discussed in section 4.2. In this part of the process, the KPI’s are also checked against the criteria
for ‘good’ KPI’s according to section 4.3. This part of the process is discussed in the next section.
7.3 The final KPI’s
The assumption is that except for the fair balance between the perspectives of the Strategy Map, the KPI’s
should also be fairly balanced (an appropriate mix) against the way they are approached in organizations.
In Table 7-2 below a brief summary is given of the identified views:
View Categories
Implication - Lagging: KPI's give feedback on past performance, they show that the change has happened
- Leading: KPI's are designed to measure future performance, they reflect upcoming change
Responsiveness - Responsive: individuals can directly influence these KPI's internally
- Non-responsive KPI's are external, outside the direct influence or control of an individual
Nature - Tangible: hard/ objective KPI's
- Intangible: soft/ subjective KPI's
Location - Input (means): resources consumed, what is needed to start business
- People: people are expected to be the main input in the primary processes of CB&I Lummus.
- Process (activities): the intermediate steps in producing a product or service
- Output (performance): the product or service provided by the organization and delivered to customers
The other categories are already represented by the perspectives of the Strategy Map.
a service or organization have an intended effect Table 7-2 Views on KPI’s on organizations
Every view has different categories and the boundaries between these categories are not always easy to
determine. Consequently, the classification according to these categories might be arbitrary. Important,
however, is to acknowledge/ recognize that there are different categories and that they are represented
with at least one KPI. This resulted in the final KPI’s for the EPC Contracting Industry, see Table 7-3,
where the final CSF’s and KPI’s are not only given according to the way they are approached in
organizations, but also according to the perspectives of the Strategy Map.

51
Table 7-3 Final Critical Success Factors and allocated Key Performance Indicators (source: author)
CSF KPI Implication Responsive Nature Location
1 Sustainable Revenue Growth 1 Revenue Lagging N Tangible Output
2 Profitability 2 Earnings Before Interest and Tax Lagging N Tangible Output
3 Assurance of Business Continuity 3 Future Net Cash Flow Leading N Tangible Output
4 Expand Client Base 4 New Clients Leading Y Tangible Input
5 Focus on Key Clients 5 Key Clients Leading N Tangible Input
6 Balanced Project Portfolio 6 Project Type Lagging N Tangible Output
7 Minimize Overhead Cost 7 Overhead Lagging N Tangible Output
8 Increase (paid) Workload to Jobs 8 Paid Manhours Lagging Y Tangible Output
9 Increase Workload to DEC's 9 DEC Workload Lagging Y Tangible Output
1 Focus on determined Products/ Technologies 1 Products/ Technologies Lagging N Tangible Input
2 Improve Relationship with Client 2 Repeat Business Leading N Tangible Outcome
3 Balanced Client Type Portfolio 3 Client Type Lagging N Intangible Output
4 Meeting Project Preconditions 4 Projects Finished on Time Lagging N Tangible Output
5 Projects Finished within Budget Lagging N Tangible Output
6 Quality of Projects Leading N Tangible Outcome
1 Improve Sales Efforts 1 Successful Bids - Value Lagging N Tangible Input
2 Successful Bids - Number Lagging N Tangible Input
3 Successful Prospects Lagging N Tangible Input
2 Sufficient Capacity 4 Manpower Leading Y Tangible People
3 Sufficient Backlog 5 Backlog Leading Y Tangible Input
4 Focus on Key Suppliers 6 Key Suppliers Lagging Y Tangible Process
5 Project Efficiency 7 Manhour Efficiency Leading Y Tangible Process
8 Earned Value Leading Y Tangible Process
6 Project Effectiveness 9 Profitable Projects Leading N Tangible Output
7 Improve MOPEX 10 Coordination Manhours Lagging Y Tangible Process
8 Subcontract Management 11 Subcontractor Claims - Number Leading Y Tangible Output
12 Subcontractor Claims - Value Lagging Y Tangible Output
9 Scope Management 13 Change Orders Approved - Value Lagging N Tangible Process
14 Change Orders Approved - Number Leading N Tangible Process
15 Approved Contract Value Change Lagging N Tangible Output
1 Available Cash Amount 1 Free Cash Flow Leading N Tangible Input
2 Employee Satisfaction 2 Employee Satisfaction Index Leading N Intangible People
3 Capture Lessons Learned 3 Followed Suggestions Leading Y Tangible Process
FIN
CU
SIB
PL
&G

52
Table 7-3 shows that the Learning & Growth perspective contains only Leading KPI’s. This is in line with
the expectations because the Learning & Growth perspective is the most future oriented perspective
compared to the other perspectives. Table 7-3 also shows that the Customer Perspective contains only
Non-responsive KPI’s. This is also in line with the expectations because the Customer perspective is the
most externally oriented perspective compared to the other perspectives.
In the process of allocating KPI’s to the CSF’s, it has emerged that it is necessary to reconsider an earlier
drawn conclusion.
Based on theory, the approach in this research was to design KPI’s which are directly related to the
organization’s strategy. But, based on the Critical Success Factors for the EPC Contracting Industry, this
approach needs to be redefined into: the design of KPI’s which are directly related to the organization’s
strategy and which directly contribute to the organization’s strategic objectives.
Therefore, the KPI’s are identified as applicable at company and/ or project level. In some cases the
company indicator is the average (weighted) value of project KPI’s. For the indicators, estimated, predicted
or actual data can be used depending on the stage of progress on the project (or expected project).
The financial perspective
The financial perspective contains 11 CSF’s. However, this number has been reduced to 9:
� The allocated KPI for ‘Improve Shareholder Value’ is Share Price. This is an important KPI on the level
of CB&I total, but not on the level of CB&I Lummus. CB&I Lummus’ contribution to the Share Price is
the revenue and profit, which are separate CSF’s in this perspective.
� The allocated KPI for ‘Competitiveness’ is ‘Successful Bids'. This KPI is also allocated to a CSF of the
Internal Business Process.
To every other CSF, 1 KPI has been allocated, which is expected to be representative enough: 9 KPI’s for
this perspective.
The customer perspective
The customer perspective contains 5 CSF’s. However, this number has been reduced to 4:
� The allocated KPI for ‘One-Stop-Shop- EPC Contractor’ is Repeat Business. This KPI is also allocated
to another CSF in this perspective, ‘Improve Relationship with client’.
To the first 3 CSF’s, 1 KPI has been allocated, which is expected to be representative enough. In order to
cover the CSF ‘Meeting Project Preconditions’, 3 KPI’s have been allocated. Result is a total number of 6
KPI’s.
The Internal Business Process perspective
The customer perspective contains 8 CSF’s. However, this number has been increased to 9:
� ‘Project Efficiency and Effectiveness’ has separated in 2 CSF’s, ‘Project Efficiency’ and ‘Project
Effectiveness’. On KPI level these factors are considered as different categories.
To the CSF’s ‘Improve Sales Efforts’, ‘Project Efficiency’, ‘Subcontract Management’ and ‘Scope
Management’, respectively 3, 2, 2 and 3 KPI’s have been allocated in order to be representative enough.
With regard to the other CSF’s, 1 KPI has been allocated, which should cover these CSF’s. Result is a
total number of 15 KPI’s.
The Learning & Growth perspective
The learning & growth perspective contains 3 CSF’s; to all of these 1 KPI has been allocated. Result is a
total number of 3 KPI’s.
An elaboration of each KPI according to the Performance Measure Record Sheet (PMRS)18
is given
in Appendix G.
18
The PMRS facilitates and can function as a practical guide for the design of KPI’s, see section 4.4.

53
The PMRS consists of ten elements, of which 2 has been left blank:
1. ‘What do they do’ (the management process to be followed): this aspect will be discussed in chapter 8
(Figure 8-3),
2. ‘Who measures’: for all KPI’s applies that the measurement is the task of the Project Controls
department.
Furthermore, an additional element has been included: the ‘KPI Level’. This element has been included to
indicate whether the data necessary for calculation of the KPI emerges from the Line or the Project
organization. For the Project organization it is also indicated whether the formula requires an aggregation
of data (several projects) or not.
7.4 Conclusions
Historically, the emphasis was on financial factors when measuring organizational performance. The
conducted literature study has indicated that except for these factors, customer, internal business process
and learning & growth factors are also necessary. The Strategy Map argues for a balance between these
factors; however, it does not prescribe the number of CSF’s that each perspective should contain (or what
the balance is between the perspectives in a quantified ratio). It is therefore plausible to state that the
CSF’s of an organization should be balanced ‘fairly’ as long as the needs and requirements vital to the
success of the company are taken into account. These needs and requirements are represented by the
‘Critical’ and ‘Most Critical’ CSF’s (CSF is an abbreviation for Critical Success Factor, but this distinction
was necessary because some were very critical compared to the others). Additionally, 2 CSF’s have been
assumed to be critical enough: these 2 CSF’s are both experienced as business critical by the
respondents, but the respondents have very diverged perceptions of the measurability. Apparently, some
experience these CSF’s as measurable. The determination of KPI’s for the final CSF’s was a process of
collecting KPI’s for the CSF’s, filtering the KPI’s against the criteria for ‘good’ KPI’s and finally selecting
them based on the 4 ways KPI’s can be approached in organizations. Also, in the process of considering
KPI’s for the CSF’s, some CSF’s have been deleted or separated. To some CSF’s 1 KPI has been
allocated, as for others more than 1 KPI has been allocated. The final result is a performance dashboard
which contains: 9 financial KPI’s, 6 customer KPI’s, 15 internal business process KPI’s and 3 learning &
growth KPI’s.
So far, KPI’s on strategic level have been discussed; the operational and diagnostic levels are discussed in
the next chapter. These levels are necessary if a company wants to use the performance dashboard for
management purposes; however it is crucial that performance measurement on strategic level is first in
place. Also, other aspects of actually using the dashboard for management purposes will be discussed in
the next chapter.


54
8 WHAT TO DO WITH THE KPI’S?
‘What to do with the KPI’s?’ To answer this question it is firstly necessary to analyze how the KPI’s can be
used to improve performance. As mentioned earlier in the conclusions of chapter 3, the following
requirements of performance measurement would be discussed in this chapter:
1. Performance measurement must aid the decision-making process (provability, explainability,
believability, communicability).
2. Measurement information needs to be acted upon within the time frame needed for market survival
(latency: propagation and response).
3. Performance measurement needs to operate self-reflexively and largely below the threshold19
of the
firm's awareness (adaptability, measurability, autonomic).
(1) How to enable performance measurement to aid the decision-making process? The Strategy Map
provides partly an answer, namely by establishing and validating cause-and-effect relationships between
the KPI’s. A complete answer to this question can be given by analyzing the current KPI issues at CB&I
Lummus: there are no consequences following from not meeting KPI targets. Why is that? A quick scan
provides a straight forward explanation: the KPI’s are not assigned to individuals. This is more a cultural
issue and the question should be: how can we make (a) persons accountable for (a certain) KPI’s?
(2) How to act upon the results of the KPI’s within the time frame needed for market survival and (3) how
make sure that performance measurement operates self-reflexively and largely below the threshold of the
firm's awareness. This chapter provides an answer by the design of an ongoing process for performance
measurement and improvement.
Secondly, in order to answer the question ‘what to do with the KPI’s?’, a more practical approach is
necessary. This thesis provides CB&I Lummus with KPI’s and also indicates how these KPI’s can be used
to improve performance. However, a gap between these design attributes and actually using these
attributes remains, namely an implementation plan.
Based on the introduction above, the first section of this chapter will discuss the cause-and-effect
relationships, followed by the second section with discussions of how to create accountability for KPI’s.
The third section elaborates on the ongoing character of performance measurement and the fourth section
gives a detailed implementation plan.
Up till now performance measurement has been promoted as a tool that can not be neglected by
companies. Performance measurement is indeed a powerful tool, but is it safe to grant ‘carte blanche’ to
this tool? The last section will therefore discuss reservations on the use of KPI’s for management
purposes.
8.1 Establishment and validation of cause-and-effect relationships
By defining cause-and-effect relationships it is expected that the KPI’s are not only used for monitoring
purposes, but actually enhances decision making. However, cause-and-effect linkages of outcomes are
not easily established. The outcomes can, and often do, reveal the impact of a program20
, but without
collaborating data, it is difficult to demonstrate that a certain program was the cause of the outcome(s). To
determine the extent to which a program has affected the outcomes and to measure the impact, an in-
depth analysis is needed (Artley and Stroh, 2001).
Eccles and Pyburn (1992) state that for successful performance measurement it is imperative to develop a
comprehensive model that (1) establishes and (2) validates causal relationships. A technique to establish
relationships between KPI’s is System Dynamics (SD). Wolstenholme (1990) defines System Dynamics as
a method to qualitatively describe, study and analyze complex systems21
in terms of the processes,
19
The point at which something begins to take effect or be noticeable (source: www.thefreedictionary.com). 20
A “program” may be any activity, project, function, or policy that has an identifiable purpose or set of objectives. 21
An organized collection of parts (or subsystems) that are highly integrated to accomplish an overall goal
(McNamara, 2005).

55
information, organizational boundaries and strategies, which facilitates quantitative simulation modeling
and analysis for the design of system structure and control (in Pruyt et al, 2008). The SD-models can be
developed and used to represent, analyze, and explain the dynamics of a complex system (read:
organization). In an organizational environment it should be kept in mind that the structure of the system
not only contains physical aspects, but also the policies and traditions important to the decision-making
process in that system.
The dynamics or behavior of a system is defined by the structure and interactions of its components. So,
SD-modeling helps to perceive and understand how different factors are interrelated, instead of viewing
each in isolation. However, it does not provide explicit evaluation of these interactions and alternate path of
actions to the decision makers (Santos et al., 2002). To overcome this, the earlier mentioned classification
in section 5.3 can be used:
� Level 1: Headline Indicators; provide a measure of the overall, rude state of health of a firm.
� Level 2: Operational Indicators; bear on specific aspects of a firm’s activities and should enable
management to identify and focus on specific areas for improvement.
� Level 3: Diagnostic Indicators; provide information on why certain changes may have occurred in the
headline or operational indicators and are useful in analyzing areas for improvement in more detail.
The assumption of this classification is that when working with performance measurement, the big picture
should be bared in mind first and then the focus can be concentrated on the pieces that fit into that picture.
The classification can be used to test and validate the hypothetical cause-and-effect relationship, but these
relationships need to be developed based on theory or knowledge. Before testing the relationship itself, the
directionality of the relationship needs to be understood.
Headline, Operational and Diagnostic indicators can be used to test and validate the hypothetical cause-
and-effect relationships, which have been developed by using the System Dynamics modeling technique.

56
Figure 8-1 Strategy Map/ Cause-and-effect relationship diagram for EPC Contractors
57
So, the first step towards establishing the causal relationship is development of a SD-model that captures
the hypothesized causal relationships between KPI’s. Based on the extensive analysis of the EPC
Contracting Industry in general (and CB&I Lummus specifically), the information derived from literature
studies (for example the basic Strategy Map as given by Kaplan and Norton) and the in-house surveys, the
relations between the KPI’s are given in Figure 8-1. This figure explains the allocated KPI’s affecting the
EPC Contracting organization (the different colors indicate the perspectives of the Strategy map). It
captures interactions and directionality between various KPI’s that affect the organization. Also, it captures
the dynamic between various activities and outcomes (causal/ feedback loops). A positive (reinforcing)
loop generates exponential growth or decay and a negative (stabilizing) loop corresponds to a goal
seeking behavior (Forrester (1968) in Tu et al, 1997). Consider, for example, causal loop 1 in Figure 8-1
(red arrows).This loop captures the reinforcing dynamic between project efficiency and employee
satisfaction. That is, an increase in employee satisfaction is achieved via free cash flow (free cash flow in
this case implicitly assumes more investment opportunities in training employees). An increase in
employee satisfaction, in turn, improves project efficiency, which positively impacts meeting project
conditions. Meeting project preconditions improves repeat business, which leads to increased revenue and
consequently better earnings; and eventually increasing free cash flow (implicitly leading to more
budgetary allowance for training). Similarly, loop 2 represents the impact of future net cash flow on
employee satisfaction. Thus the SD-model enables the understanding of hypothetical indirect and direct
KPI’s affecting the organizational performance.
‘Employee Satisfaction Index’ has a central role in both loop 1 and 2. From this can be concluded that the
satisfaction level of employees is critical for the EPC Contracting business. This complies with earlier
statements in this study (see for example section 5.1.2.1).
The relationships have been determined on the basis of theoretical and practical knowledge. However,
these relationships are not final, but potential. Therefore, the relationships are subject to be tested
thoroughly in additional research, for example using the Delphi method. This method will enlarge the
reliability of and, if necessary change, the interactions between the KPI’s by collecting and distilling
knowledge from a group of experts within the EPC Contracting Industry. Additionally, it will facilitate the
formation of a common group understanding and increase the basis of support.
Developing the cause-and-effect relationship between KPI’s and understanding their behavior based on
these interactions is necessary but not sufficient for decision makers. It is required for them to validate
these relationships and better understand the precise impact of each performance outcome on
interdependent performances. To better explain the relationships and variance in performances due to
interactions, the second step is classification of the KPI’s into the levels headline, operational and
diagnostic. The identified KPI’s are directly related to the organization’s strategy and/ or directly contribute
to the organization’s strategic objectives. Therefore, the identified KPI are not all headline indicators, but
some of them are also operational and diagnostic KPI’s.
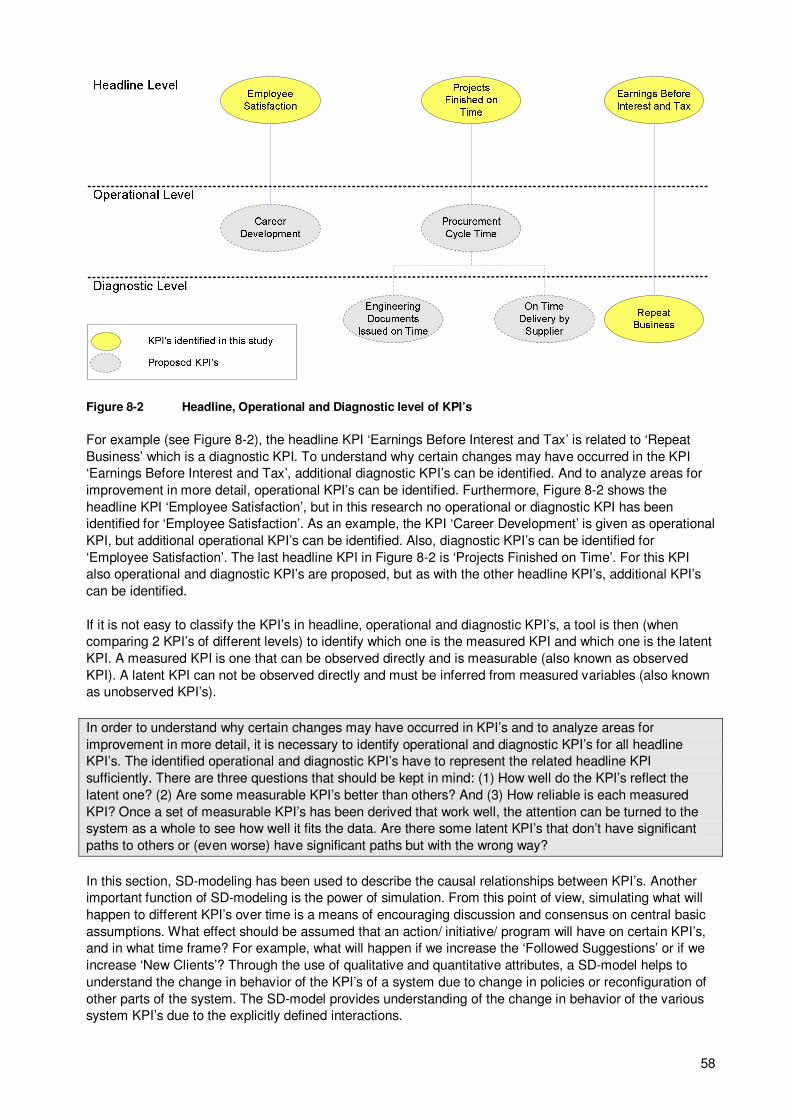
58
Figure 8-2 Headline, Operational and Diagnostic level of KPI’s
For example (see Figure 8-2), the headline KPI ‘Earnings Before Interest and Tax’ is related to ‘Repeat
Business’ which is a diagnostic KPI. To understand why certain changes may have occurred in the KPI
‘Earnings Before Interest and Tax’, additional diagnostic KPI’s can be identified. And to analyze areas for
improvement in more detail, operational KPI’s can be identified. Furthermore, Figure 8-2 shows the
headline KPI ‘Employee Satisfaction’, but in this research no operational or diagnostic KPI has been
identified for ‘Employee Satisfaction’. As an example, the KPI ‘Career Development’ is given as operational
KPI, but additional operational KPI’s can be identified. Also, diagnostic KPI’s can be identified for
‘Employee Satisfaction’. The last headline KPI in Figure 8-2 is ‘Projects Finished on Time’. For this KPI
also operational and diagnostic KPI’s are proposed, but as with the other headline KPI’s, additional KPI’s
can be identified.
If it is not easy to classify the KPI’s in headline, operational and diagnostic KPI’s, a tool is then (when
comparing 2 KPI’s of different levels) to identify which one is the measured KPI and which one is the latent
KPI. A measured KPI is one that can be observed directly and is measurable (also known as observed
KPI). A latent KPI can not be observed directly and must be inferred from measured variables (also known
as unobserved KPI’s).
In order to understand why certain changes may have occurred in KPI’s and to analyze areas for
improvement in more detail, it is necessary to identify operational and diagnostic KPI’s for all headline
KPI’s. The identified operational and diagnostic KPI’s have to represent the related headline KPI
sufficiently. There are three questions that should be kept in mind: (1) How well do the KPI’s reflect the
latent one? (2) Are some measurable KPI’s better than others? And (3) How reliable is each measured
KPI? Once a set of measurable KPI’s has been derived that work well, the attention can be turned to the
system as a whole to see how well it fits the data. Are there some latent KPI’s that don’t have significant
paths to others or (even worse) have significant paths but with the wrong way?
In this section, SD-modeling has been used to describe the causal relationships between KPI’s. Another
important function of SD-modeling is the power of simulation. From this point of view, simulating what will
happen to different KPI’s over time is a means of encouraging discussion and consensus on central basic
assumptions. What effect should be assumed that an action/ initiative/ program will have on certain KPI’s,
and in what time frame? For example, what will happen if we increase the ‘Followed Suggestions’ or if we
increase ‘New Clients’? Through the use of qualitative and quantitative attributes, a SD-model helps to
understand the change in behavior of the KPI’s of a system due to change in policies or reconfiguration of
other parts of the system. The SD-model provides understanding of the change in behavior of the various
system KPI’s due to the explicitly defined interactions.

59
By simulating the KPI’s according to the determined causal relationships, business processes can be
viewed more dynamically. It is of course not possible to predict the future, but better decisions can be
made for the future by using simulation tools to test different decision alternatives (‘what if’ scenarios) as a
basis for discussing how the future might look.
One of the tools to simulate a system by using System Dynamics is PowerSim Studio. This tool will not be
discussed further; more information can be retrieved from the site www.powersim.com.
8.2 KPI’s and Accountability
How can we make (a) persons accountable for (a certain) KPI’s?
8.2.1 Accountability at CB&I Lummus
What is accountability? Accountability refers to the obligation assumed for the execution of authority and/
or the fulfillment of responsibility (Artley, 2001). This obligation means:
� Reporting on the results of that execution and/ or fulfillment;
� Answering (providing an explanation or justification) for the execution of that authority and/ or
fulfillment of that responsibility;
� Assuming liability for those results.
The obligation mentioned above arises from the side of individuals, groups, departments or organization to
which the authority and/ or responsibility has been assigned (the obligee). On the other side, an audience
is required (obliger). An audience is made up of other parties in an organization such as colleagues,
superiors and/ or clients, that observe the individual’s behavior, evaluate it and have the authority or power
to reward or punish him or her, based on the outcomes of his or her performance (Turusbekova, 2007).
The audience also has responsibilities towards the obligees:
� Task Clarity; clear standards which reflect the preferences and performance expectations of the
audience (which makes unambiguous what exactly needs to be accomplished). Issues will arise when
language in an accountability policy or procedure is vague and subject to interpretation (or
misinterpretation).
� Personalized Responsibility; implies that responsibility should be unique or, in other words, belong
exclusively to the agent, rather than being dispersed, shared or undefined.
� Feedback provided by the audience to the obligee regarding his or her task performance. If staff
members are not being told how accountable they have been, they cannot be expected to improve.
� Ensurance that accountability is commensurate with authority: if an employee is made accountable for
a process, he or she is given the tools/ resources necessary for oversight and intervention.
The audience also needs to have Power; accountability implies monitoring and evaluation by the audience
and having to justify one’s decision or actions in front of it. Audience Power makes its evaluation
meaningful to the obligee, since positive or negative consequences for the obligee are contingent upon this
evaluation. This implies that on the basis of this Power, obligees can be punished when targets are not
met. Or, approached from another point of view, meeting targets can be rewarded with incentives. If the
audience decides on a policy of rewards or punishment, it should not misuse this as fear tactics to motivate
people. This may include repercussions or denial of incentives for failing to meet a goal. Secondly, the
reward levels should not be the same (incentive according to performance). When the reward levels are
generally the same for everyone, there is less incentive for the non-producer to produce. No one is really
held accountable for poor performance; rather, he or she is rewarded for it (bad performance is rewarded
equally with others who perform well). Consequently, this system will become a demotivator for the well
performers, and eventually they would leave to seek a more equitable accountability system or begin to not
perform at the same level, and at the same time it gives no incentive for poor performers to improve.
Finally, whether it is compensation or punishment, accountability systems that strive to make every
circumstance equal usually do not work. Circumstances may affect the magnitude and severity of the
consequences of the decision, the rationale for the decision, the accuracy of the information provided to
make the decision, and the tenure and experience of the person making the decision. If there is no
reference to previous circumstances, then punishment is doled out the same for everyone regardless of
the actual performance.

60
Accountability in the organization enables the audience to manage the organization with KPI’s by linking
punishment or incentives to (not) meeting KPI targets. In this policy the audience as well as the obligees
have their obligations and responsibilities. A basic set of rules is given above to deal with punishments or
incentives of which the conclusion is that an accountability policy will inspire workers to perform by making
efforts in differentiation and not by maintaining equity. However, concluding negative or positive
consequences from (not) meeting KPI targets can be a very sensitive and emotional issue, whether it is at
the corporate level or on project execution level. Reservations are therefore necessary, less emphasis on
individual reward and punishment is required. A good accountability policy will focus on the goals of the
organization as opposed to individual punishments and rewards (the emphasis should be on the process
instead of in the people, the question is what went wrong and not who’s too blame). Such a policy
recognizes the synergistic effect that must take place, in which the efforts of many will be greater than the
strides of a few.
Typically, issues with accountability usually arise when something has gone wrong and the culture seeks a
person to blame. But, the goal of accountability is to improve performance, not to place blame and deliver
punishment. In spite of this fact, some may look at accountability in a negative way and as something to be
avoided instead of as a useful management tool22
. According to Smith (cited in Zairi, 1994), when using
performance measurement as a punitive measurement system, 'the reality of measuring unconstrained
human behavior is that the act of measuring a particular indicator will induce behaviors which have as their
objective the maximization of the performance of the indicator, virtually regardless of its effect on the
organization as a whole.' Using performance measurements as a punitive measurement system, a way to
catch employees doing something wrong and to punish them, will also lead to employees feeling not very
committed and not very loyal. It decreases employee performance (and this is very important in the EPC
Contracting business, see section 8.1), which in turn decreases organizational performance.
Artley (2001) takes over Conners’ et al (1994) argument, who, in order to offer a solution, make a
distinction between reactive and proactive accountability:
� Reactive accountability; based on the ‘command and control’ approach to management. In this
scenario, accountability is not a relationship, but, instead, a one-way street with management telling
subordinates what to do and then confronting them when results were less than expected.
� Proactive accountability; the focus is on improving performance. In this approach, accountability is a
relationship and process through which performance expectations are planned, defined, and
negotiated at the outset; resources are allocated; performance is evaluated; and adjustments/
corrections are made as necessary. In this process, the obligee is actively involved in each of these
phases. This could also mean that the control should be given to those held responsible for
performance and improvement and all “interested” parties involved in the process.
Obviously, proactive accountability is preferred, combined with the incentive scenario: this will create a
basis upon which positive or negative consequences can be allocated which will be acceptable for the
obligees. With regard to the KPI’s identified in this research, Company Management of CB&I Lummus is
accountable (the obligee). As Company Management they have the obligation mentioned above towards
CB&I total, which is the audience. The KPI’s have to be assigned to the functional Directors of CB&I
Lummus: Projects & Construction, Engineering, Procurement, Finance, TQM/ HRM, HSSE and Business
Development. Every accountable director is also responsible for further elaboration of KPI’s to the
departments and projects for which they will be the audience in turn.
8.2.2 Single Point Ownership of cross-functional KPI’s
Ideally, every KPI needs to be owned by a single owner. For most of the KPI’s, it’s possible, but there are
KPI’s, where there are multiple functions contributing to its success. So, in the process of assigning
accountability of the KPI’s to the Directors, a problem can arise in the establishment of a single point
obligee, e.g. cross-functional KPI’s. Especially with regard to KPI’s which arise out of inter-team
cooperative effort. It is therefore crucial to drive a single point ownership while ensuring a collective effort.
22
In the text in this section it is probably more appropriate to talk about liability in stead of punishment. But this has not
been changed, because it indicates the opposite of reward.

61
The following question then arises: how to assign a single KPI owner for KPI’s which are linked to more
than one function, for example projects, sales, finance, etc. Typically, within an organization, people would
like to be held responsible for their part of work. The reality, however, is that as organizations move
towards working more on effectiveness, the cross-functional linkages around KPI’s only increase. The
following methods are supplied to assign a single owner of a KPI, while still having a manageable political
basis (Gupta, 2009):
� Empower the KPI owner; the KPI owner needs to be empowered, so that he can hold the 'contributing
functions' on accountability towards their piece within the KPI, e.g. he should be able to connect with
other functions and ask for the 'what, why...' aspects of their performance related to the KPI.
� Assign a more senior KPI owner for the cross-functional KPI; the reason is that the seniority assumes
higher gravitas. The other reason is that due to multi-functional ownership, he will be having a greater
proportion of ownership to the KPI.
� Make the KPI skewed towards the KPI owner; the KPI can mostly be linked to the performance of the
KPI owner’s function.
� Shift the responsibility regularly; the ownership of a KPI can be shifted across the functions on a
quarter to quarter or year by year basis. There is no harm in trying this, as it provides a good
perspective to the KPI owner function of the other contributing functions.
8.3 Iterative and adaptive character of performance measurement
Performance measurement is a dynamic phenomenon; it is subjected to internal and external changes. In
order to keep the measurement effectively, the organization has to learn from it. Figure 8-3 below
visualizes the iterative procedure that the company needs to apply to not only measure performance and
act on KPI target deviations, but also to adapt changes in these KPI’s and their targets and even in work
processes.

62
Organiza-
tional
Objectives
Meets Target
Design KPI’s
Measure
Performance
Evaluate and
utilize
Performance
Information
Set KPI Targets
Analyze and
review
Performance
Data
Establish
Accountability for
Performance
YES
Alternative I
Review Target
Alternative II
Review KPI
Alternative III
Take corrective
Action
Alternative IV
Challenge
Strategy
Work
Processes /
Procedures
Allocate positive/
negative
Rewards and
Recognition
YES
YES / NO
Shows a negative
Trend
NO
NO
Figure 8-3 Ongoing process of performance measurement and improvement (source: author)

63
The procedure starts with the design of KPI’s and the targets allocated to these KPI’s. This was part of the
scope of this thesis. After that accountability is needed for each KPI, as discussed thoroughly in the
previous section of this chapter. Once these steps are taken, the actual measurement can start. Based on
the analysis and review of the produced measurement data, it can be evaluated what information can be
filtered from it. The next step therefore is how to utilize the gained information? It starts with the KPI
targets: if the targets are met, the assumption is that the related CSF is performing well. No action is ten
required and the KPI can be measured as it is in the next round. If KPI targets are not being met, it is
obvious something is wrong. However, this is not a reason to immediately intervene. Only if from multiple
measurements can be concluded that a KPI shows a negative trend, action is required. If a negative trend
is not determined, no action is required and the KPI can be measured as it is in the next round. A negative
trend itself does not always provide the reason. Instead, it raises a flag requiring investigation. Possibilities
include performance expectations that were unrealistic or not well defined KPI’s. These 2 possibilities need
to be taken into account prior to investigating other possibilities.
When changing KPI’s, a challenge appears in the normalization of the time series data. If measurement
definitions change (frequently), it makes it difficult to normalize the same KPI over the period of time.
The third possibility is that of taking corrective action(s) in work processes/ procedures. Before any
program is launched to facilitate corrective action, investigation is necessary with regard to the related
operational and diagnostic KPI’s. Because when deviations occur in the values of KPI’s, it can be firstly
pinpointed in which KPI it has occurred and then how it is (directly) interrelated with other KPI’s. This will
give a better insight of the problem area (it will enable the company to explain performance results and to
define and address the contributing factors), on the basis of which a program can be launched. If one or
more programs are determined, the cause-and-effect relationships need to be taken into account, as
discussed in the first section of this chapter. This will indicate how any program will influence other KPI’s. If
modeling the cause-and-effect relationships shows that no improvement is being achieved or actual
implementation of the programs over time does not show improvement, the final alternative is to challenge
the strategy and the related strategic objectives and work processes/ procedures. The principal of a
learning organization requires then an adjustment in the design of the KPI’s. A negative trend is also the
trigger for a company to award incentives or penalties, depending on the accountability policy chosen for,
according to the second section of this chapter.
The continual process in Figure 8-3 is an ongoing process that should become a routine for the company.
It should be kept in mind that also for this process holds that it is subjected to changes where necessary.
The sections above have discussed topics related to managing the company with KPI’s. The next section
will elaborate how to implement the whole concept of KPI’s and its purposes.
8.4 Implementation Plan
A well designed KPI-concept can still fail in the implementation phase. The failure is usually due to the lack
of communication and coordination across the functional barriers or due to the lack of attention for those
parts of the organization which are subject to change. An answer to this failure is the development of a
pragmatic implementation plan, which starts with the awareness of needing KPI’s up to implementation
and usage of KPI’s. For every step it has been indicated whether CB&I Lummus still needs to do it or
already has done it. Most of the aspects in this section have already been issued in this thesis, but are now
presented in defined steps to be taken.
The implementation of this KPI-concept begins at the top. The General Manger and the Director Projects
must be aware of the need for a KPI-concept. A clear defined need for KPI’s is a requirement for the
design. In interviews prior to the elaboration of this thesis, this awareness was confirmed. Also, the
General Manger and the Director Projects must be 100% sold on and committed to leading and supporting
the process. Based on the interviews with the General Manger and the Director Projects, it can be
concluded that they fully support a KPI-concept (they are also the sponsor as it fits perfectly with the
responsibilities they have).

64
Their following step has been the delegation of the process facilitation task to the Director Project Services.
But this will work only after the General Manger and the Director Projects have succeeded in committing
the entire Company Management Team; all members need to be an integral part of the early KPI-concept
development process. Also, Project Managers and Department Managers need to be an integral part of
this process. In this thesis, these groups have been involved early in the development process by
interviewing them and by means of the survey. Although the respondents were positive with respect to a
(new) KPI-concept, these tools are not sufficient. These groups need to learn (more) about performance
measurement, understand and believe the process will add value and commit to leading their functional
teams through the process.
From this point on, the General Manger and the Director Projects also need to delegate the task of forming
a steering committee to the Director Project Services. The Director Project Services will be the chairman of
this committee. The required resources should be made available. A possibility is to use consultants as
facilitators of the entire implementation process in order to help build consensus and commitment amongst
all managers (it can also help overcome internal resistance to change). Also, all members of this
committee need to be educated with respect to performance measurement knowledge. A possibility is to
organize a workshop where this thesis can function as reference material.
Once the required level of team commitment has been achieved, the initial requirements can be assumed
to be completed. The steering committee will next write the action plan and, when ready, the action plan
can be presented to all managers.
For all companies holds that the initial requirements of the development of a KPI-concept are:
a. Awareness of the need for a KPI-concept (responsible: the business owner/ top leader). b. The business owner/ top leader must be 100% sold on and committed to leading and supporting the
development process. c. Commitment of all management groups in the early KPI-concept development process (responsible:
the business owner/ top leader). d. Establish a KPI implementation steering committee. The process facilitation task can be delegated to a
member of the company management team or to a consultant (responsible: the business owner/ top leader).
e. Enhance performance measurement knowledge of the steering committee members (responsible the business owner/ top leader).
f. Write and present action plan (responsible: steering committee).
With the requirements as described above as a starting point, the following implementation steps need to
be taken in the KPI-concept development process (these should be part of the action plan mentioned
above):
1. Create the vision and strategy (responsible: the business owner/ top leader) Actually, performance measurement is not really about developing the vision and strategy; its value is
in ensuring execution of a strategy which is already in place (which was the case in this thesis). Before
implementation, however, it would be very wise to use the initial management team consensus
building process described above as an opportunity to clarify and re-state the organizational vision and
strategy. In this thesis the strategic plan of CB&I Lummus was already in place and has also been
used as a source for important factors.
2. Identify and define the Critical Success Factors: what should we measure? (responsible: joint effort of all mangers, execution: steering committee) These are the factors that will drive the company towards long range success. These factors should
cover the four perspectives of the Strategy Map: financial, customer, internal business process and
learning & growth. There are a lot of factors which are important to a company, the key is to retrieve
those that are (the most) critical. This should be done by determining to what extent the company
perceives a factor (1) business critical and (2) measurable. In the case of CB&I Lummus, this has been
executed by a delegated person, namely the author of this thesis.
3. Design the strategic level Key Performance Indicators: how should we measure? (responsible: joint effort of all mangers, execution: steering committee)
65
The goal of this step is to allocate Key Performance Indicators to the determined Critical Success
Factors in the previous step. The steering committee can help by studying the business and facilitating
a team process to create the KPI’s. The steering committee should take the responsibility to determine
that the final dashboard is valid, i.e., that the CSF’s are represented sufficiently. In the case of CB&I
Lummus, this has been executed by a delegated person, namely the author of this thesis. As also
done for CB&I Lummus, the KPI’s need to be ‘good’ and need to be elaborated in a structured way by
using the Performance Measure Record Sheet.
4. Create infrastructure for data collection (responsible: the business owner/ top leader or the process facilitator). This is the phase in which systems and procedures are put in place to collect and process the data
that enable the measurements to be made regularly. This may involve computer programming to trap
data already being used in the system and present them in a more meaningful form. It may involve
initiating new procedures, so that information currently not recorded is captured and it may involve
completely new initiatives, such as the setting up of a regular employee survey.
5. Establishment and validation of cause-and-effect relationships (responsible: steering committee for establishment and company management team for validation). KPI’s need to be linked in order to create cause-and-effect relationships. By representing them in a
causal diagram, it will become clear how KPI’s influence each other. A System Dynamics model can
be used to simulate different scenarios. Recommended is to delegate the set-up of a System
Dynamics model in a software program to an outside expert. In this thesis, initial cause-and-effect
relationships have been defined.
6. Make individuals accountable for the strategic level KPI’s: the functional directors (responsible: the business owner/ top leader in joint effort with the functional directors) A key implementation step is to design and announce an accountability policy with a reward and
recognition system for the company and directors in achieving the KPI targets. Getting creative here
and sending the message that management is serious and employees can earn rewards (in a later
stage) for progress will give the process its due attention. A proactive accountability policy is
recommended.
7. Cascade the strategic level KPI’s (responsible: steering committee as facilitator, execution by managers in joint effort with their teams). This step is cascading strategic level KPI’s down through the organization. Cascading involves
functional teams taking the strategic level KPI’s and breaking it down to KPI’s relevant to more
functional day-to-day work. It is recommended that all mangers drill down for ideas by involving their
respective groups in making KPI proposals. A distinction is necessary between headline, operational
and diagnostic level KPI’s. This results in KPI sets for functional or departmental work groups and
offers a larger meaning to their day to-day work. All KPI’s should fit into the System Dynamics model
(to be facilitated by the System Dynamics modeling expert). The managers should be accountable for
these KPI’s.
8. Educate and communicate to stakeholders (responsible: the business owner/ top leader, input from steering committee) In this step all employees are informed what is going on. This company communication meeting is to
introduce what the steering committee has been working on. CB&I Lummus can make use of the ‘All
Employee Meeting’ held by the General Manager. It is a chance for him to not only present the KPI
concept and the implementation plan, but to also emphasize the company strategy and vision. The
goal of this communication process is to convince every staff member that their work and
responsibilities make a difference. They should see in the presentation KPI examples of their day-to
day functional work being targeted and with progress to be monitored. Ultimately, they should make
the connection that what they do is linked (through the strategy) to the vision and long term goals of
the company.
9. Continuous execution of measurements and review of progress (responsible: delegated employee for execution and managers for communication)

66
Another key implementation step is to continuously review and communicate progress towards the set
targets. This means developing a system to (1) measure and report progress to management and (2)
for management to keep employees informed through regular employee meetings or written
communications. This lets everyone know the leadership is serious about the strategic vision and that
it will monitor the steps to get there.
10. Based on the progress review, company management can now make decisions, which should be communicated to all employees. These decisions can be taking corrective actions in business processes, but can also be changing/ updating/ refining KPI’s, their targets or even challenging the strategy.
11. The ‘last step’ in the implementation is to realize that there is no last step in this process of continuous measurement and improvement. The closed feedback process advised in this thesis means the process never ends (responsible: company management team). This means that company management reflects once a year on the KPI concept. They need to determine whether the proposed KPI concept in this thesis is successful or not. They should analyze on which ways the concept can be improved. Did it really lead to taking the correct decisions? Is it easy to use? Is it fully embedded and implemented in the organization?
It should be noted that these phases of design, implementation and use are conceptual. This is the
sequence of phases through which the KPI concept should progress. However, the phases can overlap as
different individual KPI’s are implemented (and revised) at different points in time. Thus, some KPI’s
(especially the strategic KPI’s) can be implemented before all the KPI’s have been completely designed,
and it could also happen that there is an overlap between implementation and use.
Based on the general implementation plan above, the following steps are still to be taken by CB&I Lummus
(assumption is that this thesis has covered the other steps):
� All manager groups need to learn about performance measurement and understand and believe that the process will add value (responsible: General Manger and the Director Projects). Also, the manager groups need to commit to leading their functional teams through the development process. This thesis can function as guide and reference in this part of the process.
� Establishment of a KPI Implementation steering committee (responsible: Director Project Services). � Enhance performance measurement knowledge of the steering committee members (responsible:
Director Project Services, facilitator: consultant). � The action plan can be written and presented (responsible: steering committee) � Create infrastructure for data collection (responsible: Director Project Services). � Empirical testing of the causal relationships established in this thesis (responsible: company
management team, facilitated by the steering committee). � Define accountability policy (responsible: General Manger and the Director Projects) � Identification of operational and diagnostic KPI’s for all headline KPI’s (responsible: steering committee
as facilitator, execution by managers in joint effort with their teams). � Inform all employees what is going on in one of the ‘All Employee Meeting’ held by the General
Manager (responsible: General Manager, input from steering committee). � Continuously execution and review progress (responsible: project controls engineer for execution and
managers for communication). � Based on the progress review, company management can now make decisions, which should be
communicated to all employees. � Company management needs to reflect once a year on the KPI concept.
The implementation plan above has been designed by considering the 4 central requirements to which a process design should comply, according to de Bruijn et al. (2002). They state that a process (1) needs to be open, (2) offers protection of the core values of stakeholders, (3) has sufficient stimulation for progress and (4) offers sufficient guarantees for the quality of the results.
In the 4 sections above the discussions concerned designing, using and implementing KPI’s, but what are
the side effects when managing with KPI’s? The next section will elaborate on this.
67
8.5 Reservations on managing with KPI’s
Performance measurement is not a neutral activity and can lead to all sorts of side effects. Therefore,
performance measurement needs to have a clear purpose: is it about making critical business decisions
that will in turn drive business improvement or is it about assessing managers? It should be kept in mind
that KPI’s are means and not goals. KPI’s are never unconditionally reliable; there are several risks when
using KPI’s in organizations.
Numerical quotas
There is a danger when performance objectives become numerical quotas. The setting of numerical goals
and quotas does nothing to accomplish improvements in the process. Identification of the challenges and
changing the processes are what is needed to improve performance and achieve desired outcomes.
Sometimes data can also be summarized so much that it becomes meaningless. If business decisions are
going to be based on the data, then the data needs to be reported clearly and understandably. In collecting
data it should be prevented to collect inconsistent, conflicting or unnecessary data, all data should lead to
some ultimate measure of success for the company.
Manipulation
Performance measurement provides a valuable tool for management and continuous improvement.
However, people might try to “game” the system in a way that will make their programs look good (people
manipulate the KPI to hide bad performance): ‘what gets measured, gets improved’. Additionally, accurate
data may not be available. These are among the reasons why the need exists to recognize the fact that the
measured factor is not the same as the actual factor.
Resistance
Working with people makes it inevitable that there will be resistance to the performance measurement
process. Performance measurement may expose weak areas in employee performance and it also carries
along that ‘accountability factor’. The only way to deal with resistance is by involving employees in the
performance measurement process from start to finish. Another aspect of resistance occurs if one person
or a group of people may consider the performance measurement area to be a part of “their territory” and
therefore will not want to relinquish control to anyone else.
Actually using the data
At the end of the performance measurement process, a lot of data has been collected. Managers should
not fail to base business decisions on the data. A lot of managers make decisions based on intuition and
past experience rather than the data being reported to them. If the data is valid, it should be used
appropriately: the purpose of a performance measurement system is not merely to collect data but rather
to collect data upon which to make critical business decisions that will in turn drive business improvement.
Tunnel vision
Tunnel vision comes after measurement data has been collected, analyzed, and reported. It happens when management focus only on one piece or area of measurement data on which to base their decisions, completely forgetting about the consequences of doing so. They either fail to take into account other measurement areas or completely ignore those areas which can not be expressed in measurable terms. When working with performance measurement, the big picture should be firstly analyzed, then the focus can be on the pieces that fit into that picture.
So, what to do? Measure organizational performance or not? Because theoretically, it is possible that an
organization which does not measure performance, actually performs well. And on the other hand, an
organization which measures its performance thoroughly, may actually perform badly. To overcome this
dilemma, it should be realized that without measuring performance, it will always be “possible” to “improve”
performance: it can only not be proven. Consequently, these side effects should not be a reason to not
measure performance.
68
9 CONCLUSIONS AND RECOMMENDATIONS
This research emphasizes that designing a continuous performance measurement method at company
level is imperative to support the management of Engineering, Procurement and Construction Contractors.
Considering this objective (and the related issues) of this research, the thesis has largely been rudimentary
in character by drawing conclusions during the execution of every chapter. This chapter first provides a
summary per issue with the most important and interesting findings, which are therefore worth a reiteration.
The second section issues the recommendations including some suggestions for future study. Finally, the
last section discusses the validity and reliability of this research.
9.1 Conclusions
The research objective has been operationalised with the following central question: “In which
configuration and how can Key Performance Indicators contribute to the measurement and improvement of
the performance of Engineering, Procurement and Construction Contractors?” This central question can be
answered by dealing with each sub-question separately.
The first set of sub-questions is aimed at the enhancement of Key Performance Indicators and
Performance Measurement knowledge. The following sub-questions can be answered:
� “Why do companies need to measure their performance?”
In order to sustain a competitive advantage and therefore to survive as an organization, companies
should be capable of continuously improving their performance. If a company wants to improve its
performance, it will first have to measure what the current performance is. From that point on, the
company can make decisions in order to improve its performance in those areas where needed.
Simultaneously, measuring performance has additional benefits, which enhance the need of it.
When a company decides to measure their performance, it needs to comply with some basic
requirements.
� “What are the requirements for performance measurement?”
When measuring performance, companies should be both internally and externally oriented, the
measurement information needs to meet a certain time frame, the measurement information must aid
the decision-making process and performance measurement should not require too much extra effort.
Performance is measured by Key Performance Indicators.
� “What are Key Performance Indicators?”
Key Performance Indicators are measurable characteristics of products, services, processes and
operations directly related to the organizations’ strategy, that give a good indication of the success (or
failure) of success determining factors that are critical for the execution of the organizations’ strategy.
An organization’s Key Performance Indicators together make up its performance measurement
dashboard.
Key Performance Indicators are approached from different point of views in organizations.
� “What are the views on Key Performance Indicators in performance measurement?”
4 views have been identified. With regard to these views, the identified KPI’s has been balanced fairly:
Implication, Responsiveness, Nature and Location. This is crucial if an organization aims to cover all
important aspects.
Key Performance Indicators have to be ‘good’.
� “What are ‘good’ KPI’s?
Indicators are ‘good’ if they are Specific, Measurable, Achievable, Relevant, Time framed, Valid and
Reliable. Indicators are also ‘good’ when they are well structured. To do this, the Performance
Measure Record Sheet has been used for all KPI’s. Finally, KPI’s are ‘good’ when they are
implemented as part of a broader context.
By answering the question for this issue a set of basic assumptions has been created to function as reference throughout the thesis. Also, requirements have been indicated for measuring performance and criteria have been developed for designing Key Performance Indicators.

69
The second set of sub-questions is aimed at the determination of a measurement framework to analyze
the company performance of EPC Contractors with Key Performance Indicators. The following sub-
questions can be answered:
� “Which frameworks can be used to measure performance?”
In general multiple, seemingly conflicting, measurement frameworks exist because they all add value;
they all provide unique perspectives on performance and approach organizations from a different point
of view to cover business activities. These frameworks all have their strengths and weaknesses; as
long as it is acknowledged that performance measurement should be executed according to a
framework. The last few years several frameworks have been developed: the works of Kaplan and
Norton (the Balanced Scorecard (BSC) and the Strategy Map) and Neely’s Performance Prism are
considered to be the most prominent theoretical performance measurement frameworks.
Organizational performance is closely related to Quality Programs due to the self assessment factor of
these Programs. The EFQM Business Excellence Model and the Malcolm Baldrige National Quality
Program are 2 well known models. Except of these conceptual models, there are also empirical
models. There are 2 relevant empirical models for the EPC Contracting business: (1) a model
designed by the KPI Working Group and (2) a model designed by the Construction Products
Association.
The most effective framework has to be determined.
� “Which criteria are important in the measurement of performance?”
Deciding on which framework to apply should not be done by analyzing which framework fits best to
this specific Industry/ line of business, because the frameworks approach organizations from a high
abstraction level. This means that each framework is applicable to every organization regardless of the
Industry/ line of business they operate in. Deciding on a framework should be done by comparing them
against criteria for effective frameworks. Based on the theoretical review, criteria have been identified.
Frameworks have to be assessed against these criteria to identify the most effective one.
� “Which framework is the most effective one for the evaluation of the performance of an EPC
Contractor?”
When comparing the frameworks against the criteria for effective frameworks, it can be concluded that
the Strategy Map complies most. This conclusion is enhanced by a critical comparison of the
frameworks amongst each other.
By answering the question for this issue, first criteria have been developed for effective measurement
frameworks. And the criteria have been applied on measurement frameworks which resulted in the choice
for a framework.
The third set of sub-questions is aimed at defining a set of Key Performance Indicators that represents the
determined measurement framework for company performance. The following sub-questions can be
answered:
� “What are important organizational features of EPC contractors, specifically of CB&I Lummus?”
There are many factors that seem to be important for the EPC Contracting industry, not only from a
theoretical point of view, but especially from an empirical point of view. Not all of these factors are
equally important and critical enough to be identified as a Critical Success Factor (CSF). However, in a
process of consolidating and filtering of the factors, potential CSF’s have been identified. Additional
information has enabled the determination of the most critical CSF’s. These CSF’s can be balanced
‘fairly’ across the perspectives of the Strategy Map; they take into account the needs and requirements
that are vital to the success of the company.
CSF are measured by using KPI’s
� “What are the Key Performance Indicators that Company Management need to use in order to
evaluate the company Performance?”
The determination of KPI’s for the final CSF’s was a process of collecting KPI’s for the CSF’s, filtering
the KPI’s against the criteria for ‘good’ KPI’s and finally selecting them based on the 4 ways KPI’s can
be approached in organizations. Also, in the process of considering KPI’s for the CSF’s, some CSF’s
have been deleted or separated. To some CSF’s 1 KPI has been allocated, as for others more than 1
KPI has been allocated. The final result is a performance dashboard which contains: 9 financial KPI’s,
6 customer KPI’s, 15 internal business process KPI’s and 3 learning & growth KPI’s.

70
By answering the question for this issue the specific features of the Industry have been indicated. The defined KPI’s are expected to increase the ability to fulfill requirements in line with the organizations policy and objectives.
The last sub-question is aimed at the design of a process/ procedure for continual performance
improvement on the basis of the performance evaluation. The following sub-question can be answered:
� “How can the Key Performance Indicators be used effectively for the management of EPC
contractors?”
The KPI’s are primarily designed on strategic level, but for effective management, the operational and
diagnostic levels are also necessary. By acknowledging these levels, the hypothetical cause-and-effect
relationships can be tested and validated; but initially it is necessary to develop these relationships by
applying the System Dynamics modeling technique. The identification of the operational and diagnostic
level will also increase the understanding with regard to why certain changes may have occurred in
KPI’s and to analyze areas for improvement in more detail. By simulating the KPI’s according to the
determined causal relationships, business processes can be viewed more dynamically. It is of course
not possible to predict the future, but better decisions can be made for the future by using simulation
tools to test different decision alternatives (‘what if’ scenarios) as a basis for discussing how the future
might look. Another aspect of effective management with KPI’s is the introduction of an accountability
policy that will inspire workers to perform by making efforts in differentiation and not by maintaining
equity. However, concluding negative or positive consequences from (not) meeting KPI targets can be
a very sensitive and emotional issue, whether it is at the corporate level or on project execution level.
To cope with this, proactive accountability is preferred, combined with the incentive scenario: this will
create a basis upon which positive or negative consequences can be allocated which will be
acceptable for the obligees. With regard to the KPI’s identified in this research, Company Management
of CB&I Lummus is accountable (the obligee). As Company Management they have the obligation
mentioned above towards CB&I total, which is the audience. The KPI’s have to be assigned to the
functional Directors of CB&I Lummus: Projects & Construction, Engineering, Procurement, Finance,
TQM/ HRM, HSSE and Business Development. Every accountable director is also responsible for
further elaboration of KPI’s to the departments and projects for which they will be the audience in turn.
Another aspect of managing with KPI’s is that this is a dynamic phenomenon; it is subjected to internal
and external changes. In order to keep the measurement effectively, the organization has to learn from
it, adapt changes and make sure that performance measurement becomes an ongoing process in the
company. When managing the company with KPI’s, some side effects occur. But these side effects
should not be a reason to not measure performance because without measuring performance, it will
always be “possible” to “improve” performance: it can only not be proven.
By explicitly creating a procedure, an ongoing process is ensured for performance measurement. This procedure embodies organizational improvements as well as of the improvement processes itself. Also, working according to this procedure allows for identification of improvement possibilities (and evaluation) on a systematic way. Also (for companies in general), based on the knowledge gained in this study, the development process of performance measurement and improvement is given. And by explicitly designing an implementation plan, it is expected that the probability to succeed with the KPI-concept will increase. The implementation plan is aimed at bridging the gap between the developed concept and the actual use of it, because a well designed KPI-concept can still fail in the implementation phase or even in an earlier phase when it is not clear who needs to do what and when.
9.2 Recommendations
The theoretical study at the beginning of this research made clear that it is imperative for organizations to
measure their performance. Although measuring performance (with the existing KPI’s) has not resulted in
significant improvements so far for C&I Lummus and seen the reservations on (using KPI’s for) measuring
performance (which are acknowledged), this study shows that it is possible to use performance
measurement for organizational improvements. But to actually introduce improvements, it is a matter of the
highest importance that organizational performance is measured by using the Key Performance Indicators
as defined in this research. The extensive study, both theoretical and practical, enables the effectiveness
of these Key Performance Indicators and of it’s successful implementation. Successful implementation is
also expected due to the created basis of support during the execution of this study and due to the fact that

71
the company strategic plan ‘lives’ in the organization. Another aspect of successful implementation is that
the information necessary to calculate/ determine the Key Performance Indicators values mostly already
exists in the organization or is collected for other purposes. This complies with the requirement of
performance measurement that it should not require too much extra effort. The information needs to be
collected and then customized in the format required for the KPI’s.
One of the main recommendations following from this study is to apply the Strategy Map as a theoretical
reference (performance measurement) framework. From a theoretical review, the Strategy Map was
adjusted with regard to one of the perspectives. Looking back, the perceived weakness was not that critical
for implementation of the strategy Map. A general advice to others (read: companies operating in other
lines of business) is to see the Strategy Map as a high-level framework, with 4 leading perspectives. The
main items/ issues per perspective as given by Kaplan and Norton are not of crucial importance (they can
function as inspiration source, but are not fixed), as long as Critical Success factors can be determined for
that specific organization. The perspectives exist to ensure that Critical Success Factors are not left out; by
doing this the needs and requirements vital to the success of the company are taken into account.
Another, possibly more, crucial aspect of performance measurement is actually using the Key Performance
Indicators to manage the company. This study discusses the issues which should be taken into account
when doing this. The first issue is viewing Key Performance Indicators in the context of causal
relationships. This will indicate interrelationships between Key Performance Indicators, explain changes in
Key Performance Indicators and reveal areas for improvement. To do this, System Dynamics modeling can
be used, which additionally enables the execution of ‘what if’ scenarios. Secondly, individuals in the
company have to be made accountable for the Key Performance Indicators. This study has already
indicated that the functional Directors are subject to accountability, but they are also responsible for
elaboration of lower level KPI’s and making department and project managers accountable for these,
taking into account the single point ownership of cross-functional KPI’s (one of the Director should be
assigned as the overall implementation coordinator). The last issue is the strong recommendation to apply
the Key Performance Indicators according to the ongoing process of performance measurement and
improvement given in this study (see Figure 8-3). This will enable the recurring periodically execution of the
measurement. Additionally, the procedure functions as a guide in measuring performance.
This study is in the first place intended for CB&I Lummus – The Hague office. The advice is therefore to
implement performance measurement according this research in this office. After a, to be determined
leaning period, the Key Performance Indictors can also be applied in all CB&I Lummus offices. When doing
this it is of importance to standardize the Key Performance Indicators, because this will enable
consolidation for CB&I Lummus overall performance. Another reason to implement the same Key
Performance Indicators in all offices is to create a consistent perception of the company strategy and that
all offices experience the responsibility to contribute to overall company performance (and therefore enable
CB&I Lummus to cope with plural internal strategies). Also, standardized KPI’s will enhance benchmarking
between CB&I Lummus offices. Another recommendation is that the results of this study should not only be
followed by CB&I Lummus, but the results are also applicable and important for the other active parties in
the EPC Contracting business (CB&I Lummus can be assumed to be one of the important/ large player in
this line of business). If other companies have different views on this research, they can at least see this
study as an important source of inspiration. The advantage of standardized KPI’s in the EPC Contracting
business would be that competitors can benchmark their performance amongst each other.
In order to bridge the gap between the developed KPI-concept and the actual use of it, companies are
recommended to implement the concept according to the pragmatic implementation plan designed in this
study (EPC Contractors can skip steps 2 and 3). Specifically for CB&I Lummus holds that a filtered plan
has been designed, because some of the steps have already been fulfilled in the course of this research.
The reader may have noted some possibilities for future research throughout the previous chapters. This
section contains some explicit suggestions for future research that hopefully will encourage others to
conduct studies in order to advance the performance measurement knowledge of the EPC Contracting
Industry. The main focus of future/ additional research should be in the area of empirical testing of the
causal relationships. The relationships are assumed to be potential relationships and are subject to be

72
tested thoroughly in additional research. A positive side effect of this will be that it will stimulate common
group understanding which will increase the probability of successful implementation of this KPI concept.
Related to this subject is the System Dynamics model to be set up for simulation purposes. Secondly, the
focus should be on the identification of KPI’s at each level. The foremost challenge is the determination of
a limited set of KPI’s that can provide a reasonable view of the whole company, with minimum complexity
in creating the model. The reason for this is that the number of measures can quickly run into hundreds,
which make it very difficult for modeling part of the design. The second challenge is availability of the data.
In many cases data on human processes are not collected. Since human-oriented process (learning &
growth) comprises a significant part of the EPC Contractor, it is difficult to explain the variance without
understanding human-oriented processes as well. The third challenge is unifying the KPI’s. In several
cases there could be repetitive collection of same measure at different sources. For example, customer
satisfaction can be measured by the project team as well as the business development department.
Another approach could be to select a subset of KPI’s out of all KPI’s designed in this study. Hypothesizing
the relationships among these KPI’s and validating the relationships using the methods explained in the
conceptual design should then follow (System Dynamics). This can then be considered as a learning
model.
Whether the new KPI concept recommended in this study is successful can only be determined on the long
term. The pay off will be a positive trend in the financial KPI’s (a period of a number of years). The
assumption is that the customer, internal business process and learning & growth KPI’s drive the financial
KPI’s and that the results can only be seen on a longer term. A pre-condition is that management follows
the recommendation in this study and that they take effective decisions based on the KPI measurements.
9.3 Validity & Reliability
Validity of the results if this study is an expression of how well the KPI’s measure the issues actually meant
to be measured, the CSF’s, and how well these CSF’s actually represent the needs and requirements vital
to the success of the company. However, there is no objective way of determining to what extent the KPI’s
and CSF’s are valid or not, in other words, the level of validity has been determined on a subjective basis.
It is reasonable to assume that there is a certain degree of validity, because the questions of the interviews
and surveys have been studied and determined to be ‘good’ in relation to the purpose they serve. Firstly by
review sessions with the client of this study and other knowledgeable persons in the company (these
persons are in one way or another related to organizational performance) and secondly by the author,
meaning executing a test interview/ survey and adjustment afterwards by taking into account the
comments. This indicates a high level of validity, more specifically external validity. Internal validity is also
important: internal validity is the logical relationship between an investigation and the available theory in
the studied area (Verschuren and Doorewaard, 2005). This relationship between existing theory and the
empirical study was established by an extensive review of the literature in the performance measurement
area. The theoretical framework established throughout that review was used as the basis for the research
questions in the interviews/ surveys, as well as when analyzing the results.
Reliability of the results of this study is an expression for the capability of the results to withstand random
effects: research (methods/ techniques) that generates the same or similar results on multiple occasions
have high reliability23
. The use of clearly defined questions in the interviews, as well as in the surveys,
increases the probability of replicating this study. Moreover, the research method is clearly defined and
described in this thesis, and the reliability is also positively affected by the fact that the questions were
tested in a test-interview. Actually, the clearer and more stringent the questions are, and the more
standardized the measurement method is, the higher the reliability.
There are various sources of mistakes affecting the quality of this research in terms of validity and
reliability. It is therefore important to acknowledge that this study is executed in such a way that it
accurately has identified and described the studied subject and the used methods/ techniques. By doing
this a sufficient level of credibility is expected for this study and the following conclusions.
23
Note: it is practically impossible to make several completely consistent investigations, as there will always be a
certain level of random effect in all investigations.


73
10 REFLECTION
Looking and reflecting back on this thesis, the following can be noted:
In the beginning of the thesis I had set a tight schedule for its completion. But gradually it became clear
that in practice it was impossible to meet the set schedule. In my view, the main cause was the fact that it
was not possible to spend as many hours in the study as I had planned for. It is not easy to combine your
private-life with your working-life as well as your study-life. Even the minor irregularities disrupt the
process. Therefore I am pleased that CB&I Lummus made hours available to spend on this study. This
does not alter the fact that many evening and weekends were necessary to complete this thesis. How to
cope with this on forehand? I suppose building float in the schedule and trying to manage the irregularities
as much as possible. Another cause of the delay was the dependence of information (especially input from
the surveys). I guess this can not be avoided; it should be taken into account when scheduling the
research. Intensively expediting is also a possibility, but that is easier said than done: you are dependent
of the respondents and not the other way! In my situation, it was also necessary to maintain a good
relationship with the respondents seen the fact that they are my (direct) colleagues.
Another tension that I had expected when starting this scientific research at CB&I Lummus, was between
my day-to-day activities in the company which is also subjected for study. Would the recommendations
affect my future career? What would the stakeholders in the company think of the quality delivered? Would
this positively of negatively change their view of me? I guess this is something that time will learn. But the
interviews and surveys learned that the stakeholders (respondents) reacted positively that this subject was
researched. I think (and hope) that by involving the stakeholders in the process, the results of this study
will be better with regard to the acceptability.
Surprisingly, there was no tension between my current function and the topic of study. I have not been
frustrated internally in any way, I received all necessary cooperation. I have not experienced any feelings
of restraint during execution and in the conclusions and recommendations. I think this is caused by the fact
that the conclusions and recommendations do not directly affect individual employees (in negative sense).
Individuals will come more in the picture when specific KPI’s are assigned to them and for which they are
accountable.
The initial assignment from the company was to revise the existing KPI’s. But we soon noticed that this
was to narrow and scientifically not well based. Fortunately, the company and I came to an understanding
that the topic embodied much more which led to adjusting the research objective and questions.
At approximately half way of the thesis I wondered whether I did not spent too much time and energy in the
theoretical and set-up issues. Regularly I questioned myself: is it really necessary? But in the later phases
this time and effort seemed to pay off. Relatively less time was spent in these phases (except for the
execution of the interviews and surveys and the processing of it). So, it is worth wile to invest a lot of time
and energy in the starting phases of a research, this will create a solid basis to elaborate on further in the
research.
The last notion concerns the language of this thesis. For this thesis English is not required, Dutch is
sufficient. I knew that doing it in English increased the level of difficulty, but there were 3 reasons to still
execute in English: (1) the company language is English, (2) I expected to develop my English skills and
(3) most of the sources used are in English.


74
11 REFERENCES
� Aalberts, M. et al (1999), Waarom Prestatie-indicatoren falen, ’s-Gravenhage: Ministerie van BZK.
� Ahaus C.T.B. and Diepman, F.J. (1999), Balanced Scorecard & Model Nederlandse Kwaliteit,
Deventer: Kluwer.
� Artley W. (2001), The Performance-Based Management Handbook, Vol. 3: Establishing Accountability
for Performance, Westwood Village: Performance-Based Management Special Interest Group.
� Artley W. and Stroh, S. (2001), The Performance-Based Management Handbook, Vol. 2: Establishing
an Integrated Performance Measurement System, Westwood Village: Performance-Based
Management Special Interest Group.
� Association Construction Products Construction Products Industry (2007), Handbook Key Performance
Indicators, London: Construction Products Association.
� Berrah L., Mauris, G. and Vernandat, F. (2004), Information Aggregation in Industrial Performance
Measurement: Rationales, Issues and Definitions, in International Journal of Production Research, Vol.
42, No. 20.
� Bititci U., Carrie, A. and Turner, T. (2002), Integrated Performance Measurement Systems: Structure
and Dynamics, in Neely, A. (ed.), Business Performance Measurement: Theory and Practice,
Cambridge: Cambridge University Press.
� Blumenthall A. et all (2000), KPI Report for The Minister for Construction, West Yorkshire: The KPI
Working Group.
� Boonstra J., Steensma, H. and Demenint M. (2002), Ontwerpen en Ontwikkelen van Organisaties, ’s-
Gravenhage: Elsevier.
� Bourne M., Franco, M. and Wilkes, J. (2003), Corporate Performance Measurement, in Measuring
Business Excellence, Vol. 7, No. 3.
� Bruijn de J.A. and Heuvelhof, ten E.F. (1999), Management in Netwerken, Utrecht: Lemma BV.
� Bruijn de J.A., Heuvelhof, ten E.F. and Veld, in ’t R. (2002), Procesmanagement: Over procesontwerp
en besluitvorming, Den Haag: Academic Service.
� Caralli R.A (2004), The Critical Success Factor Method: Establishing a Foundation for Enterprise
Security Management, Pittsburgh: Carnegie Mellon University.
� Cowings J.S. (2002), Strategic Leadership and Decision Making, Washington: Industrial College of the
Armed Forces (National Defense University).
� Eccles, R.G. and Pyburn, P.J. (1992), Creating a Comprehensive System to Measure Performance,
Management Accounting, Montvale.
� EFQM, (2007a), Introducing Excellence, available at: www.efqm.org.
� EFQM, (2007b), The Fundamental Concepts of Excellence, available at: www.efqm.org.
� Eijnatten van, F., Poorthuis A-M. and Peters, J. (2002), Inleiding in Chaosdenken; Theorie en Praktijk,
Assen: Koninklijke Van Gorcum BV.
� Goubergen van D. and Aken van E. (2000), 'Performance Measurement', meer dan goochelen met
cijfers, Vosselaar: Van Goubergen P&M Productivity Improvement.
� Gupta R. (2009), Single Point Ownership of a cross-functional KPI- How to make it happen?, BiPM
Institute, available on: www.bipminstitute.com.
� Haas de M. and Kleingeld, A. (1999), Multilevel Design of Performance Measurement Systems:
Enhancing Strategic Dialog Throughout the Organization, in Management Accounting Research,
Vol.10, Nr. 3, Eindhoven.
� Have ten S., Have ten, W. and Bour, A.P.M. (1998), Organisatiebesturing: Koers Uitzetten en Koers
Houden, ’s-Gravenhage: Elsevier.
� Kali B. (2003), Strategic Performance Measurement, Fort Collins, Colorado.
� Kaplan R.S. & Norton, D.P. (2001), The Strategy-Focused Organization, Boston: Harvard Business
School Press.
� Kaplan R.S. and Norton, D.P (2004), Strategy Maps: Converting Intangible Assets into Tangible
Outcomes, Boston: Harvard Business School Press.
� Kaplan R.S. and Norton, D.P. (2000), Having Trouble with Your Strategy? Then Map It!, in Harvard
Business Review, Boston.
� Kellen, V. (2003), Business Performance Measurement: At the Crossroads of Strategy, Decision-
Making, Learning and Information Visualization, Chicago.

75
� Kerklaan L. (2006), Strategy Map: De Ontbrekende Schakel, in Tijdschrift Controlling, Deventer:
Kluwer Bedrijfsinformatie.
� Koster, J. & Stolze, P. (2007), Heeft u al een Missie en een Visie?, Amsterdam.
� Lebas, M. and Euske, K. (2002), A conceptual and operational delineation of performance, in Neely, A.
(ed.), Business Performance Measurement: Theory and Practice, Cambridge: Cambridge University
Press.
� Leeuw, A.C.J. de (1990), Organisaties: Management, Analyse, Ontwerp en Verandering; een
Systeemvisie, Assen: Koninklijke Van Gorcum BV.
� Lema, N.M and Samson, M. (2002), Development of construction contractors performance
measurement framework, Dar es Salaam, Tanzania.
� Malchione, R. (1991), Making Performance Measurements Perform, in Tire a Part: Perspectives, No.
154, Chicago.
� Markus, T. et al. (2004), Applying Balanced Scorecard Principles on the SAKE-system: Case
Telekolmio Oy, Lahti, Finland.
� Marr B. and Adams C. (2004), The Balanced Scorecard and Intangible Assets: Similar Ideas,
Unaligned Concepts, in Measuring Business Excellence, Vol. 8, Nr. 3.
� Marr, B. and Schiuma, G. (2003), Business Performance Measurement – Past, Present and Future, in
Management Decision, Vol. 41, Nr. 8.
� Marr, B. et al. (2004), The Dynamics of Value Creation: Mapping Your Intellectual Performance
Drivers, in Journal of Intellectual Capital.
� McNamara, C. (2005), Field Guide to Consulting and Organizational Development: A Collaborative
and Systems Approach to Performance, Change and Learning, Authenticity Consulting.
� Neely et al. (2002), Business Performance Measurement: Theory and Practice, Cambridge.
� Neely et al. (1997), Designing Performance Measures: a Structured Approach, in International Journal
of Operations & Production Management, MCB University Press.
� Nieuwenhuis, M.A. (2003), The Art of Management, ISBN-13: 978-90-806665-1-1, available at:
www.the-art.nl.
� Otley, D. (2002), Measuring Performance: The Accounting Perspective, in Neely, A. (ed.), Business
Performance Measurement: Theory and Practice, Cambridge: Cambridge University Press.
� Pruyt, E. et al (2008), Continuous Systems Modeling, System Dynamics, Reader spm2313/epa1321),
Delft: Delft University of Technology.
� Pun, K.F. and White, A.S., (2005), A performance measurement paradigm for integrating strategy
formulation: a review of systems and frameworks”, International Journal of Management Reviews, Vol.
7, No. 1.
� Rockart, J.F. and Bullen, C.V. (1984), A Primer on Critical Success Factors, Center for Information
Research, Sloan School of Management, Massachusetts Institute of Technology.
� Santos S., Belton V. and Howick S., Adding Vale to Performance Measurement by Using System
Dynamics and Multicriteria Analysis, Management Science.
� Schumacker, R.E. and Lomax, R.G. (1996), A Beginner’s Guide to Structural Equation Modeling, New
Jersey: Lawrence Erlbaum Associates.
� Simmons, R. (2000), Performance Measurement and Control Systems for Implementing Strategy,
Prentice Hall.
� Tu, Y., Chen, C., Tseng, Y. (1997), Study on Dynamic System Behavior and Comparison of Dominant
Loop Analysis Approaches, available on www.systemdynamics.org.
� Turusbekova N. (2007), Individual Accountability: The Interplay between Task, Social Context and
Personal Attributes, SOM Research School: Groningen.
� Verschuren, P. and Doorewaard H. (2005), Het Ontwerpen van een Onderzoek, Utrecht: Lemma.
� Verweire K. and Berghe van den, L. (2004), Integrated Performance Management: A Guide to Strategy
Implementation, London: Sage Publications.
� Vrisou van Eck, W. (2003), Handboek voor de Bedrijfskundige Analyse, Zeist.
� Walton, R.E. (1973), Quality of Work Life: What is it? , Sloan Management Review.
� Zairi, M. (1994), Measuring Performance for Business Results, London: Chapman & Hall.

76
Internal
� All Employee Meetings, 2003 – 2007.
� Best Practice, Multi Office Execution, 2006.
� Chicago Bridge & Iron Company N.V., Annual report, 2007.
� Company Management Manual, 2007.
� Hooft, P. et al (2007), Why Stay Put: what motivated staff to join Lummus and why did they stay, Lead
Engineer Development Program.
� International Organization for Standardization, Quality Management Systems, ISO 9001.
� Sieval, W. (2006), Assessment of the Implementation of a Detailed Engineering (Out-) Sourcing
Strategy, In-Company Project.
Online
� Intranet: www.intranet.nlhag.lummusonline.com
� Website Baldrige: www.baldrige.nist.gov.
� Website EFQM: www.efqm.org
� Website INK: www.ink.nl


77
APPENDIX A Abbreviations and Keywords
BEM -- Business Excellence Model
BSC --Balanced Scorecard
CB&I -- Chicago Bridge & Iron Company N.V.
CIM – Continual Improvement Measures
CLN -- CB&I Lummus Netherlands
CMT -- Company Management Team
CSF – Critical Success Factors
EFQM – European Foundation for Quality Management
EPC -- Engineering, Procurement and Construction
EVA -- Economic Value Added
KPI -- Key Performance Indicator
MBNQA -- Malcolm Baldrige National Quality Award
MBNQP -- Malcolm Baldrige National Quality Program
MOPEX -- Multi Office Project Execution
PMC -- Management Contracting
PMRS -- Performance Measure Record Sheet
SD – System Dynamics
SMART -- Specific, Measurable, Achievable, Relevant, Time framed
SPI -- Secondary Performance Indicators


78
APPENDIX B Research Material
Important steps towards accomplishing the research challenges are to make a selection of relevant
research material. This appendix will form a structure of the research material that is needed.


QUESTIONS SOURCES METHOD
Analysis problem situationWhat is the added value of Key Performance Indicators, e.g. which objectives does
Senior Management want to achieve with Performance Measurement?
1) Theories/ articles on performance measurement
2) Senior Management
1) Desk research
2) Individual face-to-face interview
What is CLN’s current KPI concept to measure performance? 1) Existing concept 1) Desk research
What is the performance of CLN with regard to these indicators? 1) Historical data 1) Desk research
What are the influences on these performances?
1) Senior Management
2) Section Leaders 1) Individual face-to-face interview
How does Senior Management use the measurements for management purposes?
1) Senior Management
2) Company procedures
1) Individual face-to-face interview
2) Desk research
Why is the current KPI measurement not supporting the implementation of corrective
actions?
1) Senior Management
2) Existing concept
1) Individual face-to-face interview
2) Desk research
How can Senior Management influence performance measurement? 1) Senior Management 1) Individual face-to-face interview
What are the influences on performance measurement?
1) Senior Management
2) Internal documents
1) Individual face-to-face interview
2) Desk research
On which criteria’s does Senior Management evaluate performance measurement? 1) Senior Management 1) Individual face-to-face interview
What are the performances of these evaluation criteria? 1) Internal documents 1) Desk research
Which factors influence the evaluation criteria’s? 1) Senior Management 1) Individual face-to-face interview
Who are the other stakeholders regarding performance measurement and what are
their perception of the problem, objectives and interests? 1) Senior Management 1) Individual face-to-face interview
Issues to develop an effective Performance Measurement method
What is meant by sufficient measurement of company performance? 1) Theories/ articles on performance measurement 1) Desk research
What are the critical success factors for sufficient performance measurement? 1) Theories/ articles on performance measurement 1) Desk research
What are the design/ assessment criteria for sufficient performance measurement?
1) Theories/ articles on performance measurement
2) Senior Management
1) Desk research
2) Individual face-to-face interview
Which measurement concepts have proven to be sufficient?
1) Theories/ articles on performance measurement
2) Benchmark information 1) Desk research
Which relevant performances of CLN are subject for measurement?
1) Senior Management
2) Section leaders
3) Businesss processes
1) Individual face-to-face interview
2) Desk research
What is meant by effective management of business processes? 1) Theories/ articles on strategies and management 1) Desk research
How is effective defined with regard to management? 1) Theories/ articles on strategies and management 1) Desk research
What are the criteria’s for effective application of the measurements?
1) Theories/ articles on performance measurement,
strategie and managment
2) Senior Management
1) Desk research
2) Individual face-to-face interview
Which (relevant) business processes can be distinguished in the business execution of
CLN?
1) Section leaders
2) Businesss processes
1) Individual face-to-face interview
2) Desk research
What is significant information for Senior Management for effective management of
business processes? 1) Senior Management 1) Individual face-to-face interview
What are the strategies to use performance measurement for the management of
business processes?
1) Theories/ articles on performance measurement,
strategie and management 1) Desk research
Elaboration of the reviewed Performance Measurement method
What are the shortcomings of the Performance Measurement method in the current
situation? 1) Analysis from research project 1) Secundary research
Which indicators can be determined to measure CLN’s performance sufficiently? 1) Analysis from research project 1) Secundary research
What strategy can be determined to use the measurements for the management of
business processes? 1) Analysis from research project 1) Secundary research
What are the consequences (and risks) in terms of responsibility, organization, scope
and cost?
1) Internal documents
2) Analysis from research project
1) Desk research
2) Secundary research
Does the new concept support the need of Senior Management better than the old
concept? 1) Analysis from research project 1) Experiment

79
APPENDIX C Leading questions Strategy Map
To define Corporate KPI’s we need to determine the Factors that are crucial for the success of the
business strategy (Critical Success Factors).
General
1. What is the company level you have in mind with regard to Corporate KPI’s?
Financial: determination of financial objectives.
1. How can we increase shareholder value?
2. What financial objectives must be achieved in order to meet the expectations of Company
Management?
3. What financial objectives must be achieved in order to meet the expectations of CB&I?
4. What financial objectives must be achieved to survive as ongoing company?
5. How do you define company growth?
6. What are the strategies for company growth?
7. What are the strategies for productivity/ efficiency?
8. How can we maximize profit?
Customer: determine on which critical factors customers judge us.
1. How does CB&I Lummus want to appear to its stakeholders (image)?
2. What does CB&I Lummus want to convey to its stakeholders?
3. What are the customer segments on which CB&I Lummus wants to aim at?
4. What are the market segments on which CB&I Lummus wants to aim at?
5. What is exactly of value for the target group?
6. What are the deciding factors for clients to award projects?
7. What aspects will be essential in the future for the client’s choice for CB&I Lummus?
8. What were in the past the deciding factors for clients to award projects?
9. In which areas does CB&I Lummus excel compared to competitors (distinguishing ability)?
10. What is the power or influence of suppliers and/ or 3rd parties?
11. On which way can CB&I Lummus use her influence to enable suppliers and/ or 3rd parties to
contribute to our success?
12. Which product/ service-attributes are critical in order to operate excellently in the view of clients?
13. Which relational aspects with clients need to be stressed on specifically in the view of clients?
Internal Process: determine how processes should be organized in order to serve the selected
customer segments on the chosen way.
1. What is necessary to realize the targeted quality?
2. How can the desired cycle time and delivery time be realized?
3. For which business processes do the targeted objectives have specific consequences?
4. Which business processes need to be managed tightly?
5. Which requirements does the communication with the client demand?
6. Which specific competencies do employees need to dispose of?
7. What are the objectives with regard to the creation of new products/ services?
8. What are the objectives with regard to the penetration of new markets and customer segments?
9. In order to increase customer value, how can we deepen our relationships with existing clients?
10. How can we achieve operational excellence in the execution of projects?
11. How can we achieve operational excellence in our logistics processes?
12. In order to become a good corporate citizen, how can we establish effective relationships with
external stakeholders (regulatory and environmental processes)?

80
Learning & Growth: determine which factors (1) contribute to continual innovation and (2) add
value to the overall operations.
What do we have to do to improve the following assets?
1. Financial: cash that is needed in order to invest into other resources.
2. Physical: tangible infrastructures, such as resource location and ICT (databases, servers,
networks (intranet)).
3. Relationship: relationship and exchange of knowledge between CB&I Lummus and its (external)
stakeholders.
4. Cultural: shared framework of our employees to interpret events.
5. Practices and routines: how our employees deal with processes and how work flows through the
organization.
6. Intellectual property: the tools and enablers that allows CB&I Lummus to gain a protected
competitive advantage.
Human/ people Assets: determine which human factors (1) contribute to continual innovation and
(2) add value to the overall operations.
1. How can we improve the core competences of our employees?
2. How can we improve the core knowledge of our employees?
3. How can we improve the skills of our employees?
4. How can we improve the commitment of our employees?
5. How can we improve the motivation our employees?
6. How can we improve the loyalty of our employees?
7. How can we improve teamwork between employees?
Closure
1. Are there any other factors that are critical for the success of our operations?

81
APPENDIX D Factors linked to the four measurement criteria
Kellen (2003)
� Breadth: refers to how much of the total set of activities needed to be measured are actually
measured. Breadth needs to be balanced between internal state and activities inside of the firm and
activities and items external to the firm such as customers, suppliers, competitors, market conditions,
environmental conditions, etc.
� Depth: refers to the unit of analysis. Levels of analysis, or granularity, can include the employee, the
workgroup or team, the functional unit, the business unit, the product, the customer, the firm as a
whole, the marketplace or the economy at large. BPM systems can and typically do cover multiple
levels of analysis.
� Coherency: refers to the how much breadth and depth factors combine together to improve
performance. How do lower levels of measurement contribute to higher levels? How do units of
measurement at the same level coordinate together to contribute higher levels?
� Predictability: refers to how accurately and far into the future a BPM system can project.
� Provability: refers to how the BPM system can show the relationship between causes and effects.
Identifying causes and effects helps managers better understand where (which object) to apply
attention.
� Explainability: refers to how easily people in the firm can explain relationships between measurements
and how the BPM system functions.
� Believability: Refers to how much people in the firm trust the BPM system. Do people in the firm
believe what the BPM system is expressing? Data quality and overall measurement trust (reliability,
consistency, accuracy) are key components.
� Communicability: refers to how well can people in the firm communicate measures and discuss them
amongst themselves?
� Adaptability: refers how easily and completely the BPM system can be altered. Is the BPM system
automatically self-changing? How much intervention is required to change it? Is the human component
capable of changing?
� Measurability: refers to how the BPM system itself is measured (meta-measurement). Is the BPM
system working within normal parameters? What is the quality of service? How effective is the BPM
system? Where is improvement in the BPM system warranted? Is it measuring the right things?
� Autonomic: how much does the BPM system help the firm self-correct? How much management
attention and effort does operating the BPM system require?


82
APPENDIX E PMRS Criteria
Neely (1997)
1. be derived from strategy
2. be simple to understand
3. provide timely and accurate feedback
4. be based on quantities that can be influenced, or controlled, by the user alone or in cooperation with
others
5. reflect the “business process” – i.e. both the supplier and customer should be involved in the definition
of the measure
6. relate to specific goals (targets)
7. be relevant
8. be part of a closed management loop
9. be clearly defined
10. have visual impact
11. focus on improvement
12. be consistent (in that they maintain their significance as time goes by)
13. provide fast feedback
14. have an explicit purpose
15. be based on an explicitly defined formula and source of data
16. employ ratios rather than absolute numbers
17. use data which are automatically collected as part of a process whenever possible
18. be reported in a simple consistent format
19. be based on trends rather than snapshots
20. provide information
21. be precise – be exact about what is being measured
22. be objective – not based on opinion


83
AP
PE
ND
IX F
Fo
rm to
dete
rmin
e C
SF
’s
Measurability Business Criticality Proposed KPI
Very Bad Bad Medium Good Very Good Very Low Low Medium High Very high
Very difficult to
implement
Difficult to
implementImplementable
Easy to
implement
Very easy to
implement
No impact on
business
Minor impact on
business
Moderate impact
on business
Major impact on
business
Massive impact
on businessI. Financial
FIN01 Creating Shareholder ValueFIN02 Assurance of Business ContinuityFIN03 Sustainable Revenue Growth FIN04 Increased ProfitabilityFIN05 Available Cash AmountFIN06 Increase (paid) Workload to JobsFIN07 Increase Workload to DEC'sFIN08 Optimize Material CostFIN09 Balanced Project Portfolio (Scope, Size, Contract)FIN10 Sufficient Backlog
II. Customer
CUS01 Significant Market Share in the IndustryCUS02 Focus on determined RegionsCUS03 Focus on determined Products/ TechnologiesCUS04 In-house Knowledge/ Competence AvailabilityCUS05 Increase usage of In-house Technology LicensesCUS06 Reliability and Integrity as EPC contractorCUS07 One-Stop-Shop EPC ContractorCUS08 Innovativeness and Value Adding AbilityCUS09 Focus on Key ClientsCUS10 Optimize Communication with ClientCUS11 Improve Relationship with ClientCUS12 More long term Agreements with Existing ClientsCUS13 Management of Client KnowledgeCUS14 Expand Client BaseCUS15 Balanced Client Type PortfolioCUS16 Improve Ability to handle Client Specific RequirementsCUS17 Improve Competitiveness
III. Internal Business Process
IBP01 Balance between Key and new Specialisms/ TechnologiesIBP02 Sufficient CapacityIBP03 Effective Communicating IT SystemsIBP04 Increase FlexibilityIBP05 Improve Employee CompetenceIBP06 Selective Project Acceptance/ BiddingIBP07 Maximize Scope CapturementIBP08 Improve Sales EffortsIBP09 Project Efficiency and Effectiveness ImprovementIBP10 Increase Project Types in line with Strategic FocusIBP11 Avoid Scope Changes During Project ExecutionIBP12 Meeting Project Preconditions (Schedule, Budget, Quality, Safety)IBP13 Create Ownership of Total Project ObjectivesIBP14 Meeting Requirements of Project Execution PlansIBP15 Improve Quality of the total EPC ProcessIBP16 Optimize Project Risk BalanceIBP17 Improve Multi Office Project ExecutionIBP18 Improve Quality Basic Engineering PackageIBP19 Subcontract ManagementIBP20 Improve Material Supplier (Work) ProcessesIBP21 Focus on Key SuppliersIBP22 Anticipate on Changes in the Economic Climate
IV. Learning & Growth
L&G01 Improve Employee SatisfactionL&G02 Increase Commitment of People to the OrganizationL&G03 Encourage Employee DevelopmentL&G04 Secure Employee Well BeingL&G05 Improve Employee QualityL&G06 Encourage effective TeamworkL&G07 Improve Work ContentL&G08 Stimulate Work AtmosphereL&G09 Improve Knowledge Capturement, Transfer & AvailabilityL&G10 Effective usage of IT-toolsL&G11 Improve Information Capturement, Integrity & FlowL&G12 Capture Lessons LearnedL&G13 Alignment of IT Systems/ ApplicationsL&G14 Alignment of Work ProcessesL&G15 Improve Relationship with DEC's
V. Suggested Critical Succes Factors
…
……
…
How to measure?Critical Succes Factor


84
APPENDIX G Elaborated KPI’S (according to the PMRS)


FINANCIAL 1 / 2
1 KPI: RevenuePurpose / CSF: Sustainable revenue growthRelates to: EBIT, Sales Efforts, Profitable Projects, Repeat Business, New ClientsTarget: ≤ 1.00Formula: Planned revenue / actual revenueFrequency: 1 / yearWho measures:Source of data: Business plan and financial systemWho acts on the data: Corporate FinanceWhat do they do / mgmt process:KPI level: Line Organization
2 KPI: Earnings Before Interest and Tax (EBIT)Purpose / CSF: Increase ProfitabilityRelates to: Free Cash Flow, Overhead, RevenueTarget: ≤ 1.00Formula: Planned EBIT / actual EBITFrequency: 1 / yearWho measures:Source of data: Business plan and financial systemWho acts on the data: Corporate FinanceWhat do they do / mgmt process:KPI level: Line Organization
3 KPI: Future Net Cash FlowPurpose / CSF: Assurance of Business ContinuityRelates to: Sufficient Backlog, Emplyee SatisfactionTarget: ≥ EUR 10*10^6Formula: Forecasted Net Cash Flow in business planFrequency: 1 / yearWho measures:Source of data: Based on Backlog, Prospects and ProposalsWho acts on the data: Corporate FinanceWhat do they do / mgmt process:KPI level: Line Organization
4 KPI: New ClientsPurpose / CSF: Expand Client BaseRelates to: RevenueTarget: 20%Formula: Expected revenues from new Clients / total RevenuesFrequency: 1 / yearWho measures:Source of data: Business Development and financial systemWho acts on the data: Business DevelopmentWhat do they do / mgmt process:KPI level: Line Organization
5 KPI: Key ClientsPurpose / CSF: Focus on Key ClientsRelates to: Repeat BusinessTarget: 60%Formula: Expected revenues from key Clients / total RevenuesFrequency: 1 / yearWho measures:Source of data: Business Development and financial systemWho acts on the data: Business DevelopmentWhat do they do / mgmt process:KPI level: Line Organization

FINANCIAL 2 / 2
6 KPI: Project TypePurpose / CSF: Balanced Project PortfolioRelates to: Employee SatisfactionTarget: % per categoryFormula: Revenue per Project (scope) category: FEED (30%), EPCm (60%) or Study (10%)Frequency: 1 / yearWho measures:Source of data: Business Development and financial systemWho acts on the data: Business DevelopmentWhat do they do / mgmt process:KPI level: Line Organization
7 KPI: OverheadPurpose / CSF: Minimize Overhead CostRelates to: DEC Workload, Paid Manhours, Coordination Manhours, EBITTarget: ≤ EUR 25 / yearFormula: Total overhead / billable manhoursFrequency: 1 / quarterWho measures:Source of data: Financial systemWho acts on the data: Corporate FinanceWhat do they do / mgmt process:KPI level: Line Organization
8 KPI: Paid ManhoursPurpose / CSF: Increase (paid) Workload to JobsRelates to: OverheadTarget: 90%Formula: Paid manhours / total spent manhoursFrequency: 1 / quarterWho measures:Source of data: Financial systemWho acts on the data: Corporate ManagementWhat do they do / mgmt process:KPI level: Line Organization
9 KPI: DEC Workload Purpose / CSF: Increase Workload to DEC'sRelates to: OverheadTarget: 50%Formula: DEC manhours / total spent manhoursFrequency: 1 / quarterWho measures:Source of data: Financial systemWho acts on the data: Corporate ManagementWhat do they do / mgmt process:KPI level: Line Organization
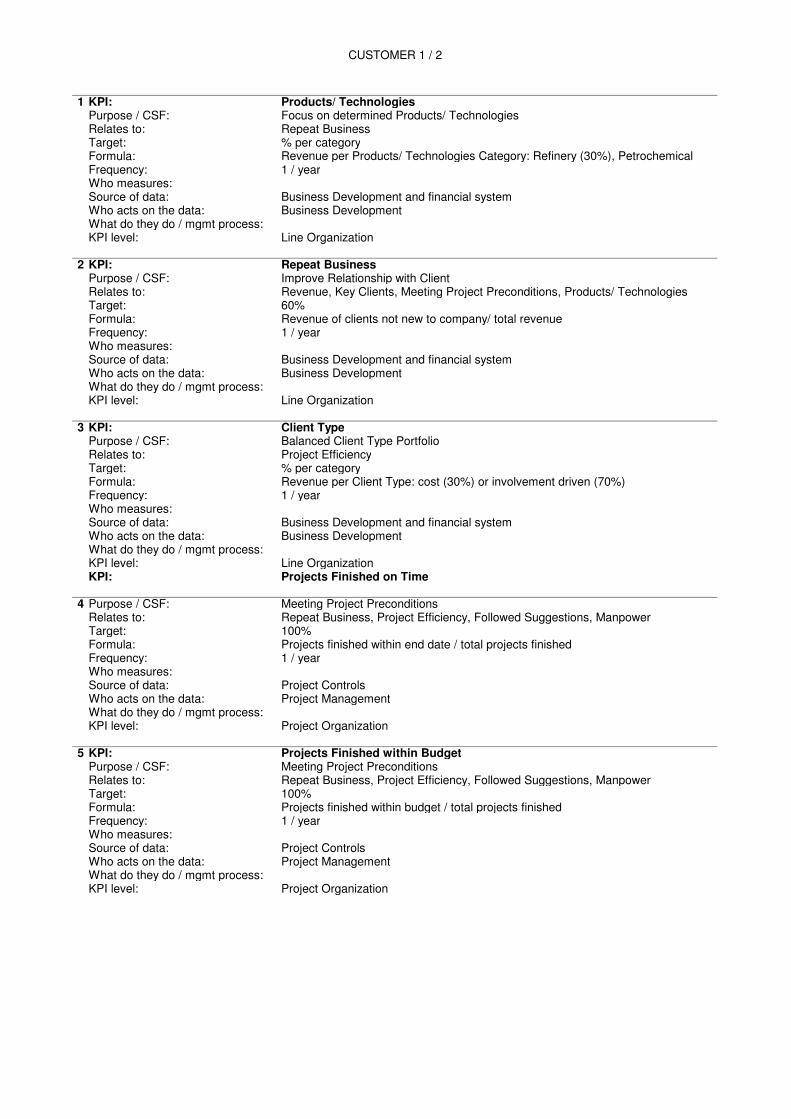
CUSTOMER 1 / 2
1 KPI: Products/ TechnologiesPurpose / CSF: Focus on determined Products/ TechnologiesRelates to: Repeat BusinessTarget: % per categoryFormula: Revenue per Products/ Technologies Category: Refinery (30%), Petrochemical Frequency: 1 / yearWho measures:Source of data: Business Development and financial systemWho acts on the data: Business DevelopmentWhat do they do / mgmt process:KPI level: Line Organization
2 KPI: Repeat BusinessPurpose / CSF: Improve Relationship with ClientRelates to: Revenue, Key Clients, Meeting Project Preconditions, Products/ TechnologiesTarget: 60%Formula: Revenue of clients not new to company/ total revenueFrequency: 1 / yearWho measures:Source of data: Business Development and financial systemWho acts on the data: Business DevelopmentWhat do they do / mgmt process:KPI level: Line Organization
3 KPI: Client TypePurpose / CSF: Balanced Client Type PortfolioRelates to: Project EfficiencyTarget: % per categoryFormula: Revenue per Client Type: cost (30%) or involvement driven (70%)Frequency: 1 / yearWho measures:Source of data: Business Development and financial systemWho acts on the data: Business DevelopmentWhat do they do / mgmt process:KPI level: Line OrganizationKPI: Projects Finished on Time
4 Purpose / CSF: Meeting Project PreconditionsRelates to: Repeat Business, Project Efficiency, Followed Suggestions, ManpowerTarget: 100%Formula: Projects finished within end date / total projects finishedFrequency: 1 / yearWho measures:Source of data: Project ControlsWho acts on the data: Project ManagementWhat do they do / mgmt process:KPI level: Project Organization
5 KPI: Projects Finished within BudgetPurpose / CSF: Meeting Project PreconditionsRelates to: Repeat Business, Project Efficiency, Followed Suggestions, ManpowerTarget: 100%Formula: Projects finished within budget / total projects finishedFrequency: 1 / yearWho measures:Source of data: Project ControlsWho acts on the data: Project ManagementWhat do they do / mgmt process:KPI level: Project Organization

CUSTOMER 2 / 2
6 KPI: Quality of Projects Purpose / CSF: Meeting Project PreconditionsRelates to: Repeat Business, Project Efficiency, Followed Suggestions, ManpowerTarget: ≤ 1%Formula: Forecast cost of quality issues at mechanical complete / total project costFrequency: 1 / yearWho measures:Source of data: Project ControlsWho acts on the data: Project ManagementWhat do they do / mgmt process:KPI level: Project Organization - aggregation
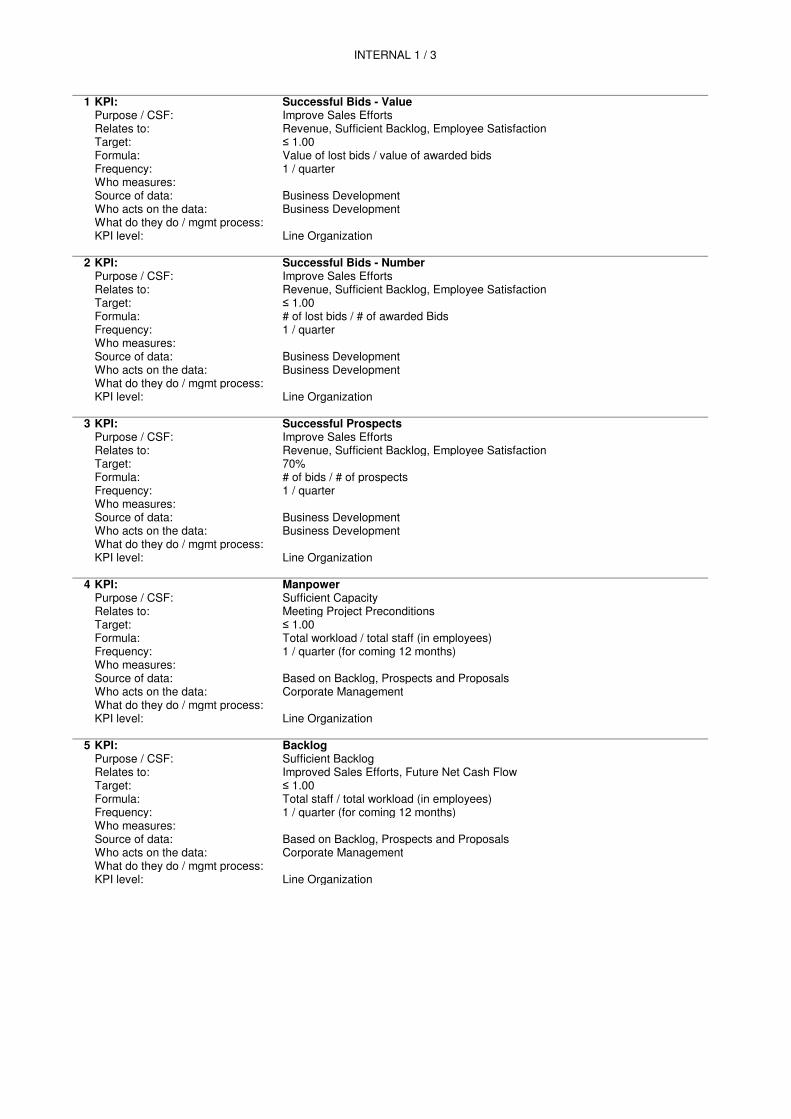
INTERNAL 1 / 3
1 KPI: Successful Bids - ValuePurpose / CSF: Improve Sales EffortsRelates to: Revenue, Sufficient Backlog, Employee SatisfactionTarget: ≤ 1.00Formula: Value of lost bids / value of awarded bidsFrequency: 1 / quarterWho measures:Source of data: Business DevelopmentWho acts on the data: Business DevelopmentWhat do they do / mgmt process:KPI level: Line Organization
2 KPI: Successful Bids - NumberPurpose / CSF: Improve Sales EffortsRelates to: Revenue, Sufficient Backlog, Employee SatisfactionTarget: ≤ 1.00Formula: # of lost bids / # of awarded BidsFrequency: 1 / quarterWho measures:Source of data: Business DevelopmentWho acts on the data: Business DevelopmentWhat do they do / mgmt process:KPI level: Line Organization
3 KPI: Successful ProspectsPurpose / CSF: Improve Sales EffortsRelates to: Revenue, Sufficient Backlog, Employee SatisfactionTarget: 70%Formula: # of bids / # of prospectsFrequency: 1 / quarterWho measures:Source of data: Business DevelopmentWho acts on the data: Business DevelopmentWhat do they do / mgmt process:KPI level: Line Organization
4 KPI: ManpowerPurpose / CSF: Sufficient CapacityRelates to: Meeting Project PreconditionsTarget: ≤ 1.00Formula: Total workload / total staff (in employees)Frequency: 1 / quarter (for coming 12 months)Who measures:Source of data: Based on Backlog, Prospects and ProposalsWho acts on the data: Corporate ManagementWhat do they do / mgmt process:KPI level: Line Organization
5 KPI: BacklogPurpose / CSF: Sufficient BacklogRelates to: Improved Sales Efforts, Future Net Cash FlowTarget: ≤ 1.00Formula: Total staff / total workload (in employees)Frequency: 1 / quarter (for coming 12 months)Who measures:Source of data: Based on Backlog, Prospects and ProposalsWho acts on the data: Corporate ManagementWhat do they do / mgmt process:KPI level: Line Organization

INTERNAL 2 / 3
6 KPI: Key SuppliersPurpose / CSF: Focus on Key SuppliersRelates to: Project EfficiencyTarget: 70%Formula: PO's with key suppliers / total PO'sFrequency: 1 / quarterWho measures:Source of data: ProcurementWho acts on the data: ProcurementWhat do they do / mgmt process:KPI level: Line Organization
7 KPI: Manhour EfficiencyPurpose / CSF: ≤ EUR 25 / yearRelates to: Meeting Project Preconditions, Subcontract Mgmt, Scope Mgmt, Employee Target: 600 mhrsFormula: Total manhours / total pieces of equipmentFrequency: 1 / quarterWho measures:Source of data: Project ControlsWho acts on the data: Project ManagementWhat do they do / mgmt process:KPI level: Project Organization - aggregation
8 KPI: Earned ValuePurpose / CSF: Project Efficiency ImprovementRelates to: Meeting Project Preconditions, Subcontract Mgmt, Scope Mgmt, Employee Target: ≤ 1.00Formula: Actual cost / earned valueFrequency: 1 / quarterWho measures:Source of data: Project ControlsWho acts on the data: Project ManagementWhat do they do / mgmt process:KPI level: Project Organization - aggregation
9 KPI: Profitable ProjectsPurpose / CSF: Project Effectiveness ImprovementRelates to: Subcontract Mgmt, Scope Mgmt, RevenueTarget: 100%Formula: Expected profitable projects / total projectsFrequency: 1 / yearWho measures:Source of data: Project ControlsWho acts on the data: Project ManagementWhat do they do / mgmt process:KPI level: Project Organization
10 KPI: Coordination manhoursPurpose / CSF: Improve MOPEXRelates to: OverheadTarget: 5%Formula: Coordination manhours / total manhoursFrequency: 1 / quarterWho measures:Source of data: Project EngineeringWho acts on the data: Project ManagementWhat do they do / mgmt process:KPI level: Project Organization - aggregation

INTERNAL 3 / 3
11 KPI: Subcontractor Claims - NumberPurpose / CSF: Subcontract ManagementRelates to: Profitable Projects, Project EfficiencyTarget: 20%Formula: Expected awarded claims / issued claimsFrequency: 1 / quarterWho measures:Source of data: Project SubcontractingWho acts on the data: Project ManagementWhat do they do / mgmt process:KPI level: Project Organization - aggregation
12 KPI: Subcontractor Claims - ValuePurpose / CSF: Subcontract ManagementRelates to: Profitable Projects, Project EfficiencyTarget: 10%Formula: Value awarded claims / value issued claimsFrequency: 1 / quarterWho measures:Source of data: Project SubcontractingWho acts on the data: Project ManagementWhat do they do / mgmt process:KPI level: Project Organization - aggregation
13 KPI: Change Orders Approved - ValuePurpose / CSF: Scope ManagementRelates to: Profitable Projects, Project EfficiencyTarget: 85%Formula: Value change orders / value change notifications* Frequency: 1 / quarterWho measures:Source of data: Project ControlsWho acts on the data: Project ManagementWhat do they do / mgmt process:KPI level: Project Organization - aggregation
14 KPI: Change Orders Approved - NumberPurpose / CSF: Scope ManagementRelates to: Profitable Projects, Project EfficiencyTarget: 60%Formula: Expected # change orders / # change notificationsFrequency: 1 / quarterWho measures:Source of data: Project ControlsWho acts on the data: Project ManagementWhat do they do / mgmt process:KPI level: Project Organization - aggregation
15 KPI: Approved Contract Value ChangePurpose / CSF: Scope ManagementRelates to: Profitable Projects, Project EfficiencyTarget: ≤ 1.00Formula: (Forecast contract value - as sold contract value) / value of change ordersFrequency: 1 / quarterWho measures:Source of data: Project ControlsWho acts on the data: Project ManagementWhat do they do / mgmt process:KPI level: Project Organization - aggregation
*Change Notifications are raised by the Contractor and issued to the Client. If
Client approves the Change Notification, it becomes a Change Order.

LEARNING & GROWTH 1 / 1
1 KPI: Free Cash FlowPurpose / CSF: Available Cash AmountRelates to: Employee Satisfaction, EBITTarget: ≤ 1.00Formula: Planned free cash flow / actual free cash flowFrequency: 1 / mthWho measures:Source of data: Business plan and financial systemWho acts on the data: Corporate FinanceWhat do they do / mgmt process:KPI level: Line Organization
2 KPI: Employee Satisfaction IndexPurpose / CSF: Employee SatisfactionRelates to: Sales Efforts, Future Net Cash Flow, Free Cash Flow, Project Type, Project EfficiencyTarget: avg 8 (scale (1-10)Formula: Composed on basis of factors in section 6.3Frequency: 1 / yearWho measures:Source of data: SurveyWho acts on the data: Corporate TQMWhat do they do / mgmt process:KPI level: Line Organization
3 KPI: Followed SuggestionsPurpose / CSF: Capture Lessons LearnedRelates to: Meeting Project PreconditionsTarget: 85%Formula: # followed CIM's / # raised CIM's**Frequency: 1 / quarterWho measures:Source of data: CIM databaseWho acts on the data: Corporate ManagementWhat do they do / mgmt process:KPI level: Line Organization
** CIM: Continual Improvement Measures (actions), an existing system where individual can raise improvement suggestions.