Master Thesis Maurits Kruithof
63
Basel III Capital Requirements Impact of Higher Capital Requirements on Bank Funding Costs Maurits J. H. Kruithof Master’s Thesis Business Economics, Finance Track Date: March 14, 2013 Student Number: 5603404 Supervisor: Professor Arnoud W. A. Boot Second Examiner: Dr. Jeroen E. Ligterink University of Amsterdam, Faculty of Economics and Business
-
Upload
mauritskruithof -
Category
Documents
-
view
110 -
download
3
description
Basel III Capital Requirements: Impact of Higher Capital Requirements on Bank Funding CostsMaster Business Economics, Finance (University of Amsterdam)
Transcript of Master Thesis Maurits Kruithof
Basel III Capital Requirements
Impact of Higher Capital Requirements on Bank Funding Costs
Maurits J. H. Kruithof Master’s Thesis
Business Economics, Finance Track
Date: March 14, 2013 Student Number: 5603404 Supervisor: Professor Arnoud W. A. Boot Second Examiner: Dr. Jeroen E. Ligterink
University of Amsterdam, Faculty of Economics and Business

[this page intentionally left blank]
Basel III Capital Requirements
Impact of Higher Capital Requirements on Bank Funding Costs
Abstract
This thesis analyzes the impact of higher capital requirements on bank funding costs.
Often is claimed that capital is an expensive form of funding. An extensive literature
review of theoretical insights points out that this is not necessarily the case. The
foundation of capital structure research is the Modigliani-Miller theorem. The question is
whether this theorem holds in practice and is applicable to banks. It proves to be a
useful theorem to identify relevant frictions and distortive policies. This thesis scrutinizes
the public policies that favor debt financing over equity financing, because the corporate
tax system and implicit government guarantees create a significant lower cost of debt
funding. The Basel III capital requirements should therefore be complemented with tax
policy reforms and recapitalization of the banking system with the use of a contingent
capital (CoCo) requirement.
JEL classifications: G21, G28, G32, G38, H25
Keywords: Banking Regulation, Basel III, Capital Requirements, Capital Structure,
Funding Costs, Government Guarantee, Lending Spread, Leverage, Modigliani-Miller
Theorem, Tax Shield.
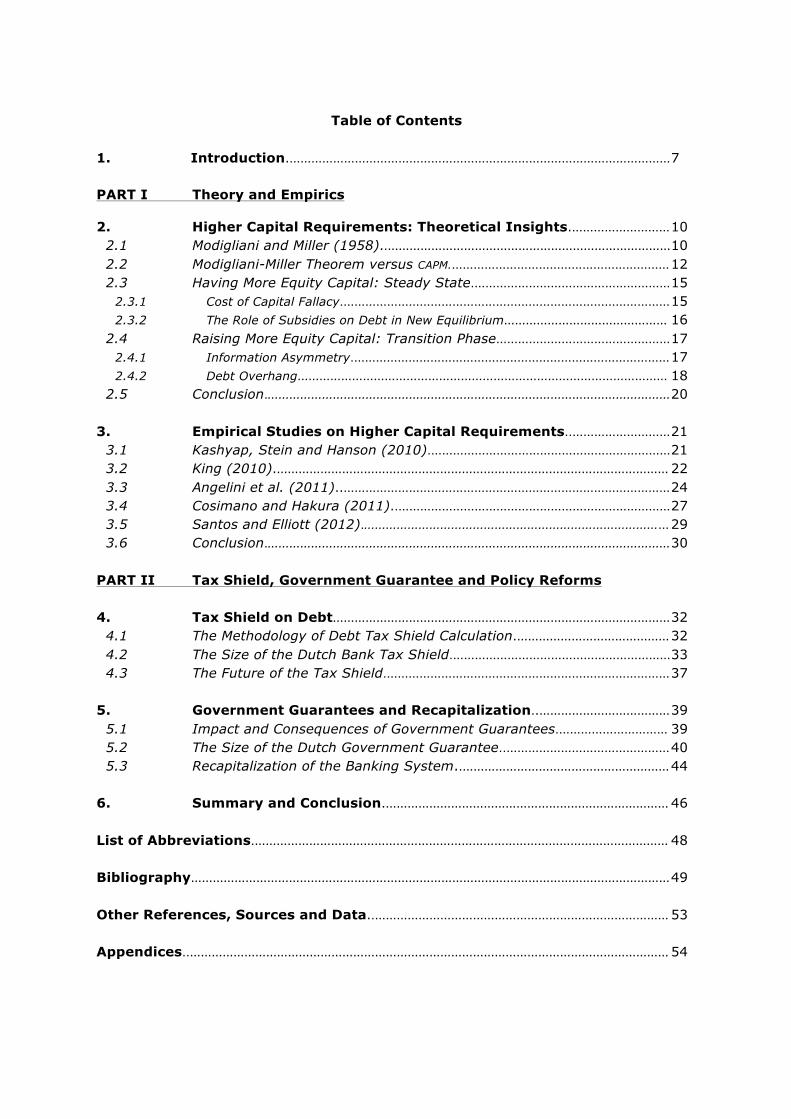
Table of Contents
1. Introduction.…………………………………………………………………………………………… 7 PART I Theory and Empirics
2. Higher Capital Requirements: Theoretical Insights.……………………… 10 2.1 Modigliani and Miller (1958)..…………………………………………………………………… 10 2.2 Modigliani-Miller Theorem versus CAPM.…………………………………………………… 12 2.3 Having More Equity Capital: Steady State.……………………………………………… 15 2.3.1 Cost of Capital Fallacy.……………………………………………………………………………… 15 2.3.2 The Role of Subsidies on Debt in New Equilibrium……………………………………… 16 2.4 Raising More Equity Capital: Transition Phase………………………………………… 17 2.4.1 Information Asymmetry.…………………………………………………………………………… 17 2.4.2 Debt Overhang………………………………………………………………………………………… 18 2.5 Conclusion.………………………………………………………………………………………………… 20
3. Empirical Studies on Higher Capital Requirements..……………………… 21 3.1 Kashyap, Stein and Hanson (2010).………………………………………………………… 21 3.2 King (2010).……………………………………………………………………………………………… 22 3.3 Angelini et al. (2011)..……………………………………………………………………………… 24 3.4 Cosimano and Hakura (2011)..………………………………………………………………… 27 3.5 Santos and Elliott (2012).………………………………………………………………………… 29 3.6 Conclusion.………………………………………………………………………………………………… 30 PART II Tax Shield, Government Guarantee and Policy Reforms 4. Tax Shield on Debt………………………………………………………………………………… 32 4.1 The Methodology of Debt Tax Shield Calculation.…………………………………… 32 4.2 The Size of the Dutch Bank Tax Shield.…………………………………………………… 33 4.3 The Future of the Tax Shield.…………………………………………………………………… 37 5. Government Guarantees and Recapitalization..……………………………… 39 5.1 Impact and Consequences of Government Guarantees.………………………… 39 5.2 The Size of the Dutch Government Guarantee..……………………………………… 40 5.3 Recapitalization of the Banking System..………………………………………………… 44 6. Summary and Conclusion.…………………………………………………………………… 46 List of Abbreviations.…………………………………………………………………………………………………… 48 Bibliography…………………………………………………………………………………………………………………… 49 Other References, Sources and Data..……………………………………………………………………… 53 Appendices..…………………………………………………………………………………………………………………… 54
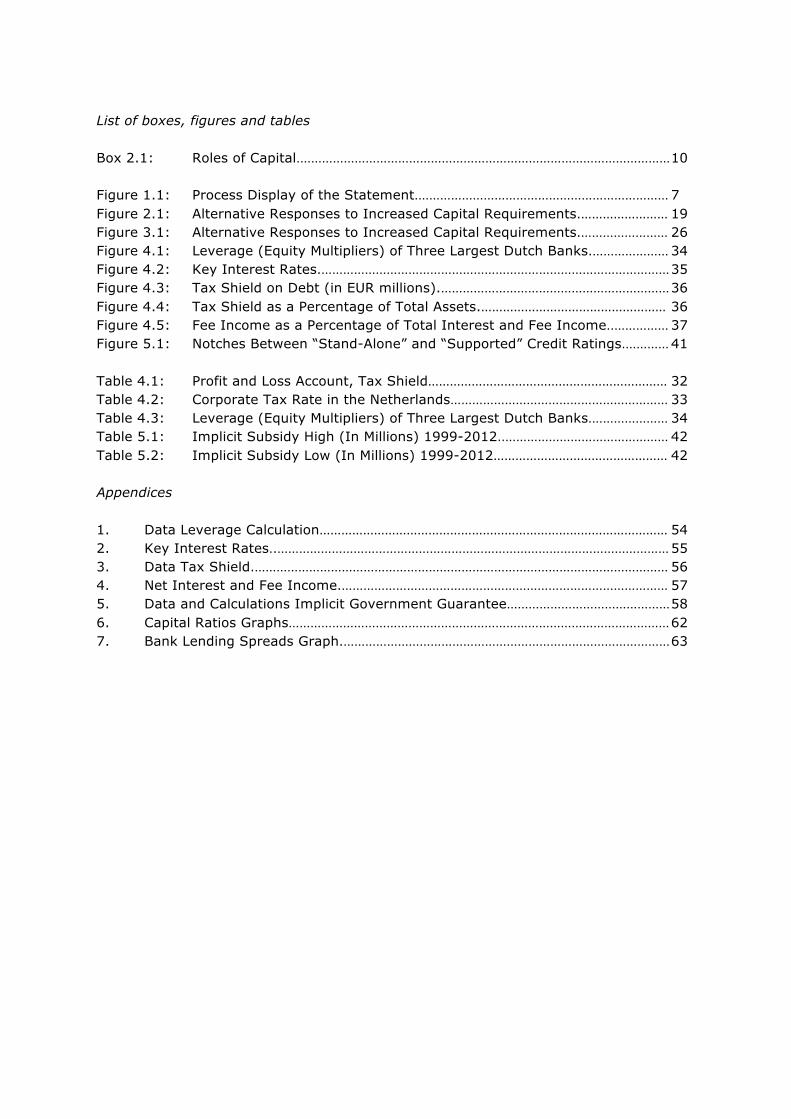
List of boxes, figures and tables Box 2.1: Roles of Capital.………………………………………………………………………………………… 10 Figure 1.1: Process Display of the Statement.…………………………………………………………… 7 Figure 2.1: Alternative Responses to Increased Capital Requirements.…………………… 19 Figure 3.1: Alternative Responses to Increased Capital Requirements.…………………… 26 Figure 4.1: Leverage (Equity Multipliers) of Three Largest Dutch Banks.………………… 34 Figure 4.2: Key Interest Rates.…………………………………………………………………………………… 35 Figure 4.3: Tax Shield on Debt (in EUR millions).……………………………………………………… 36 Figure 4.4: Tax Shield as a Percentage of Total Assets.…………………………………………… 36 Figure 4.5: Fee Income as a Percentage of Total Interest and Fee Income..…………… 37 Figure 5.1: Notches Between “Stand-Alone” and “Supported” Credit Ratings.………… 41 Table 4.1: Profit and Loss Account, Tax Shield………………………………………………………… 32 Table 4.2: Corporate Tax Rate in the Netherlands…………………………………………………… 33 Table 4.3: Leverage (Equity Multipliers) of Three Largest Dutch Banks.………………… 34 Table 5.1: Implicit Subsidy High (In Millions) 1999-2012..……………………………………… 42 Table 5.2: Implicit Subsidy Low (In Millions) 1999-2012………………………………………… 42 Appendices 1. Data Leverage Calculation…………………………………………………………………………………… 54 2. Key Interest Rates..……………………………………………………………………………………………… 55 3. Data Tax Shield.…………………………………………………………………………………………………… 56 4. Net Interest and Fee Income.……………………………………………………………………………… 57 5. Data and Calculations Implicit Government Guarantee……………………………………… 58 6. Capital Ratios Graphs…………………………………………………………………………………………… 62 7. Bank Lending Spreads Graph.……………………………………………………………………………… 63

Preface
After a difficult start, where I’ve spent several months reading all sorts of papers that
were very interesting but totally not relevant, I finally got the spirit during my first
extensive meeting with professor Boot in his office. I’m very thankful for his support,
advice and time he spent with me on my thesis. I also think that this is the right place to
express my gratitude to him for all he has done to help Room for Discussion achieve
success. It happens rarely these days that a mentor-student relationship is possible
when so many students are pursuing their ambitions. I was privileged to have such a
great mentor.
I also want to thank my parents for their ongoing support and interest during my studies
and work for Room for Discussion. They’ve helped me creating the circumstances in
which I could do all the things I needed to do, for that I’m very grateful.
After all the interviews and debates I did for Room for Discussion, I certainly knew that
my thesis had to be about banks and the financial sector. During one of my preparations
for a debate I found a speech by Thomas Huertas, which was written before the collapse
of Lehman Brothers. It contained the following quote1: ‘Capital is the cornerstone of
banking. Capital is the foundation on which banks take risks and achieve rewards, and
capital is ultimately what protects deposits.’ If capital really is the cornerstone of banking,
why were banks so poorly capitalized that the banking crisis of 2007-2009 could happen?
Well, I’ve tried to find an answer and that ultimately resulted in this Master’s thesis.
Maurits Kruithof
Amsterdam, March 2013
1 Derived from a speech by Thomas Huertas, FSA United Kingdom, June 26th 2008, via www.fsa.gov.uk. * I thank my friends Richard Evers and Gerben Smit for their useful comments and suggestions. I also thank the banks, accountancy and consultancy firms with whom I’ve had several informal meetings for their time, advices, comments, criticism and willingness to spar with me.
7
1. Introduction
The recent financial crisis of 2007-2009 shows that the ability of the banking sector to
deal with major shocks must be strengthened. The assets that are held by the banking
sector are too risky or high priced compared to the amount of capital on the liability side
of the balance sheet. The sector is not capable to absorb losses on their own positions,
portfolios and loans provided to companies and households. In 2008 and 2009
governments across the world had to recapitalize banks and guarantee bank debt.
To prevent recurrence of such problems in the long run the Basel Committee presents
reforms to strengthen global capital and liquidity rules, henceforth Basel III (BCBS,
2010a). This should improve the resilience of individual institutions, but also contribute
to greater stability of the financial system as a whole. The measures of Basel III
intervene in the capital structure of banks. The banking sector has to acquire more
capital and of higher quality. Banks’ balance sheets and capital structures will be
different after the implementation of Basel III. Many bankers argue that equity capital is
expensive and higher capital requirements increase the total cost of funding and the
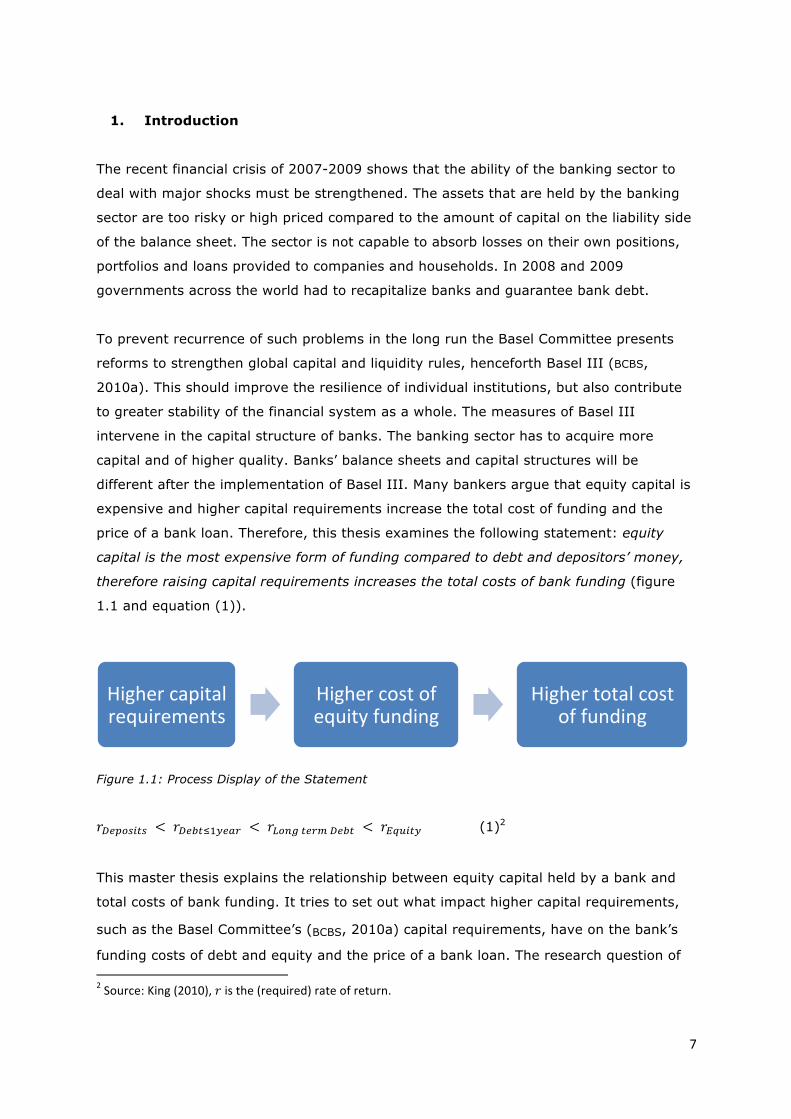
price of a bank loan. Therefore, this thesis examines the following statement: equity
capital is the most expensive form of funding compared to debt and depositors’ money,
therefore raising capital requirements increases the total costs of bank funding (figure
1.1 and equation (1)).
Figure 1.1: Process Display of the Statement
𝑟!"#$%&'% < 𝑟!"#$!!!"#$ < 𝑟!"#$ !"#$ !"#$ < 𝑟!"#$%& (1)2
This master thesis explains the relationship between equity capital held by a bank and
total costs of bank funding. It tries to set out what impact higher capital requirements,
such as the Basel Committee’s (BCBS, 2010a) capital requirements, have on the bank’s
funding costs of debt and equity and the price of a bank loan. The research question of 2 Source: King (2010), 𝑟 is the (required) rate of return.
Higher capital requirements
Higher cost of equity funding
Higher total cost of funding
8
this thesis is: What impact have higher capital requirements on the cost of equity capital
and total funding costs? This study reviews important theoretical literature that is
available on the impact of higher capital requirements. It also analyzes recent papers
that empirically tested the effects of higher capital requirements on total funding costs
and prices of bank loans. The assumptions of these empirical studies are compared to
the fundamental and theoretical insights, including those from Admati et al.’s (2011) key
paper. Analyzing higher capital requirements demands a clear distinction between having
more equity capital (steady state) and raising more equity capital (transition phase). The
dynamics of a steady state and transition phase analysis are rather different.
Based on the Modigliani-Miller capital structure theory (1958), Admati et al. (2011) state
that bank capital is not expensive and that many arguments are fallacious (steady state).
Though, not a few other authors question the applicability of the Modigliani-Miller
theorem on banking. Banks have a certain “special” role, which is to provide liquidity to
the economy and debt is the instrument that banks need to fulfill this role. However, it
turns out that public policy creates distortions in the funding costs of debt and equity,
mainly due to fiscal incentives and government guarantees. The high leverage ratio of
the financial sector is partly explained by these policies that subsidize debt. Higher
capital requirements mean that banks can make less use of these implicit subsidies.
These distortions can be resolved, since they are part of public policy.
This thesis is relevant to financial policy makers, people working in the financial sector
and those engaged in scientific research into capital regulation. It should lead to a better
understanding and awareness of the importance of correct and sufficient capital
regulation in relationship with capital structure. It provides a discussion of “state of art”
theories and concepts written in fundamental papers about capital regulation, capital
structures and bank lending. This thesis explains that public policy favors debt financing
and gives proposals of how policies on taxation and government guarantees can be
reformed, or at least which direction new policies should have to reduce the incentives
for debt financing. It also provides a notion of recapitalization, which reduces the
government guarantee and debt overhang problem. The system has to be robust and
able to absorb losses, while less dependent on government guarantees.
This thesis proceeds as follows. The first part of this thesis focuses on theoretical and
empirical studies of higher capital requirements and funding costs. Starting with chapter
two, it discusses the theoretical insights related to higher capital requirements, the
difference between raising and having more equity capital and what kind of impact this
9
has on banks’ funding costs. Chapter three compares assumptions and results of
empirical studies with the theoretical insights of chapter two. The result of this analysis
emerges two main distortive policies in the discussion of higher capital requirements,
namely corporate tax rules and governments guarantees that implicitly favor debt
financing. These two distortions will be at the center of the second part of this thesis,
respectively chapters four and five. Chapter four elaborates the tax shield methodology,
provides a calculation of the Dutch size of the tax shield and proposes tax policy reforms.
Chapter five sets forth the implicit government guarantee, estimates the size of the
Dutch guarantee and proposes efficient recapitalization in relationship with government
guarantees. This thesis ends with a summary and conclusion in chapter six.
10
PART I Theory and Empirics 2. Higher Capital Requirements: Theoretical Insights
This chapter discusses theoretical concepts and insights related to the capital structure
of banks, banks’ funding costs and higher capital requirements. The basic theory of
capital structure composed by Modigliani and Miller (1958) is the starting point of this
chapter. Many arguments that are put forward by Admati, DeMarzo, Hellwig and
Pfleiderer (2011) are based on this theory of corporate finance. Admati et al. (2011)
explain why bank equity is not expensive and refute many fallacious, irrelevant and/or
very weak arguments. But the academic literature is ambivalent in thinking about the
Modigliani-Miller theorem and its applicability to banks. This chapter also explains
important distinctions between raising more equity capital (transition phase) and having
more equity capital (steady state). The dynamics of raising and having more equity
capital are quite different. Raising more equity capital implies debt overhang problems
and creates information asymmetry problems. Having a higher equity capital ratio in a
new, steady state, equilibrium affects e.g. the benefits of the tax shield and implicit or
explicit government guarantees. This chapter ends with a brief summary and conclusion.
2.1 Modigliani and Miller (1958)
Modigliani and Miller (1958), who wrote a fundamental paper about capital structure,
state that under certain assumptions a firm’s capital structure is irrelevant for I) its value
and II) weighted average cost of capital (WACC). These are known as the Modigliani and
Miller Propositions I and II. The four assumptions made in the frictionless Modigliani and
Miller world are severe; they include no information asymmetry, taxes, financial distress
costs and transaction costs.
Box 2.1 Roles of Capital
Capital is one of the most fundamental concepts in economics. Wherever there is entrepreneurial
activity, investments made and clients served, capital plays an essential role in businesses. It
provides funding, receives profits and is the only mechanism on the balance sheet to absorb
losses. The role of capital can roughly been split into three main characteristics3: 1) as a technical
instrument on balance sheets, 2) as a governance tool and 3) as a systemic buffer.
The first role of capital is technical. The amount of capital relative to the amount of debt is crucial
in this wide debate on the role of capital. The extent to which capital is risky or costly relies on the
leverage of a firm (Modigliani and Miller, 1958) and the riskiness of the assets. The second 3 Inspired by Modigliani and Miller (1958, p. 261) who viewed their main question “what is the cost of capital?” through three perspectives, the one of the corporate finance specialist (technical), the manager (governance) and macroeconomist (systemic level).
11
important and fundamental function of capital is that it monitors the management and distributes
risk among its shareholders. Shareholders are more or less the owners of the company and they
use their voting rights to control or influence management decisions. The agency theory explains
the moral hazard and adverse selection problems (Jensen, 1986). Third, capital provides as a
buffer for the system as a whole to absorb losses. The first and second roles of capital are
important for individual firms, while the systemic role of capital matters the economy as a whole.
Frequently, the systemic role of capital is wrongly separated from the individual interests of a firm
(Admati et al., 2011). Some argue that capital is too expensive and that cheaper debt finance is
preferable (Gorton, 2010). However, this may not be the case if welfare costs of high leverage
ratios are included (Admati et al., 2011). Berger (1995) states that regulators use capital
requirements to create safety nets and to protect the economy from negative externalities. In this
way, the systemic role of capital is taken into account for individual financial institutions.
A second misunderstanding that is important to mention here is that capital is not something to
keep idle or that must be set aside (Admati et al., 2011). Cochrane (2013) states: “capital is a
source of money, not a use of money.” There is a difference between capital requirements and
liquidity or reserve requirements. Capital requirements prescribe banks how to fund themselves
with debt or equity (leverage ratio), while liquidity or reserve requirements relate to the type of
assets and asset mix banks must hold (Admati et al., 2011). Capital requirements address the
right-hand side of the balance sheet and liquidity or reserve requirements the left-hand side.
However, there is a link between capital requirements and assets, because of the Risk Weighted
Assets (RWA) rule that is included in all Basel Accords.4 Nevertheless, once a bank meets reserve or
liquidity requirements, all capital can be used for new loans and investments.5
An important proposition to discuss is whether the Modigliani-Miller theorem is applicable
to banks, under the same assumptions mentioned above. Bank balance sheets and
operations are fundamentally different compared to non-bank firms. For example, banks
produce financial debt instruments such as deposits, short-term commercial paper and
repurchase agreements to provide liquidity to the economy, while non-bank firms do not
fulfill this function. Admati et al. (2011) conclude that, based on the framework of
Modigliani and Miller, higher capital requirements have no significant, long-term,
negative consequences for the economy that offset the benefits. This only concerns the
new equilibrium (steady state), thus after the equity capital is acquired. Miller (1995)
states that the Modigliani-Miller theorem is only applicable ex ante, when equity capital
ratios can be fully anticipated in an equilibrium (at t=0 or t=1). The theorem is not
applicable during the transition phase, the time between t=0 and t=1. The interest rates
on debt do not reflect the new equity capital infusion between t=0 and t=1, simply
4 Each asset that a bank holds is risk-‐adjusted, which means that high risk assets require a higher capital ratio. 5 More about capital and bank lending, see Cebenoyan Strahan (2004) Fabi et al. (2005) Gambacorta, Mistrulli (2004) Inderst, Mueller (2008) Thakor (1996) Elliott (2010a).
12
because most of the debt is already in place and terms and conditions cannot be
renegotiated. However, there is an extensive collection of literature available that
discusses the applicability and relevance of the Modigliani-Miller theorem on banking in
the steady state (the equilibrium of today at t=0). If the Modigliani-Miller theorem does
not hold on banking in its pure form, could increasing capital requirements have
significant consequences for bank’s overall cost of capital and eventually their lending
spreads in the new equilibrium (steady state at t=1)?
The applicability of the Modigliani-Miller theorem is questioned in a paper by Gorton,
Lewellen and Metrick (2011). They argue that bank debt is information-insensitive6
similar to government debt. According to Gorton et al. (2011) and Gorton (2010), bank
debt is immune to adverse selection in trading because agents do not want to acquire
private information about the current health of the bank, since acquiring or generating
information is costly. Gorton et al. (2011) regress the fraction of financial liabilities in the
economy against the fraction of government liabilities in the economy and find that
government and financial liabilities are viewed as acceptable substitutes by investors.
Gorton et al. (2011) argue that bank debt therefore may contain a convenience yield,
like government debt. A convenience yield is a yield below what might be expected
according to standard fixed income calculations7. In other words, investors in bank debt
are willing to accept a lower rate of return due to the implicit or explicit government
guarantee. Gorton et al. (2011) use an average convenience yield of 70 basis points. In
a world with such implicit government guarantees the Modigliani-Miller theorem no
longer holds. Implicit and explicit government guarantees are therefore a distortion in
the pricing of banks’ funding costs. Paragraph 2.3 and chapter five will elaborate on the
distortive effects of implicit government guarantees.
2.2 Modigliani-Miller Theorem versus CAPM
A widely debated consequence of higher capital requirements is that more equity capital
should lower the Return On Equity (ROE). Although many bankers claim that equity
capital is expensive and consider the ROE as fixed, basic corporate finance theory shows
that these propositions are inconsistent. The ROE increases both by more asset risk
and/or more leverage and vice versa. The proposition that more equity capital decreases
the ROE can be interpreted on the basis of two theories. First, the Modigliani-Miller
theorem state that the distribution of total asset risk among more shareholders lowers
6 Note from the author: the definition ‘information-‐insensitive’ seems a contradictio in terminis, like ‘risk-‐free’ is too. 7 For example, the Dutch State has recently issued short-‐term debt with negative interest rates.
13
the ROE, while total funding costs of the bank remain unchanged (proposition II). Admati
et al. (2011) rely heavily on this theorem and proposition. Second, the Capital Asset
Pricing Model (CAPM) calculates the required rate of return of a security (in this case a
bank stock, thus the return on equity) in relation to its risk (𝛽!"#$%& ). The risk (𝛽!"#$%& ) is
dependent on leverage (!!!!
). The CAPM formula states that the ROE (𝑅!"#$%& ) equals the
risk-free rate (𝑅!) plus a risk premium (𝑅!) multiplied by the risk factor (𝛽!"#$%& ):
𝑅!"#$%& = 𝑅! + 𝛽!"#$%& 𝑅! (2)
This model is independent of the Modigliani-Miller theorem and is using different
assumptions. But, since both the Modigliani-Miller theorem and CAPM calculate the ROE,
Gorton et al. (2011) and Miles, Yang, Marcheggiano (2012) find it useful to examine
their relationship. Does the Modigliani-Miller theorem holds simultaneously with CAPM?
Gorton et al. (2011) state that if a bank satisfies the minimum capital requirements it
can produce information-insensitive debt with a convenience yield. Banks that do not
satisfy the minimum capital requirements are considered insolvent: their debt will
become information-sensitive. The existence of a convenience yield on debt breaks the
basic corporate finance theory on capital structure, risk and return. Holding asset risk
and return on assets unchanged, existing shareholders benefit from cheaper debt at the
expense of debt holders (and at the expense of taxpayers when a bail-out is needed).
The implicit government guarantee enables shareholders to receive a higher return. If
banks would follow the corporate finance theory, the advantage of the convenience yield
must result in lower interest rates charged on loans. Because banks can obtain cheaper
debt, they are able to offer loans with lower interest rates. This would imply that the
relationship between the Modigliani-Miller theorem and CAPM does not hold. According to
Gorton et al. (2011), either one of the following two statements can be true:
I. The ROE of banks exceeds their cost of capital under the CAPM. In this case, the
Modigliani-Miller theorem still holds, but CAPM no longer holds (= higher return
on equity with no significant change of risk).
II. Because of the existence of a convenience yield, banks can lower their return
on assets (interest rates charged on loans), leaving the returns on equity and
debt unchanged. Now, the CAPM holds, but Modigliani-Miller Proposition II no
longer holds.8
Gorton et al. (2011) regress bank equity returns against the market portfolio to test
whether statement I is true and banks earn a significant higher equity return given their
8 The required return on assets is independent of the firm’s capital structure.
14
level of risk. They find no abnormal equity return relative to the CAPM, which means
statement II is most likely the case and statement I is not true (Gorton et al., 2011).
Because the counterfactual of statement II is not directly observable, Gorton et al. (2011)
cannot test this statement. However, they assume that the convenience yield influences
the interest rate that banks charge on loans. Banks are driven by competition and will
therefore lower their interest rates charged on loans to gain as much clients as possible.
Gorton et al. (2011) argue that non-bank firms don’t issue similar debt with a
convenience yield, because these firms are able to obtain the same gain as a borrower
by taking out a bank loan with a lower interest rate.
Miles et al. (2012) state that the Modigliani-Miller theorem is unlikely to hold exactly and
use the theorem to assess its relevance for measuring the social costs of more equity
financed lending by banks. They refer to key questions such as how the probability of
crisis falls when banks hold more capital and to what extent the ROE lowers when banks
hold more capital and reduce the risk of that capital. Miles et al. (2012) mention the tax
and guarantee distortions as important factors that influence financial structure. As
mentioned earlier, these distortions ensure that Modigliani-Miller theorem does not hold
completely. Miles et al. (2012) use data on UK banks to test this empirically (chapter 3).
Similar to Gorton et al. (2011), Miles et al. (2012) use the CAPM to test if bank leverage
and risk/return are correlated. The risk of bank assets (𝛽!""#$") is distributed among debt
and equity holders. Therefore, 𝛽!""#$" can be written as follows:
𝛽!""#$" = 𝛽𝑒𝑞𝑢𝑖𝑡𝑦!
!!!+ 𝛽!"#$
!!!!
(3)
(D=debt, E=equity and 𝛽!"#$=risk of debt)
Assuming that debt is riskless (𝛽!"#$ = 0), this equation implies:
𝛽!"#$%& =!!!!𝛽!""#$ (4)
Equation (4) shows the similarity of the CAPM and Modigliani-Miller theorem (Miles et al.,
2012), namely a linear relationship between risk and leverage. Under the assumption of
riskless debt, which is more or less the same as a convenience yield, the ROE depends on
leverage. More equity capital results in a decrease of risk and return on equity.
Miles et al. (2012) regress equation (4) to test the linear relationship between risk and
leverage. Will the CAPM and Modigliani-Miller theorem hold if banks halve their leverage?
This implies that equity risk (𝛽!"#$%& ) is reduced by 50%. Their results show that the
relationship between the Modigliani-Miller theorem and the CAPM does not hold.9 The
9 Gorton et al. (2011) draw the same conclusion.
15
equity risk is not linearly related to leverage because externalities influence the return
on equity.10 However, they use the test results (the coefficients that Miles et al. (2012)
found of the CAPM formula 𝑅!"#$%& = 𝑅! + (𝑎 + 𝑏 leverage)𝑅!) to estimate the weighted
average cost of capital (WACC) assuming that the cost of debt is fixed (risk-free rate)
while leverage halves. As mentioned earlier, the second proposition of the Modigliani-
Miller theorem states that the WACC is irrelevant to the capital structure, therefore the
WACC should not change. Miles et al. (2012) find an increase of the WACC and estimate
that the rise in WACC is only about 55% of what it would be in the absence of the
Modigliani-Miller theorem. In other words, there is a Modigliani-Miller effect and the
theorem holds for approximately 45% of the full extent.
2.3 Having More Equity Capital: Steady State
As the previous paragraphs have shown, the theoretical consequences of higher capital
requirements are ambiguous. This paragraph discusses the dynamics of having more
equity capital on the balance sheet in a new steady state. How can poorly capitalized
banks of today be compared with banks that have a low financial leverage in the new
equilibrium when all banks are better capitalized? Important to mention here is that, ex
ante, the new equilibrium is hard to predict. Today it is unknown how banks’ assets or
liabilities must be priced in the future. However, could bank capital be an attractive and
safe asset class with lower required returns on equity in the new equilibrium?
2.3.1 Cost of Capital Fallacy
The cost of capital fallacy, namely that equity capital is expensive and the return on
equity is fixed at a high level, creates a vicious circle. Once a bank has a capital surplus,
i.e. any “available” equity capital above the minimum capital requirement, it tends to
economize on capital to increase ROE by engaging in certain activities.11 According to
Boot (2013), “putting capital to use” increases the cost of this capital and may not create
value at all. Boot (2013) states that shareholders and other market participants foresee
that banks will economize on capital and thus raise their required return on equity. This
confirms the belief of banks that equity capital is expensive and that the best response
to higher capital requirements is to increase risk on the short-term to realize the
required return in the future. Stating that the cost of capital is also expensive in a new
equilibrium and that the ROE will be (or must be) fixed in a new equilibrium is
fundamentally flawed and misleading, since they do not adjust for risk (Admati et al.,
2011). As a caveat, this belief of banks suggests that the new equilibrium consists of
10 E.g. corporate tax system, government guarantees, capital regulation and market sentiment. 11 E.g. proprietary trading.
16
many more risky assets and activities, which would be the opposite of what higher
capital requirements are meant for.
Despite of this self-fulfilling belief (or vicious circle), Admati et al. (2011) advocate a
banking system with more equity capital. They argue that if the asset risk remains
constant, i.e. no significant change on the left side of the balance sheet, an increase in
capital requirements lowers the ROE due to less leverage. Note that this applies to the
new equilibrium (steady state at t=1). By assuming that asset risk remains constant,
Admati et al.’s (2011) statement is correct: more equity capital distributes risk.
Substantial more equity capital reduces the total per unit risk that is borne by the equity
holder, which should result in lower required rates of return. Thus, holding a bank share
could be an attractive and safe asset class in the new equilibrium when all banks have
more equity capital on their balance sheets and asset risk remains constant.
2.3.2 The Role of Subsidies on Debt in New Equilibrium
The impact of having more equity capital in a new equilibrium is that today’s subsidies
on debt can be less used in the future. On the one hand, more equity capital distributes
risk and lowers the required returns on equity. On the other hand, the implicit
government guarantee and tax shield play a smaller role because there is less debt on
the balance sheet. This could increase the cost of debt. As mentioned earlier, Gorton et
al.’s (2011) analysis indicates that when banks have less information-insensitive debt on
their balance sheet, the benefit from the convenience yield decreases in the new
equilibrium. This also applies to the benefits of the tax shield. The corporate tax system
gives a fiscal incentive to finance with debt, because interest payments on debt are tax
deductible. When there is less debt on the balance sheet, this fiscal advantage of debt
disappears. These reductions of debt-financing advantages increase the total cost of
funding, which according to Gorton et al. (2011) results in higher prices for a bank loan.
Chapters four and five elaborate the tax shield and implicit government guarantees in
more detail and propose some reforms that can be applicable to the new equilibrium and
transition phase.
Following the theory of Admati et al. (2011), Gorton et al.’s (2011) assumptions suffer
from a neglect of external costs and misaligned incentives. Gorton et al. (2011) and
Gorton (2010) argue that banks produce debt, which distinguishes banks from other
companies and makes them “special”. They also state that the economy needs debt and
it is socially desirable that banks produce liquid securities, e.g. securitization of individual
mortgages or short-term commercial paper. Although debt is a useful instrument for the
17
economy, this observation does not imply that banks should be highly leveraged. Admati
et al. (2011) state that investors do not always need those liquid securities in the form
of short-term debt. Bank capital can be a safe and attractive asset class (in a new
equilibrium) for long-term investors that are now holding long-term and senior debt.
Admati et al. (2011) argue that the attractiveness of short-term debt is enhanced when
banks are better capitalized, while investors with longer time horizons hold more equity
capital.
Given the huge costs of the system’s breakdown in the 2007-2009 financial crisis,
Admati et al. (2011) see strong reasons to question the social value of much of this debt
creation that Gorton et al. (2011) advocate.12 The call for more equity capital and the
use of less debt suggest a long-term transition to a banking landscape that is much
different than that of today and hard to predict upfront.
2.4 Raising More Equity Capital: Transition Phase
The road leading to higher capital levels entails other sorts of issues, such as debt
overhang, information asymmetry and stigmatization problems (“new-issuance costs” or
flow costs). Kashyap, Stein and Hanson (2010) explain that there is a crucial distinction
to make when discussing costs of capital in relation to acquiring more equity capital.
First, if a poorly capitalized bank is trying to attract more equity capital from the market,
it could face debt overhang problems while better-capitalized banks do not. Second,
costs associated with information asymmetry also play a bigger role when the bank in
dispute is highly leveraged. Kashyap et al. (2010) state that the frictions of raising more
equity capital are more severe than the “ongoing costs” of holding more equity capital.
2.4.1 Information Asymmetry
An important contribution to the information asymmetry discussion is the flow-cost
theory, which is set up by Myers and Majluf (1984). They explain the difference between
more and less information available for respectively firm management and outside
investors. Assuming that management acts on behalf of existing shareholders, then an
equity issue will be taken as a negative signal, since management prefers to sell shares
when they think shares are overvalued. This is also known as the signaling effect (or
stigmatization) and share issues will tend to be associated with negative share-price
impacts. Because management knows that there is a negative impact of this
12 Admati et al. (2011) state that the financial crisis is due to high leverage ratios and that if the equity cushion was big enough, the crisis did not occur. On the other hand, Gorton et al. (2011) argue that the conversion of information-‐insensitivity debt into information-‐sensitivity debt (e.g. repo) is the cause of the financial crisis and not necessarily the level of debt (leverage).
18
stigmatization, they will postpone or not propose an equity capital issuance. This
disturbs the leverage reduction during the transition phase.
If a bank faces higher capital requirements, it might not be raising new external equity
and instead prefers to shrink its assets and stop lending. Kashyap et al. (2010) conclude
that, in the sense of the Myers-Majluf model and empirical work they have surveyed,
new capital requirements should be phased-in sufficiently, in order to reduce the
information asymmetry problem and to give banks time to generate the necessary
additional capital largely out of retained earnings and maintain lending activities
normally.
On the other hand, Admati et al. (2011) argue that if the share issue decision is not
taken by the management, but required by the regulator, the negative signaling effect
can be neutralized. They refer to the Troubled Asset Relief Program (TARP) in 2009,
where banks didn’t have a choice whether to accept government intervention or not, and
the information asymmetry was not an issue. If new capital requirements are
accompanied by regulation mandating all banks to issue new shares at a pre-specified
scheme, the negative signaling effect would be removed, and banks have no reason to
reduce lending in order to meet the new capital requirements during the transition phase
(Admati et al., 2011). Also Admati et al. (2011) recommend regulators to postpone
dividend payments by banks for a period of time, and use the retained earnings to build
up bank capital. Again, if done under force of regulation, this will not lead to a negative
signaling effect on the health of any particular bank (Admati et al., 2011).
2.4.2 Debt Overhang
In addition to the information asymmetry problem, poorly capitalized banks face debt
overhang problems. Myers (1977) was the first to describe the problem of debt overhang.
For a firm with outstanding debt, equity capital issuance reduces leverage. Leverage
reduction of these firms benefits existing debt holders and providers of debt guarantees.
For each unit of equity capital that is added to the balance sheet, debt becomes safer
and a transfer of value takes place from shareholders to existing debt holders (“dilution”)
during the transition phase. This transfer of value leads to underinvestment; new (partial
equity financed) projects are not carried out, because dilution will occur (Myers, 1977).
In a paper about debt overhang in relation to banks, Admati, DeMarzo, Hellwig and
Pfleiderer (2012) state that shareholders do not want to reduce the leverage even if the
reduction would not change the total value of the bank. In some cases, new equity
19
capital that is invested in good assets (loans with positive NPV) might increase the total
value of the bank. Due to debt overhang and the “addiction” to leverage new loans are
not provided (Admati et al., 2012). During financial crises, when the probability of
default is significantly higher, debt overhang problems partly explain the credit rationing.
Repayments of existing loans are used to strengthen the banks’ balance sheets.
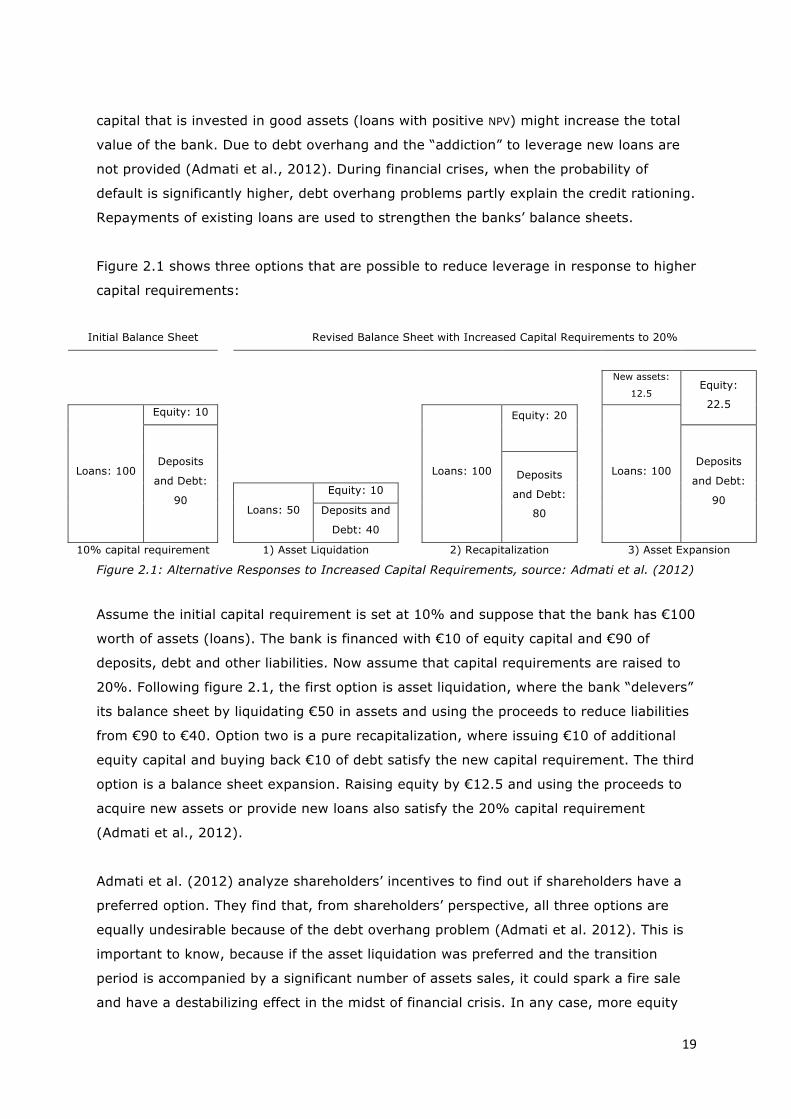
Figure 2.1 shows three options that are possible to reduce leverage in response to higher
capital requirements:
Initial Balance Sheet Revised Balance Sheet with Increased Capital Requirements to 20%
New assets:
12.5 Equity:
22.5
Loans: 100
Equity: 10
Loans: 100
Equity: 20
Loans: 100 Deposits
and Debt:
90
Deposits
and Debt:
90
Deposits
and Debt:
80
Loans: 50
Equity: 10
Deposits and
Debt: 40
10% capital requirement 1) Asset Liquidation 2) Recapitalization 3) Asset Expansion
Figure 2.1: Alternative Responses to Increased Capital Requirements, source: Admati et al. (2012)
Assume the initial capital requirement is set at 10% and suppose that the bank has €100
worth of assets (loans). The bank is financed with €10 of equity capital and €90 of
deposits, debt and other liabilities. Now assume that capital requirements are raised to
20%. Following figure 2.1, the first option is asset liquidation, where the bank “delevers”
its balance sheet by liquidating €50 in assets and using the proceeds to reduce liabilities
from €90 to €40. Option two is a pure recapitalization, where issuing €10 of additional
equity capital and buying back €10 of debt satisfy the new capital requirement. The third
option is a balance sheet expansion. Raising equity by €12.5 and using the proceeds to
acquire new assets or provide new loans also satisfy the 20% capital requirement
(Admati et al., 2012).
Admati et al. (2012) analyze shareholders’ incentives to find out if shareholders have a
preferred option. They find that, from shareholders’ perspective, all three options are
equally undesirable because of the debt overhang problem (Admati et al. 2012). This is
important to know, because if the asset liquidation was preferred and the transition
period is accompanied by a significant number of assets sales, it could spark a fire sale
and have a destabilizing effect in the midst of financial crisis. In any case, more equity
20
capital increases debt holders’ safety and value. Admati et al. (2012) emphasize that
these problems would be less significant when the banking system is better capitalized.
2.5 Conclusion
This chapter discussed important insights and concepts related to capital structure of
banks, banks’ cost of funding and higher capital requirements. In conclusion, banks are
“special” and have some unique dynamics on their balance sheets (e.g. deposits).
However, some important corporate finance insights are applicable to banks and should
be taken into account when discussing the capital structure of banks. The Modigliani-
Miller theorem holds partially and is independent of CAPM. The theorem is also useful to
expose and identify frictions and distortions. The impact of higher capital requirements
on the total cost of funding is negatively affected mainly by two externalities. First,
implicit and explicit government guarantees affect the banks’ cost of funding due to a
discount on the interest rates on debt: the convenience yield. Second, the tax shield is
also subsidizing debt and makes the total cost of funding cheaper. These problems, and
many more issues, play a minor role when the banking system is better capitalized;
hence higher capital requirements are necessary to reduce frictions and distortions.
The theoretical analysis of discussing and implementing higher capital requirements
must be segregated in two ways, namely having more equity capital and raising more
equity capital. The self-fulfilling beliefs of banks that having more equity capital is
expensive and the ROE is fixed are fundamentally flawed. Having more equity capital
reduces the required return on equity, since risk is distributed among more shareholders.
It is therefore misleading if banks engage in risky activities to remain their ROE constant.
In the new equilibrium (steady state, when all banks are better capitalized), bank capital
can be an attractive and safe asset class to hold in the portfolio, with a low risk profile
and a reduced required return on equity.
Raising more equity capital could transfer value from shareholders to existing debt
holders. This so-called debt overhang problem makes the decision to acquire more
equity capital difficult for banks’ shareholders and managers. Along with information
asymmetry problems, high leverage ratios are hard to breach by raising more equity
capital. The combination of these two problems demands that higher capital
requirements should be phased in gradually. However, these problems can be alleviated
if the regulator requires banks to postpone dividend payouts and to issue new equity
capital on short notice under force of that same regulator.
21
3. Empirical Studies on Higher Capital Requirements
This chapter surveys five recently published, empirical-based papers and publications on
the effect of higher capital requirements on loan growth and bank lending spreads. In
chronological order of publication it discusses Kashyap, Stein and Hanson (2010), King
(2010), Angelini et al. (2011), Cosimano and Hakura (2011) and Santos and Elliot
(2012). The assumptions and results of these studies are compared with the theoretical
concepts and insights discussed in chapter two. These five studies empirically test the
long-run impact of higher capital requirements. Their results relate to a new, steady
state, equilibrium. Some of these papers mention the transition phase briefly by
explaining debt overhang and asymmetry information problems. These problems are not
involved in their empirical parts, with the exception of Santos and Elliott (2012). In some
cases, chapter two will be complemented with other insights and arguments. A summary
and conclusion form the end of the chapter.
3.1 Kashyap, Stein and Hanson (2010)
Kashyap, Stein and Hanson (2010) examine the impact of “substantially heightened”
capital requirements on large financial institutions, and on their customers. They begin
their empirical study by validating the Modigliani-Miller theorem. A large sample of banks
is used to test if the 𝛽!"#$%& halves when the equity capital ratio is doubled (similar to
Miles et al. (2012)). The regression results are roughly in line with what is predicted
upfront. There is some empirical evidence that justifies the use of the Modigliani-Miller
theorem for further calibrations. Note that Kashyap et al. (2010) assume, for simplicity
matters, that debt is risk-free (𝛽!"#$), which implies the existence of a convenience yield.
Their baseline regression results are not corrected for the loss of subsidized debt when
the equity capital ratio is doubled. Thus, the Modigliani-Miller effect must be dampened.
The second conclusion Kashyap, Stein and Hanson (2010) draw is that if the minimum
capital ratio is raised by ten percentage points, the loan rates will increase by 25-45
basis points13 according to their methodology. This applies to the new equilibrium
(steady state). They qualify this as a minor change in loan rates and small in absolute
terms. The outcomes are only as good as the model that underlies them and the main
assumption of the model is the loss of the tax shield when debt is replaced with equity.
They assume the cost of long-term debt is 7% and the corporate tax rate is 35%. Thus a
ten percentage points increase of the capital ratio would raise the lending spread with 25
basis points (=10% x 7% x 35%). Kashyap et al. (2010) correct for the loss of 13 100 basis points = 1 percent.
22
subsidized debt in an aggressive case (violation of the Modigliani-Miller theorem) and
find an increase of the lending spread by 45 basis points.
There is an incentive for banks to be highly leveraged, because of these benefits
provided by a convenience yield and the tax shield. Admati et al. (2011) explain that
when debt has indeed a tax advantage over equity, this assumption is correct, but
irrelevant to capital regulation. Both capital regulation and tax rules are matters of public
policy. Tax policy should aim at discouraging behavior that generates negative
externalities, such as increases in leverage ratios. High leverage ratios raise the
probability of bank failures and weaken the financial system. The probability of
government intervention, using public funds, is also increased (Admati et al., 2011).
The final conclusion of Kashyap, Stein and Hanson (2010) is that intense competition
drives the banks in the direction of high leverage. The most competitive advantage that
banks have is the ability to fund themselves cheaply (i.e. short-term debt or “repo”14).
Even the smallest increase in cost of funding relative to direct competitors can lead to
the loss of much business (Kashyap, Stein and Hanson, 2010). They also argue that
substantially heightened capital requirements will lead to greater banking activity within
the so-called “shadow banking” sector due to these competition forces. This
phenomenon is also known as regulatory arbitrage. Kashyap et al. (2010) find empirical
evidence that large banks in particular tend to hold less capital and are able to exploit
regulatory arbitrage. Admati et al. (2011) point out that most activities and entities in
the “shadow banking system” relied on commitments made by regulated entities, and
thus were within regulators’ reach. They believe it is unhelpful in the context of the
capital regulation discussion to refer to the “shadow banking system” like that. Capital
regulation is focused on reducing excessive leverage and regulators should be able to
assess the true leverage of banks. This includes banks’ contribution to the entities within
“shadow banking system” that are being used to hide leverage and exposures (Admati et
al., 2011). Obligations to the shadow banking system could be higher than expected.
3.2 King (2010)
The second paper, a BIS working paper by King (2010), outlines a methodology for
mapping the increases in capital and liquidity requirements proposed under Basel III to
bank lending spreads. He finds that a one-percentage point increase (steady state) in
the capital ratio can be recovered by increasing lending spreads by 15 basis points. This
is a bigger change in the lending spread compared to the figures Kashyap, Stein and 14 For the role of repo financing, see Gorton (2010) and Gorton and Metrick (2010).
23
Hanson (2010) estimated with their methodology. King’s (2010) most important
assumption is that the return on equity (ROE) and the cost of debt are unchanged when
more equity capital is acquired. He argues that theoretically both the cost of debt and
the cost of equity should decline as leverage decreases and the risk of default becomes
smaller, but it is not evident that these theories hold in practice (King, 2010). According
to King, this is due to implicit government guarantees on bank debt, which reduce the
risk of default, leading shareholders to expect a lower ROE. At the same time King (2010)
mentions the implicit subsidy on cost of deposits due to the deposit insurance schemes,
lowering the cost of wholesale funding compared to firms with similar leverage ratios. As
mentioned in chapter two, bankers argue that higher capital requirements will increase
funding costs, since indeed more equity capital will reduce banks’ ability to benefit from
these guarantees and subsidies. Following this reasoning, capital is indeed expensive.
Admati et al. (2011) argue that this is not a legitimate reason for regulators not to
propose new capital requirements. The existence of these subsidies cannot be neglected,
but that does not justify high leverage ratios. Admati et al. (2011) find it paradoxical
that the government subsidizes the leverage of banks at the same time that it
recognizes that this leverage is socially very costly and considers imposing higher capital
requirements to prevent the banks from taking advantage of this subsidy.
Admati et al. (2011) make a clear distinction between private costs and social costs,
which is important to do when empirically testing higher capital requirements. King
(2010) seems to neglect this. Similar to the case of the tax advantage of debt,
government guarantees on debt concern private costs of bank capital. Admati et al.
(2011) take into account the default risks borne by the taxpayer and the costs of these
risks to taxpayers as social costs. Once these costs are included, there is a strong case
for requiring banks to have more equity capital. Equity cushions are valuable, as they
reduce the likelihood and cost of the guarantees (Admati et al., 2011). Note that this
refers to the new equilibrium (steady state).
King (2010) holds the ROE and the cost of debt constant while calculating the effects of
new capital requirements. This is contrary of what should happen according to the
Modigliani-Miller theorem, as extensively stated in chapter two. Raising the amount of
capital should reduce risk per unit of capital and thus lower the ROE. King (2010)
mentions that it is possible to empirically identify an inverse relationship between bank
24
capital ratios and historical ROEs, with lower returns for more highly capitalized banks.15
Because there is a lack of data on secondary market prices for bank debt, the empirical
relationship between bank capital ratios and the cost of wholesale funding is less clear
(King, 2010). Therefore, King (2010) argues that it is reasonable to assume that ROE and
cost of debt are unchanged despite new higher capital levels. This is false, since ROE does
not adjust for risk. King’s (2010) reasoning shows a misunderstanding of the way in
which risks must be taken into account when calculating the cost of funding. Referring to
chapter two, the required return on equity is higher than the required return on debt and
this difference reflects the greater riskiness of equity relative to debt. Reducing the
amount of capital (increasing leverage) has an effect on the riskiness of debt and equity
and, therefore, on the required expected return on equity.
Modigliani and Miller (1958) state that, with or without tax advantages and public
subsidies to debt and deposits, increasing the amount of equity simply re-distributes the
total risk that is borne by investors in the bank, the right side of the balance sheet. The
total risk of the bank is given by the risks that are inherent in the bank’s asset return,
the left side of the balance sheet (Admati et al., 2011). According to the Modigliani-Miller
theorem, changing the capital structure must affect the return on equity and cost of debt,
therefore King’s (2010) assumption cannot hold. King’s (2010) calculations and test
results are incomplete, since previous mentioned arguments are not taken into account.
3.3 Angelini et al. (2011)
The third paper, a NY Fed Staff Report by Angelini et al. (2011), assesses the long-term
economic impact of the new regulatory standards (the Basel III reform). In line with
Kashyap et al. (2010) and King (2010), this third study also examines the steady state
(new equilibrium). However, Angelini et al.’s (2011) method is a completely different
approach compared to Kashyap et al. (2010) and King (2010), which have studied the
new capital requirements at the level of banks’ balance sheets and used partial
equilibrium models.16 Angelini et al. (2011) address the impact of the new capital
requirements on economic performance and fluctuations. They also discuss the adaption
of countercyclical capital buffers on economic fluctuations. When the economy is
booming (shrinking), capital ratios should be increasing (decreasing). Angelini et al.
(2011) use different general equilibrium models to calculate output17, welfare18 and
consumption. The general equilibrium theory assumes that investments and savings are 15 This is similar to the Modigliani-‐Miller effect mentioned in chapter two. 16 Assuming other sectors are not affected due to the change in the banking sector, hence ceteris paribus. 17 Output is the volatility of macroeconomic variables. 18 The welfare-‐model of Van den Heuvel (2008) is a well-‐known example.
25
in equilibrium and equal, therefore savings are needed when capital investments
increase across different sectors. A conversion of savings into investments in the
financial sector changes the equilibrium of welfare, consumption and economic output for
all sectors. Angelini et al.’s (2011) focus is on the costs of the new regulation and how
these costs affect the behavior of supply and demand in the whole economy. A highly
stylized version of the new scenario (higher capital requirements, conversion of savings
into investments) is translated into model inputs and different variables. The results, or
the model output, are steady state values and volatility of key macroeconomic variables,
which determine the new general (macro) equilibrium (Angelini et al., 2011).
Angelini et al. (2011) derive three results about long-term economic performance,
fluctuations and countercyclical capital buffers. The first result is that a one-percentage
point increase in the capital ratio translates into a 0.09 percent output loss relative to
the level that would have prevailed in the absence of capital tightening. Their
interpretation of this figure is that the impact on long-term economic performance is
modest, which is in line with results obtained in similar studies19 (Angelini et al., 2011).
The second estimate is about the impact of higher capital requirements on economic
fluctuations. According to Angelini et al. (2011), higher capital requirements should
dampen output volatility (the magnitude of economic shocks). Their used models
estimate that a one-percentage point increase in the capital-to-asset ratio reduces the
standard deviation of output by 1.0 per cent, which they opine as a modest result.
Angelini et al. (2011) also find that a one per cent increase in capital raises the lending
spread with 13 basis points20. The final result of Angelini et al. (2011) is that a
countercyclical capital buffer could have a more sizeable dampening effect on output
volatility. The equity capital buffers that are accumulated in good times reduce the
downward impact of an economy in recession.
A modest loss of welfare, as Angelini et al. (2011) estimated, could suggest that
increasing capital requirements reduces the ability of banks to provide loans or hold
deposits, which can be consumed. Admati et al. (2011) claim that increasing capital
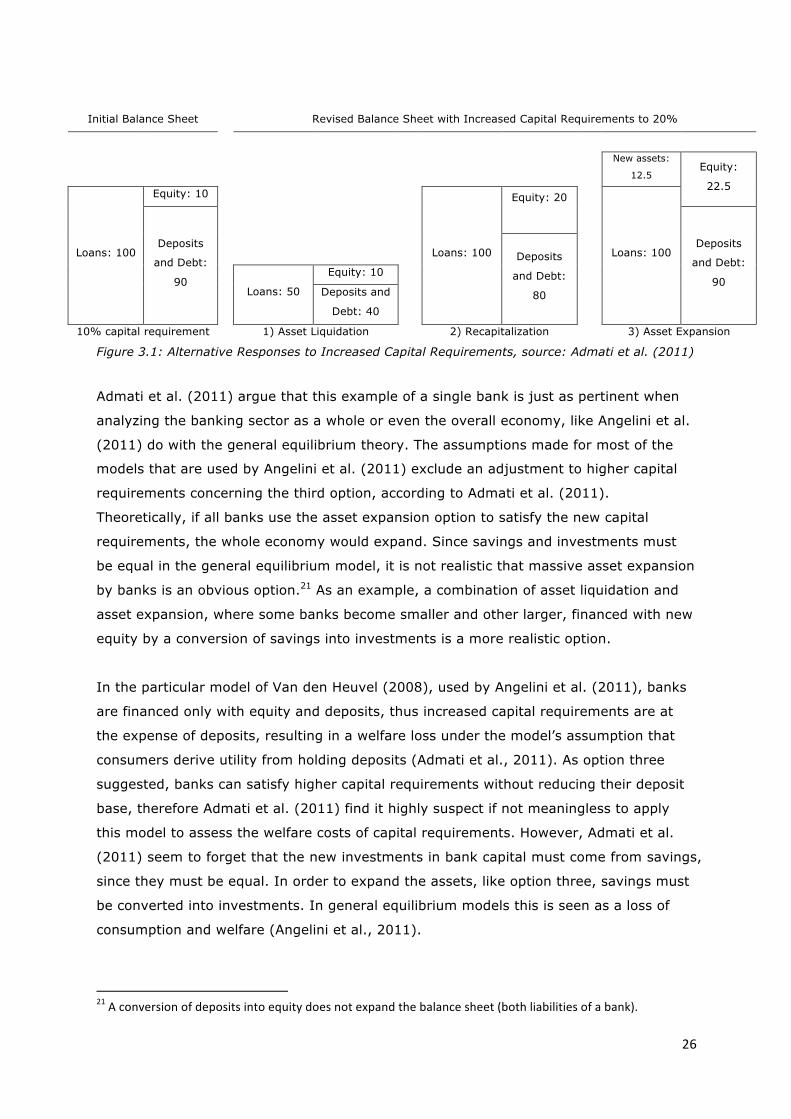
requirements do not have to lead to a decline of welfare. Figure 2.1 from chapter two
provides three options that are possible to reduce leverage. The third response, asset
expansion, gives a bank the opportunity to increase the equity capital ratio, while at the
same time providing new loans to the economy.
19 MAG (2010b), BCBS (2010b). 20 King (2010) estimates a comparable increase.
26
Initial Balance Sheet Revised Balance Sheet with Increased Capital Requirements to 20%
New assets:
12.5 Equity:
22.5
Loans: 100
Equity: 10
Loans: 100
Equity: 20
Loans: 100 Deposits
and Debt:
90
Deposits
and Debt:
90
Deposits
and Debt:
80
Loans: 50
Equity: 10
Deposits and
Debt: 40
10% capital requirement 1) Asset Liquidation 2) Recapitalization 3) Asset Expansion
Figure 3.1: Alternative Responses to Increased Capital Requirements, source: Admati et al. (2011)
Admati et al. (2011) argue that this example of a single bank is just as pertinent when
analyzing the banking sector as a whole or even the overall economy, like Angelini et al.
(2011) do with the general equilibrium theory. The assumptions made for most of the
models that are used by Angelini et al. (2011) exclude an adjustment to higher capital
requirements concerning the third option, according to Admati et al. (2011).
Theoretically, if all banks use the asset expansion option to satisfy the new capital
requirements, the whole economy would expand. Since savings and investments must
be equal in the general equilibrium model, it is not realistic that massive asset expansion
by banks is an obvious option.21 As an example, a combination of asset liquidation and
asset expansion, where some banks become smaller and other larger, financed with new
equity by a conversion of savings into investments is a more realistic option.
In the particular model of Van den Heuvel (2008), used by Angelini et al. (2011), banks
are financed only with equity and deposits, thus increased capital requirements are at
the expense of deposits, resulting in a welfare loss under the model’s assumption that
consumers derive utility from holding deposits (Admati et al., 2011). As option three
suggested, banks can satisfy higher capital requirements without reducing their deposit
base, therefore Admati et al. (2011) find it highly suspect if not meaningless to apply
this model to assess the welfare costs of capital requirements. However, Admati et al.
(2011) seem to forget that the new investments in bank capital must come from savings,
since they must be equal. In order to expand the assets, like option three, savings must
be converted into investments. In general equilibrium models this is seen as a loss of
consumption and welfare (Angelini et al., 2011).
21 A conversion of deposits into equity does not expand the balance sheet (both liabilities of a bank).
27
Concluding, Angelini et al. (2011) seem to neglect the social costs that arose from
misalignments and distortions underlying the system’s breakdown in the crisis. Angelini
et al. (2011) focuses on costs in terms of the loss of welfare and consumption. In 2008,
Van den Heuvel concluded that capital requirements were too high and he estimated that
one upper bound for the cost of a one-percentage point increase in capital requirements
is $1.8 billion per year. Given these facts, Admati et al. (2011) find it remarkable that
Van den Heuvel’s (2008) welfare-model is used by Angelini et al. (2011). The loss of
output, consumption or welfare due to higher capital requirements is significantly smaller
than the costs of the financial crisis (Admati et al., 2011). If more equity capital reduces
the costs of financial crises, than equity capital should be taken into account as a benefit.
3.4 Cosimano and Hakura (2011)
The fourth paper that is discussed, an IMF Working Paper by Cosimano and Hakura
(2011), investigates the impact of the new capital requirements of Basel III on bank
lending rates and loan growth (steady state, new equilibrium). The method used by
Cosimano and Hakura (2011) models three variables simultaneously; the generalized
method of moments (GMM). The first variable that Cosimano and Hakura (2011) regress
is the choice of capital, depending on the capital requirement, interest rate on deposits,
noninterest costs of loans and total assets (Cosimano and Hakura, 2011). The second
regression variable is the loan rate, which is dependent of the first variable plus interest
rate on deposits, costs of loans and economic activity. The last step they examine is the
elasticity of bank loans, for which they use the loan rate from the second regression. The
elasticity of bank loans indicates the effect of higher capital requirements and loan rates
on loan growth. Cosimano and Hakura (2011) assume that higher capital requirements
raise banks’ marginal cost of funding, which leads to higher lending rates. They also
assume that the ROE is fixed, which means that all costs of increasing capital are
reflected by a higher loan rate. This is a violation of the Modigliani-Miller theorem, as
mentioned earlier. The last assumption is that bank liabilities consist only of equity and
deposits (Cosimano and Hakura, 2011). Three different groupings of banks are (cross-
country) analyzed: 1) the 100 largest banks worldwide; 2) commercial banks or bank
holding companies (BHC’s) in advanced economies that experienced the 2007-2009 crisis;
and 3) commercial banks or BHC’s that did not experience the 2007-2009 crisis.
The first finding of Cosimano and Hakura (2011) is that a one percent increase in the
capital requirement (equity-to-asset ratio) raises the loan rate for the 100 largest banks
with 12 basis points. For the second group, banks that faced the 2007-2009 crisis, a one
percent increase is associated with a 9 basis points average increase in the loan rate.
28
The banks that did not experience the 2007-2009 crisis have a 13 basis point average
increase. Cosimano and Hakura (2011) also find a 12 basis point increase in marginal
cost of equity relative to the marginal cost of deposits, which is evidence against the
Modigliani-Miller theorem. Chapter two explained that there is a Modigliani-Miller effect,
thus not all assumptions hold in their pure form. A higher level of equity would reduce
the riskiness of the bank equity such that the ROE declines. However, Cosimano and
Hakura (2011) refer to the government guarantees and subsidies as a possible source of
the higher cost of equity. Since there is less room for subsidized debt, as stated in
chapter two, total cost of funding becomes higher and thus raising equity capital is
expensive. It is therefore not surprising that they find these increases.
Cosimano and Hakura (2011) use the increases in loan rates to estimate the loan
demand or elasticity for the three groups and different countries. The 100 largest banks
estimations imply a reduction in the volume of loans by on average 1.3 percent in the
long run when Basel III is in force (1.3 percent increase of equity-to-asset ratio).
Cosimano and Hakura (2011) use 2007 data as baseline scenario, which is outdated (see
paragraph 2.5). For banks in countries that experienced the 2007-2009 crisis,
implementing Basel III would reduce loan growth with 4.6 percent on average and 14.8
percent for banks in countries that did not experience the 2007-2009 crisis (Cosimano
and Hakura, 2011). According to Cosimano and Hakura (2011), the wide variance in the
results of loan rate increases and loan demand decreases reflects the differences
between countries’ interest elasticity of loan demand and bank’s net cost of raising
equity.22
Admati et al. (2011) state that highly leveraged banks are generally subject to
distortions in their lending decisions, such as frictions23 associated with governance and
information. This may lead to worse lending decisions compared to a better-capitalized
bank. If shareholders and management of a highly leveraged bank work on the basis of
ROE, they have incentives to make excessively risky investments, especially when
governments guarantee debt. The upward potential, a high ROE, is intended for
shareholders and managers, while the downward potential is shifted to taxpayers.
Cosimano and Hakura (2011) show that higher capital requirements raise lending rates
and reduce loan growth. Admati et al. (2011) would see this as a social benefit, since
excessive lending is reduced. The reduce in loan growth is not a necessity as is shown in
22 Differences in cost of capital are due to different tax policies and ex-‐ and/or implicit government guarantees on debt and deposits across countries. 23 i.e. agency theory, moral hazard, asymmetric information, debt overhang.
29
figure 3.1, thus there should be no concern with any negative impact on the economy of
increased equity capital requirements (Admati et al., 2011). However, this argument is
questionable when a general equilibrium method from Angelini et al.’s (2011) paper is
used where savings and investments are assumed to be equal.
3.5 Santos and Elliott (2012)
As stated in the introduction of this thesis, the first reason for higher capital
requirements is to strengthen the resilience of banks and the banking sector (BCBS,
2010). The previous four studies showed that, with or without correct and justified
assumptions, higher capital requirements result in higher cost of funding and ultimately
higher loan rates in a new equilibrium. In addition to higher loan rates due to the loss of
tax advantage and government guarantees, Santos and Elliott (2012) compose three
extensions of methodologies used by Kashyap et al. (2010), King (2010), Angelini et al.
(2011) and Cosimano and Hakura (2011). These extensions lead to substantially lower
net economic costs and are more in line with arguments of Admati et al. (2011). Santos
and Elliott (2012) state that financial reform comes at a price and that higher capital
requirements do add operating costs for banks that result in higher loan rates. However,
Santos and Elliott (2012) estimate in their study that loan rate increases will likely be
significantly smaller compared to King (2010) and Angelini et al. (2011).24
The first extension of Santos and Elliott (2012) is that market forces demand banks to
have greater safety margins above the minimum capital requirement. They state that
simply comparing the new Basel capital requirements with the old misses the crucial
point that banks hold capital on top of the minimum requirements, as a result of their
own desire to operate safely and because of pressure from the markets and rating
agencies (Santos and Elliott, 2012). Therefore, Santos and Elliott (2012) use the end-
2010 levels as baseline for their estimates, which are higher than the Basel II capital
requirements. The distance between end-2010 levels and Basel III is smaller.
The second extension of Santos and Elliott (2012) assumes that banks will cut costs and
take other measures to reduce the effect on loan rates and remain competitive. This
accounts for an average reduction of 14 basis points on the lending rate (end-2010
24 In the IMF Staff Discussion Note by Santos and Elliott (2012), the estimates are mainly compared to official BIS, IIF and OECD studies.
30
levels versus Basel III capital requirements). Santos and Elliott (2012) mention eight
different bank responses to cost increases which they have included in their study.25
The final extension is more in line with Admati et al. (2011), namely investors will lower
their required rate of return on bank equity when the bank reduces its leverage and
improves safety (Santos and Elliott, 2012). Holding the ROE fixed at a high level is
misleading, as explained in chapter two. With these three extensions taken into account,
Santos and Elliott (2012) estimate that average loan rates increase by 28 basis points in
the United States, 17 basis point in Europe and 8 basis points in Japan in the long term
because of the new capital requirements. Santos and Elliott (2012) mention by
comparison that the smallest step by which central banks change the interest rate is 25
basis points, which has no dramatic effect on the economy. Note that Santos and Elliott
(2012) assume that during the transition phase many permanent cost-saving measures
are implemented.
3.6 Conclusion
This chapter analyzed five empirical-based studies that researched the impact of higher
capital requirements on bank funding costs. The assumptions made in these studies are
compared with the theory of chapter two. The first four studies mainly examined the cost
side of higher capital requirements in a new equilibrium, the steady state. Overall, some
benefits of higher capital requirements are mentioned, but generally not taken into
account in the empirical tests and calculations. King (2010), Angelini et al. (2011) and
Cosimano and Hakura (2012) find substantial increases of funding costs when higher
capital requirements are implemented. The figures are in the range of 12 to 15 basis
points for each percentage point that equity capital increases. However, under the
assumption of fixed and high-level ROE’s and neglecting social benefits of a better-
capitalized banking system, these conclusions are misleading, flawed and/or incomplete.
Admati et al. (2011) and Miles et al. (2012) advocate an empirical analysis of the impact
of higher capital requirements that considers not only costs, but also benefits of
increased equity capital ratios. Such an analysis requires a clear distinction between
costs and benefits to individual banks (private costs and benefits) and overall economic
or social costs and benefits. The empirical studies discussed in this chapter show that
private costs of banks may rise. The loss of subsidized debt on the balance sheet when
more equity capital is acquired cannot be ignored. On the other hand, private benefits
25 See Santos and Elliott (2012, p. 8). Many costs savings can be realized due to increased safety and lower volatility. Admati et al. (2011) mention these effects as the largest benefit of increased capital requirements.
31
are difficult to quantify when the ROE is assumed to be fixed. Therefore the outcomes are
biased to the cost side of higher capital requirements. For a more balanced empirical test
of a new equilibrium, the following four factors should be included (Miles et al., (2012)):
1) Changes in required return on debt and equity as capital structure changes.
2) Changes in weighted average cost of capital (WACC) due to a different capital
structure and tax treatments of debt and equity. 26
3) A lower probability of banking problems as equity buffers rise (safety net).
4) Economic costs generated when banking sector problems arise (bailouts).
The empirical parts of the studies by Santos and Elliott (2012) and Miles et al. (2012) do
take into account these beneficial factors and find significantly lower increases of steady
state funding costs. Furthermore, Miles et al. (2012) even find that the optimal level of
bank capital relative to the proportion of GDP is between 8 and 10 percent of total bank
assets.27 This estimation is twice the capital requirement of Basel III.
The five papers discussed in this chapter generally agree that public policies, such as the
corporate tax system and implicit government guarantees, create subsidized debt. The
main conclusion that can be derived from the empirical studies is that most of the
increase of funding costs due to higher capital requirements is caused by the loss of this
subsidized debt on the balance sheet (steady state). This subsidized debt creates an
incentive for banks to prefer debt financing and to be highly leveraged. The transition
towards a better-capitalized banking system is easier when these negative externalities
are removed. Therefore, higher capital requirements should be complemented with
reforms of policies concerning the corporate tax system and implicit government
guarantees.
26 Note that all analyzes discussed in this chapter assume that asset risk and return are unchanged in a new equilibrium (for simplicity matters). As stated in chapter two, the self-‐fulfilling belief that equity capital is expensive may cause risk-‐seeking bank managers during the transition phase. Santos and Elliott (2012) add to this that banks will cut operational costs to increase equity capital buffers and remain competitive. 27 The capital must be explicitly loss absorbing.

32
PART II Tax Shield, Government Guarantee and Policy Reforms 4. Tax Shield on Debt
The first part of this thesis, chapters two and three, eventually showed that tax policies
and government guarantees are serious distortions in the discussion about higher capital
requirements and bank capital structure. The second part, chapters four and five,
respectively scrutinizes the corporate tax policy and implicit government guarantee. This
chapter investigates, as an example, the Dutch situation of how the tax shield on debt
works and what the relative size is. The theory and empirics discussed in part I clarify
that high-leveraged banks benefit from the tax shield and that deleveraging creates a
loss of tax shield in a new equilibrium. Since interest payments on debt are fiscally
deductible, banks have an (implicit) incentive to prefer debt when financing new loans.
For example, if a bank pays 7% interest rate on their debt, it actually costs 7% x (1 –
corporate tax rate). This fiscal benefit, the tax shield, is part of many funding cost
calculations. Banks’ earnings are significantly higher due to lower tax payments. This
negative externality encourages banks to be more leveraged. Therefore, this chapter
ends with a possible reform of the corporate tax policy.
4.1 The Methodology of Debt Tax Shield Calculation
In a straightforward cost of capital or funding cost calculation the interest rate on debt,
determined by 𝑟!"#$, is corrected for the corporate tax rate, 𝑇!:
𝑊𝐴𝐶𝐶 = !!!!
×𝑟!"#$%& +!
!!!×𝑟!"#$× 1 − 𝑇! (5)28
An annual report of a bank does not provide a calculation for the size and value of its tax
shield. A very simplified example shows the methodology how it is accounted. Assume
bank A having €100 interest income (e.g. loans and mortgages) and €72 interest
expenses (e.g. debt and deposits). Also assume that bank B is a 100%-equity financed
bank (no debt or deposits, therefore no interest expenses) with similar assets providing
€100 interest income. The profit and loss accounts of both banks state the following:
Table 4.1: Profit and Loss Account, Tax Shield, source: author compilation
28 Berk and DeMarzo (2008) Corporate Finance, Pearson Education Ltd.
Bank A Bank B
Interest income €100 Interest income €100
Interest expenses -72 Interest expenses 0
Profit 28 Profit 100
Taxes (tax rate 25%) 7 Taxes (tax rate 25%) 25
Net profit €21 Net profit €75
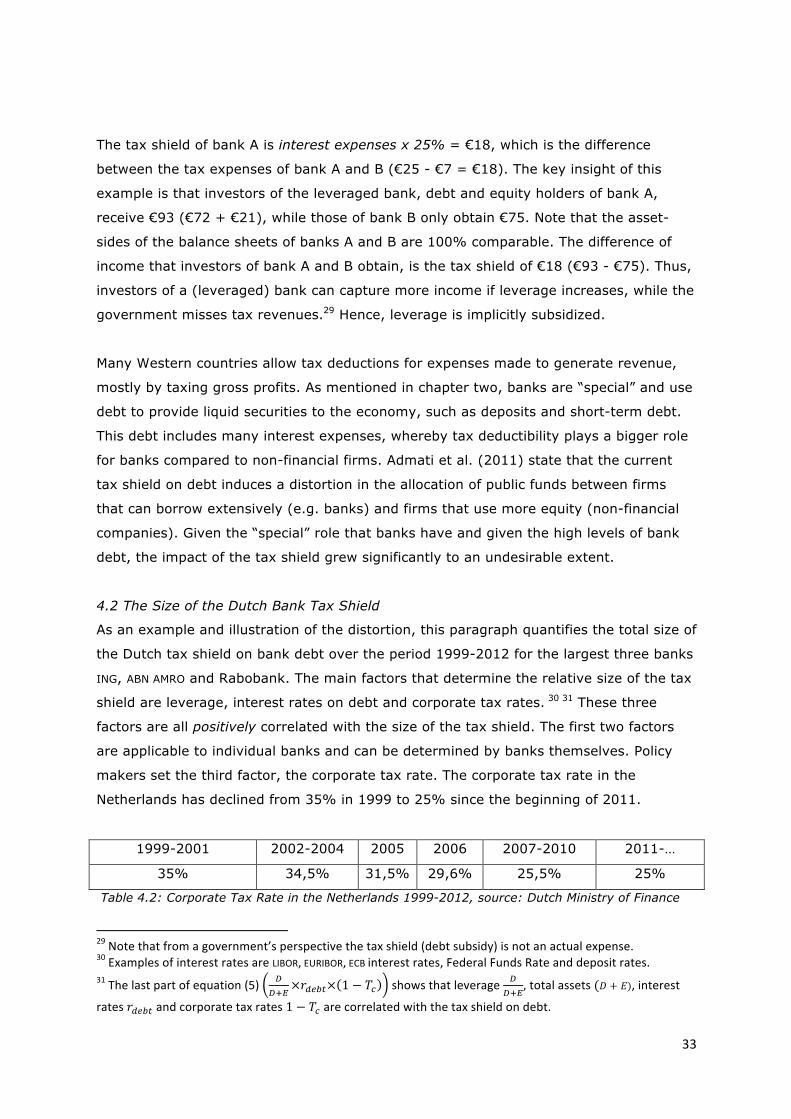
33
The tax shield of bank A is interest expenses x 25% = €18, which is the difference
between the tax expenses of bank A and B (€25 - €7 = €18). The key insight of this
example is that investors of the leveraged bank, debt and equity holders of bank A,
receive €93 (€72 + €21), while those of bank B only obtain €75. Note that the asset-
sides of the balance sheets of banks A and B are 100% comparable. The difference of
income that investors of bank A and B obtain, is the tax shield of €18 (€93 - €75). Thus,
investors of a (leveraged) bank can capture more income if leverage increases, while the
government misses tax revenues.29 Hence, leverage is implicitly subsidized.
Many Western countries allow tax deductions for expenses made to generate revenue,
mostly by taxing gross profits. As mentioned in chapter two, banks are “special” and use
debt to provide liquid securities to the economy, such as deposits and short-term debt.
This debt includes many interest expenses, whereby tax deductibility plays a bigger role
for banks compared to non-financial firms. Admati et al. (2011) state that the current
tax shield on debt induces a distortion in the allocation of public funds between firms
that can borrow extensively (e.g. banks) and firms that use more equity (non-financial
companies). Given the “special” role that banks have and given the high levels of bank
debt, the impact of the tax shield grew significantly to an undesirable extent.
4.2 The Size of the Dutch Bank Tax Shield
As an example and illustration of the distortion, this paragraph quantifies the total size of
the Dutch tax shield on bank debt over the period 1999-2012 for the largest three banks
ING, ABN AMRO and Rabobank. The main factors that determine the relative size of the tax
shield are leverage, interest rates on debt and corporate tax rates. 30 31 These three
factors are all positively correlated with the size of the tax shield. The first two factors
are applicable to individual banks and can be determined by banks themselves. Policy
makers set the third factor, the corporate tax rate. The corporate tax rate in the
Netherlands has declined from 35% in 1999 to 25% since the beginning of 2011.
1999-2001 2002-2004 2005 2006 2007-2010 2011-…
35% 34,5% 31,5% 29,6% 25,5% 25%
Table 4.2: Corporate Tax Rate in the Netherlands 1999-2012, source: Dutch Ministry of Finance
29 Note that from a government’s perspective the tax shield (debt subsidy) is not an actual expense. 30 Examples of interest rates are LIBOR, EURIBOR, ECB interest rates, Federal Funds Rate and deposit rates. 31 The last part of equation (5) !
!!!×𝑟!"#$× 1 − 𝑇! shows that leverage !
!!!, total assets (𝐷 + 𝐸), interest
rates 𝑟!"#$ and corporate tax rates 1 − 𝑇! are correlated with the tax shield on debt.
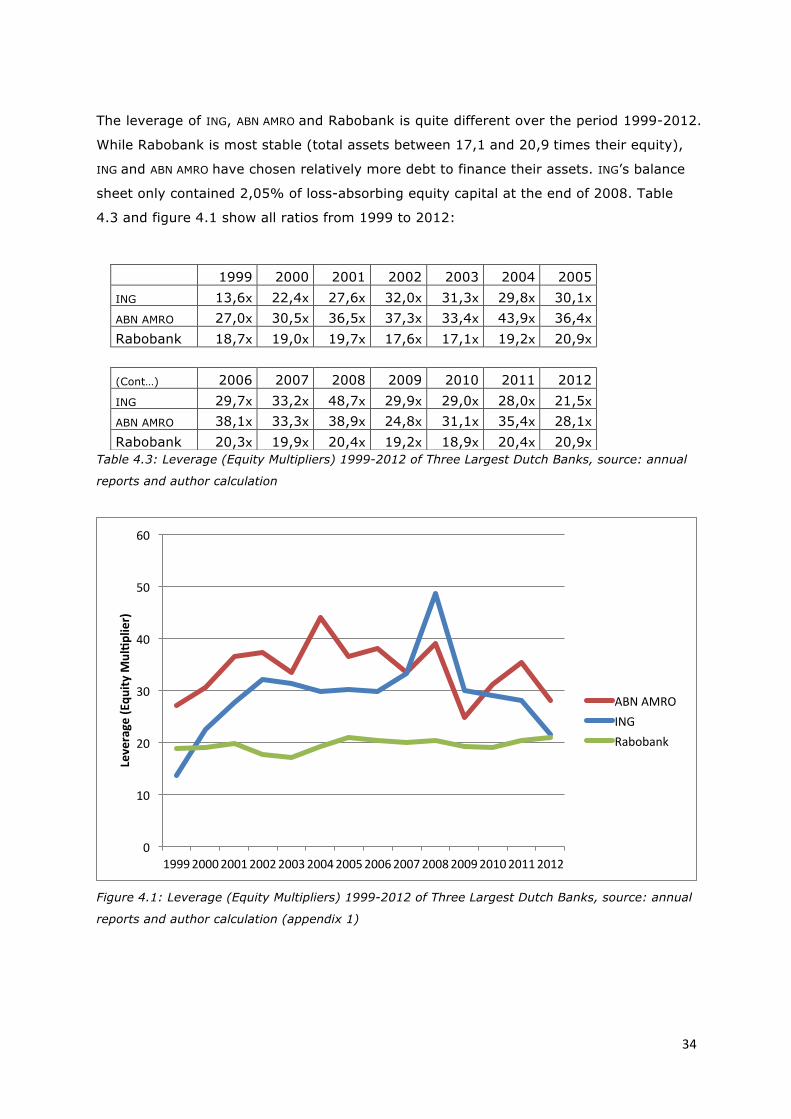
34
The leverage of ING, ABN AMRO and Rabobank is quite different over the period 1999-2012.
While Rabobank is most stable (total assets between 17,1 and 20,9 times their equity),
ING and ABN AMRO have chosen relatively more debt to finance their assets. ING’s balance
sheet only contained 2,05% of loss-absorbing equity capital at the end of 2008. Table
4.3 and figure 4.1 show all ratios from 1999 to 2012:
Table 4.3: Leverage (Equity Multipliers) 1999-2012 of Three Largest Dutch Banks, source: annual
reports and author calculation
Figure 4.1: Leverage (Equity Multipliers) 1999-2012 of Three Largest Dutch Banks, source: annual
reports and author calculation (appendix 1)
0
10
20
30
40
50
60
1999 2000 2001 2002 2003 2004 2005 2006 2007 2008 2009 2010 2011 2012
Leverage (E
quity
Mul1p
lier)
ABN AMRO ING Rabobank
1999 2000 2001 2002 2003 2004 2005
ING 13,6x 22,4x 27,6x 32,0x 31,3x 29,8x 30,1x ABN AMRO 27,0x 30,5x 36,5x 37,3x 33,4x 43,9x 36,4x Rabobank 18,7x 19,0x 19,7x 17,6x 17,1x 19,2x 20,9x
(Cont…) 2006 2007 2008 2009 2010 2011 2012 ING 29,7x 33,2x 48,7x 29,9x 29,0x 28,0x 21,5x ABN AMRO 38,1x 33,3x 38,9x 24,8x 31,1x 35,4x 28,1x
Rabobank 20,3x 19,9x 20,4x 19,2x 18,9x 20,4x 20,9x
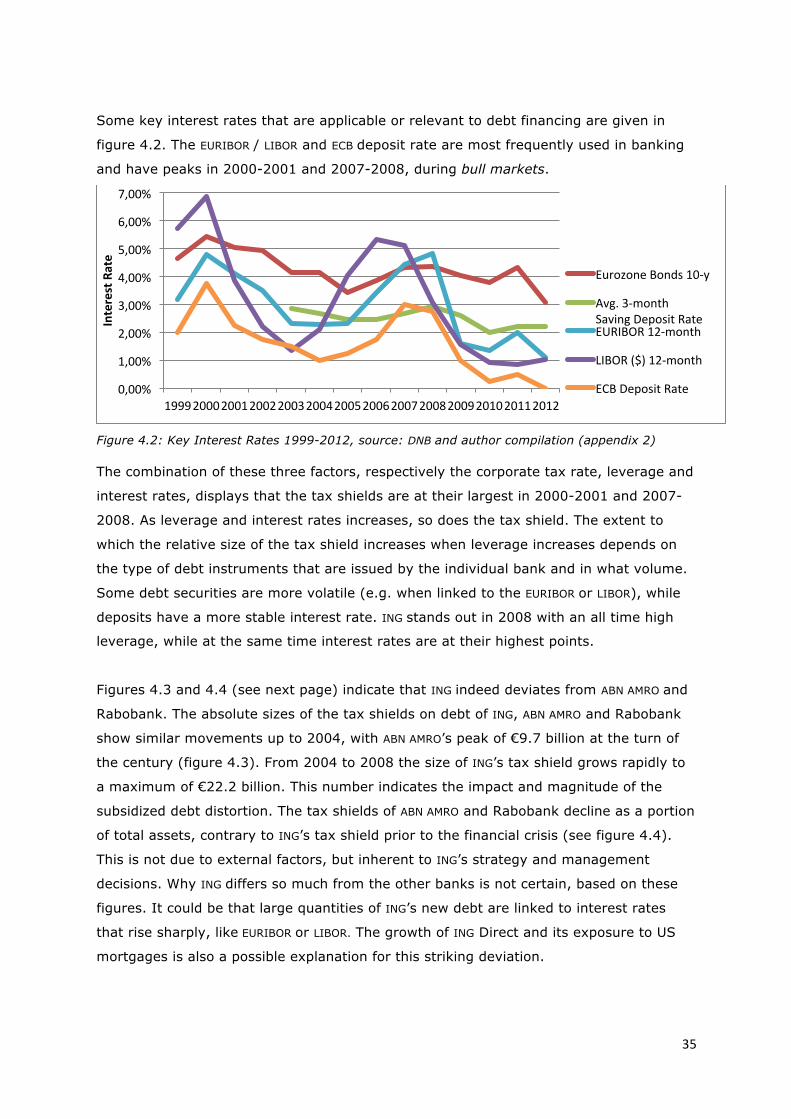
35
Some key interest rates that are applicable or relevant to debt financing are given in
figure 4.2. The EURIBOR / LIBOR and ECB deposit rate are most frequently used in banking
and have peaks in 2000-2001 and 2007-2008, during bull markets.
Figure 4.2: Key Interest Rates 1999-2012, source: DNB and author compilation (appendix 2) The combination of these three factors, respectively the corporate tax rate, leverage and
interest rates, displays that the tax shields are at their largest in 2000-2001 and 2007-
2008. As leverage and interest rates increases, so does the tax shield. The extent to
which the relative size of the tax shield increases when leverage increases depends on
the type of debt instruments that are issued by the individual bank and in what volume.
Some debt securities are more volatile (e.g. when linked to the EURIBOR or LIBOR), while
deposits have a more stable interest rate. ING stands out in 2008 with an all time high
leverage, while at the same time interest rates are at their highest points.
Figures 4.3 and 4.4 (see next page) indicate that ING indeed deviates from ABN AMRO and
Rabobank. The absolute sizes of the tax shields on debt of ING, ABN AMRO and Rabobank
show similar movements up to 2004, with ABN AMRO’s peak of €9.7 billion at the turn of
the century (figure 4.3). From 2004 to 2008 the size of ING’s tax shield grows rapidly to
a maximum of €22.2 billion. This number indicates the impact and magnitude of the
subsidized debt distortion. The tax shields of ABN AMRO and Rabobank decline as a portion
of total assets, contrary to ING’s tax shield prior to the financial crisis (see figure 4.4).
This is not due to external factors, but inherent to ING’s strategy and management
decisions. Why ING differs so much from the other banks is not certain, based on these
figures. It could be that large quantities of ING’s new debt are linked to interest rates
that rise sharply, like EURIBOR or LIBOR. The growth of ING Direct and its exposure to US
mortgages is also a possible explanation for this striking deviation.
0,00%
1,00%
2,00%
3,00%
4,00%
5,00%
6,00%
7,00%
1999 2000 2001 2002 2003 2004 2005 2006 2007 2008 2009 2010 2011 2012
Interest Rate
Eurozone Bonds 10-‐y
Avg. 3-‐month Saving Deposit Rate EURIBOR 12-‐month
LIBOR ($) 12-‐month
ECB Deposit Rate
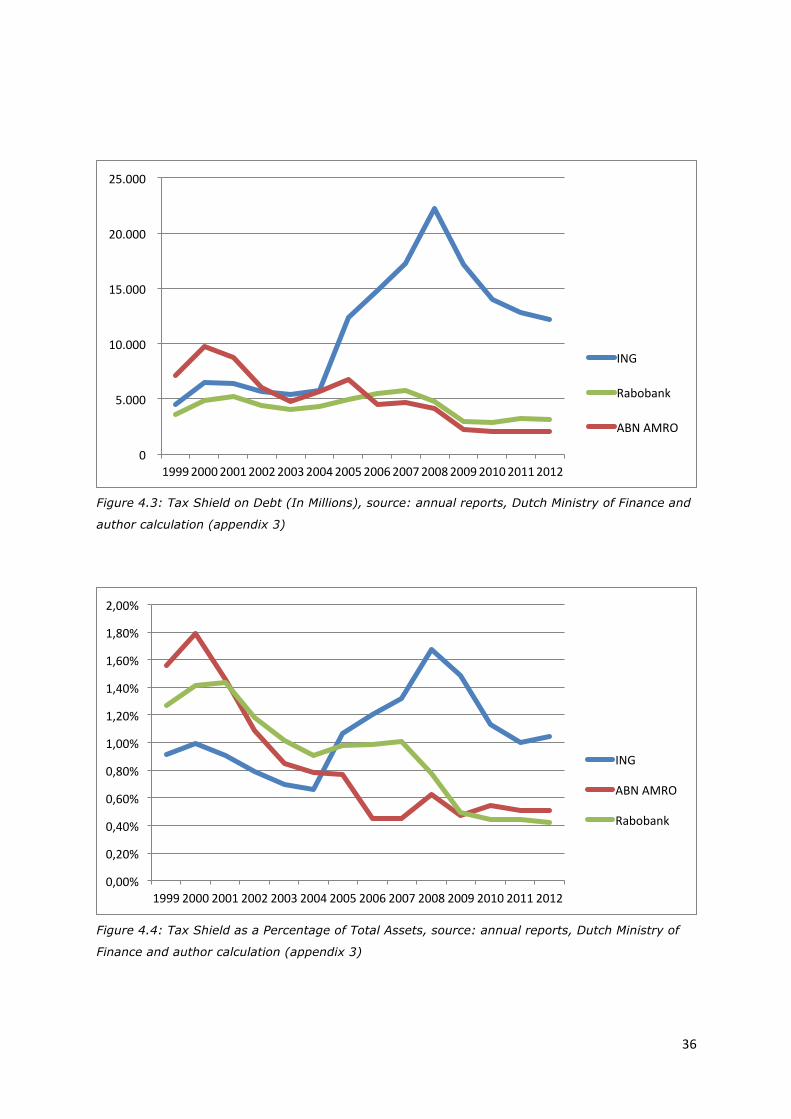
36
Figure 4.3: Tax Shield on Debt (In Millions), source: annual reports, Dutch Ministry of Finance and
author calculation (appendix 3)
Figure 4.4: Tax Shield as a Percentage of Total Assets, source: annual reports, Dutch Ministry of
Finance and author calculation (appendix 3)
0
5.000
10.000
15.000
20.000
25.000
1999 2000 2001 2002 2003 2004 2005 2006 2007 2008 2009 2010 2011 2012
ING
Rabobank
ABN AMRO
0,00%
0,20%
0,40%
0,60%
0,80%
1,00%
1,20%
1,40%
1,60%
1,80%
2,00%
1999 2000 2001 2002 2003 2004 2005 2006 2007 2008 2009 2010 2011 2012
ING
ABN AMRO
Rabobank
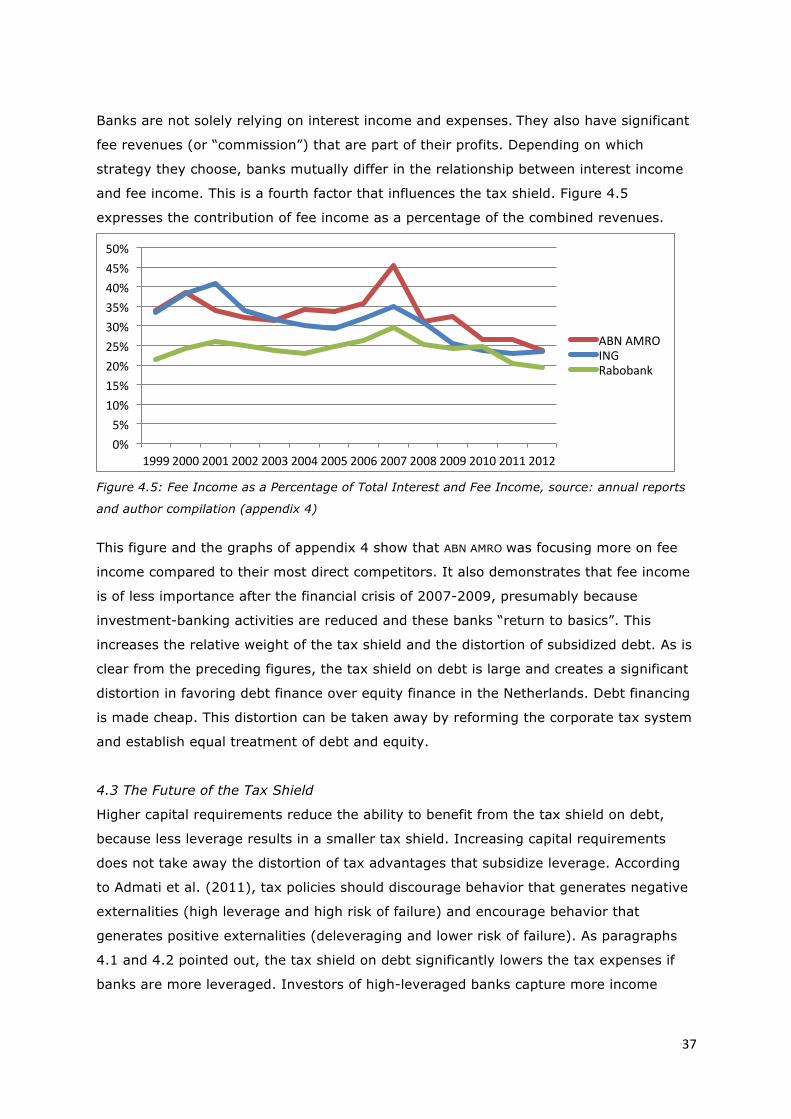
37
Banks are not solely relying on interest income and expenses. They also have significant
fee revenues (or “commission”) that are part of their profits. Depending on which
strategy they choose, banks mutually differ in the relationship between interest income
and fee income. This is a fourth factor that influences the tax shield. Figure 4.5
expresses the contribution of fee income as a percentage of the combined revenues.
Figure 4.5: Fee Income as a Percentage of Total Interest and Fee Income, source: annual reports
and author compilation (appendix 4)
This figure and the graphs of appendix 4 show that ABN AMRO was focusing more on fee
income compared to their most direct competitors. It also demonstrates that fee income
is of less importance after the financial crisis of 2007-2009, presumably because
investment-banking activities are reduced and these banks “return to basics”. This
increases the relative weight of the tax shield and the distortion of subsidized debt. As is
clear from the preceding figures, the tax shield on debt is large and creates a significant
distortion in favoring debt finance over equity finance in the Netherlands. Debt financing
is made cheap. This distortion can be taken away by reforming the corporate tax system
and establish equal treatment of debt and equity.
4.3 The Future of the Tax Shield
Higher capital requirements reduce the ability to benefit from the tax shield on debt,
because less leverage results in a smaller tax shield. Increasing capital requirements
does not take away the distortion of tax advantages that subsidize leverage. According
to Admati et al. (2011), tax policies should discourage behavior that generates negative
externalities (high leverage and high risk of failure) and encourage behavior that
generates positive externalities (deleveraging and lower risk of failure). As paragraphs
4.1 and 4.2 pointed out, the tax shield on debt significantly lowers the tax expenses if
banks are more leveraged. Investors of high-leveraged banks capture more income
0% 5% 10% 15% 20% 25% 30% 35% 40% 45% 50%
1999 2000 2001 2002 2003 2004 2005 2006 2007 2008 2009 2010 2011 2012
ABN AMRO ING Rabobank
38
compared to their better-capitalized competitors, due to the tax shield on debt. A reform
of the tax shield should be designed in such a way that the fiscal incentive shifts to
equity financing, while total tax expenses remain more or less unchanged. Therefore,
phasing out the tax shield on debt could be done stepwise and during a long and orderly
transition period.32
The most simple and obvious solution is to remove the tax deductibility of interest
payments on debt, whereby tax is paid over gross interest income instead of net interest
income. Debt and equity are now treated equally from a fiscal perspective and the fiscal
incentive to finance the activities with debt is removed. New investments, e.g. loans or
acquisitions, no longer have a tax benefit on debt (or equity) and high leverage ratios
aren’t fiscally favored. However, this means that banks have to pay enormous amounts
of tax, namely several times their profit. This will increase the price of a loan (correction
for a higher tax base) and give an unbalanced incentive to focus more on fee income. On
the other hand, a full tax exemption on interest income means de facto that banks do
not have to pay taxes. The current banking tax could be expanded to correct for this, but
that is highly sensitive for subjective measurements.
A less cumbersome solution is to set a maximum on the tax deductibility of interest
expenses in order to remove the negative externality (incentive to prefer debt financing
and high leverage). At the same time, the operating profit that banks obtain through net
interest income could be less taxed, either by exemption or a lower corporate tax rate
for that specific profit.33 The challenge is to hold the reduction of the deductibility similar
to the exemption in absolute numbers, so that total tax payments remain about equal.
Such a reform will remove the incentive for banks to finance their activities with debt,
since it is significantly less subsidized. It is important to notice that such radical tax
reforms will only have a chance of success if they are set internationally in order to
establish a level playing field. Finally, if the current tax policies will not be reformed,
banks will benefit less from the tax shield on debt when higher capital requirements
(Basel III) are implemented. On the one hand, public policy makers require banks to
reduce leverage, while on the other hand they conserve tax policies that incentivize
excessive leverage. This is quite paradoxical and inconsistent. Thus, tax policy reforms
are of great importance.
32 Van Dijkhuizen (2012) proposed similar reforms for mortgage interest deduction and income taxes in the Netherlands. 33 The tax rules that apply to fee income are excluded of these reforms, since the fiscal treatment of fee income does not create negative externalities that encourage banks to be highly leveraged.
39
5. Government Guarantees and Recapitalization
This chapter analyzes implicit government guarantees, the second large distortion that
affects the banks’ cost of debt and equity. Large and complex banks are labeled as
Systemically Important Financial Institutions (SIFI’s), too-big-to-fail (TBTF) or too-
important-to-fail (TITF). Their debt contains a convenience yield, as explained in chapter
two. Investors in SIFI’s know that bankruptcy will not occur, since governments
(implicitly) guarantee that they will step in to prevent this. Therefore, debt investors are
willing to accept a lower required rate of return. Hence, the cost of debt does not fully
reflect the inefficiencies of excessive leverage caused by implicit government guarantees.
If this debt is replaced by equity capital, due to higher capital requirements, banks will
lose a share of this subsidy.
This chapter begins with explaining how implicit government guarantees affect the
banking system. The second paragraph shows, as an example, calculations of the size of
the implicit government guarantee and the total implicit subsidy in the Netherlands. This
chapter concludes with a possible solution that lowers the distortive effects of the implicit
government guarantee.
5.1 Impact and Consequences of Government Guarantees
The recapitalizations of many banks all over the world in 2008 and 2009 provide
examples of implicit government guarantees that became explicit. Governments had to
bail out large, complex and high-leveraged financial institutions to avoid a breakdown of
the financial system. As stated in chapter two, there is an important distinction between
raising more equity capital and having more equity capital. High-leveraged banks find it
difficult to increase the equity capital ratio due to debt overhang problems and
information asymmetry. As to debt overhang problems, for each unit of capital that is
acquired, debt holders’ risk is reduced. The formal characteristics of debt do not change,
but since risk is distributed among more shareholders, this debt becomes safer and thus
more valuable. This transfer of value creates an incentive for managers and shareholders
to maintain excessive leverage and to postpone equity capital issuances to prevent
dilution.
This debt overhang problem is exacerbated by the implicit government guarantee. In the
absence of the implicit government guarantee, debt holders have a disciplining effect on
management. They monitor the company and its management’s strategic choices to
ensure that the company will pay back the debt instead of going bankrupt due to
40
excessive risk-taking. Since debt holders know that the government will intervene to
prevent a potential default, their market discipline reduces. This may result in a
preference for high leverage and excessive risk-taking incentives by banks. Once banks
are better capitalized under pressure of higher capital requirements the debt overhang
problem is solved or at least plays a minor role depending on the amount of new equity
capital. If there is sufficient equity capital in the steady state, banks can internalize
losses and depreciations using their own buffer. In this case, implicit government
guarantees are less important and the likelihood of a bailout is significantly reduced.
There are more distortive effects of implicit government guarantees. For example, the
convenience yield on debt is only obtainable by SIFI’s. Small banks do not have the
implicit guarantee and pay a relatively higher required return on debt. Therefore, their
funding costs are higher and competitiveness is reduced. This shifts business to large
banks and enhances the too-big-to-fail problem. Noss and Sowerbutts (2012) state that
the implicit government guarantee also attracts more resources from other sectors of the
economy to the financial sector. Thus, the guaranteed banking sector as a whole has a
competitive advantage over those sectors that are not or less guaranteed.
Besides implicit government guarantees, there are explicit guarantees. The most explicit
form of a government guarantee is the deposit insurance, which is partially financed by
the sector itself. The Federal Deposit Insurance Corporation (FDIC) and the Dutch Deposit
Guarantee Scheme (DGS) are two examples of explicit guarantees, which work as an
insurance for deposit holders. This system protects small deposits holders from losing
their money due to insolvency of the bank. The insurance is also established to prevent
bank runs. For an extensive discussion of deposit insurance, see Diamond and Dybvig
(1983, 2000) and Pennacchi (2009).
5.2 The Size of the Dutch Government Guarantee
This paragraph estimates the size of the implicit government guarantee of the three
largest Dutch banks over the period 1999-2012, similar to the tax shield calculation
made in paragraph 4.2. The impact of the implicit government guarantee on bank
funding costs is indirectly observable. Therefore, estimating the total size of the implicit
government guarantee is subject to a degree of judgment and some severe assumptions.
According to Gorton et al. (2011), bank debt contains a convenience yield. One method
to calculate the size of the implicit government guarantee is to multiply all outstanding,
interest rate-sensitive debt (minus deposits, which have an explicit guarantee) with this
convenience yield. The credit spread between bonds issued by small (non-SIFI) and large
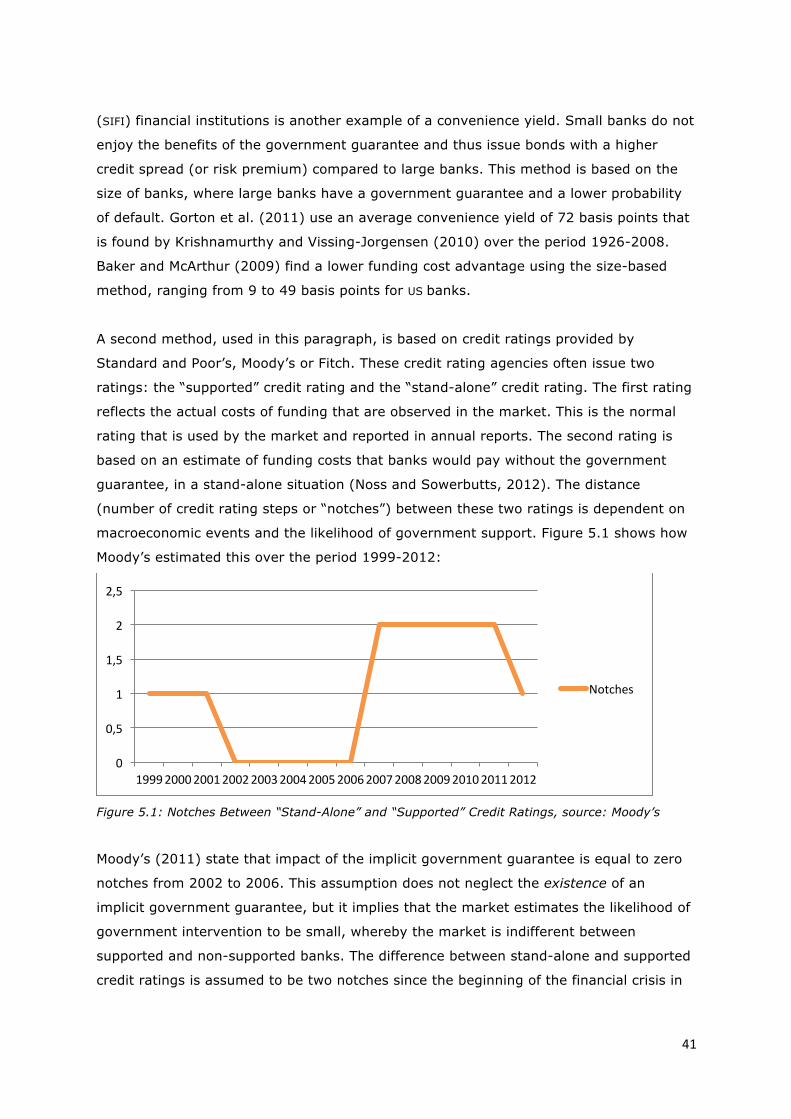
41
(SIFI) financial institutions is another example of a convenience yield. Small banks do not
enjoy the benefits of the government guarantee and thus issue bonds with a higher
credit spread (or risk premium) compared to large banks. This method is based on the
size of banks, where large banks have a government guarantee and a lower probability
of default. Gorton et al. (2011) use an average convenience yield of 72 basis points that
is found by Krishnamurthy and Vissing-Jorgensen (2010) over the period 1926-2008.
Baker and McArthur (2009) find a lower funding cost advantage using the size-based
method, ranging from 9 to 49 basis points for US banks.
A second method, used in this paragraph, is based on credit ratings provided by
Standard and Poor’s, Moody’s or Fitch. These credit rating agencies often issue two
ratings: the “supported” credit rating and the “stand-alone” credit rating. The first rating
reflects the actual costs of funding that are observed in the market. This is the normal
rating that is used by the market and reported in annual reports. The second rating is
based on an estimate of funding costs that banks would pay without the government
guarantee, in a stand-alone situation (Noss and Sowerbutts, 2012). The distance
(number of credit rating steps or “notches”) between these two ratings is dependent on
macroeconomic events and the likelihood of government support. Figure 5.1 shows how
Moody’s estimated this over the period 1999-2012:
Figure 5.1: Notches Between “Stand-Alone” and “Supported” Credit Ratings, source: Moody’s
Moody’s (2011) state that impact of the implicit government guarantee is equal to zero
notches from 2002 to 2006. This assumption does not neglect the existence of an
implicit government guarantee, but it implies that the market estimates the likelihood of
government intervention to be small, whereby the market is indifferent between
supported and non-supported banks. The difference between stand-alone and supported
credit ratings is assumed to be two notches since the beginning of the financial crisis in
0
0,5
1
1,5
2
2,5
1999 2000 2001 2002 2003 2004 2005 2006 2007 2008 2009 2010 2011 2012
Notches
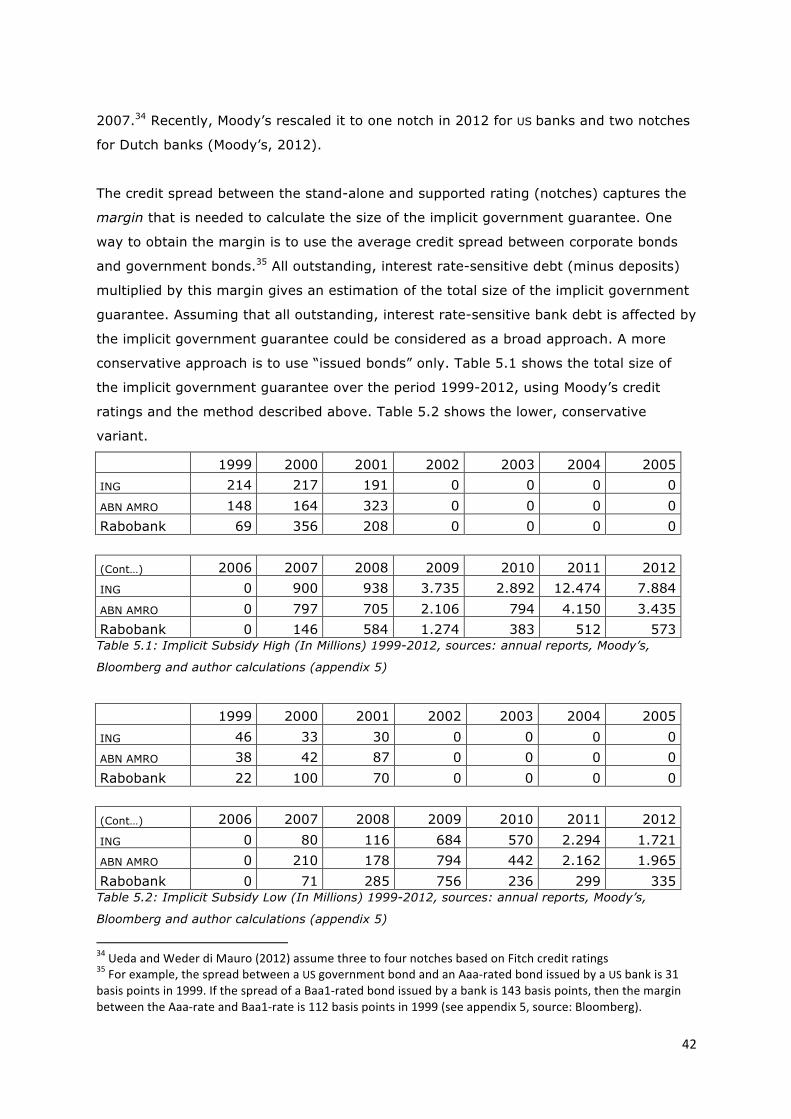
42
2007.34 Recently, Moody’s rescaled it to one notch in 2012 for US banks and two notches
for Dutch banks (Moody’s, 2012).
The credit spread between the stand-alone and supported rating (notches) captures the
margin that is needed to calculate the size of the implicit government guarantee. One
way to obtain the margin is to use the average credit spread between corporate bonds
and government bonds.35 All outstanding, interest rate-sensitive debt (minus deposits)
multiplied by this margin gives an estimation of the total size of the implicit government
guarantee. Assuming that all outstanding, interest rate-sensitive bank debt is affected by
the implicit government guarantee could be considered as a broad approach. A more
conservative approach is to use “issued bonds” only. Table 5.1 shows the total size of
the implicit government guarantee over the period 1999-2012, using Moody’s credit
ratings and the method described above. Table 5.2 shows the lower, conservative
variant.
1999 2000 2001 2002 2003 2004 2005
ING 214 217 191 0 0 0 0 ABN AMRO 148 164 323 0 0 0 0 Rabobank 69 356 208 0 0 0 0
(Cont…) 2006 2007 2008 2009 2010 2011 2012 ING 0 900 938 3.735 2.892 12.474 7.884 ABN AMRO 0 797 705 2.106 794 4.150 3.435 Rabobank 0 146 584 1.274 383 512 573 Table 5.1: Implicit Subsidy High (In Millions) 1999-2012, sources: annual reports, Moody’s,
Bloomberg and author calculations (appendix 5)
1999 2000 2001 2002 2003 2004 2005
ING 46 33 30 0 0 0 0 ABN AMRO 38 42 87 0 0 0 0 Rabobank 22 100 70 0 0 0 0
(Cont…) 2006 2007 2008 2009 2010 2011 2012 ING 0 80 116 684 570 2.294 1.721 ABN AMRO 0 210 178 794 442 2.162 1.965 Rabobank 0 71 285 756 236 299 335 Table 5.2: Implicit Subsidy Low (In Millions) 1999-2012, sources: annual reports, Moody’s,
Bloomberg and author calculations (appendix 5)
34 Ueda and Weder di Mauro (2012) assume three to four notches based on Fitch credit ratings 35 For example, the spread between a US government bond and an Aaa-‐rated bond issued by a US bank is 31 basis points in 1999. If the spread of a Baa1-‐rated bond issued by a bank is 143 basis points, then the margin between the Aaa-‐rate and Baa1-‐rate is 112 basis points in 1999 (see appendix 5, source: Bloomberg).
43
The results of the calculations show that the implicit subsidy of ING and ABN AMRO
increased substantially after the financial crisis, while Rabobank demonstrates a more
stable impact of the implicit subsidy. As stated in chapter four, the leverage ratios of ING
and ABN AMRO are higher than Rabobank’s, which have an influence on the credit ratings
of these banks. The increase of the implicit subsidy is caused by reduced confidence that
markets have in banks. This significantly lowers the credit ratings during and after the
financial crisis. Second, the number of notches between “stand-alone” and “supported”
has increased, whereby the margin and spreads grow exponentially. Rabobank is the
least leveraged bank and has a relative small and strong balance sheet. Due to
Rabobank’s relatively low leverage and high credit ratings, the margins between
“supported” and “stand-alone” are smaller. Hence, the implicit subsidy of Rabobank is
the smallest of these three banks. Still, the most conservative approach of this method
yields an annual average implicit subsidy of €330 million over the past six years for
Rabobank. In other words, implicit government guarantees ensure that not all
inefficiencies of high leverage are reflected in the costs of bank debt funding. In absence
of the government guarantee Rabobank would have paid €330 million per year more
interest on their issued bonds, which is approximately 15% of their total annual profit.
As stated before, these calculations are subject to a degree of judgment. The credit
ratings and the number of notches between “supported” and “stand-alone” credit ratings
are based on Moody’s interpretation.36 Applying the same credit spread or margin to all
different types of debt instruments on the balance sheet is also objectionable. Therefore,
the conservative approach (issued bonds only) is included and considered to be more
accurate. Other authors using the credit rating-based method find different margins. For
example, Ueda and Weder di Mauro (2012) find a margin of 60 to 80 basis points over
the period 2007-2009 for US banks. Using the same method and different credit spreads,
Van Tilburg (2012) estimated that the implicit subsidy of the three largest Dutch banks
in 2011 is between €3,8 and €11,4 billion. It is clear that the exact benefit of implicit
government guarantees is hard to quantify. Despite of the bandwidth of the estimations,
these methods indicate that the problem has a significant impact on bank funding costs.
They also expose differences between better-capitalized and high-leveraged banks.
36 Note that up until the financial crisis credit rating agencies made mistakes in their judgments. This calculation is based on credit ratings, thus the results are not entirely objective. Most important is that the differences between ING, ABN AMRO and Rabobank can be made, since all three banks are subjected to the same method.
44
5.3 Recapitalization of the Banking System
Paragraphs 4.2 and 5.2 show that the distortive effects of the tax shield and implicit
government guarantees are significantly reduced when a bank is better capitalized. This
also implies that high-leveraged banks exploit the implicit subsidy relatively more. Their
incentive to acquire more equity capital is negatively influenced by these distortions,
which enlarge the debt overhang problem (transition phase). Besides the loss of
subsidized debt, banks do not have importance in raising equity capital because dilution
may occur. Therefore, it seems inevitable that governments and/or regulators should
intervene to recapitalize the banking system.37 Higher capital requirements are one form
of government intervention, but can be complemented with other solutions. For example,
Admati et al. (2011) advocate a regulatory rule that forces all large banks to issue equity
capital according to a fixed schedule. This may help to reach the higher capital
requirement faster and to avert the stigmatization of an equity issuance, but it does not
mitigate the other problem of the transition phase, debt overhang. Admati et al. (2011)
also advocate that dividend payments should be suspended during the transition phase,
because retained earnings should be used to increase the equity cushion. Although these
proposals create better-capitalized banks more efficiently, the existing debt holders
benefit from this situation.
The challenge is to find an instrument that deals with the lack of incentives of high-
leveraged banks to acquire more equity capital timely, hence solves the debt overhang
problem. Calomiris and Herring (2011) describe such an instrument and propose a
contingent convertible (CoCo) capital requirement in addition to higher capital
requirements. Contingent convertible capital is a debt instrument that converts to equity
when the equity capital ratio falls below a certain threshold. This mandatory conversion
of debt to equity is a direct form of recapitalization for which the term “bail-in” is used
frequently. The automatic conversion ensures that banks can avoid the debt overhang
problem described earlier. Note that the risk and probability of conversion lead to a
higher required rate of interest by investors in CoCos compared to normal debt (based
on theoretical insights of chapter two).
Calomiris and Herring (2011) state that if banks have a choice between issuing equity
capital or CoCos, they should prefer CoCos. The dilutive effect of a forced equity capital
issuance immediately takes place. As to CoCos, dilution only occurs when debt is
converted into equity capital depending on the conversion rate. Calomiris and Herring
37 See e.g. Scharfstein and Coates (2009), Admati et al. (2011, 2012 and 2013), and Philippon and Schnabl (2012) for a more detailed discussion about the need of government intervention.
45
(2011) state that the primary aim of a CoCo should be “to incentivize the voluntary, pre-
emptive, and timely issuance of equity into the market as a means of avoiding highly
dilutive CoCo conversion”. CoCos also facilitate bail-ins and signal bank risk, but the
encouragement of timely equity capital issuances is far more important. According to
Calomiris and Herring (2011), the design of a CoCo requirement should include at least:
a large size of CoCos, a credible and observable moment of conversion (the trigger) and
a conversion rate that is dilutive of existing shareholders. If a bank faces significant
losses that will “trigger” the automatic conversion of debt into equity capital soon, it will
avoid this by issuing new equity capital timely. The large amount of CoCos being
converted, combined with the dilutive conversion rate, must be an unattractive option
compared to issuing new equity capital timely. Existing shareholders and management
anticipate the possibility of a conversion and will have strong incentives to be adequately
capitalized and have accurate risk management (Calomiris and Herring, 2011).
Lastly, the role of implicit government guarantees is significantly reduced if such a CoCo
requirement is implemented. As explained in paragraph 5.1, debt holders have a less
disciplining effect on banks’ management and strategic decisions in the presence of
implicit government guarantees and in the knowledge that the bank is too-big-to-fail.
CoCo holders are keen to prevent conversion, as well as existing shareholders that fear
heavy dilution, therefore the disciplining effect will return. Second, if a bank faces
significant losses of equity and is not able to issue new capital, the conversion of CoCos
reduces the likelihood and magnitude of a government bailout. The higher the CoCo
requirement, the smaller is the role of the implicit government guarantee.
46
6. Summary and Conclusion
This thesis answers the question if higher capital requirements increase total bank
funding costs. The first part provides an analysis of theoretical and empirical studies. The
starting point of this analysis is the Modigliani-Miller theorem that is explained in chapter
two. Discussing the impact of higher capital requirements on funding costs and capital
structures requires a clear distinction between the steady state and the transition phase,
since their dynamics are different. Following the Modigliani-Miller theorem, higher capital
requirements will not change (steady state) total funding costs under some severe
assumptions. From the discussion of theoretical papers can be concluded that this
theorem does not hold on banking in its pure form, although it is useful to identify
frictions and distortions. The theoretical analysis emerges two distortions, namely the
tax shield and implicit government guarantee. These public policies have a significant
damping effect on the funding costs of bank debt and implicitly subsidize debt.
Given the fact that in the current situation bank debt is subsidized, then replacing this
debt with more equity capital reduces the ability of banks to exploit the implicit subsidies
in the new equilibrium. Second, the self-fulfilling beliefs of banks that capital is
expensive and the ROE is fixed in a new steady state are fallacious and incorrect.
Theoretical insights show that having more equity capital distributes risk and must lower
the required return on equity. Holding a bank share in the new equilibrium could be an
attractive asset class if risk is distributed and all banks are better capitalized so that they
internalize losses and depreciations. Meantime, raising more equity capital entails debt
overhang and information asymmetry problems, especially if banks are poorly capitalized.
The dilutive effect of an equity capital issuance creates incentives for bank management
and existing shareholders to resist reductions in leverage that make existing debt safer.
Banks have no importance in higher equity capital ratios, due to this debt overhang.
The empirical studies examined in chapter three mainly focus on the cost side of higher
capital requirements and hold the ROE fixed. This is not consistent with the theoretical
insights discussed in chapter two. The outcomes of these studies over-estimate the
increases of funding costs and neglect some beneficial consequences of higher capital
requirements, such as lower required returns on equity and the reduction of distortions
and inefficiencies. These studies also focus on private costs and do not take into account
the social benefits of a better-capitalized banking system. Most importantly, a large part
of the estimated rise in funding costs is caused by the loss of subsidized debt. Having
more equity capital reduces the ability of banks to obtain the benefits of the tax shield
and implicit government guarantees. Without these distortions, the transition towards a
47
better-capitalized banking system would be easier. Reforms of the corporate tax system
and the government guarantee policy should complement higher capital requirements.
The second part of this thesis focuses on these two distortions and reforms. Chapter four
shows that the implicit subsidy that is created by the deductibility of interest expenses
favors debt financing significantly. As leverage and interest rates increases, so does the
distortive effect of the tax shield. This allows investors of leveraged banks to capture
more revenue due to lower tax expenses. Calculations of the Dutch situation confirm
that high-leveraged banks indeed exploit this implicit subsidy relatively more than their
better-capitalized competitors. This negative externality incentivizes banks to prefer debt
financing, while on the other hand more equity capital needs to be acquired. The
challenge of reforming the corporate tax system is to remain total tax expenses more or
less unchanged and to shift the incentive from debt financing to equity financing.
Therefore, the deductibility of interest expenses should be maximized or capped, while
net interest income could be less taxed. Such a reform needs to be set internationally.
The distortive effect of the implicit government guarantee lowers funding costs of bank
debt, as explained in chapter five. In the presence of implicit government guarantees,
not all inefficiencies of high leverage are reflected in the costs of bank debt funding. The
guarantee also exacerbates the debt overhang problem, because debt holders have
fewer incentives to address excessive risk-taking and high leverage ratios. The implicit
government guarantees can be significantly reduced if the banking system is better
capitalized and able to internalize losses and depreciations. Estimations of the Dutch
implicit subsidy show that the impact of the guarantee significantly increased during and
after the financial crisis. The calculations demonstrate that due to a lower market
confidence in banks and higher levels of uncertainty, the advantages of the implicit
government guarantee on funding costs increased, especially for high-leveraged banks
with lower credit ratings. To reduce the need and impact of an implicit government
guarantee, the banking system must be recapitalized through intervention by the
government and/or regulator. This could be done by imposing a contingent capital (CoCo)
requirement. CoCo is a form of debt that automatically converts to equity if a bank faces
too many losses. If the amount of CoCos is large and the conversion rate dilutive, banks
will have incentives to prevent conversion. Hence, banks will have interest to acquire
new equity capital timely. Due to the large size of CoCos, the likelihood of a bail out
reduces and the implicit government guarantee is of less importance.
Concluding, equity capital is not expensive, but bank debt is made cheap. Therefore,
Basel III should be complemented with tax policy reforms and recapitalization of the
banking system with the use of a contingent capital (CoCo) requirement.
48
List of Abbreviations
BCBS Basel Committee on Banking Supervision BHC Bank Holding Company BIS Bank for International Settlements CAPM Capital Asset Pricing Model CEO Chief Executive Officer CoCo Contingent Convertible DNB De Nederlandsche Bank (NL) ECB European Central Bank (EU) EURIBOR EURo InterBank Offered Rate ESM European Stability Mechanism FDIC Federal Deposit Insurance Corporation Fed Federal Reserve System (US) FSA Financial Services Authority (UK) GDP Gross Domestic Product IIF Institute of International Finance IMF International Monetary Fund LIBOR London Interbank Offered Rate MAG Macroeconomic Assessment Group MMMF Money Market Mutual Fund NPV Net Present Value OECD Organization for Economic Co-operation and Development Repo Repurchase agreement ROE Return On Equity RWA Risk Weighted Assets SIFI Systemically Important Financial Institution TARP Troubled Asset Relief Program TBTF Too Big To Fail TITF Too Important To Fail WACC Weighted Average Cost of Capital Note: capital = equity capital, unless explicitly mentioned
49
Bibliography Acharya, V., Mehran, H., Schuermann, T., Thakor, A. (2011) Robust Capital Regulation Federal Reserve Bank of New York, Staff Report no. 490 Acharya, V., Mehran, H., Thakor, A. (2010) Caught Between Scylla and Charybdis? Regulating Bank Leverage When There is Rent-Seeking and Risk-Shifting, working paper Admati, A., DeMarzo, P., Hellwig, M., Pfleiderer, P. (2011) Fallacies, Irrelevant Facts, and Myths in the Discussion of Capital Regulation: Why Bank Equity is Not Expensive, Stanford GSB Research Paper No. 2063 Admati, A., DeMarzo, P., Hellwig, M., Pfleiderer, P. (2012) Debt Overhang and Capital Regulation, Working Paper, no. 114, Rock Center of Corporate Governance Admati, A., Hellwig, M. (2013) The Bankers’ New Clothes: What’s Wrong with Banking and What to Do about It, Princeton University Press Angelini, P., Clerc, L., Cúrdia, V., Gambacorta, L., Gerali, A., Locarno, A., Motto, R., Roeger, W., Van den Heuvel, S., Vlček, J. (2011) Basel III: Long Term Impact on Economic Performance and Fluctuation, Federal Reserve Bank of New York, Staff Report no. 485 Baker, D., McArthur, T. (2009) The Value of the “Too Big to Fail” Big Bank Subsidy, 09-2009, Center for Economic and Policy Research Bank for International Settlements (2010, revised 2011) Basel III: A Global Regulatory Framework for More Resilient Banks and Banking Systems, Basel Committee on Banking Supervision Berger, A., Herring, R., Szegö, G. (1995) The Role of Capital in Financial Institutions, Journal of Banking & Finance, vol. 19, pp. 393-430 Berk, J., DeMarzo, P. (2008) Corporate Finance, Pearson Education Limited Blum, J. (1998) Do Capital Adequacy Requirements Reduce Risks in Banking?, Journal of Banking and Finance, vol. 23, pp. 755-771 Boot, A.W.A. (2011) Banking at the Cross Roads: How to Deal with Marketability and Complexity?, Amsterdam Center for Law & Economics, working paper No. 07 Boot, A.W.A. (2013) Financial Sector in Flux, Journal of Money, Credit and Banking, forthcoming
50
Brei, M., Gambacorta, L., Von Peter, G. (2011) Rescue Packages and Bank Lending, BIS Working Paper, no. 357 Calomiris, C., Herring, R. (2011) Why and How to Design a Contingent Convertible Debt Requirement, Financial Institutions Center Working Paper No. 11-41, University of Pennsylvania Wharton School Cosimano, T., Hakura, D. (2011) Bank Behavior in Response to Basel III: A Cross-Country Analysis, IMF Working Paper, no.119 Diamond, D., Dybvig, P. (1983) Bank Runs, Deposit Insurance and Liquidity, Journal of Political Economy, no. 91, pp. 401-419 De Nicolo, G., Gamba, A., Lucchetta, M. (2012) Capital Regulation, Liquidity Requirements and Taxation in a Dynamic Model of Banking, Discussion Paper no. 10, Deutsche Bundesbank Fatica, S., Hemmelgarn, T., Nicodème, G. (2012) The Debt-Equity Tax Bias: Consequences and Solutions, European Commission Working Paper no. 33 Frenkel, M., Rudolf, M. (2010) The Implications of Introducing an Additional Regulatory Constraint on Banks’ Business Activities in the Form of a Leverage Ratio, working paper Gambacorta, L., Mistrulli, P. (2004) Does Bank Capital Affect Lending Behavior? Journal of Financial Intermediation, vol. 13, pp. 436-457 Gorton, G. (2010) Slapped By the Invisible Hand: The Panic of 2007, Oxford University Press Gorton, G., Metrick, A. (2010) Securitized Banking and the Run on Repo, forthcoming, Journal of Financial Economics Gorton, G., Metrick, A. (2010) Regulating the Shadow Banking System, Brooking Papers on Economic Activity, Q3-2010, pp. 261-312 Gorton, G., Lewellen, S., Metrick, A. (2011) The Cost of Bank Capital: Thinking Beyond Modigliani and Miller, working paper Gorton, G., Ordonez, G. (2012) Collateral Crises, NBER Working Paper, No. 17771 Hellwig, M. (2010) Capital Regulation after the Crisis: Business as Usual? Working paper
51
Ivashina, V., Scharfstein, D. (2010) Bank Lending During the Financial Crisis of 2008, Journal of Financial Economics, forthcoming Jensen, M. (1986) Agency Cost of Free Cash Flow, Corporate Finance, and Takeovers, American Economic Review, vol. 76, no. 2, pp. 323-329 Kashyap, A., Stein, J., Hanson, S. (2010) An Analysis of the Impact of ‘Substantially Heightened’ Capital Requirements on Large Financial Institutions, Working Paper King, M. (2010) Mapping Capital and Liquidity Requirements to Bank Lending Spreads, BIS Working Papers, no. 324 Krishnamurthy, A., Vissing-Jorgensen, A. (2010) The Aggregate Demand for Treasury Debt, working paper Miles, D., Yang, J., Marcheggiano, G. (2012) Optimal Bank Capital, The Economic Journal, vol. 122, no. 563 Miller, M. (1995) Do the M&M Propositions Apply to Banks?, Journal of Banking and Finance, vol. 19, pp. 483-489 Modigliani, F., Miller, M. (1958) The Cost of Capital, Corporation Finance, and the Theory of Investment, American Economic Review, vol. 48, pp. 261-297 Moody’s Analytics (2011) Quantifying the Value of Implicit Government Guarantees for Large Financial Institutions, Quantitative Research Group Moody’s Investors Service (2012) Key Drivers of Dutch Bank Ratings Actions Myers, S. (1977) Determinants of Corporate Borrowing, Journal of Financial Economics, vol. 5, pp. 145-175 Myers, S., Majluf, N. (1984) Corporate Financing and Investment Decisions when Firms Have Information that Investors Do Not Have, Journal of Financial Economics, vol. 13, pp. 187-222 Noss, J., Sowerbutts, R. (2012) The Implicit Subsidy of Banks, Financial Stability Paper, no. 15, Bank of England Pennacchi, G. (2009) Deposit Insurance, working paper
52
Pfleiderer, P (2010) On the Relevancy of Modigliani and Miller to Banking: A Parable and Some Observations, Stanford University, Rock Center for Corporate Governance, Working Paper no. 93 Philippon, T., Schnabl, P. (2012) Efficient Recapitalization, Journal of Finance, vol. 68, nr. 1, February 2013 Repullo, R., Saurina, J. (2011) The Countercyclical Capital Buffer of Basel III: A Critical Assessment, CEMFI Working Paper, no. 1102 Santos, A., Elliott, D. (2012) Estimating the Costs of Financial Regulation, IMF Staff Discussion Note, SDN/12/11 Scharfstein, D., Coates, J. (2009) Lowering the Cost of Bank Recapitalization, Yale Journal of Regulation, 07-2009 Schich, S., Lindh, S. (2012) Implicit Guarantee for Bank Debt: Where Do We Stand?, OECD Journal, no. 1, Financial Market Trends Thakor, A. (1996) Capital Requirements, Monetary Policy and Aggregate Bank Lending: Theory and Empirical Evidence, Journal of Finance, vol. 51, pp. 279-324 Ueda, K., Weder di Mauro, B. (2012) Quantifying Structural Subsidy Values for Systemically Important Financial Institutions, IMF Working Paper No. 128 Van den Heuvel, S. (2008) The Welfare Cost of Bank Capital Requirements, Journal of Monetary Economics, vol. 55, pp. 298-320 Van Tilburg, R. (2012) The Financial Overweight of the Netherlands, SOMO Paper, November 2012
53
Other References, Sources and Data Annual reports and form 20-F of ABN AMRO 1999-2012 via www.abnamro.nl, www.shareholder.com and www.sec.gov Annual reports and form 20-F of ING 1996-2012 via www.ing.com and www.sec.gov Annual reports of Rabobank 2000-2012 via www.rabobank.nl and Rabobank Investor Relations via [email protected] Annual report DNB (2011) and www.dnb.nl Bloomberg Fixed Income Database Interim report Committee Van Dijkhuizen (2012) Lecture by Miles, D., Optimal Bank Capital, Stanford Finance Forum, June 2011 via www.youtube.com Lecture by Admati et al., Fallacies, Irrelevant Facts, and Myths in the Discussion of Capital Regulation: Why Bank Equity is Not Expensive, Stanford Finance Forum, June 2011 via www.youtube.com Ministry of Finance, Corporate tax rates 1996-2012, via www.rijksoverheid.nl The Economist, Strength in Numbers: How Much Capital Did Banks Opt to Hold When They Had the Choice?, November 10th 2012 The Financial Times, More Capital Will Not Stop the Next Crisis, R. Rajan, October 1st 2009 The Region, Federal Reserve Bank of Minneapolis, Interview with Gary Gorton, December 2010, pp. 14-29 The Wall Street Journal, Running on Empty, J. H. Cochrane, March 2nd 2013 ** Several informal meetings with banks, accountancy and consultancy firms **
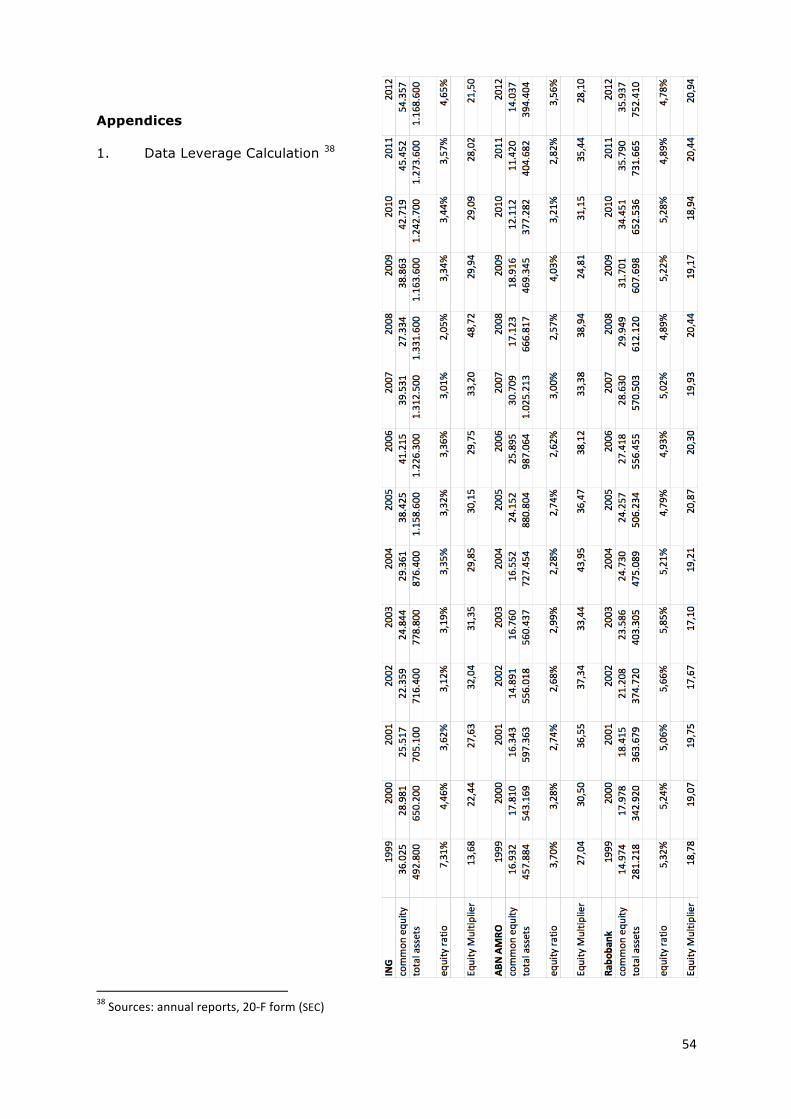
54
Appendices 1. Data Leverage Calculation 38
38 Sources: annual reports, 20-‐F form (SEC)
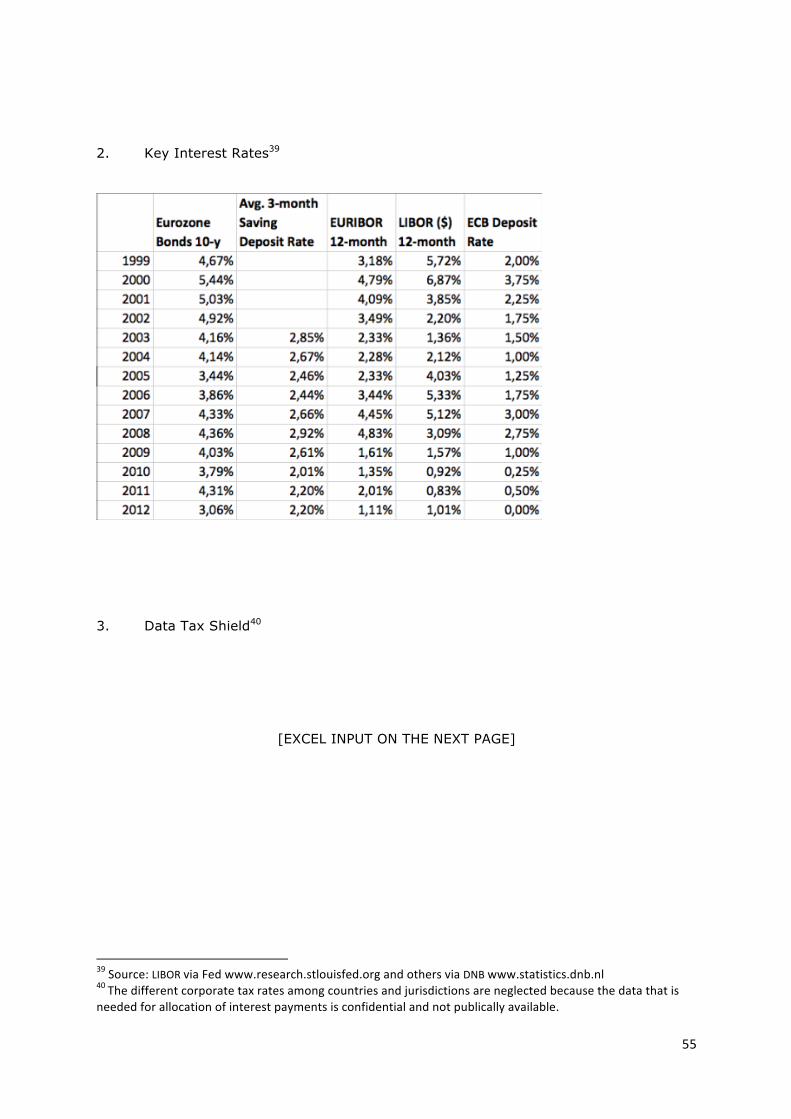
55
2. Key Interest Rates39
3. Data Tax Shield40
[EXCEL INPUT ON THE NEXT PAGE]
39 Source: LIBOR via Fed www.research.stlouisfed.org and others via DNB www.statistics.dnb.nl 40 The different corporate tax rates among countries and jurisdictions are neglected because the data that is
needed for allocation of interest payments is confidential and not publically available.
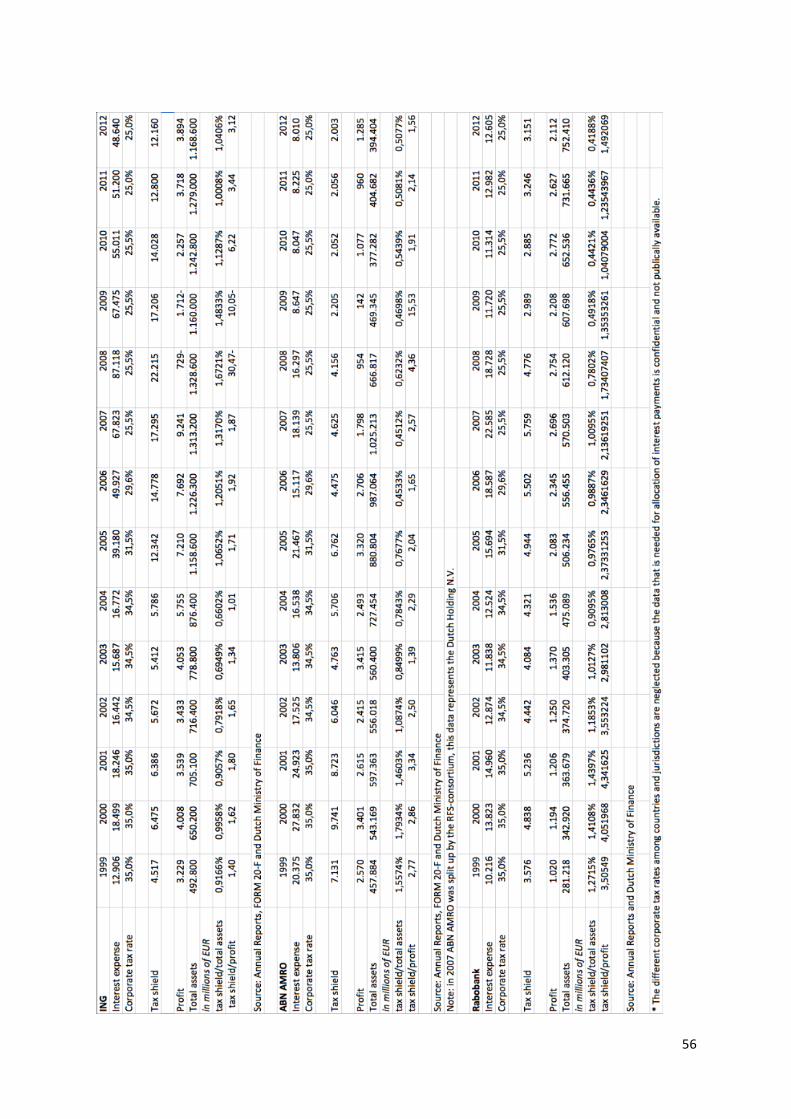
56
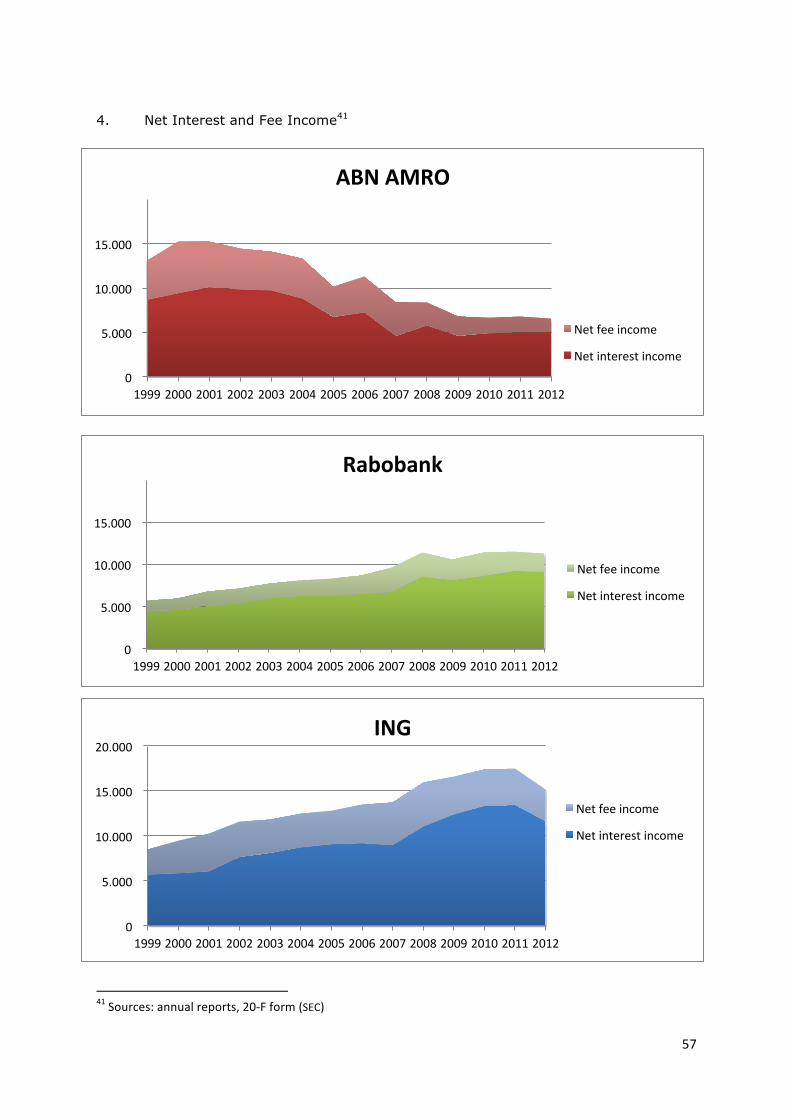
57
4. Net Interest and Fee Income41
41 Sources: annual reports, 20-‐F form (SEC)
0
5.000
10.000
15.000
1999 2000 2001 2002 2003 2004 2005 2006 2007 2008 2009 2010 2011 2012
ABN AMRO
Net fee income
Net interest income
0
5.000
10.000
15.000
1999 2000 2001 2002 2003 2004 2005 2006 2007 2008 2009 2010 2011 2012
Rabobank
Net fee income
Net interest income
0
5.000
10.000
15.000
20.000
1999 2000 2001 2002 2003 2004 2005 2006 2007 2008 2009 2010 2011 2012
ING
Net fee income
Net interest income
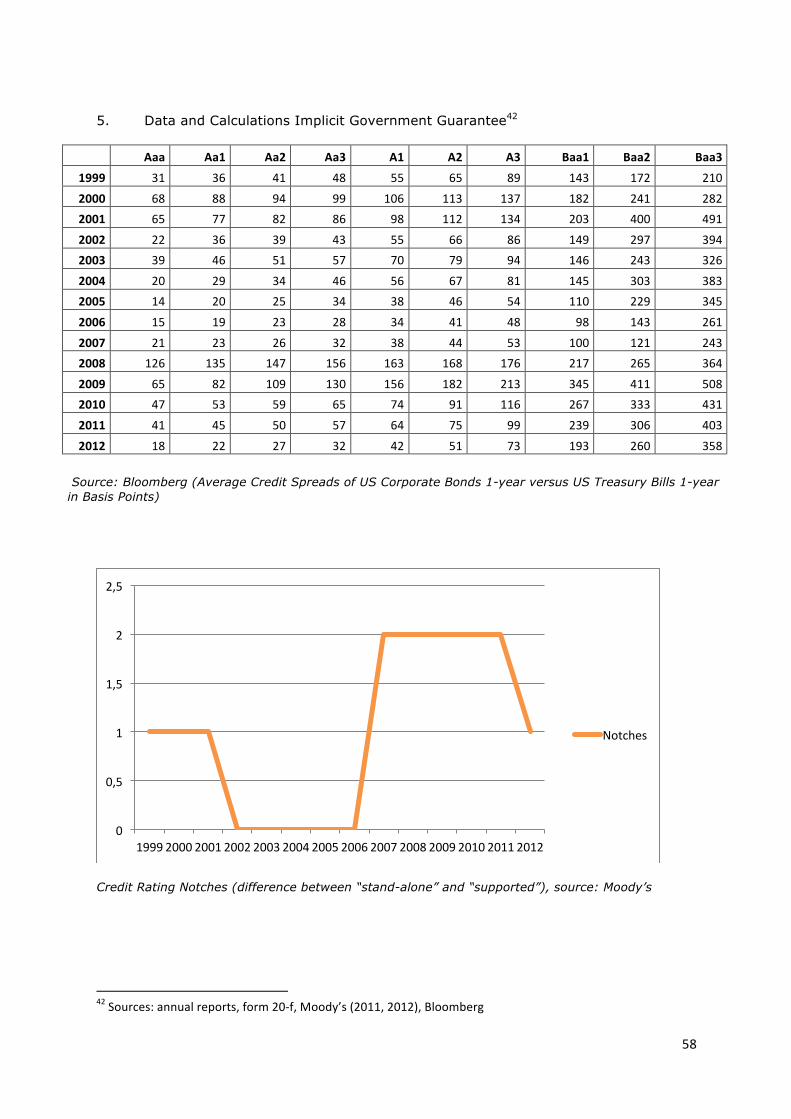
58
5. Data and Calculations Implicit Government Guarantee42
Aaa Aa1 Aa2 Aa3 A1 A2 A3 Baa1 Baa2 Baa3
1999 31 36 41 48 55 65 89 143 172 210
2000 68 88 94 99 106 113 137 182 241 282 2001 65 77 82 86 98 112 134 203 400 491
2002 22 36 39 43 55 66 86 149 297 394 2003 39 46 51 57 70 79 94 146 243 326
2004 20 29 34 46 56 67 81 145 303 383 2005 14 20 25 34 38 46 54 110 229 345
2006 15 19 23 28 34 41 48 98 143 261
2007 21 23 26 32 38 44 53 100 121 243 2008 126 135 147 156 163 168 176 217 265 364
2009 65 82 109 130 156 182 213 345 411 508 2010 47 53 59 65 74 91 116 267 333 431
2011 41 45 50 57 64 75 99 239 306 403
2012 18 22 27 32 42 51 73 193 260 358
Source: Bloomberg (Average Credit Spreads of US Corporate Bonds 1-year versus US Treasury Bills 1-year in Basis Points)
Credit Rating Notches (difference between “stand-alone” and “supported”), source: Moody’s
42 Sources: annual reports, form 20-‐f, Moody’s (2011, 2012), Bloomberg
0
0,5
1
1,5
2
2,5
1999 2000 2001 2002 2003 2004 2005 2006 2007 2008 2009 2010 2011 2012
Notches
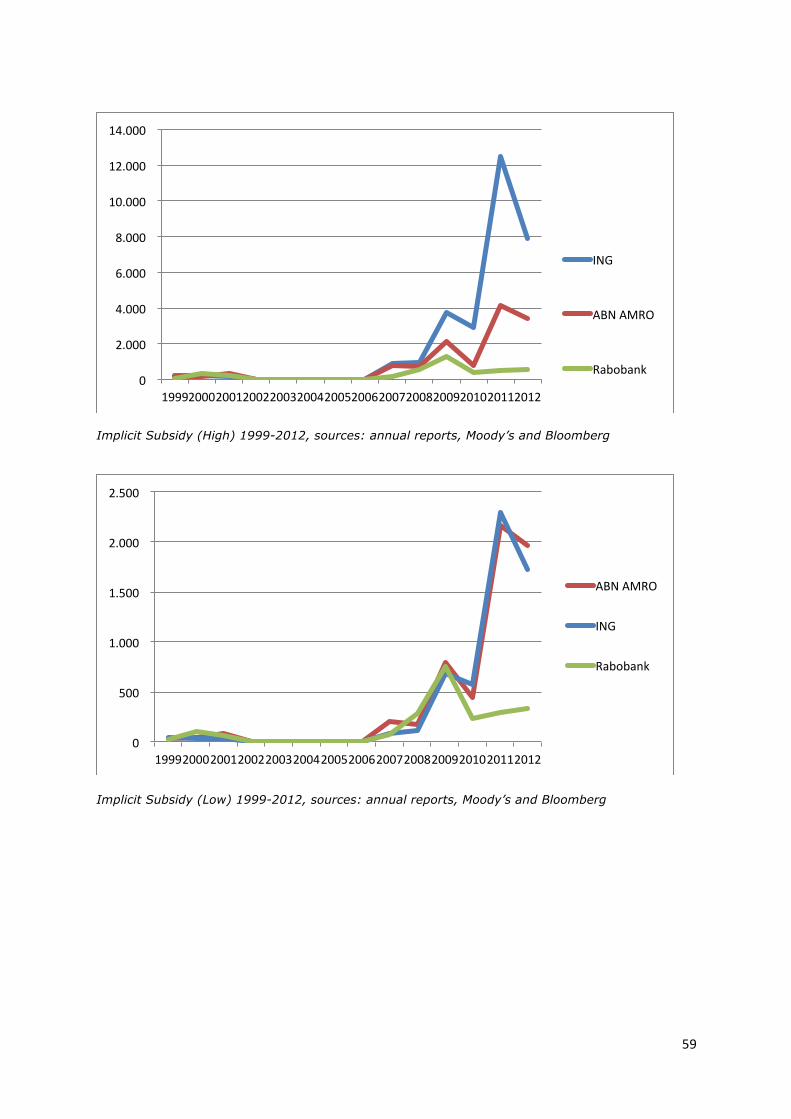
59
Implicit Subsidy (High) 1999-2012, sources: annual reports, Moody’s and Bloomberg
Implicit Subsidy (Low) 1999-2012, sources: annual reports, Moody’s and Bloomberg
0
2.000
4.000
6.000
8.000
10.000
12.000
14.000
1999 2000 2001 2002 2003 2004 2005 2006 2007 2008 2009 2010 2011 2012
ING
ABN AMRO
Rabobank
0
500
1.000
1.500
2.000
2.500
1999 2000 2001 2002 2003 2004 2005 2006 2007 2008 2009 2010 2011 2012
ABN AMRO
ING
Rabobank

60
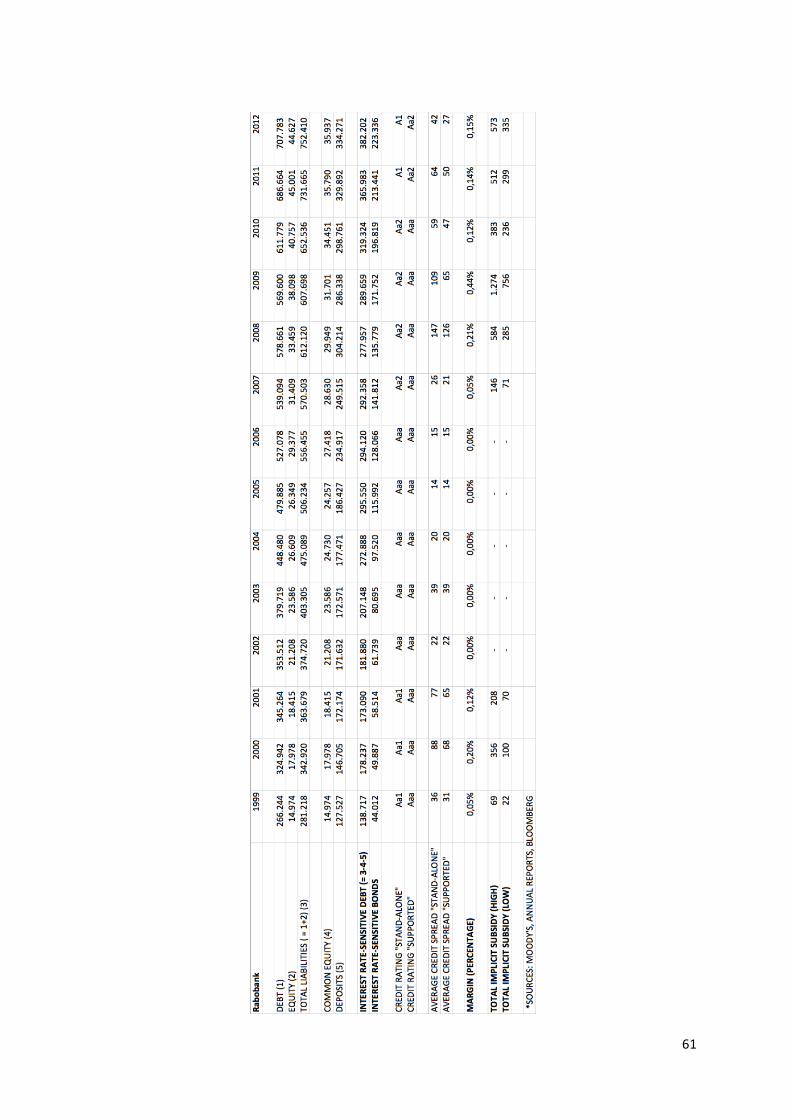
61
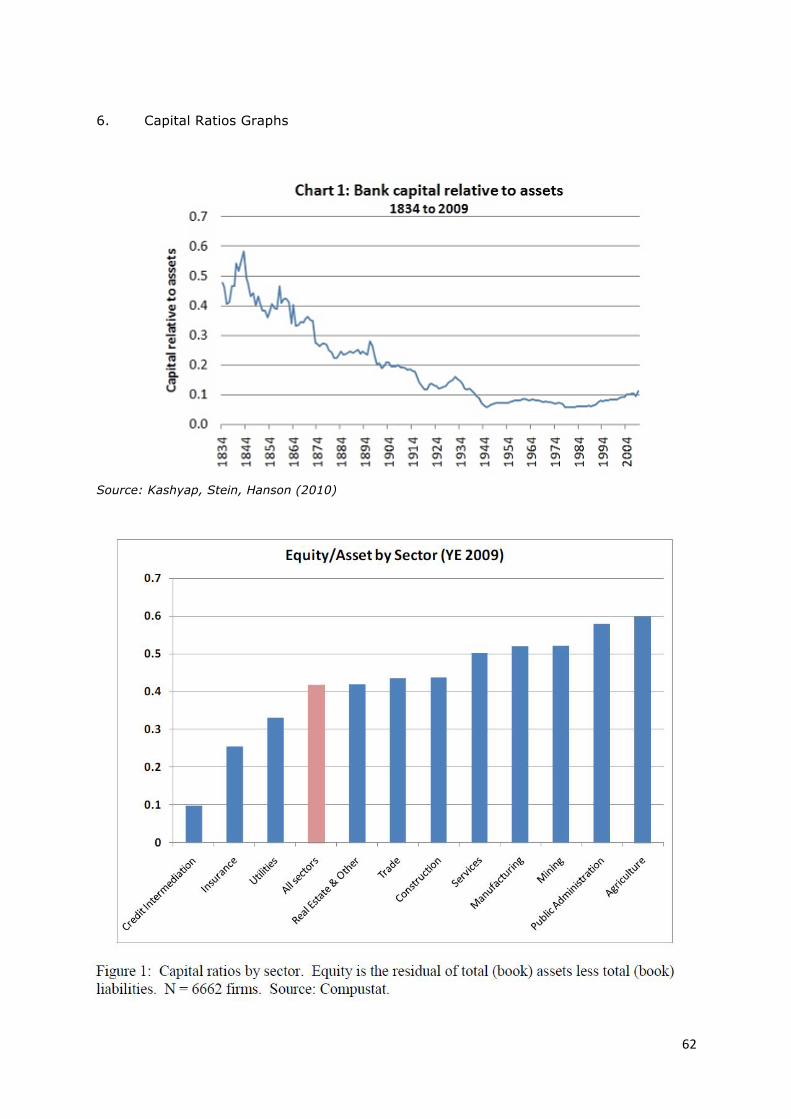
62
6. Capital Ratios Graphs
Source: Kashyap, Stein, Hanson (2010)
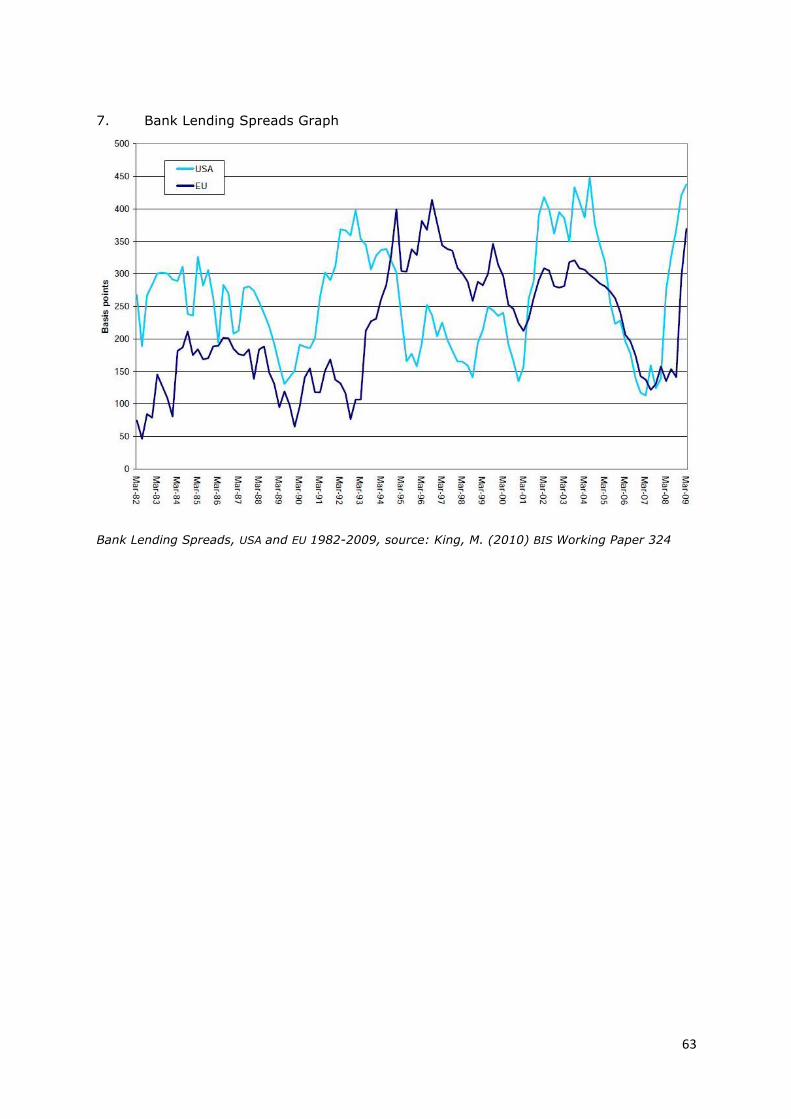
63
7. Bank Lending Spreads Graph
Bank Lending Spreads, USA and EU 1982-2009, source: King, M. (2010) BIS Working Paper 324