Master Thesis Developing a strategic sourcing approach for ...
92
Master Thesis Developing a strategic sourcing approach for the Accell Group N.V. Master Student - Alexander Schimpke University of Twente Student number – s1191004 Company – Accell Group N.V. Version No. 2 27.06.2017 1 st Supervisor University of Twente – Prof. Dr. Jan Telgen 2 nd Supervisor University of Twente – Dr. Ir. Fredo Schotanus 1 st Supervisor Accell – Jordan van de Riet 2 nd Supervisor Accell – Sander Stork
Transcript of Master Thesis Developing a strategic sourcing approach for ...

Master Thesis
Developing a strategic sourcing approach for the Accell
Group N.V.
Master Student - Alexander Schimpke
University of Twente
Student number – s1191004
Company – Accell Group N.V.
Version No. 2
27.06.2017
1st Supervisor University of Twente – Prof. Dr. Jan Telgen
2nd Supervisor University of Twente – Dr. Ir. Fredo Schotanus
1st Supervisor Accell – Jordan van de Riet
2nd Supervisor Accell – Sander Stork

2
Abstract
This research project focuses on the theoretical development and the practical implementation
of a strategic sourcing approach. Strategic sourcing is (i.a.) defined as ‘A method of managing
procurement processes for an organization in which the procedures, methods, and sources are
constantly re-evaluated to optimize value to the organization’ (businessdictonry.org).
Starting with an extensive literature review, forming the basis, a step-by-step approach is
developed for the Accell Group N. V. to derive strategic actions based on the commodity
evaluated. The expertise of the newly established procurement department as well as the know-
how of several product managers is analysed and used to design a framework for this approach.
The framework is specified for the company by the means of specific value drivers, taken from
the literature and verified by the procurement team of the Accell Group. The analysis is carried
out on the group level, meaning that each commodity might be used by a selection of brands
within the group. The model developed, however, is used as a tool for the whole group, which
is specified for each commodity per case (commodity).
In the first step of the analysis, the commodity is analysed towards its financial importance and
its risk of supply. In a second step, the buyer-supplier power relationship is included to create
a more extensive overview of the sourcing situation at hand. The practical implementation is
carried out by three pre-identified case studies.
The commodities used in the cases were evaluated beforehand by the product managers and the
procurement team. From their perspective, expectations for the outcome were derived, which
were compared to the actual outcome afterwards.
The result of the analyse elucidates not only the complexity of the sourcing process, but clarifies
the need for the procurement teams to facilitate discussions among peers to reach conclusive
and accurate decisions. It is also argued that the neither the commodity nor the power
relationship alone provide sufficient ground to derive concrete and appropriate decisions from.
For Accell, this tailored approach serves as a mean to derive short and long-term strategies form
the model, which can in turn be discussed and further adapted by the team.
From an academic point of view, this thesis, underlines the value of commodity management
for strategic sourcing decisions and its applicability for a company. Second of all, it provides a
quantitative model derived from the theory of commodity management and depicts the
necessary steps to practically implement it in a specific setting. Additionally, it verifies the
applicability of the theory in a practical situation, by defining and testing certain value drivers
taken from theoretical.
3
Table of content
1 Introduction
2 The Accell Group
2.1 Brands
2.2 Segmentation
3 Research outline
4 Theoretical Framework
4.1 Supply Chain Management
4.2 Commodity Management
4.3 Towards buyer-supplier relationship management
4.4 Strategic sourcing options
4.4.1 Static versus dynamic tactics
5 Methodology
6 Model development
6.1 Commodity Strategy
6.1.1 Factor shortlist
6.1.1.1 Total Cost of Ownership
6.1.1.2 Lead time reliability
6.1.1.3 Forecasting
6.2 Power Structure
6.2.1 Factor shortlist
6.2.1.1 Supplier capabilities
6.2.1.2 Number of available buyers
6.2.1.3 Percentage spend of suppliers total turnover
7 Product Managers
8 Implementation
8.1 Case Study – Roller brakes
8.1.1 Introduction
8.1.2 Weighting
8.1.3 Results
8.1.4 Strategy Development
8.1.5 Personal Statement
8.2 Case Study – Tires
8.2.1 Introduction
8.2.2 Weighting
8.2.3 Results
8.2.4 Strategy Development
8.2.5 Personal Statement
8.3 Case Study – Battery packs
8.3.1 Introduction
8.3.2 Weighting
8.3.3 Results
8.3.4 Strategy development
8.3.5 Personal Statement
9 Conclusion
10 Limitations
11 Bibliography
12 Appendix

4
1 Introduction
Over the last decades, the purchasing function has been recognized as a crucial management
tool, which should be aligned with the overall strategy of the company in order to increase
competitiveness (Luzzini, 2012). As purchasing usually takes up about 50-90% of the total
turnover (Telgen, 1994) poor decisions can have quite an impact on the company’s short- and
long term objectives.
Accell itself has been undergoing some changes in recent years through acquisitions and
individual growth. According to cyclingindustry.news.com, the bike industry is growing
extensively and is projected to produce 2 billion bikes per year by 2050 (200 million, 2016).
More recent developments are underlined by the rapid growth of the E-Bike production in
China, which rose from 1,6 million units per year in 2002 to 37 million units per year in 2013
(cyclingindustry.news.com). Following these recent trends, Accells turnover increased from
772 million euro in 2012 to over 1 billion euro in 2016. The corresponding net profit
increased from 23.3 in 2012 to 32.3 million euro in 2015. Even though the turnover increased
significantly, they were accompanied with increasing cost of goods sold, which actually
increased by a higher percentage than the actual turnover. The consequence was a decreasing
profit margin despite the increasing turnover. These developments led to the hiring of a
supply chain director. Also, the consultancy firm PwC, which analysed the possibility of
supply chain improvements, was hired. Consequently, the “Supply Chain Target Operating
Model” produced by PwC together with Accell. The procurement mission statement from the
PwC report was defined and states and reads as follows:
“Our mission statement is to support Accell’s business strategy by creating, managing and
developing the supply base that supports innovation, profitable growth and delivers
sustainable value to Accell’s customers” (PwC Report, 2015).
The following result was the introduction of an overarching procurement department for the
Accell-Group and its brands. Up to this point, the different brands, which even though
acquired by Accell, kept their identity and worked on their own. This meant they also did the
procurement themselves.
The bike industry is a rather informal industry, with passionate bike designers and engineers.
This, however, lead to an underdeveloped supply and procurement function, which was
primarily done as a side-function of afore mentioned employees. The procurement department
was therefore introduced to develop the capabilities and structures, necessary to deal with the
challenging and steadily growing bike market on the group level. Another point was the

5
management of the decreasing margins obtained from the end product and the excessive
working capital.
The ultimate goal of every procurement organization should be to fully understand, or at least
to the best of its capabilities, the reach and the developments within the supply chain. By
understanding, the development of every stage, from the raw materials to the finished goods,
is meant. This ideal situation, as will be pointed out in more detail later, is however unrealistic
and might even be impossible or impractical. The procurement team, which has a direct
influence on where to buy the products, has a very critical position within the supply chain.
Continuous development of the organizational capabilities is important to reach a stage of
sophisticated procurement.
This thesis is a tool in support of the capabilities necessary to manage the procurement
function on the group level. The outcome of the thesis is a framework for the group
procurement department of the Accell Group. A framework, in this context, can be
understood as a way of working or a step-by-step approach. The framework can be used to
assess the situation of the Accell Group and derive strategic actions based on the results. As
every organization is different there is no pre-established solution given. The theory works as
a framework and has to be specified to fit the organizations profile.
From a practical point of view, it tries to extend existing knowledge on the practical
implications of the commodity approach. This thesis will make a link between the
theoretically available strategies and the practical feasibility of using these.
To substantiate my research, I will base my analysis on several in-depth case studies and
selected suppliers. The framework is not simply found in the literature as every organization
works in a different environment, market and competitive situation. All those factors have to
be accounted for when devising a sourcing strategy. Therefore, all the theory can only get us
so far. Practical adjustments and justified choices have to be made to adapt to the existing
barriers, obstacles and challenges every organization faces in its own realm. This thesis
should not only be seen as a helpful, but also as a necessary tool, to help the Accell-Group to
reach its intended goals over the next years.
Looking at the available research, this thesis not only verifies the applicability and therefore
the usefulness of the models found. It more importantly provides a quantitative measure to
implement the models, which is currently missing to the extent proposed.

6
The following chapter will include a brief research outline. Afterwards the theoretical
framework will give an understanding on what the literature provides. Following the
methodology section, the model development will define what was found in the literature for
the specific situation of the Accell Group. In the implementation chapter, the model
developed is applied in several case studies of pre-defined commodities. A conclusion follows
to relate the results of the case studies with what was expected. In the end limitations and
recommendations will be the last part of the analysis.

7
2 The Accell Group
2.1 Brands
Figure 1, Accell Group
The graph above shows the different production locations and the locations of the different
brands. Also, some suppliers are included to which production is (partly) outsourced. The list
also includes companies which do not produce bikes, but are part of the parts & accessories
business or do both. The following list of brands is part of the Accell Group:

8
2.1.1 Bike brands
Belgium
• Brasseur Bike Parts (bike parts)
Finland
• Tunturi (workout equipment, bikes)
France
• Lapierre (bikes)
Germany
• Ghost (bikes)
• Winora Group
o Winora-Staiger GmbH
▪ Winora (Bikes, E-bikes)
▪ Haibike (Sport bike; incl. E-models)
▪ Staiger (premium brand)
• Sinus (E-bikes made by Staiger)
▪ XLC (components, clothing, equipment)
o E.Wiener Bike Parts GmbH (bike parts, after market)
• Batavus Bäumker GmbH (bikes and bike parts)
o Green's (bikes)
Netherlands
• Batavus NL
• Loekie (bikes)
• Sparta (bikes)
• Koga (bikes)
• Juncker Bike Parts (bike parts for bikes and scooters)
• Van Nicholas Bicycles (bike with a titanium frame)
United States
• Redline (Bikes, bike parts)
• Seattle Bike Supply (Bike parts)
• Bremshey Sport (workout equipment)
3.1.2 Production location
Hungary
• Accell Hunland
Turkey
• Accell Bisiklet
Asia
• ATC
• ATN

9
2.2 Segmentation
The different brands within the Accell Group all have their own portfolios. Depending on the
market they target, these do not only differ by description and definition, but also by the
segmentation of high, medium and low end products. Consequently, the portfolio from a
group perspective is rather unorganized. For the sake of this research a segmentation a
segmentation is proposed. The distinction is necessary as the commodities differ significantly
depending on the segment they are sourced for vertically and horizontally. All segments
mentioned above can also be separated into low, medium and high.
The segments defined for this thesis are E-bikes (city/trekking), MTB/E-MTB bikes,
city/trekking bikes, race bikes and kids bikes. There are certain overlaps, but as for every
case, the exact segments will have to be defined separately, this overview is sufficient.

10
3 Research outline
During the course of my research, the following research question will be answered:
“To what extent can a commodity strategy be developed for the Accell-Group and
which steps should it entail?”
This research question will be answered by several in-depth case studies using primary data.
In order to answer this research question several sub-questions are posed.
The first sub-question deals with finding a commodity strategy based on models proposed by
the literature. The existing model is compared with the needs of the Accell Group and adapted
accordingly.
“How can the purchasing portfolio model proposed by Kralijc be applied to the Accell
Group and which measures should it entail?”
The second sub-question incorporates the power structure, which is necessary to define the
correct strategic actions possible. As is explained later in more detail, the power matrix refers
to the difference in buyer-supplier power. Here a model from the literature is tested against
the practicality for Accell. Therefore, I pose the following research question:
“How can the power matrix, proposed by Cox, be applied to the Accell Group and
which measures should it entail?”
The third-question addresses the strategic actions following the segmentation of the
commodities and the definition of the power structure. The sub-question is posed as follows:
“What are the strategies that could be implemented to improve the positioning with
the suppliers based on the positioning of the commodity and the power relationship?”
The combination of the three sub-questions will be the baseline for the final way-of-working
approach that the Accell-Group can use to segment its commodities. The research question
will follow the results of the analysis and will be answered in the results section. A detailed
approach has been described by the means of a flowchart, which can be found in the
appendix.

11
4 Theoretical Framework
4.1 Supply Chain Management
This section will introduce my theoretical framework and therefore I first want to define
where my analysis will be positioned within the broader supply chain process.
Figure 2, (van Weele, 2010)
Figure 2 is a visual display of the supply chain and depicts the different stages usually
referred to within the broader framework.
In the field, many different terms are used and defined differently, which may or may not
describe the same process. The problem here is mostly with the exact wording, however,
problems may arise based on the different interpretations. Tan (2000, p.39) states that “(…)
each terminology addresses elements of the phenomenon, typically focusing on immediate
suppliers of an organization, supply chain management is the most widely used (and abused)
term to describe this philosophy”. Also, one has to distinguish between the two very general
perspectives on supply chain management. The one perspective focuses on the logistics
function meaning the physical distribution and cycle time reductions e.g. and the other is the
aforementioned purchasing function, with its focus on the industrial buyer (Tan, 2000).
Coming back to Figure 3, my analysis is positioned in the tactical/initial sourcing part of the
procurement process. The purchasing portfolio matrix comes up first, as it laid the ground for
future work in the field. This, however, should not be interpreted as a mix up of definitions,
but rather as an evolution within the field of research.
The general understanding of the supply or value chain has been developed over the years.
Business managers understand, that they no longer compete as single entities, but rather in a
network, which constitutes the so-called supply chain (Lambert, 2000). He further extends
this point when stressing that business processes used to be viewed as integrating corporate
functions within the firm and are now used to structure the activities between members of a
supply chain (Lambert, 2005).To what extent firms are able to manage their supply chain is

12
up to their market structure and the resources they put into it and can vary from simple first
tier supplier analysis to a complete supply chain network approach. Especially over the last
decade, there has been a refocusing from the reduction of costs towards a model based on the
principle of value-for-money (Cox, 2015). Therefore, strategies have to be developed on how
to approach the supply chain to best appropriate value, given the scarce available resources
(Cox, 2015). Especially if understood as a network of relationships, strategy formulation
means coping with competition (Porter, 2000). In this light, I want to pursue my master thesis,
which consequently should be seen as strategic options available for managing the supplier
base and improving the competitive positon within the network.
4.2 Purchasing Portfolio Management
To answer the first question, the existing theoretical framework will be presented.
“How can the purchasing portfolio model proposed by Kralijc be applied to the
Accell Group and which measures should it entail”?
The framework will include the model proposed by Kralijc on which I base my analysis, and
the critique and additions that have been developed over the years. The entirety forms the
basis for my analysis.
In the past, companies handled most of the production, from raw material to end product,
themselves, rendering supply chain management a redundant activity. With the increasing
globalization of the marketplaces and increasing competition, companies had to refocus and
find ways to cut costs to stay competitive. Instead of producing every part within the company
structure, more and more parts were bought from other more specialized companies. Over the
years this trend continued, making it an important function within every firm.
At this point I want to stress the importance of the notion of ‘core competencies’ and ‘non-
core-competencies’ which are defined as ‘the main strengths or strategic advantages of a
business, including the combination of pooled knowledge and technical capacities that allow a
business to be competitive in the marketplace’ (Investopedia, 2016). The function of strategic
sourcing focuses on the performance of those commodities, rather than buying what is
necessary for the daily operation of the business or organizational structures (e, g. office
buildings or office supplies). As goods were not produced by the firm itself, communication

13
with the supplier became an essential part to get the right product, at the right time, for the
right price, from the right supplier.
Commodities, however, are sold and bought in markets, the question from whom to buy is a
notion that was developed with the function of strategic sourcing. Also, not all purchased
products are as important as others for either the financial outcome of the company or the
assurance of supply for manufacturing said product.
Therefore it is important to distinguish the different products sourced, as every organization
only has a limited amount of resources and has to allocate the those resources as effectively
and efficiently as possible (Pulles, 2014). An early model used to rate the importance of
purchases is the ABC-Analysis (or Pareto Analysis). The problem here is that it judges the
importance of a given purchase only based on its financial impact (as in a transfer of money)
and neglects other factors like quality, TCO or social risks (Gelderman and van Weele, 2005).
For a more extensive understanding, several portfolio models have been developed over the
years. It is stated that the fundamental assumption of all portfolio models is the occurrence of
differences in power and dependence between the buyer and the supplier (Dubios and
Pedersen, 2002). One of the most prominent evaluation tools for supplier management has
been developed by Kralijc (Figure 3).
Figure 3, Kralijc, 1983
His seminal paper has had a huge influence on the work of other scholars in the field of
professional purchasing as he was the first to conceptualize buying power (e.g. Bensaou,
1999; Gelderman and Van Weele, 2002, 2005; Olsen and Ellram, 1997; Dubois and Pedersen,
2002; Caniels and Gelderman, 2005; Cox, 1996, 2001, 2008). The Kralijc matrix helps to

14
assign a commodity to one of four categories, which in turn can be linked to a specific
strategic approach. As Padhi puts it ‘(…) in his seminal work (Kralijc) proposed a purchasing
portfolio modelling approach, whose general idea was to minimize supply vulnerability and
making the most out of buying power (…)’, (Padhi, 2011, p.1). The two factors impacting the
buying power are profit impact and supply risk. On a scale from high to low on each side, he
defined four quadrants a commodity can be placed in. Those four categories are non-critical,
bottleneck strategic and leverage. As mentioned above, each quadrant requires a different
purchasing strategy.
Non-critical items have a low value and several possible alternative suppliers (Kralijc, 1983).
Bottleneck items have low value in relation to the total profit, but can be hard to find because
of scarce supply (Kralijc, 1983). Leverage items are, usually, raw materials or primary
products obtained from various suppliers at various qualities (Kralijc, 1983) and Strategic
items are complex products with few suppliers in the market (Kralijc, 1983). From those very
broad definitions one can immediately draw a conclusion for a general purchasing strategy.
Non-critical items seem to be of a somewhat lesser importance on a strategic level. Leverage
and strategic options, as suggested by their names, require more careful consideration and
evaluation due to their sensitivity. The bottleneck quadrant is usually considered an
undesirable position.
In addition, Kralijc also proposed basic sourcing strategies for the ‘strategic’ quadrant. He
proposed three strategies based on an evaluation of a company’s strength versus the strength
of the supply market (Kralijc, 1983). As a result, a second matrix was developed to define
possible options for said company. Those strategies are ‘exploit’, ‘balance’ and ‘diversify’.
‘Exploiting’ is done if the company has a relative strong market position vis-à-vis its
suppliers. As the supply risk is low, this should lead to a higher profit performance. The
second option is ‘Diversify’, which is the exact opposite position of exploitation. In this
situation, the company’s strength is rather low and the supply market strength is high or
medium. Here, Kralijc advises a defensive approach and consequently points to a possible
change in suppliers. The third option is ‘balancing’, where there is no particular strength on
either the supplier or the buyer side. The options in this scenario are defined by the tendency
to a position of relative strength or weakness, which would then go back to what was
proposed under the first two options of exploitation and diversifying. Even though Kralijc
does indeed identify different possible strategies of action, he does not follow through with
specific action to take other than rather broad statements of preferential treatment in case of a

15
position of strength and long term contract obligations and higher prices in a positon of
weakness (Kralijc, 1983).
Another critique to Kralijcs model is the problem of operationalization and the two dimension
the matrix is based upon. ‘The dimensions of (the) matrix (are) too abstract and without
specific and measurable indicators, and is not given detailed methods to quantify it.’
(Zhenfeng, 2007). In practice, this leaves much room for interpretation and self-determination
and can therefore differ depending on the situation it is used in. As is stated by Luzzini
(2012), the portfolio framework needs to be tailored with domain-specific content, which is
why they introduced transaction costs to Kralijcs purchasing portfolio. Transaction costs are
‘(…) costs of conducting any exchange, such as those taking place between firms in a
marketplace or a transfer of resources between the stages of a vertically integrated firm.’
(Luzzini, 2012, p.1022). Their analysis concludes with four category characteristics being
customization, technological uncertainty, supplier power and supply market volatility
(Luzzini, 2012). Those four categorization put products in one of four clusters, which are
risky, steady, special and volatile. The results obtained are accompanied by strategic goals,
which could be compared to those mentioned in the Kralijc matrix.
Kralijc offers a simple categorization method with specific actions to be taken. His take,
however useful in understanding the necessity for commodity management, is very limited.
What is often cited is the measurement problem (Luzzini, 2012; Gelderman and van Weele,
2002). Luzzini try to address their limits in ‘operationalising and measuring value drivers
(2012, p. 1016). The problem is first of all the, whether based on the two dimensions every
variable has been incorporated and how to test for the opposite. Second of all, rating either
dimension on low vs. high leaves a lot of room for subjectivity. This might not be fully based
on the dimension proposed, some value drivers do not seem to be included in the general idea
of the concept. Profit impact should at least incorporate a total cost of ownership approach,
but does it also include rather indirect influences on profit like innovativeness into account?
Furthermore, Kralijc focuses on a set of commodities ranked and the power dimension within
dyadic relationships. Several scholars have criticized this limitation and this paper will
elaborate on the problem in more-depth as there is extensive literature on the subject matter
(Dubois and Pedersen, 2002; Gelderman and van Weele, 2002; 2003). The point should be
made, however, that the sourcing strategy of one commodity might have a direct impact on
the competition of another commodity and on the other hand that the same commodity might
be purchased from different supplier for strategic reasons. The first point is a reference to the
fact that a company one sources a commodity from might also manufacture another

16
commodity of importance (to a varying extent). Sourcing this very component might reduce
transaction costs for the sourcing firm (based on the already existing relationship with the
manufacturer), but might also impact the strategic positioning of the manufacturing company
for this second commodity in the market (as we would source from a competitor). This is an
example of what e.g. Gelderman and van Weele (2005) refer to the ‘disregard for the
supplier’s side’ (p. 20).
Kralijc in his seminal work and most of the papers that have been published following his
work, do not pay much attention to the strategic actions possible, once a commodity has been
categorized. There will be a more profound discussion on this issue later, but it has to be
stressed at this point that the fundamental idea of sourcing strategies should be to gain
competitive advantages vis-à-vis the other companies in the market, which will have to go
through the market itself and the supplier sourced from. Therefore, the positioning should not
be taken as given, but as something the purchasing department has to improve (or harvest).
This is how Gelderman and van Weele are interpreted when they state that ‘purchasing
professionals could always move to other, strategically more attractive positions in the matrix’
(2002, p.31). Changing the positioning is, other things being equal, a result of an implemented
strategy.

17
4.3 Towards buyer-supplier relationship management – the power matrix
This section is the basis for the second sub-question I posed.
“How can the power matrix, proposed by Cox, be applied to the Accell Group and which
measures should it entail?”
As much as the work by Kralijc has initiated the discussion on the strategic direction of
purchasing, he does come short on the relationship of the buyer and the supplier, and the very
specific influence it has on the categorization of an item and, as we will see later, on the
strategic options every buyer has. Padhi (2012) stresses the necessity to administer buyer-
supplier relationships differently from the commodities when assigning purchasing strategies.
As I have discussed before the need to rank commodities within the purchasing portfolio
matrix, this view is buyer centric, with a disregard for the complex dyadic relationship of
exchange. From a supplier perspective the monetary value of a buyers order from a given
supplier, might be a rather small portion of the supplier total sales revenue (Ramsay, 1996).
The concept often referred to in this respect is the notion of power, which defines every
business relationship to varying degrees. In the market place every player tries to achieve the
best outcome for himself, therefore, by its very nature, buyer and supplier exchange is always
contested (Cox, 2010). An often cited, definition of power is that the ‘relative power of an
organization over another is the result of the net dependence of the one on the other’ (Caniels
and Gelderman, 2007, p.221). They also claim that ‘mutual dependence and power are closely
related concepts’ (Caniels and Gelderman, 2007, p.220), which can be interpreted as a
connection between the concept of power and the buyer-supplier relationship. Ramsay (1996)
had a similar approach from a resource-based view, although only focusing on the monetary
value of the relationship. He states that ‘buyers and suppliers are dependent on each other for
the satisfaction of their resource needs’ (Ramsay, 1996, p.128).
Gelderman and Van Weele (2000) also point to the natural conflict of the buyer-supplier
relationship, which is defined by either the dependency of one towards the other or the
implicit lack thereof. The main purpose of the portfolio approach is to detect products
(product groups) which might cause dependencies (Gelderman, 2006). In the Kralijc portfolio
matrix, those products are primarily found in the bottleneck and strategic quadrant, although
some dependency can never be denied regardless of the positioning.

18
Cox (2003, Figure 4, 2015), therefore introduced a matrix which tries to account for this
relationship and based his model on power interdependencies within the buyer-supplier
relationship.
Figure 4, Cox 2003
This matrix is derived from the two strategic business competences being demand
management competence and procurement and supply management competence. If one looks
at a supply chain network, almost every organization finds itself at the buyer or supplier side
respectively at some stage of the chain. The matrix departs from here, positioning the supplier
or the buyer at a more dominant position. Aside from the dominance dichotomy, the
relationship can also either be interdependent or independent (Cox, 2001). This business
relationship is called Janus-faced relation, which essentially means that ‘(...) organizations
have downstream supply relationships with their customers, as well as buying relationships
with their upstream suppliers’ (Cox, 2001, p.11).
Olsen and Ellram (1997) focus in their earlier work on the ‘important interdependencies
between relationships and the important task of allocating scarce resources between
relationships’ (p.101). In their approach, they do not only consider the influence of the
commodity on the financial performance and its strategic importance, but also introduce a
matrix to evaluate the relationship with regard to the relative supplier attractiveness and the
strength of the relationship. Bensaou (1999) proposed a model based on the buyer and
supplier specific investments. It is described how to handle a portfolio of relationships under
different external contingencies.
Schuh (2008), following their 2006 survey of roughly 200 CEOs across industries, proposed a
practical model, as they claim (p.11). They use supply and demand power as constructs,
contemplating that, in order to convince top-managers within the company of the usefulness

19
of the approach, it makes sense to use these fundamental economic concepts (Schuh, 2008).
They then subdivide the four basic concepts into 16 tactical levers and consequently 64
methods to be applied in practice. They do not further specify, except for some questions
posed (p. 35-37), how they measure either axis, but rather claim that those measures are
company specific (p.35).
Figure 5, Schuh (2008), p.216
A rather new concept was proposed by Cox (2015), which challenges the idea of ‘importance
of supply’ and draws the intention to the concept of ‘value for money’. As he first evaluates
the ‘categories of spend’ and ‘cost savings’, the latter focuses on ‘commercial’ and
‘organizational’ goals (p. 722). The matrix does not only focus on the dyadic relationship, but
tries also to account for other relationships within the market and therefore provides a more
comprehensive framework (Cox, 2015). His proposed model is again based on four quadrants
being strategic, strategic critical, tactical and tactical critical.
Strategic critical categories have an impact on both the operational and the commercial
mission goals of the firm. Those goals will need senior management attention and the highest

20
level of resource input. The strategic quadrant has a low impact on organisational but a high
impact on commercial goals. Therefore they do not need as many resources as strategic
critical categories. The tactical critical category has usually a high influence on operational
delivery but a low influence on commercial goals. Categories in the tactical quadrant have a
low influence on either operational or commercial criticality.

21
4.4 Strategic actions
This section describes the theoretical framework for the third sub-question.
“What are the strategies that could be implement to improve the positioning with the
suppliers based on the positioning of the commodity and the power relationship?”
This section provides an overview of sourcing strategies that can or should be employed
following the analysis to improve the strategic relationship with the suppliers.
Going back to Kralijc matrix, he proposes three different strategies depending on the position
within the matrix. Those are exploit, balance and diversify, depending on the risk category the
product is positioned in. In addition to the risk position within the matrix, other factors are
also mentioned as necessary inputs when considering a strategic approach, which are volume,
price, contractual coverage, new suppliers, inventories, own production, substitution, value
engineering and logistics (Kralijc, 1983). For example, the exploit strategy is used when the
buyer plays a dominant role and the supplier strength is asymmetric. This exertion of power
should however be limited or balanced in a way to not jeopardize the relationship as a whole.
Gelderman and van Weele (2002) did a case study with a Dutch chemical company (hereafter
DCC) analysing their strategies within each of the four quadrants proposed by Kralijcs model.
Bottleneck items require managers to increase buying power or develop new opportunities.
Proposed solutions are standardization, capacity deals, hedging, Internet buying or broadening
of the specification, just to name a few (Gelderman and van Weele, 2002). Non-critical items,
which are f.ex. office supplies or services, can be approach by pooling or framework
agreements. Strategic suppliers should be incorporated into partnership if possible. As is
mentioned by Gelderman and Semeijn (2006) strategic partnerships are subject to both parties
and if successful, are usually also embraced as such by both sides. This complicates the matter
as supplier might not be willing to agree to a specific arrangement due to their strong market
position (oligopolies, monopolies due to brand recognition or patents). Therefor DCC keeps
close relationships with supplier of similar goods as they might be considered as future fall
back options.
As I mentioned above other models derived action plans based on their own models, however,
most of them seem to come to similar conclusions.
The model proposed by Luzzini (2012) says that managers should focus on cost reduction and
delivery performances with regard to the ‘Steady’ category (top left corner). The ‘Volatile’

22
quadrant (top right corner) is defined by a more or less symmetric power relationship,
depending on volume and price. Therefore, price and volume management is the most
important tool (eg. bundling, volume contracts etc.).
The items in the ‘Special’ and ‘Risky’ quadrants (bottom left corner) contains products with
higher level of customization and higher supplier power, which means that delivery and
quality should have a relatively higher importance within the purchasing strategy approach.
In general, the literature gives rather vague recommendations on actual strategic actions in
order to move across and especially within quadrants. Schuh (et. al, 2008), used the Kralijc
matrix to develop specific actions in order to reduce costs and increase value with the supplier
base. In total they propose 64 different quadrants within the original four introduced by
Kralijc (Figure 3). The novelty of the approach is that, as mentioned by many authors before,
they do not only consider the buyers’ perspective but also the suppliers’ perspective when
proposing possible action plans. Furthermore, due to its size, is meant to provide a more
comprehensive framework for action. The tool can ‘assist buyers in all kinds of situations’
(Schuh, 2008, p.). Cox, in his earlier and also more recent works (2001, 2005, 2010, 2015),
stresses that those levers, even though valid in practice, fail to comprehend the logic that was
posed by the power matrix (Cox, 2015). The matrix was developed as a critique of the Kralijc
matrix and intends to encourage purchasing managers to first of all understand their power
relation with their suppliers and their market, but more importantly, also urges them to try to
move out of suboptimal relationships to more advantageous positons (iiAPS, 2010). He
criticizes their proposed model to the extent that the tactical levers proposed, however valid in
practice, fail to provide options to move out of these unfavourable situations. Following his
critique he came up with the static versus dynamic tactics dichotomy, which I will explain in
more detail in the next section.

23
4.4.1 Static versus dynamic tactics
This subsection is an additional differentiation, which has been made rather recently. When it
comes to strategic actions it is worth mentioning that a distinction can be made between
actions that keep you in the position you are in and positions that are trying to improve your
positioning. Static levers, according to Cox, manage the relationship with the supplier with
respect to the commodity but fail to address the power relationship and especially the
improvement of said power position. When we go back to Kralijcs model, he proposes
options including, efficient processing, exploit power, strategic partnerships or volume
assurance (Kralijc, 1983; Gelderman and van Weele, 2002). Not only are those measures
rather unspecific, but according to more recent literature, they also merely ‘react and adapt to
prevailing circumstances, taking the current power and dependence structure within the
supply chain for granted’ (Gelderman and van Weele, 2002). This goes hand in hand with
earlier posed critique stating that it is unclear how other positions in the matrix are pursued
(Gelderman, 2000). As mentioned above, dynamic tactics try to cope for this problem and
move within the matrix to the most optimal position possible. As mentioned before, the ideal
position for the buyer is the leverage (buyer dominance position). Figure 4 graphically
displays what is meant by moving within the matrix. Cox proposes nine different leverage
strategies, but also states that not all of them are always applicable and have to be carefully
considered Cox, 2015). Those levers are:
• Rationalise supply power position
• Optimise design and specification gap
• Optimise demand management leverage
• Increase competition and new entry
• Minimise risk of post-contractual lock-in
• Reduce information asymmetry
• Increase supplier hold-up and dependency
• Joint ventures
• Insourcing

24
Figure 6, Cox (2015)
The difference Cox tries to make, when proposing the dichotomy of static versus dynamic
levers is understandable. The usefulness of those static levers as strategic tools in the mold of
dynamic levers should, however, not be dismissed. Bundling in itself might be considered a
dynamic leverage tool when it changes the supplier relationship to a buyer dominance
positon. A practical case could be a rather small supplier, where a firm accounted for 20% of
total sales before bundling, accounts for over 50% after bundling.

25
5 Methodology
This section is meant to describe the methodological approach to my research, hence how I
organized and conducted my research.
As mentioned in the introduction section of this article, Accell has recently established a
procurement department, meaning there is no specific information on how this has been dealt
with in the past. The problem at hand and one of the challenges of this assignment is to
establish a framework in which the group procurement department can work in a standardized
way, taking into account the differences of the different brands of the group. As has been
mentioned above as well, I want to pose the following research questions.
“To what extent can a commodity strategy be developed for the Accell-Group as a
whole and which steps should it entail?
To answer this main question, I developed several sub-questions:
1. “How can the purchasing portfolio model proposed by Kralijc be applied to the
Accell Group and which measures should it entail?”
2. “How can the power matrix, proposed by Cox, be applied to the Accell Group and
which measures should it entail?”
3. What are the strategies that could be implemented to improve the positioning of
the brands with the suppliers based on the positioning of the commodity and the
power relationship?
As the theoretical framework provided by the literature lacks consistency a deductive
reasoning approach seems to be of best fit for the case studies. By this I mean that the theories
developed by e.g. Kralijc or Cox give us an idea on how to approach the issue at hand.
However, they will have to be adopted for the Accell-Group. I can cross-check afterwards
whether the results from my analysis are comparable to what the literature suggests. The
general approach is conceptualized in figure 5 below.

26
Figure 7, conceptual model
A first step towards answering my main research questions is to first define how the Accell-
Group should segment their commodities. The brands within the Accell Group, however, are
very different from each other. Therefore, I want to define the commodity approach first for
specific commodities within specific segments by means of case studies. A segment within
the Accell-Group is the difference between city bikes, race bikes, MTB bikes, tracking bikes
and E-bikes. Those segments are not always used by the brands, but are found in almost all
the brands differing segments can be placed in either one of those five segments. A case study
is stated by Gillham (2010, pp. 1) as “a unit of human activity embedded in the real world;
which can only be studied or understood in context; which exist here and now; that merges in
its context so that precise boundaries are difficult to draw”.
The Kralijc matrix and the Power matrix by Cox will be used as a framework and as a starting
point. A more detailed analysis of these concepts, as well as a reasoning on their selection will
be explained in the following sections. The value drivers (hereafter value drivers) originally
proposed with these concepts are inconclusive and are lacking the specificity needed for the
Accell-Group. Therefore, in a second step, I will draft a questionnaire with value drivers.
Accell has a lot of important commodities, which would fall within the scope of this thesis.
Discussions with the category buyers and category managers, as well as the whole purchasing
team will help to define, which products are best suitable for the case studies. The respective
buyer and manager of said commodity are asked to fill out the questionnaire. By respective, I
mean the category manager/buyer responsible for the commodity. In general, every category
is supported by one category manager and one category buyer. At the beginning of the
questionnaire the respective category manager/buyer will also be asked to judge whether this
commodity is comparable across segments. As there are 4-5 segments, every combination is
possible. Secondly, they will rate the usefulness of the value drivers in relation to said

27
commodity and the segments they choose. The value drivers are related to the axis of the
Kralijc matrix, being financial performance and supply risk. The outcome will be used as a
definition for the axis of the matrix. This step will be repeated for each specific commodity
for, first, the commodity position and, second, the power relation. The variables are found in
the literature and the PwC report, which also defines the organizational strategy.
The questionnaire asks the participants to rate each value driver on a scale from 1 to 5. This is
repeated for each of the four axes. To answer the questionnaire correctly a guide will be
provided defining the meaning of the variable in the context of the axis.
Once these value drivers have been rated on their usefulness the matrix has been adopted
accordingly. The next step is to weight the value drivers. This will be done in a meeting of the
procurement team by means of a discussion. A rating is assigned to a variable which will be
used to calculate a weighting. The Analytical Hierarchy Process (AHP) is used to calculate
the weights. The AHP method is chosen over e.g. a weighted sum model as it takes outliers
better into account. The expectation is that those will have a significant impact on the results.
In an additional step interviews will be conducted with the purchasing officers of the different
brands. As the purchasing function is done by the different brands and has been for years the
experience with the commodity and the suppliers serves as a valuable input for the feasibility
and practicality of the approach.
A second questionnaire will be send out for the evaluation of the usefulness of the value
drivers for the axis of the Power Matrix, being buyer power and supplier power. Again, a
weighting is applied using the AHP method and the discussion with the purchasing team.
Once the value drivers have been set the matrix can be applied and the data will be filled in.
Depending on the category and the segments implemented each variable will be given a
weight to underline the importance of some of the factors.
The third sub-question is directed towards the strategic actions to be taken to improve or keep
its position. The model proposed by Schuh (2008) is the most extensive model to be found in
the current literature. Based on the segmentation of the commodity and the defined power
structure in the first two questions, a certain positioning is reached. This position will be
compared with possible strategic or tactical actions from the Schuh model. Once those
positions have been defined, they will be presented to the purchasing team. A discussion
about the practical feasibility and eventual problems leads to a list of strategic and tactical
levers. After the strategic directions have been defined by the procurement team, interviews
with the purchasing officers are conducted. The role of the purchasing officers is twofold.

28
First of all, I want to take a closer look at the strategies that are carried out at the moment.
Second of all the proposed strategies are judged on practicality.
The research approach is visualized in a flow chart in the appendix under Figure 8.

29
6 Model Development
This chapter follows the methodology section and describes the steps for developing the
model I will use in the case studies. At the end of this chapter the model for defining the
commodity strategy and the supplier strategy are presented. In the line of my research I want
to answer the sub-questions one and two with the following section.
6.1 The commodity strategy
One of the targets of this analysis is to find a practical implementation of the Kralijc matrix
for Accell. Therefore, a look into the literature provided a general framework, as was
mentioned before. This framework consists of several value drivers for both axis of the
matrix. Using a questionnaire, the purchasing team of the Accell Group decided which factors
to keep and which not to take into the analysis of the commodity strategy. The value drivers
can be found in the literature. A systematic literature review was used to find the most
relevant articles from known web-sources (primarily Web of Science, Google Scholar and
Scopus). At first the abstract and in some cases the conclusion was read. If the article was
deemed relevant, the rest of the article was read. It is important to mention that not all
literature was included as the value drivers tended to repeat themselves. As this review was
part of a process, discussions with category managers of the Accell Group lead to the
inclusion of seemingly relevant value drivers. Including value drivers was a judgement call
based on the discussion with the team and the available literature.
In the beginning, an important choice had to be made. The matrix, is developed on the group
level, meaning there is no distinction per commodity per brands at first. This will have to be
developed in the case studies, but all value drivers are directed towards the group level and
have to be understood in that way. The reason for that lies in its practicality. Too many
commodities are used by several brands in the same or a similar way, therefore developing a
matrix per commodity would be impractical. This will always be specified at a later stage
within the case study. It might be the case that certain brands are not part of the analysis as
they do not use a part, because it belongs to a specific segment. An example would be
batteries, which are only used on E-bikes. Some brands do not produce E-bikes of any kind
so, naturally, these brands will not be part of this specific case study. Below you find the list
of factors that were included into the “long-list”, after conducting the literature review.
It should be noted that there are several factors are closely related to not only the commodity,
but also the supplier. Those factors are, among others, the lead time reliability or the number
of suppliers. The decision to include these factors is, because they have a decisive impact on

30
their respective dimension and are not separable in practice from either the supplier or the
commodity. They are, however, important to the Accell Group in defining their strategy. As
this is based on a theoretical model, which will not give a clear-cut answer, including these
factors is a conscious choice to increase the viability of the study.
Financial Performance Supply Risk
Percentage of Total Spend
Gelderman, C.J. and van Weele, A.J. (2003)
Lead time reliability
Gelderman, C.J. and van Weele, A.J. (2003)
Profitability/
Margin
Kralijc, P. (1983)
Flexibility
Lambert, D. and Schwieterman, “M. A. (2012)
Cost of correction
Accell – initial discussion category manager
Forecasting
Kralijc, P. (1983)
Value added by upgrade
Accell – initial discussion category manager
Specification complexity
Padhi, S. S., Wagner, S. M. and Aggarwal, V. (2011)
Post design
freeze scope change
Accell – initial discussion category manager
Number of suppliers
Kralijc, P. (1983)
Quality assurance compliance
Accell – initial discussion category manager
Degree of supplier involvement needed
in forecasting
Lambert, D. and Schwieterman, “M. A. (2012)
Importance of part to get leverage with supplier
Gelderman, C.J., and van Weele, A.J. (2005)
Substitutability
Kralijc, P. (1983)
Innovation
Gelderman, C.J., and van Weele, A.J. (2005)
Category industry capacity constraints
Accell – initial discussion category manager
Supplier collaboration
Lambert, D., Garcia-Dastugue, S.J. and Croxton, K.L. (2005)
Impact on assembly line
Lambert, D. and Schwieterman, “M. A. (2012)
Environmental impact
Lambert, D., Garcia-Dastugue, S.J. and Croxton, K.L. (2005)
Total cost of ownership
Gelderman, C.J. and van Weele, A.J. (2003)
Stock carrying costs
Accell – initial discussion category manager

31
In the appendix you will find the guidance note, which the participants of the questionnaire
were provided with. This list includes the definition of the different factors. The factors were
rated on whether they were important enough to be included or not. For practical reasons the
questionnaire was combined with an interview. This helped to, first of all, answer questions
and give clarifications. Second of all, the interviewees were asked to justify their decisions.
Also, questions were asked on possible recommendations the interviewee(s) had with respect
to the combining factors or adding potential factors. The outcome of the questionnaire is a
“short-list” of factors. This list includes the factors, deemed relevant by the purchasing team
to measure the commodities within the matrix. The purchasing team was split up into the
category teams (2 persons per team), the group procurement director and the procurement
analyst of the team. There were two reasons for that. On the one hand, it was easier to
organize the interview due to the full schedule of the team. On the other hand, the comparison
provided the opportunity to look for differences between the categories teams regarding the
preferences for the factors.
6.1.1 Factor short-list
In the following section, you will find the results of the questionnaire. This list will be
referred to as the “short-list” of value drivers deemed necessary for further analysis. From the
original “long list”, the interviews were used as a mean to exclude factors based on their
relevance. The definition of the value drivers can be found in the appendix under the guidance
notes.
Following the interviews, the differences between the category teams became clear. However,
none of the factors was completely irrelevant. There are several reasons for that. First of all,
the relevance is not only dependent on the category teams, but also on the commodities within
the categories. An example for that was given by one of the category managers as he
explained that a value upgrade of spokes will have virtually no impact on the financial
performance, being an increase of sales in this case, of the end product. Rims or tires, on the
other hand, have an influence on the performance on the bike and especially in the high
segment, will probably increase sales. Another perspective is the one between the categories.
The same factor, value added by upgrade, does have an influence on the financial
performance for rims and tires. For the category complete bikes, this is different. As they
source complete bikes anyways, upgrading is not an option as they have to be specified before
and are bought as a finished product. Another interesting stance was on the factor

32
environmental impact. On the category “complete bikes”, the environmental factors had a
huge impact on the costs of the bike. The same is true for the commodities in the category
catalogue items. The difference is that the regulations have to be accounted for by everybody.
The complexity of the whole bikes that are sourced leaves more room to change things in a
certain way to prevent costs. Single commodities do not leave a lot of room, making it a
comply or not comply factor.
Another point that was made during the interviews was the similarity of some of the value
drivers. Every group pointed out that the factors “Percentage of total spend” and profit impact
are not the same, but have a similar result. In the questionnaire, both factors were rated
similarly or even the same. The same goes for “total cost of ownership”, “cost of correction”,
“stock carrying costs” and “quality assurance compliance”. The last three are considered a
part of “total cost of ownership”. Also, some of them are highly interrelated. If the company
takes care of the “quality assurance compliance” process, the result should be very low “costs
of correction”. For the analysis, it was pointed out that, whichever part of TCO would be
important for the commodity, should be rated when evaluating the commodities. In the
description of the case study, that specific part of TCO can be pointed out and stressed as a
necessary focal point. On the supply risk axis, an example for grouping factors were
“forecasting” and “degree of supplier involvement needed e.g. forecasting”. Including the
interviews into the evaluation of the factors, the following “short-list” was developed. The
definition of each factor can be found in the guidance-note in the appendix.
Financial Performance Supply Risk
Profitability impact Lead time reliability
Total Cost of Ownership Flexibility
Value added by upgrade Forecasting
Post design freeze scope change Specification complexity
Importance of part to get leverage with
supplier
Number of Suppliers
Exclusivity of use Substitutability
Environmental impact Category industry capacity constraints
Innovation Country of origin
Supplier collaboration

33
As part of the questionnaire, the respondents were asked to name factors that are considered
“knock-out” criteria. Those are criteria, highly relevant to them, the Accell Group and of their
specific commodity. I will list the results below and explain in more detail why they are
highly relevant. For my analysis, I expect these factors to score relatively high when weighted
against the other factors. From the questionnaire three factors stood out and will therefore be
laid out below.
6.1.1.1 Total cost of ownership
After the interviews, the two factors (quality assurance and TCO) were consolidated, but both
were mentioned several times and seem to be highly relevant for Accell. The relevance of this
factor is manifold, especially due to its broad definition. For the Accell Group, only Accell
Nederland works on a Just-in-time basis. Therefore, the other production facilities work on
stock, which causes especially high costs. Those stock costs are especially high for the more
expensive e-bike components, the fastest growing segment of the Accell Group. The
immaturity of the quality assurance process is also apparent in how the defects are handled.
Most of the defects are not checked, but replaced right away. A more recent example is that
bike displays have been reported defective and were replaced instantly. It turned out that only
10-15% of the displays were actually defective, but due to the non-existing control procedure,
this was detected too late. Lastly, contracts rarely cover procedures for replacement and
liability rules, which means the defects are handled by Accell themselves.
6.1.1.2 Lead time reliability
Lead time reliability is very important for the production process and especially the planning
of the model year. It is closely related to the direct lead time. The difference between the two
is that the reliability of the lead time has a more direct influence on the risk of supply. Even
though reducing lead times is an outspoken goal of Accell due to its influence on the
flexibility and the necessity of reacting to the market. However, lead times can be calculated
and mitigated by good forecasting. The reliability is a factor that cannot be influenced and has
to be accounted for in the strategy of sourcing the commodities and when finding the right
supplier to source from.
34
6.1.1.3 Forecasting
This factor is highly relevant to the Accell Group for several reasons. First of all, the
immaturity of the industry and the only recently established group procurement lead to a
limited forecasting output/performance. This also has an influence on the importance of the
forecasting at the moment and consequently its high rating. Having stressed that, there are
other important aspects to consider. Related to the point made above, forecasting relies on
how developed your internal processes are, as it is based on what you produce, in what
quantity at what time. Only when you can accurately predict those basic facts, the supplier has
the ability to depend on what you forecast. As to its practical importance, the supplier knows
in advance what he needs to produce for you for a certain period, and can account for it in his
planning. Commodities forecasted can therefore be out on stock on time waiting for shipment,
which leads to the third point. Correctly forecasted, products with a long lead time, can be
shipped together, which also leads to reduced costs for you and the supplier. Referring to the
high volatility of the market, accurate forecasting is very important to make the long lead
times more manageable. Accell has to be able to react to the market as fast and decisive as
possible to keep and/or increase its market share. On a group level, forecasting across the
different brands allows for flexibility and brings the products faster to the market.
6.2 The Power structure
The following section deals with the second sub-question I posed, which is the buyer-supplier
relationship. Similarly, to the commodity strategy above, the power matrix is adapted to the
needs and circumstances of the Accell Group. Factors found in the literature are tested for
their usefulness and applicability. To prevent misunderstandings, to assure the validity of the
factors included and for practical reasons, the questionnaires were again filled out in
combination with an interview. Also, the procurement team was again separated into the
category teams, the group procurement director and the procurement analyst.

35
The so called “long-list” was developed as a list of suggestions for the procurement team.
After the questionnaire and the following interviews, the “short-list” is developed and used
for the case studies. The factors included in the long-list are:
Supplier Power Buyer Power
Spend in relation to total spend
Cox, A., Sanderson, J. and Watson, G. (2001)”
Percentage spend of suppliers total turnover
Cox, A., Sanderson, J. and Watson, G. (2001)”
Number of available suppliers
Cox, A., Sanderson, J. and Watson, G. (2001)”
Our attractiveness as a customer (end
market)
Lambert, D. and Schwieterman, “M. A. (2012)
Brand recognition
Lambert, D. and Schwieterman, “M. A. (2012)
Buyer specific investments/process
integration
Lambert, D. and Schwieterman, “M. A. (2012)
Degree of supplier capabilities/property
rights
Cox, A., Sanderson, J. and Watson, G. (2001)”
Number of available buyers
Cox, A., Sanderson, J. and Watson, G. (2001)”
Compatibility/strategic alignment
Cox, A., Sanderson, J. and Watson, G. (2001)”
Buyer switching costs
Cox, A., Sanderson, J. and Watson, G. (2001)”
Entry barriers to new supplier
Cox, A., Sanderson, J. and Watson, G. (2001)”
Differential advantage (uniqueness) of
industry products
Lambert, D. and Schwieterman, “M. A. (2012)
Entry barriers to new products
Cox, A., Sanderson, J. and Watson, G. (2001)”
Trust developed
Accell – initial discussion category manager
Supplier switching costs
Accell – initial discussion category manager
Contract availability
Lambert, D. and Schwieterman, “M. A. (2012)
Ability to cope with changes in the supplier
business environment
Lambert, D. and Schwieterman, “M. A. (2012)
Degree of relationship developed
Accell – initial discussion category manager
Core competency of the supplier
Lambert, D. and Schwieterman, “M. A. (2012)
Number of commodities purchased at the
supplier and their interdependence
Accell – initial discussion category manager
Trust developed
Accell – initial discussion category manager
Core competency of the buyer
Cox, A., Sanderson, J. and Watson, G. (2001)”
Relationship developed
Accell – initial discussion category manager

36
6.2.1 Factor short-list
The outcome of the questionnaire and the interviews conducted will be listed below.
Comparable to the previous short-list the listed factors were discussed and deemed either
relevant or not relevant for measuring the supplier or buyer power. The definition of the value
drivers can be found in the appendix under the guidance notes.
In general, all factors were considered important to some extent, but as you can see when
comparing the two lists, factors were added and consolidated. Again, it turned out that the
factors differ in importance with regard to the different category teams. Additionally, within
the categories, the factors differ in importance per segment. This verifies the approach taken,
as a generic model can be used to include all the factors necessary, but needs to be adapted in
practice when looking at a specific commodity within a specific segment. However, as the
second matrix views the supplier-buyer relationship in general, the differences between the
category teams is less profound. The reason for that is primarily, that the supplier tends to
produce several products in several segments.
The factors itself were mainly consolidated following the interviews. This was primarily done
for practical reasons. One example is that the initially two factors, of “entry barriers for new
products” and “entry barriers for new suppliers” was consolidated to one factor. In this
incident, the reason is that the interviewees are of the opinion that they both mean the same or
are at least correlated to the extent that combining them improves the analysis. The reason
mentioned were primarily related to the industry. The same was done with the factors “Trust
developed” and “Relationship developed” for both axis of the matrix. Furthermore, one factor
introduced was “Rank order within supplier’s customer base”. This variable was added,
partially as an addition of the factor “Percentage spend of suppliers’ total turnover”. The
convincing logic behind it is, that it might be possible to buy only 5% of the suppliers total
turnover and still be the biggest buyer should the supplier have a lot of different buyers in his
portfolio.

37
Supplier Power Buyer Power
Spend in relation to total spend Percentage spend of suppliers total turnover
Number of available suppliers Our attractiveness as a customer (end
market)
Brand recognition
Buyer specific investments/process
integration
Degree of supplier capabilities/property
rights
Number of available buyers
Compatibility/strategic alignment Rank order within suppliers customer base
Entry barriers to new supplier/new products Differential advantage (uniqueness) of
industry products
Degree of trust and relationship developed Degree of trust and relationship developed
Supplier switching costs Contract availability
Ability to cope with changes in the supplier
business environment
Core competency of the buyer
Core competency of the supplier Number of commodities purchased at the
supplier and their interdependence
Some factors were considered very important and I will go into more detail as to why these
factors were considered more important to the Accell Group.
38
6.2.1.1 Supplier capabilities
This factor was mentioned several times as a deciding factor for supplier power. Several
reasons were stressed as to why this factor is especially important. First of all, quality is a
very important point of consideration. The industry is rather informal and a lot is based on
trust and reputation. Contradicting to that, Accell had to deal with quality defects over the last
year that were especially caused by well-known suppliers with a good reputation. Due to the
limited time within the model year, Accell needs suppliers’ that can deliver on time and
adhere to their quality standards. This point will be stressed in the near future especially. In
that respect, even though the bike market itself might offer a lot of possible suppliers, only a
few actually qualify as potential supplier due to the quality standards of Accell, stressing the
point of standing out in the crowd even more. From another perspective, the emerging E-bike
market changed the complexity of building bikes. The technological advancements of recent
years complicated the construction part of the bike, including the difficulty to innovate and be
a step ahead. This includes the inclusion of new regulations in this specific market. Also,
problems cause by defective components, tend to have a higher influence on the financial
results as they are more expensive, time consuming and difficult to solve.
6.2.1.2 Number of available buyers available
The number of available suppliers has a very simple but important narrative based on the
supply and demand logic. The more buyers there are, the more leverage the supplier has to
leverage the existing suppliers. Again, this is dominated by the problems currently witnessed
by the industry. The complexity of the E-bike market and the importance of the segment for
almost every buyer in the market, makes the limited number of supplier very powerful.
6.2.1.3 Percentage spend of suppliers total turnover
The logic behind this factor is fairly simple. The more we buy from a supplier already the
more dependent they are on us. Should we change the conditions slightly, this will have a
direct impact on their financial results. As switching buyer is not always easy, this gives a
great deal of power to the existing buyers.
These two matrixes conclude the model development section. Both of the models have been
defined and developed from the generic, theoretical models of Kralijc and Cox, towards
Accell specific commodity and power matrixes. The next step to conduct the first case studies
using the adapted model. In the next section, the factors will be rated based on a specific
commodity within a specific segment. Afterwards both models will be applied.

39
7 Product Manager
The group procurement department was only recently established. Competencies and
responsibilities are currently defined and assigned. As mentioned above, the purchasing
functions had been performed primarily by the product managers of the respective brands.
Therefore, interviewing the product managers will give insights into what they considered
important when it comes, first of all, to buying commodities, and second of all, dealing with
the suppliers. This serves as a double check on whether the chosen factors are in line with
what the product managers, for whom the procurement department buys the product, consider
important. Should there be considerable deviations on factors, the short-list would be adapted.
I divided the interviews into two sections, corresponding to the research of this study. The
first section consisted of questions about the suppliers and the second consisted about
questions on the products itself. The underlying idea was to define what the problems and
challenges are with both section and how they deal with it at the moment.
I interviewed five product managers in total, between the 20.02.2017 and the 03.03.2017. A
clear pattern was found in across the interviews and similar points were stressed. Those points
differed partly to what I found in the study of the purchasing professionals in the procurement
department. This was very much expected and gives a great view on the complexity of the
issue and the challenges these two departments face when working together. This is primarily
due to the focus both departments have and especially the difference in focus.
As mentioned above, the interview was generally divided into two section. The first section
deals with the suppliers and the second with components.
The problem mentioned by most PMs were the long lead times in general. The mostly cited
reason for that was the production in Asia and the naturally longer lead times caused by that.
If one wants to understand the problem at hand the whole process of making a bike has to be
taken into account. Designing a bike is done in Model Years (MY) (e.g. MY 2017,
MY2018…). Therefore, the whole process may not take longer than 12 month. The
production of the bike is estimated to take about 6 month, including the delivery of all
components. The actual assembly, however, as stated by the Planned Manager of Batavus
Heerenveen takes only about 4 days. As the bike production takes about half a year the PMs
need to complete their Bill of Material (BOM) in the 6 month before that. If a new part, for
example a frame is newly designed, receiving one for testing will already take 6-8 weeks.
Introducing new parts would also require testing. This is mainly done on the component level,
but for time reasons, is not always done on product level. This shows the time predicament

40
the PMs are in when specifying components on the bikes. Related to the lead times, is the lead
time reliability, as a measure of risk. As mentioned by one PM, especially local supplier offer
very short lead times, which they cannot keep afterwards. If parts are missing due to a delay
in delivery, production would have to stop.
Another challenge closely related is the difference in planning. Especially bigger suppliers
(e.g. Bosch and Shimano) follow their roadmaps, which are planned ahead 2-5 years. Accell
usually plans per Model year, or two years ahead. The product releases are typically done late
in the year and are available to the whole market. Due to the competitive market, those new
releases are specified blindly on the end products. Accell tends to trust on the reliability and
especially the related reputation of those suppliers to assure quality of their products.
If one wants to make a separation between suppliers, the Asian market could be described as
less reliable and less transparent. Also, in general, those bigger suppliers, tend to have more
resources at their disposal. The highly competitive market is dependent on the new product
releases to mostly not separate from the competition, but to keep up with the market.
The difference between the brands is also an important point to mention at the moment. Some
of the focus on niche markets, which usually requires special components. As stated by one of
the PMs, the problem is that:
“The more niche your product, the more niche your components become, which
creates a high dependence on the supplier”.
The size of the supplier was also stated as one problem during the interviews. Some suppliers
are significantly bigger than the Accell Group as a whole, let alone the single brands. For
years, every brand approached the supplier on his own, and only recently did the forecasting
become a group’s activity. Reliable forecasting on the groups level would make Accell more
attractive as a buyer and would of course also increase power vis-à-vis the supplier due to a
higher volume. More accurate planning would also make it possible to negotiate more reliable
arrangements with the supplier as is would facilitate their planning as well.
The second part of the questionnaire was about the challenges and problems, the PMs face
with certain components/commodities. One point that was repeated several times are the
frames. For one they make up the biggest part of the frame and in one way or the other
connect all components. Also, they are the main selling point and considered an important
piece of the authenticity of the bike. The problem with those factors are the long lead times, as
reacting to the market is impossible within the usual timeframe. More recently the time it

41
takes was measured, from designing a frame to introducing it for Accell NL. The total time
was 14 month.
Another problem mentioned was related to the E-bike market, mostly considered the market
of the future for all brands. The increasing complexity, coming with the introduction of more
electronics and a faster bike, created the need for more testing and compliance. This does not
only count for the components itself, but primarily for the end product (the bike) as a whole. It
also complicates the supplier sourcing as more and more norms and regulations have to be
fulfilled. What makes it more difficult as well, putting together the right parts in general was
mentioned by one of the PMs as the most difficult and most important part of his work. This
is mainly related to design and for functional reasons, adding an additional dimension to
producing bikes. Related to other components, some answers were more mixed. Again, lead
times play a huge role. One example given was that tires are critical as their lead times can be
up to 120 maybe 150 days (e.g. Schwalbe tires), which has a huge influence on the design
process and the production itself.
Concluding, a lot can be taken from the interviews of with the product managers. Their view
is obviously more focused on the design and production process. One point often made on the
importance of price is that a reduction in the price does not matter as much if you cannot sell
the bikes in the market and have sell the bikes consequently at costs at the end of the season.
Also, their view on the supplier is very much directed to the performance of the end product
in the market place. With the emerging E-bike market, innovations are very important to the
industry. Suppliers with the capabilities to continuously keep you ahead of the competition
are critical and become more and more important. Capability also becomes more important
due to the complexity of the E-bikes. The test centre of the Accell Group does not possess
sufficient resources to test everything in detail. As one PM put it:
”We need the suppliers to assure the quality of the components on the one side, and to
build the components we need to serve the niche market we want. They can be part of
the resources we do not have”.
Another PM noted that the sharing of information is a very crucial element of the supplier
relationship. If the supplier is willing and able to share crucial information on the sourced
components, the whole design and production process is much simpler.
The information provided by the PMs makes it clear that there are certain similarities with
what the procurement department considers important. The most important point mentioned
are lead time (reliability), flexibility and forecasting. Of course, the view point differs in many

42
respects as the orientation is very different. However, for the sake of the research, it became
more and more apparent that a one-size-fits-all approach will not work in this environment.
Setting up a generic model that can be adapted according to the needs (e.g. weighting the
factors) is the right approach to go about the differences of the brands and the different
segments. Consequently, the short-list was not adapted.
The next section will be the practical implementation of the designed model.

43
8 Implementation
This section uses the previously developed model and applies it to specific cases to see
whether it matches with the expectations, and if not why it deviates.
8.1 Case Study – Roller brakes
8.1.1 Introduction
The roller brakes are one of many brake systems used in the portfolio of the Accell Group.
Other examples are disc brakes or rim brakes. The roller brake is a well-known brake system
especially in the German and Dutch bicycle market. The advantages of this system are, on the
one hand, the low costs per unit and on the other hand, the low maintenance expenses. Also,
one could point to the fact that, in general little has to be done to maintain the brakes, which
makes them easy to handle for the customers. The disadvantage, as has been pointed out by
the industry itself and several product managers of the Accell Group is their bad performance.
As mentioned above, they are still demanded by the end market disregarding their
performance and the presence of better (performing) options.
The market for roller brakes is dominated by the company Shimano. Shimano holds several
patents of this specific part which drove most of the competition, if not all, out of the market.
One could describe their position as a monopoly. This makes this commodity difficult to
handle for the Accell Group from a procurement point of view. The market, especially the
German and Dutch market, demands the use of said roller brakes. The positioning of the
Accell Group in this monopolistic market, however, is rather weak. At first sight, several
positives could be mentioned for the Accell Group. First of all, they have a strong position in
the European market and especially in the dominant market for roller brakes (being the
Netherlands and Germany). Second of all, Accell does a lot of business with Shimano in
general. In 2016, the Accell Group and Shimano had a spent volume of about 108 million
euro. Shimano, however, is about three times the size of the whole Accell Group and is a very
dominant player in the bicycle industry. This is especially felt with specific products where
their brand recognition is very high with the end consumer.
The relationship can be described as difficult as well. Shimano is a Japanese company who
prides themselves as being the number one player in the bicycle industry. They are very well
setup organizationally. Even though they are a supplier of bike parts, they are bigger than
most of the bike assemblers, including the Accell Group. This also puts them on another level
when it comes to financial strength and investments into R&D. On the market, they are less

44
dependent, on average, even on rather big assemblers, like the Accell Group. It should also be
mentioned, that the Accell Group never approached Shimano on the group level up to this
point. The negotiations, which were started on the group level only recently, can be described
as difficult so far.
Given the situation I derive several expectations. For the commodity matrix, I expect roller
brakes to be in the bottleneck quadrant. The main driver behind this expectation is the limited
number of supplier, being Shimano only. Furthermore, there are no realistic substitutes for
these brakes. On the financial side, the roller brakes do not necessarily constitute a sizable
part of the costs of the bike as a whole. Also, other components are more relevant at the sales
desk.
The buyer-supplier relationship is skewed towards the supplier, which means that the
expectation for the analysis is supplier dominance. This is primarily driven by the market
power of Shimano and their relative size and financial power. Also, the patent situation makes
it difficult for a new entry or development of other suppliers as competition on the market.
8.1.2 Weighting
To define the positioning of the roller brakes the first step was to weigh the value drivers that
have been defined previously for the Accell Group and to specify them for the case study,
hence the roller brakes. In a second step, the most dominant value drivers are selected. As a
cut-off point, 10% was chosen. This step is considered necessary as a very small percentage
will not have much of an influence on the end results. Therefore, cutting down on the number
of value drivers makes the analysis more practical. The matrixes can be found in the
appendix. Afterwards the remaining value drivers were weighted again. The weighting was
done by the respective category team.
The procedure was carried out for both matrixes, the commodity matrix and the power matrix.
You will find the outcome for both matrixes below.
Axis – Financial Performance, Eigenvalue 0, 06
Financial Performance
Profitabilit
y
Total cost of
ownership
Importance of part to get
leverage with supplier Exclusivity of use
Innovatio
n
Supplier
collaboration Percentages
Profitability impact 0,14 0,13 0,24 0,18 0,15 0,12 0,16
Total cost of ownership 0,42 0,38 0,24 0,24 0,30 0,48 0,34
Importance of part to
get leverage with supplier 0,05 0,13 0,08 0,06 0,15 0,06 0,09
Exclusivity of use 0,05 0,09 0,08 0,06 0,03 0,05 0,06
Innovation 0,07 0,09 0,04 0,18 0,08 0,06 0,09
Supplier Collaboration 0,28 0,19 0,32 0,29 0,30 0,24 0,27
Sum 1,00 1,00 1,00 1,00 1,00 1,00 1,00

45
Axis – Supply Risk, Eigenvalue 0, 16
For the commodity axis two value drivers were considered the most important when it comes
to the influence of roller brakes on the financial performance. Those two are Total cost of
ownership (34%) and supplier collaboration (27%). To a lesser extent this can also be said
about the profitability impact (16%).
Supply risk is primarily defined by the reliability of the lead time (38%), difficulty of
forecasting (29%) and the difficulty of substitutability (16%).
Axis – Supplier Power, Eigenvalue 0, 08
Supply Risk Lead time reliability Forecasting
Number
of
suppliers Substitutability
Category
industry
capacity
constraints Percentages
Lead time reliability 0,43 0,52 0,26 0,42 0,27 0,38
Forecasting 0,21 0,26 0,35 0,42 0,20 0,29
Number of suppliers 0,14 0,07 0,09 0,03 0,20 0,11
Substitutability 0,11 0,07 0,26 0,10 0,27 0,16
Category industry capacity constraints 0,11 0,09 0,03 0,03 0,07 0,06
Sum 1,00 1,00 1,00 1,00 1,00 1,00
Supplier Power
Number of
available
suppliers
Degree of
supplier
capabilities/
property
rights
Entry barriers to
new supplier/
new products
Ability to cope with
changes in
the supplier business
environment
Supplier switching
costs
Core competency
of the supplier Percentages
Number of
available suppliers 0,07 0,10 0,03 0,17 0,07 0,05 0,08
Degree of supplier
capabilities/
property rights 0,21 0,29 0,31 0,17 0,44 0,21 0,27
Entry barriers to new
supplier/
new products 0,21 0,10 0,10 0,17 0,11 0,07 0,13
Ability to cope with
changes in
the supplier business
environment 0,02 0,10 0,03 0,06 0,05 0,05 0,05
Supplier switching
costs 0,21 0,14 0,21 0,22 0,22 0,41 0,24
Core competency
of the supplier 0,28 0,29 0,31 0,22 0,11 0,21 0,24
Sum 1,00 1,00 1,00 1,00 1,00 1,00 1,00
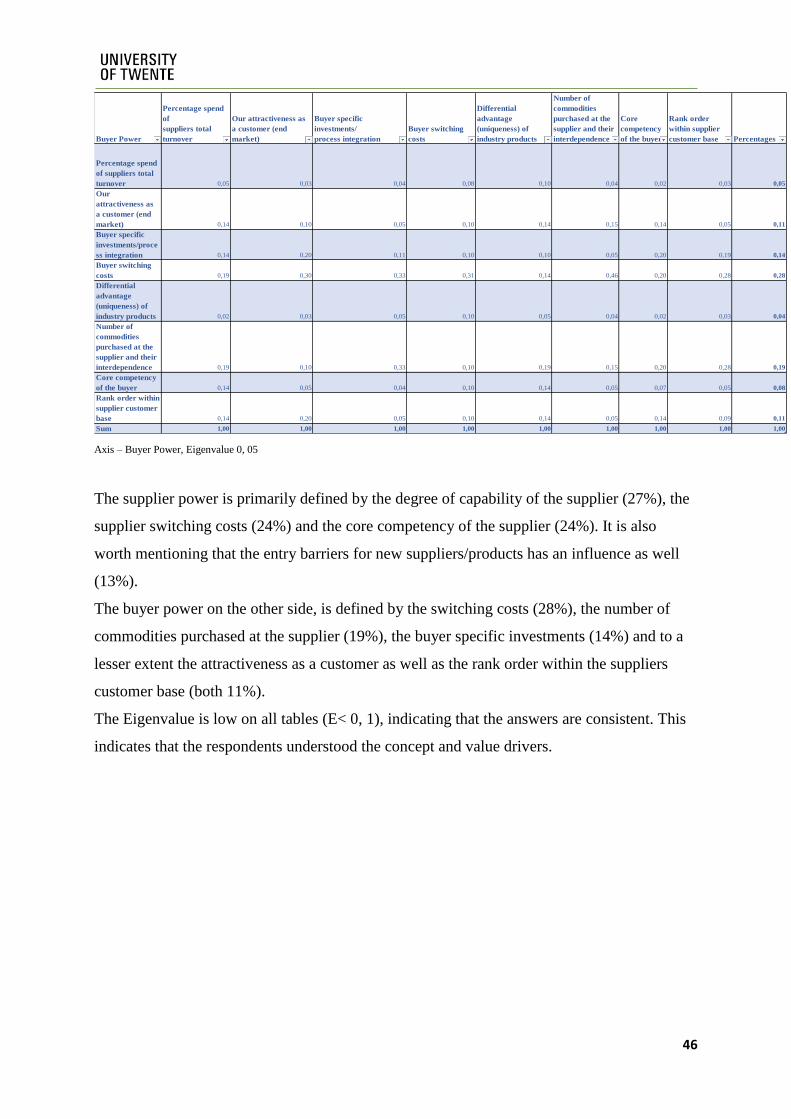
46
Axis – Buyer Power, Eigenvalue 0, 05
The supplier power is primarily defined by the degree of capability of the supplier (27%), the
supplier switching costs (24%) and the core competency of the supplier (24%). It is also
worth mentioning that the entry barriers for new suppliers/products has an influence as well
(13%).
The buyer power on the other side, is defined by the switching costs (28%), the number of
commodities purchased at the supplier (19%), the buyer specific investments (14%) and to a
lesser extent the attractiveness as a customer as well as the rank order within the suppliers
customer base (both 11%).
The Eigenvalue is low on all tables (E< 0, 1), indicating that the answers are consistent. This
indicates that the respondents understood the concept and value drivers.
Buyer Power
Percentage spend
of
suppliers total
turnover
Our attractiveness as
a customer (end
market)
Buyer specific
investments/
process integration
Buyer switching
costs
Differential
advantage
(uniqueness) of
industry products
Number of
commodities
purchased at the
supplier and their
interdependence
Core
competency
of the buyer
Rank order
within supplier
customer base Percentages
Percentage spend
of suppliers total
turnover 0,05 0,03 0,04 0,08 0,10 0,04 0,02 0,03 0,05
Our
attractiveness as
a customer (end
market) 0,14 0,10 0,05 0,10 0,14 0,15 0,14 0,05 0,11
Buyer specific
investments/proce
ss integration 0,14 0,20 0,11 0,10 0,10 0,05 0,20 0,19 0,14
Buyer switching
costs 0,19 0,30 0,33 0,31 0,14 0,46 0,20 0,28 0,28
Differential
advantage
(uniqueness) of
industry products 0,02 0,03 0,05 0,10 0,05 0,04 0,02 0,03 0,04
Number of
commodities
purchased at the
supplier and their
interdependence 0,19 0,10 0,33 0,10 0,19 0,15 0,20 0,28 0,19
Core competency
of the buyer 0,14 0,05 0,04 0,10 0,14 0,05 0,07 0,05 0,08
Rank order within
supplier customer
base 0,14 0,20 0,05 0,10 0,14 0,05 0,14 0,09 0,11
Sum 1,00 1,00 1,00 1,00 1,00 1,00 1,00 1,00 1,00

47
8.1.3 Results
In the next step the category team filled out the questionnaire for the roller brakes. The results
of the questionnaire can be found in the appendix.
After filling out the questionnaire, the first results were obtained and displayed in a matrix.
The results are as follows:
1,00
1,50
2,00
2,50
3,00
3,50
4,00
4,50
5,00
1,00 1,50 2,00 2,50 3,00 3,50 4,00 4,50 5,00
FIN
AN
CIA
L P
ERFO
RM
AN
CE
SUPPLY RISK
Kralijc Matrix
1,00
1,50
2,00
2,50
3,00
3,50
4,00
4,50
5,00
1,00 1,50 2,00 2,50 3,00 3,50 4,00 4,50 5,00
SUP
PLI
ER P
OW
ER
BUYER POWER
Power Matrix

48
When comparing the expectations and the final results it is noticeable that they do not match
up, though they are not too far off. Instead of “Bottleneck” the commodity was rated
“Routine”. This is rather surprising considering that there is only one supplier on the market
and essentially no substitutes. If one takes a closer look at the weights and the rating in the
questionnaire (Appendix) one finds that this is caused by relatively low weights in the
questionnaire in general, especially for profit impact, TCO or exclusivity of use.
The research indicated that the relationship is not defined by “supplier power” but that both
are “interdependent”. Given the situation, this is rather surprising as well. When looking into
the analysis, on the supplier side, the main drivers were entry barriers for new
products/suppliers (13%, 4), degree of supplier capabilities/property rights" (27%, 5), the core
competency of the supplier (24%, 3) and the switching costs (24%, 4) for the supplier. Those
value drivers were expected based on the situation the Accell Group finds itself with
Shimano.
The buyer power was mainly influenced by their attractiveness as a customer (11%, 4), buyer
specific investments/process integration (14%, 5), number of commodities purchased at the
supplier and their interdependence (19%, 5) and the rank order within suppliers customer base
(11%, 4). The question here is whether the situation has been evaluated realistically. It is
questionable whether the market power of the Accell Group is as substantial as assumed.
There are several bicycle assemblers on the market and all need this brake system.
Furthermore, one might question to what extent other products purchased can be used to
create leverage when negotiating the conditions of roller brakes. The high dependency on the
product and the supplier’s awareness of the fact might reverse the effect. The monopolistic
situation on the market seems to have not only a partial influence in the sense that it mitigates
the value drivers. The case can be made that it renders them irrelevant or at least diminishes
their value extensively. From a methodological point of view, it has to be stated that the study
was not conducted in a multi-disciplinary team, but the procurement team. In this case, some
value drivers could have been over- or undervalued.
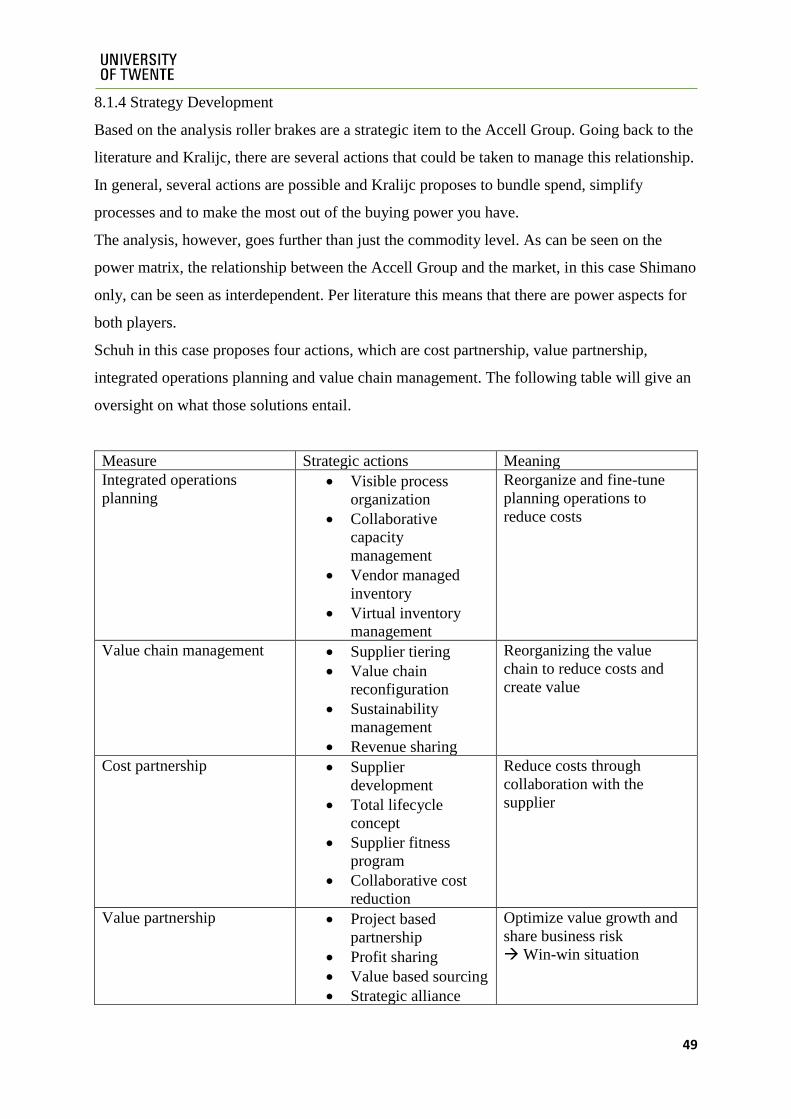
49
8.1.4 Strategy Development
Based on the analysis roller brakes are a strategic item to the Accell Group. Going back to the
literature and Kralijc, there are several actions that could be taken to manage this relationship.
In general, several actions are possible and Kralijc proposes to bundle spend, simplify
processes and to make the most out of the buying power you have.
The analysis, however, goes further than just the commodity level. As can be seen on the
power matrix, the relationship between the Accell Group and the market, in this case Shimano
only, can be seen as interdependent. Per literature this means that there are power aspects for
both players.
Schuh in this case proposes four actions, which are cost partnership, value partnership,
integrated operations planning and value chain management. The following table will give an
oversight on what those solutions entail.
Measure Strategic actions Meaning
Integrated operations
planning • Visible process
organization
• Collaborative
capacity
management
• Vendor managed
inventory
• Virtual inventory
management
Reorganize and fine-tune
planning operations to
reduce costs
Value chain management • Supplier tiering
• Value chain
reconfiguration
• Sustainability
management
• Revenue sharing
Reorganizing the value
chain to reduce costs and
create value
Cost partnership • Supplier
development
• Total lifecycle
concept
• Supplier fitness
program
• Collaborative cost
reduction
Reduce costs through
collaboration with the
supplier
Value partnership • Project based
partnership
• Profit sharing
• Value based sourcing
• Strategic alliance
Optimize value growth and
share business risk
Win-win situation
50
Based on the two matrices several approaches could be followed. The basic idea is to simplify
the relationship in general and to increase buying power by bundling the sourcing process.
From a power perspective, more options come into play. Those options are very different
from what was proposed by Kralijc. As can be seen in the table above, Schuhs model
proposes very different actions. From his perspective, the relevant actions are directed
towards the respective demand and supplier power. Following his work, the proposed
solutions necessitate closer collaboration, for which he proposes many forms. Most of the
proposed solutions feature cost cutting measures. Those costs are found in the different
process interactions being logistics, operative or strategic planning. One solution that might
stand out is to find and/or develop a new supplier, which is described under the point cost
partnership, supplier collaboration. Others are directed towards the development of a new
product with said supplier. This sharply contrasts to what is proposed by Kralijc and I argue
that both perspectives are relevant, but have to be put in perspective. I would argue that
neither perspective provides a perfect analysis of the problem faced by the Accell Group and
if we look closer at the matrices, other conclusions might be drawn. First of all, in the
commodity matrix, the final result does show up in the so called “Routine” quadrant. But
when we compare the distance of the value for “Financial Performance” with the value for
“Supply Risk”, it becomes clear that the latter is the dominant problem as the dot is skewed
towards the bottleneck quadrant. One might even argue that this is a borderline case. If we
look at the case at hand, one might point to the fact that there is only one single supplier in the
market, which has an increases the supply risk. Also, there is no specific substitute on the
market, especially for certain end markets, as I described in the introduction to the case. The
supply risk is not too high as the supplier in question, Shimano, is well organized, rather
reliable, makes information accessible to a certain degree and does provide a good quality
product. Following the line of argumentation, it seems as if the second matrix is the next
logical step to focus on.
As the power matrix shows, the relationship is categorized in the “Interdependence” quadrant.
Again, looking at the matrix, a closer look at the case might provide more information. The
dot, in this case, is skewed in the direction of the “Supplier Power” quadrant. This seems
reasonable, as there is only one supplier on the market, for a product that is demanded on the
end market. The proposed solution of collaborating closer with the supplier, as proposed by
Schuh, might become a problem. Due to the size of Shimano and their unwillingness to
collaborate, this strategy might be unrealistic. However, there is no getting around this

51
situation in the short-term. As is shown in the analysis, the buyer switching costs are very
high, as there is no viable substitute. Combined with the Shimano as the only supplier this
might result in the low supplier switching costs. Everybody needs their product and they have
no competition on the market. This might therefore require a differentiation in the strategy
development between short-term and long-term goals, but neither matrix provide satisfying
answers.
8.1.5 Personal statement
As a final note, I want to give a personal opinion for the development of a possible strategy.
Based on my interviews with the product managers and my knowledge from the industry and
the Accell Group I would suggest to try to establish cost reducing measures where possible.
Those might come with closer collaboration of the several brands and their logistical
alignment or in the form of joint cutting of costs. Due to the unwillingness of Shimano to
cooperate, reducing the number of roller brakes used would be a long-term solution. This
might be achieved by developing substitutes with another supplier. The solution should be
developed with regard to the advantages the roller brake system offers (eg. low unit costs, low
maintenance). Due to the recognition of the roller brakes with the end consumer, Accell
should use their own market power to make clear that a superior product, specified on a bike
by one of their brands, should be enough reason in itself to trust in as a consumer. This would
gradually reduce the market for Shimano and hence the power they have.

52
8.2 Case Study – Tires
8.2.1 Introduction
The market for tires can be described as different compared to the market of either battery
packs or roller brakes. In general, the tire itself is not a very complex product, if one was to
compare it to for example battery packs. Also, the technology is not new as tires have been
essential to the bike industry for a long time. There are a lot of capable suppliers for tires on
the market and the Accell Group has a rather diverse portfolio of different suppliers, mostly
dependent on the segment the tire is sourced for. Also, there is a difference between vertically
between the low, mid and high-end products. For the low end products, there is no brand
recognition. This has to be contrasted sharply with the tires in the high-end sector. The
demand by the end customer is closely related to the professional sport sector and end
customers will demand the brands used by the pro athletes. One example one might give is the
Grand Prix 4000 of Continental used for road racing. Another major selling point of huge
importance in the high end sector is the actual performance of the tire. Factors for
consideration are the actual performance, the weight or the rolling resistance.
For the E-MTB/MTB market, however, there are a few important suppliers, which need to be
mentioned here. Among them are Schwalbe (Bohle GmbH) and Maxxi (Cheng Shin). Within
the high-end to medium range E-MTB and MTB bikes, those two brands also carry brand
recognition with the end consumer. Those brands itself are very capable and willing to work
with us.
Based on the information I derive a few expectations on the positioning for either the
commodity matrix and the power matrix. As mentioned above, tires are a rather simple
product with a lot of suppliers on the market. In general, tires do not count as a major selling
point. For this specific segment, however, it is important to notice that professional sports do
have an influence on the regular end consumer. The reliability of the lead times is going to be
an issue as the tires are sourced from Asia. The supplier, however, do have a strong European
presents and/ or European in general which mitigates the risk. Therefore, I expect the product
to be firmly in the “Leverage” quadrant.
As for the buyer-supplier relationship, both parties have some power. The size of the Accell
Group is attractive for suppliers. Additionally, it has to be noted that brands like the Winora
Group (Haibike) are well-known, high-quality brands within the MTB/E-MTB segment. On
the supplier side again, due to the brand recognition, not every brand can be used, which
limits the flexibility when making sourcing decisions. I expect the power relationship to be

53
rather balanced, which would be “Interdependence”. The, Accell Group, however, does have
a slightly advantageous position, so I expect the relationship be skewed towards the “Buyer
Power” quadrant.
8.2.2 Weighting
To define the positioning of the tires for MTB and E-MTB bikes in the high- to medium
segment, the first step was to weigh the value drivers that have been defined previously for
the Accell Group and to specify them for the case study, hence the roller brakes. In a second
step, the most dominant value drivers are selected. As a cut-off point, 10% was chosen. This
step is considered necessary as a very small percentage will not have much of an influence on
the end results. Therefore, cutting down on the number of value drivers makes the analysis
more practical. The matrixes can be found in the appendix. Afterwards the remaining value
drivers were weighted again. The weighting was done by the respective category team.
The procedure was carried out for both matrixes, the commodity matrix and the power matrix.
You will find the outcome for both matrices below.
Eigenvalue: 0,003, Axis Financial Performance
Eigenvalue: 0, 27, Axis Supply Risk
As displayed in the tables above there are several value drivers, which were rated the most
important when it comes to the specific commodity within the specific segment. Consequently
those value drivers have the biggest outcome on the end result. For “Financial Performance”
those are the profitability impact (42%) of the tire and the total cost of ownership (46%) effect
Financial Performance Profitability impact Total cost of ownership Importance of part to get leverage with supplier Percentage
Profitability impact 0,428571429 0,444444444 0,375 0,42
Total cost of ownership 0,428571429 0,444444444 0,5 0,46
Importance of part to get leverage with supplier 0,142857143 0,111111111 0,125 0,13
Supply Risk Lead time reliability Flexibility Forecasting Specification complexity Category industry capacity complains Percentage
Lead time reliability 0,428571429 0,6 0,333333333 0,37037037 0,461538462 0,44
Flexibility 0,142857143 0,2 0,25 0,296296296 0,369230769 0,25
Forecasting 0,142857143 0,066666667 0,083333333 0,037037037 0,046153846 0,08
Specification complexity 0,142857143 0,066666667 0,166666667 0,074074074 0,030769231 0,10
Category industry capacity complains 0,142857143 0,066666667 0,166666667 0,222222222 0,092307692 0,14

54
they have. For the “Supply Risk” the deciding factors are the lead time reliability (44%) and
the flexibility (25%) of the sourcing process for the product.
Eigenvalue: 0, 08, Axis Supplier Power
Eigenvalue: 0, 02, Axis Buyer Power
The deciding factors for defining the “Supplier Power” are their brand recognition (43%) and
their capability and knowledge of the product (30%). The “Buyer Power” on the other side is
primarily defined by our attractiveness due to our value with the end customer (59%).
The Eigenvalue is low on all tables (E< 0, 1), indicating that the answer were consistent. This
indicates that the respondents understood the concept and value drivers. The one exception to
the rule is the Supply Risk (E=0, 27). This rather high Eigenvalue, indicates that the given
results were inconsistent. In this case, another interview was done with the category team to
discuss the weights. The results, however, seemed to be in line with what the understanding of
the category team so no further changes were made.
Supplier Power Number of available suppliers Brand recognition Compatibility/strategic alignment Entry barriers to new supplier/new products Percentage
Number of available suppliers 0,1 0,153846154 0,069767442 0,066666667 0,10
Brand recognition 0,3 0,461538462 0,558139535 0,4 0,43
Compatibility/strategic alignment 0,3 0,230769231 0,279069767 0,4 0,30
Entry barriers to new supplier/new products 0,3 0,153846154 0,093023256 0,133333333 0,17
Buyer Power Percentage spend of suppliers total turnover Our attractiveness as a customer (end market) Rank order within supplier customer base Percentage
Percentage spend of suppliers total turnover 0,166666667 0,2 0,111111111 0,16
Our attractiveness as a customer (end market) 0,5 0,6 0,666666667 0,59
Rank order within supplier customer base 0,333333333 0,2 0,222222222 0,25

55
8.2.3 Results
In the next step the category team filled out the questionnaire for the tires. The results of the
questionnaire can be found in the appendix.
After filling out the questionnaire, the first results were obtained and displayed in a matrix.
The results are as follows:
1
1,5
2
2,5
3
3,5
4
4,5
5
1 1,5 2 2,5 3 3,5 4 4,5 5
FIN
AN
CIA
L P
ERFO
RM
AN
CE
SUPPLY RISK
Kralijc Matrix
1
1,5
2
2,5
3
3,5
4
4,5
5
1 1,5 2 2,5 3 3,5 4 4,5 5
SUP
PLI
ER P
OW
ER
BUYER POWER
Power Matrix

56
The two matrices above present the end results of the analysis, hence the weightings on the
one hand, and the rating in the questionnaire on the other.
For the commodity matrix it, the tires for the MTB/E-MTB segment were rated in the
“Leverage” items. This what was expected based on the information I received from the
procurement team and the different product managers. If one takes a closer look at the data at
hand, the commodity is rated borderline “Routine”. Especially the financial impact is rather
small on the end product. I expected the financial impact to be higher due to the impact of the
professional sports on the sales. Also, the lead time reliability problems known for this
commodity can have an impact on the total cost of ownership of the end product. The
questionnaire reveals, however, that the profit impact (42%, 2) is rated. When it comes to the
supply risk of the commodity, only the lead time reliability (44%, 4) is rated correspondingly.
The forecasting (25%, 2) and category industry capacity constraints (14%, 2) are not rated as
particularly problematic.
The buyer-supplier structure is rated in the “Buyer Power” quadrant. As has been reiterated in
the introduction, this was not predicted, but mentioned as a possible outcome. If one looks
into the data, the attractiveness of the Accell Group on the end market (59%, 5). The other
value drivers, however, are rated very high as well (both 4 on a 5-point scale). From the
supplier perspective, especially the respective brand recognition can be identified as the main
point of power (43%, 4).
In the following section, I will take a look into what strategic directions are derived from the
literature and how they fit into the case at hand.
8.2.4 Strategy development
The strategy development is based on the two matrices and what the respective scholars
propose as the best strategies to be applied based on the situation.
The leverage quadrant, as proposed by Kralijc, proposes to make the most out of the buying
power. Due to the lower supply risk, which might is probably caused by the access of options
on the market, an aggressive price strategy could be followed. This would require to really
leverage the supplier.
Schuh, from his perspective, proposed strategies based the demand and supply power. A
summary can be found in the table below.

57
Measure Strategic actions Meaning
Tendering Supplier market intelligence
RFI/RFP process
Reverse auctions
Expressive bidding
Use the (global) competition
to leverage your supplier
Globalization Global sourcing
Make or buy
LCC sourcing
Best shoring
Make the market transparent
and use the bidding process
as a driving force to reach
more effective results
Supplier pricing review Price benchmarking
Total cost of ownership
Unbundled prices
Leverage market imbalances
Consistently incorporate
total cost methods into the
calculation of prices
Target pricing Cost based price modelling
Cost regression analysis
Linear performance pricing
Factor cost analysis
Methods to lower costs due
to untransparent cost
structure of the supplier
Due to the (overwhelming) power position the buyer might be in, this power should be
leveraged to reduce the prices. Several measures are proposed to achieve this goal. On the one
hand, competition should be maximized to put pressure on the prices of the independent
supplier. This also includes to improve the transparency of the market to be sourced from and
to gain as much information as possible on what the market offers. On the other hand, the
reduction of costs might be achieved by optimizing the costing approach for the own product
or by understanding the costing approach by the supplier to facilitate cost reductions.
8.2.5 Personal Statement
Again, both approaches are different, yet, not totally independent solutions to the given
situation. The combination of a financially rather unimportant commodity combined with the
power position of the buyer over the supplier, lends itself to leveraging this power to reduce
the price as much as possible. Supply should not be endangered as the supply risk is rather
low. Cost optimization can, therefore be achieved safely, without threating the ultimate goal
of a steady supply. The proposed strategies therefore fit the case at hand well.

58
8.3 Case Study – Battery packs
8.3.1 Introduction
Battery packs are a very crucial commodity for the Accell Group and there are several reasons
for that. First of all, on the commodity level, it is one of the most important parts of the E-
bike. The bike, for years, has been a product where the production was primarily mechanical.
Over the last years, however, electronic parts, like sensors, electronic devices and of course
the motor increased the need for a reliable and capable source of energy. For years, the
dynamo provided this service, but with the introduction of the e-systems, this technology
became irrelevant for that specific purpose due to the limited capacity. The second aspect
related to the product itself is the complexity it adds to the end product. Several aspects can be
referred to here. For one, the use of battery packs and a motor increase the speed of the bike,
which has an influence on the safety of the bike. Also, having an electronic part on the bike is
a security risk itself to a certain extent. If one takes a closer look at the market itself, the E-
bike sector is growing the most and is also assumed to have the most potential. This of course
also increases the importance of the E-bikes for the Accell Group. Being a lead player in the
market is a priority for the Accell Group and its brands. The combination of the importance of
the E-bike sector and the complexity of the product itself also poses a challenge on choosing
the right supplier. First of all, the supplier has to fulfil more requirements. Reliability and
technical know-how become increasingly important. Furthermore, to stay ahead of the
competition in this very important segment requires innovation, which also constitutes a new
requirement for the suppliers.
The supplier market also changed. The battery technology is closely related to the automotive
sector especially. Battery packs for the bike sector are considered more of a by-product of this
much bigger sector. The companies producing these battery packs are therefore bigger in
general. Also, producing battery packs for the bike sector is, very likely, not their core
competency. From a power perspective, this complicates matters for the Accell Group. It
should also be mentioned that there are not too many supplier of battery packs on the market.
The cells, which are necessary for battery packs are also produced by basically two suppliers.
This creates dependencies, which are important to consider when evaluating sourcing
decisions.
Based on this description I have several expectations for the results. The commodity itself I
would expect to be in the strategic to bottleneck quadrant. As for the power structure, I would
assume it to be skewed towards the supplier. However, I would not expect Accell to be locked
in completely. The final outcome should be somewhere in the interdependence sector, as the

59
Accell Group does have a certain size and the development of battery packs is not too easy
and usually creates dependencies on the supplier side as well.
8.3.2 Weighting
To define the positioning of the battery packs, the first step was to weigh the value drivers
that have been defined previously for the Accell Group and to specify them for the case study,
hence the roller brakes. In a second step, the most dominant value drivers are selected. As a
cut-off point, 10% was chosen. This step is considered necessary as a very small percentage
will not have much of an influence on the end results. Therefore cutting down on the number
of value drivers makes the analysis more practical. The matrixes can be found in the
appendix. Afterwards the remaining value drivers were weighted again. The weighting was
done by the respective category team.
The procedure was carried out for both matrixes, the commodity matrix and the power matrix.
You will find the outcome for both matrixes below.
Eigenvalue: 0, 02 Axis Financial Performance
Eigenvalue: 0, 07, Axis Supply Risk
When it comes to the main drivers for the financial performance of the battery packs in the
low-end sector these are the Total cost of ownership (37%) and Supplier collaboration (37%).
For the Supply Risk the main drivers are the lack of substitutes (44%) and the issues caused
by the Flexibility of the ordering process (26%). The Eigenvalue for both axis is under the
recommended 0, 1, which assumes the necessary consistency of the answer of the respondent.
Financial Performance Profitability impact Total cost of ownership Innovation Supplier collaboration Percentages
Profitability impact 0,13 0,13 0,22 0,13 0,15
Total Cost of ownership 0,40 0,38 0,33 0,38 0,37
Innovation 0,07 0,13 0,11 0,13 0,11
Supplier collaboration 0,40 0,38 0,33 0,38 0,37
Sum 1,00 1,00 1,00 1,00 1,00
Supply Risk Lead time reliability Flexibility Forecasting Substitutabiulity Percentage
Lead time reliability 0,13 0,13 0,29 0,11 0,16
Flexibility 0,27 0,25 0,29 0,22 0,26
Forecasting 0,07 0,13 0,14 0,22 0,14
Substitutability 0,53 0,50 0,29 0,44 0,44
Sum 1,00 1,00 1,00 1,00 1,00

60
Eigenvalue: 0, 06, Axis Supplier Power
Eigenvalue: 0, 11, Axis Buyer Power
The main driver behind the supplier power of the battery packs are the low supplier switching
costs (44%), the Supplier capability (22%) and the Trust and relationship developed (22%).
The buyer power is defined by the high Buyer switching costs (35%) and the fact that the E-
bike are an important segment of the Accell Group (33%). The Eigenvalue for the supplier
power indicated consistent results. The results for the buyer power are slightly more
inconsistent. The difference, however, is not concerning as the value is just slightly above the
recommended threshold (0.106). The Eigenvalue is low on all tables (E< 0, 1), indicating that
the answers were consistent. This indicates that the respondents understood the concept and
value drivers.
Supplier Power Degree of supplier capabilities/property rights Supplier switching costs Core competency of the supplier Trust and relationship developed Percentage
Degree of supplier capabilities/property rights 0,22 0,20 0,36 0,17 0,24
Supplier switching costs 0,44 0,40 0,36 0,33 0,39
Core competency of the supplier 0,11 0,20 0,18 0,33 0,21
Trust and relationship developed 0,22 0,20 0,09 0,17 0,17
Sum 1,00 1,00 1,00 1,00 1,00
Buyer Power Our attractiveness as a customer Buyer switching costs Trust and degree of relationship developed Core competency of the buyer Percentage
Our attractiveness as a customer 0,19 0,35 0,30 0,09 0,23
Buyer switching costs 0,19 0,35 0,30 0,55 0,35
Trust and degree of relationship developed 0,06 0,12 0,10 0,09 0,09
Core competency of the buyer 0,56 0,18 0,30 0,27 0,33
Sum 1,00 1,00 1,00 1,00 1,00

61
8.3.3 Results
In the next step the category team filled out the questionnaire for battery packs. The results of
the questionnaire can be found in the appendix.
After filling out the questionnaire, the first results were obtained and displayed in a matrix.
The results are as follows:
1
1,5
2
2,5
3
3,5
4
4,5
5
1 1,5 2 2,5 3 3,5 4 4,5 5
FIN
AN
CIA
L P
ERFO
RM
AN
CE
SUPPLY RISK
Kralijc Matrix
1
1,5
2
2,5
3
3,5
4
4,5
5
1 1,5 2 2,5 3 3,5 4 4,5 5
SUP
PLI
ER P
OW
ER
BUYER POWER
Power Matrix

62
As can be seen, the battery packs were assigned to the “Strategic” quadrant. The expectation
was that they would be rated a bottleneck product instead, the financial impact was apparently
rated higher than originally expected. As for the buyer-supplier power structure, the
relationship is evaluated to be “Interdependent”, slightly skewed towards the supplier. As the
expectations for the rating of the commodity was out a little broader, both results meet the
expectation to an extent.
If we take a look at the data, especially the Total cost of ownership (37%, 5) and the
necessary supplier collaboration (37%, 3) were the main drivers behind the impact on the
financial performance of the battery packs for the low-end sector. This comes as no surprise,
as the collaboration becomes the more important the higher the complexity of the products
involved. The introduction of the battery system really made a huge impact on that factor.
From a TCO perspective, demand planning is rather difficult and the battery packs tie up a lot
of assets. Also, due to the short development and introduction cycles of electronic goods and
the yearly seasons of the bike as well as the inflexibility of the Accell Group to react to the
market within the model year, increase the likelihood of obsolete stocks. The supply risk was
mainly driven by two value drivers. First of all, the lack of substitutes (44%, 5) and the
problems cause in the reordering process, hence flexibility, (26%, 4). The first point is
problematic, as other components have to be adjusted to the battery packs used. It is almost
impossible to change the battery system and/or supplier once the BOM (Bill of Material) has
been set. Another issue is that some supplier, only sell whole system. If Accell would want to
change parts of this system, eg. the battery, the supplier would not give warranty on the
system. For the flexibility, the main problem is caused by the lead times and the
manufacturing process of the battery packs, which makes the commodity complex to source.
The supplier power can be derived, to an extent, from the commodity itself. The main driver,
were the low supplier switching costs (21%, 5). The systems are produced as a whole by the
supplier, usually the rest of the bike is adjusted to the system used. This gives the supplier a
lot of power, as the buyer is unable to change parts of the system. Another driving force
behind the power of the supplier can be derived from the complexity of the product. Due to
increasing complexity, capable suppliers (21%, 5) are very powerful as trusting them is key
when specifying the BOM (Bill of Material). Due to the long lead times, the BOM has to be
made very early in the process and often times, there is little time to test the products.
Therefore, trusting the supplier and assuming that their products are safe, is crucial and a huge

63
problem of the industry. As the market is very important in general, being the market leader in
producing battery packs is a strong selling point for the supplier.
The buyer power, on the other hand, lies in the very beginning of the process. In general, there
are enough supplier once can choose from. The buyer switching costs (35%, 4) are not too
high in the beginning but become very high once the BOM is specified. Finding the right
supplier is a very crucial process. The second value driver for creating buyer power is the
attractiveness on the end market (23%, 4), which is primarily defined by the size of the Accell
Group and the prominence of their brands in the end market.

64
8.3.4 Strategy Development
Several strategic actions are possible, based on the results of the analysis. Kralijc proposes to
accept the situation and to assure supply. An unlikely, though described scenario, is the
development of a strategic relationship with the supplier(s).
Schuhs actions proposed, to manage the buyer-supplier relationship, are very similar and have
already been described in the roller brakes case. Beneath find the table with the actions
proposed.
Measure Strategic actions Meaning
Integrated operations
planning • Visible process
organization
• Collaborative
capacity
management
• Vendor managed
inventory
• Virtual inventory
management
Reorganize and fine-tune
planning operations to
reduce costs
Value chain management • Supplier tiering
• Value chain
reconfiguration
• Sustainability
management
• Revenue sharing
Reorganizing the value
chain to reduce costs and
create value
Cost partnership • Supplier
development
• Total lifecycle
concept
• Supplier fitness
program
• Collaborative cost
reduction
Reduce costs through
collaboration with the
supplier
Value partnership • Project based
partnership
• Profit sharing
• Value based sourcing
• Strategic alliance
Optimize value growth and
share business risk
Win-win situation
In this case, like is the case with the tires for MTB and E-MTB bikes Schuh proposes closer
collaboration, for which there are many forms. Most of the proposed solutions feature cost
cutting measures. Those costs are found in the different process interactions being logistics,
operative or strategic planning. One solution that might stand out is to find and/or develop a

65
new supplier, which is described under the point cost partnership, supplier collaboration.
Others are directed towards the development of a new product with said supplier.
For the battery case, it is important to mention that, especially the low price E-bike sector has
been identified by the Accell Group as a crucial market for the coming years. This means that
they are very much interested in leading the market. Due to the complexity and importance of
the battery for this very specific project, finding the right supplier is crucial. In fact, there are
a lot of capable supplier on the market. Another dimension that has to be taken into account is
that the battery alone is not the only part of the electrical system. Therefore, the battery has to
fit the rest of the system for the bike to work properly. This can be seen as a warranty issue
but also includes warranty issues as some supplier might not be willing to allow combinations
with other products. The proposed solutions fit very well with how the relationship is
structured and what the Accell Group wants to achieve. Due to the growing market,
developing a quality supplier seems to be a good strategy to follow. This might be
incentivized by some of the cost and profit sharing models included in the table above.
8.3.5 Personal Statement
In my opinion, the proposed strategies fit with what the Accell Group should want to achieve,
based on their proposed goals. There are several capable suppliers on the market to work with.
Due to the sensitivity of the product, some brand recognition, might be helpful to satisfy the
end customer, but there are capable suppliers on the market that already carry some brand
recognition from the electronic sector, like Panasonic. Due to the size of the Accell Group
there is enough leverage to find a supplier willing to work on tailored projects that could lead
to exclusivity rights for crucial components. Also, due to recent problems with warranty
issues on specific components, it might be a good idea to bring together several suppliers to
work together on related products in the name of the Accell Group. The Accell Group does
not yet have a Research & Development department on the group level, but on the brand
level, a cooperation between the interested parties and the respective supplier could be
initiated.

66
9 Conclusion
The purpose of this master thesis is to develop a commodity sourcing approach as a basis for
strategic action development. The respective research question
“To what extent can a commodity strategy be developed for the Accell-Group as a whole and
what should it entail?”
has been posed and has been evaluated during the analysis. For answering the research
question, three sub-questions have been developed to separate the main research question and
facilitate the analysis. These sub-questions are
“How can the purchasing portfolio model proposed by Kralijc be applied to the Accell
Group and which measures should it entail?”
“How can the power matrix, proposed by Cox, be applied to the Accell Group and
which measures should it entail?”
“What are the strategies that could be implemented to improve the positioning of the
brands with the suppliers based on the positioning of the commodity and the power
relationship?”
The analysis is based on the knowledge and experience of the established procurement team,
as well as on the knowledge taken from the product managers. From the analysis of the first
research question a model was developed specifically for the needs of the Accell Group.
Based on the interviews with the procurement team, value drivers were developed and defined
for the specific needs of the company. Therefore, the purpose of this master thesis is two-fold.
On the one hand, the question on whether the literature provides a sufficient framework for
developing a framework has to be answered. On the other hand the practicality of the
approach has to be questions, meaning that the development of a theoretical framework, even
one that is tailored to the specific needs of a company. Therefore, the research questions were
answered from a theoretical and a practical point of view.
With respect to the first two sub-questions, it is to be stated that the literature provides a very
broad overview of value drivers in general. During the interviews with the procurement team,
it became apparent, that the understanding of what is actually meant by the different value
drivers, is a crucial point when discussing the importance of the commodity. A value diver is
a measure of one of the axis of a matrix. The high variance of the questionnaire of my

67
analysis can be primarily traced back to a misunderstanding or different understanding of the
proposed value drivers. One example for that was the understanding of the value driver
“Forecasting” in the context of supply risk. In general, forecasting is an important tool to
determine demand. When it comes to forecasting as a supply risk, however, the focus lies on
the difficulty to forecast a specific commodity, due to eg. production uncertainties. This is
different than understanding the importance of forecasting as a necessary tool, which is
always important and necessary. When developing the second matrix, the power matrix,
another important aspect is to clearly distinguish the commodity from the supplier. This is
difficult for several reasons. First of all, every supplier ultimately produces the commodity
that is analyzed. Therefore, respondents tend to associate some of the value drivers with the
commodity instead of the supplier and vice-versa. One can point to the fact, that forecasting a
commodity is a strategic action, and indeed in another sense it is, and would have to be done
with the supplier. However, in the analysis of the supply risk of a commodity, forecasting is
described as the difficulty to forecast a commodity due to the nature of eg. its production
process.
Another problem is caused by the correlation of different value drivers. Again, the separation
is important, even though some of them might have some relation. An example is found in the
analysis of the supplier power. Two value drivers used are the supplier switching costs and
the ability of the supplier to react to changes in the business environment. Whereas the first
focuses on the switching costs with respect to the buyer, the latter is directed towards the rest
of the business environment. One could argue that, as the buyer is part of the business
environment, a low supplier switching cost has a direct effect on the supplier ability to cope
with changes in the business environment. Those two, however, can be different and have to
be separated clearly when analyzing, in this case, the power structure.
From a practical point, the case studies delivered valuable insights into the application of the
developed method. As has been described in the case studies, the expectations that were posed
were mostly met. Also, the Eigenvalue of the tables was consistently low, indicating that the
respondents understood the subject matter. It can be stated therefore that the development of
the framework was successful in evaluating the positioning of the commodities. The same can
be said for assessing the power relationship with the different suppliers.
The last sub-question was directed towards the development of strategic actions. As this is
more of an outcome of the research rather than an evaluation the results have to be taken with
caution. In general, however, it can be concluded that, neither the commodity nor the power
matrix suffice in developing a strategy as the strategic actions of both are likely to be

68
insufficient based on the experiences I made during the internship. The two-fold approach is
therefore the right approach to correctly define the position and derive strategic actions.
Furthermore, going back to the generalizability of the model, it is important to clearly
distinguish between commodities in different segments, eg. race bikes or E-bikes and the
classification of low, mid and high. This is crucial and has to defined beforehand by the
respective experts. There might be overlapping feature between segments, but those have to
be explained as well. To be more specific, commodities might differ per segment and might
therefore be produced differently, might have a different price or are supplied by very
different suppliers. All this has an influence on the positioning in the matrix. An example for
the Accell Group, might be that rims are viewed differently by manufacturers and customers
of MTB bikes than for city bikes. One reason for that is that for MTB bikes, rims have to
fulfil certain performance criteria that are different to those for rims for city bikes.
All in all, it can be stated that the development of a commodity framework based on the
literature is very much feasible. However, it comes with a process that might even be more
important than the final result. Discussing the needs of the respective company is necessary to
correctly evaluate the situation. This discussion should be held with several experts that all
have to have the same understanding of the subject matter. It enhances the understanding of
the sourcing process and forces the experts to discuss, in a team, the situation. As every
situation is unique, the model developed only serves as a guideline, a tool or a platform which
has to be used correctly by the people in charge, to facilitate discussions and reach appropriate
conclusions. Also, as much as the generic model is rather useless to the single company, the
tailored approach cannot necessarily be used for other companies. This is primarily for the
fact that the value drivers are defined specifically for the Accell Group. Every single value
driver is understood in the same way by the teams that participate in the rating of the
commodities. Other companies might understand the same value drivers differently which
would change the analysis as a whole.
The last question was directed towards the strategic actions that can be implemented to
improve the positioning of the commodity and the Accell Group.
When matching the proposed solutions by the literature with the analysis, similar results were
reached. It has to be stated, however, that the literature provides a lot of different solutions,
making it rather likely that they are right. Therefore, it has to be stated that the environment
within which a company operates becomes even more important and proves the point that
neither the commodity nor the power matrix alone is sufficient. Both matrices have to be
combined to find the best possible strategic action. One example worth mentioning is the

69
situation of Shimano in the roller brakes case. From the literature, a collaboration strategy is
advised to assure supply and reduce costs. Here, a short and long-term strategy should be
employed as the proposed strategy leads to an excepted bottleneck situation. This situation
should usually be avoided as it would mean that one is dependent on the actions of another
player on the market. Moreover, the Accell Group dis not on the best of terms with Shimano
and Shimano is also not willing to cooperate. This means that the proposed situation is
theoretically unfavorable and practically impossible. As has been argued before, the
environment a company operates in, is crucial for defining the right strategic action.

70
10 Limitations and suggestions for further research
As the analysis was derived from a very broad literature review, the process of tailoring the
information into a framework for a specific company and in the end a specific purpose,
required certain decision to be made which could have been made differently.
In the very beginning, several models could have been used to base the analysis on. The two
models chosen were based on specific decision. Based on the literature review, the models by
Kralijc and Cox were the most prominent ones, to which most of the other scholars developed
responses rather than new developments. This should not take away anything from the
scholars and their work, but as the models were to be adopted anyway, taking the first models
published for the respective matrix was a reasonable choice. Also the choice for basing the
strategies developed on the model proposed was a conscious decision as he developed a
model in reference to the Cox power matrix and provided the broadest available framework
for strategic actions available. There might also be a conflict in literature about the definition
of the dimension of the different models, especially as some of them include power structure
elements eg. in the supply risk dimension. It is worth mentioning that when taking a closer
look at the different dimensions used, the underlying idea of what they are trying to measure
is relatively equal to what Kralijc and Cox measure respectively. Additionally, the different
value drivers have been defined separately and have been discussed extensively with different
members of the procurement team to assure mutual understanding.
A second point of limitation is the fact that the value drivers chosen might not be mutually
exclusive and an important one might be left out. This problem was dealt with in two ways.
First of all, I conducted an extensive literature study to include as many value drivers as
possible. In a second step, I asked the procurement team to name value drivers not mentioned
in the list provided. This mitigated the risk of missing out on crucial value drivers at this stage
of the process. This analysis should be done more regularly to update the long list of value
drivers according to the changing needs of the Accell Group.
A third limitation is that the model was tested by the category team only. Ideally, it should
include a multidisciplinary team, including product managers, and staff from planning,
marketing, R&D and/or the executive branch. The more experts participate, the more
knowledge is used to correctly evaluate the situation.
Form a model perspective, the step from the long list and short list was chosen as a below
10% cut of value drivers. As has been stated before, this step was necessary to prevent a

71
watering down of value drivers which would overcomplicate the analysis. The cut-off point
can be discussed, but was chosen as a reasonable value to influence the final outcome.
Nevertheless, some value drivers missed the cut by just a small margin. In this case, the
decision was taken between a more complex and a leaner but more limited evaluation and the
second was chosen due to the fact that the goal was to give a more general indication of
direction. The analysis of the case will always allow to bring up special points of interest.
The last point is the fact that the strategic actions are derived from the models, but are not
tested against the value drivers from which they originate. This point can therefore be seen as
a limitation but also as an introduction to future research.
In a next step, the proposed strategic actions should be tested against the value drivers. This
assures that the problems, summarized in the value drivers, are solved by the strategic actions
proposed. As has been mentioned above, an analysis of the value drivers should be done
regularly to update those according to the needs. During the definition of the value drivers, the
respondents were asked to not only evaluate current needs but also take into account possible
future requirements. This, however, should be tested again, especially due to the ongoing
maturation of the procurement department and the organization as a whole over time.

72
11 Bibliography
Bensaou, M. (1999) ‘Portfolios of buyer-supplier relationships’, Sloan Management Review
40 (4), 35-44
Bildsten, L., Rehme, J. and Brege, S. (2010) “Applying the Kralijc Model to the Construction
Sector: The Case of a Prefab Housing Factory”. In: Egbu, C. (Ed)Proces 26th Annual ARCOm
Conference, 6-8, Association of Research in Construction Management, p.1029-1037
Caniels, M.C.J. and Gelderman, C.J. (2005) “Purchasing strategies in the Kralijc matrix – A
power and dependence perspective”, Journal of Purchasing & Supply Management 11, p.141-
155
Cooper C., Ellram, L.M. (1993) “Characteristics of Supply Chain Mangement and the
Implications for Purchasing Logstics Strategy”, The International Journal of Logistics
Management, Vol. 4, Issure 2, p..13-24
Cox, A. (1996) “Relational competence and strategic procurement management: Towards an
entrepreneurial and contractual theory”, European Journal of Purchasing & Supply
Management, Vol.2, No.1, pp.57-70
Cox, A., Sanderson, J. and Watson, G. (2001)”Supply Chains and Power Regimes: Toward an
Analytical Framework for Managing Extended Networks of Buyer and Supplier
Relationships”, The JHournal of Supply Chain Management: A Global Review of Purchasing
and Supply, p.28-35
Cox, A. (2001) “Managing with Power: Strategies for Improving Value Appropriation from
Supply Relationships”, The Journal of Supply Chain Mangement, Spring 2001
Cox, A., Lonsdale, C., Sanderson, J. and Watson, G. (2003) “Supply Chain Management: A
Guid e to Bes t P rac t i c e” , Lond on : F in an c ia l T imes /P r en t i ce Ha l l , p . 54 ,
Cox, A. (2004) “The art of the possible: relationship management in power regimes and
supply chains”, Supply Chain Management: An International Journal, Vol.9, Issue 5, pp.346-
356
Cox, A. (2010), “Beyond Kralijc”, iiAPS White Paper 10/1,
Cox, A. (2010) “The Problem with Win-Win”, White Paper 10/3
Cox A. (2010) “Effective Buying: The hidden costs of purchasing”, White Paper 10/4

73
Day, m., Magnan, G.M., and Moeller, M.M. (2010), “Evaluating the bases of supplier
segmentation: A review and taxonomy”, Industrial Marketing Management 39, pp.625-639
Cox, A. (2010). “The problem with Win-Win””, iiAPS White Paper 10/3
Cox, A. (2012) “The QV Way”, iiAPS White Paper 12/1
Cox, A. (2015). “Sourcing portfolio analysis and power positioning: towards a “paradigm
shift”in category management and strategic sourcing”, Supply Chain Management: An
international Journal, Vol.20, Issue 6, pp.717-736
Cox, A. (2015). “Sourcing portfolio analysis and power positioning: towards a “paradigm
shift”in category management and strategic sourcing”, Supply Chain Management: An
international Journal, Vol.20, Issue 6, pp.717-736
Dubois, A., Pedersen, A. (2002) ‘Why relationships do not fit into purchasing portfolio
models: a comparison between the portfolio and industrial network approaches’, European
Journal of Purchasing & Supply Management 8, 35-42
Enz, M.G. and Lambert, D.M. (2012) “Using cross-functional, cross-firm teams to co-create
value: the role of financial measures”, Industrial Marketing Management 41, p.495-507
Folk, N. (2013) ‘A Purchasing Portfolio approach to Supplier Relationship Management at
Volvo Car Group IT’, Department of Technology Management and Economics Division of
Industrial Marketing, CHALMERS UNIVERSITY OF TECHNOLOGY Gothenburg,
Sweden, 2013 Report No. E2013:110
Gelderman, C.J., and van Weele, A.J. (2002), Strategic Direction through Purchasing
Portfolio Management: A Case Study’, The Journal of Supply Chain Management, Volume
38, Issue 1, pp. 30–37
Gelderman, C.J. and van Weele, A.J. (2003) “Handling measurement and strategic directions
in Kralijcs purchasing portfolio model”, Journal of Purchasing & Supply Management 9,
p.207-216
Gelderman, C.J., and van Weele, A.J. (2005), ”Purchasing Portfolio Models: A Critique and
Update”, The Journal of Supply Chain Management, Summer 2005
Gelderman, C.J., Semijn, J., (2006) ‘Managing the global supply base through purchasing
portfolio management’, Journal of Purchasing & Supply Management, 12, pp. 209-217
74
Gillham, B., 2010. Case Study Research Methods. London: Continuum International
Publishing
Hughes, J., Wadd, J. and Webb, M. (2010) “Value Delivered by Strategic Supplier
Relationship Management in Major Organizations”, Future Purchasing
Iplf (2016) Business Relationship Management: The Four Faces of Building Value with
Strategic Suppliers”, The International Procurement and Leadership Forum. P1-24
Kralijc, P. (1983) ‘Purchasing Must Become Supply Management’, Havard Business Review,
No. 83509
Kralijc, P. (1983) ‘Purchasing Must Become Supply Management’, Havard Business Review,
No. 83509, figure 2 Retrieved from:
https://www.google.nl/search?q=kraljic+matrix&biw=1920&bih=971&source=lnms&tbm=is
ch&sa=X&ved=0ahUKEwjWvsj1pNXPAhXGvBoKHeicAGcQ_AUIBigB#imgrc=43Ab9_6
Olb-StM%3A, on 12.10.2016
Krause, D. and Ellram, L.M. (1997) “Critical elements of supplier development”, Euopean
Journal of Purchasing & Supply Management, Vol. 3, No.1, pp.21-31
Lambert, D., Garcia-Dastugue, S.J. and Croxton, K.L. (2005) “An Evaluation of Process-
oriented Supply Chain Management Frameworks”, Journal of Business Logistics, Vol.26,
No.1, pp.25-51
Lambert, D. and Schwieterman, “M. A. (2012), “Supplier relationship management as a
macro business process”, Supply Chain Management: An International Journal 17/3, 337-352
Leppelt, T. et. al. (2013) “Sustainability management beyond organizational boundaries –
sustainable supplier relationship management in the chemical industry”, Journal of Cleaner
Production 56, pp. 94-102
Luzzini, D., Caniato, F., Ronchi, S. and Spina, G. (2012) ‘A transaction costs approach to
purchasing portfolio management’, International Journal of Operations & Production
Management Vol. 32, Issue 9, pp. 1015-1042
Olsen, R.F., Ellram, L.M. (1997) ‘A portfolio Approach to Supplier Relationships’, Industrial
Marketing Management 26, pp. 101-113

75
Padhi, S. S., Wagner, S. M. and Aggarwal, V. (2011) ‘Positioning, of commodities using
Kralijc Portfolio Matrix’, Journal of Purchasing & Supply Management, 18, pp. 1-8
PWC (2015) “Supply Chain Target Operating Model”, Accell Group, November 2015, p.1-
228
Ramsey, J. (1994) “Purchasing Power”, European Journal of Purchasing and Supply
Management, Vol. 1, No.3, pp.125-138
Schuh et. al. (2008) “The Purchasing Chessboard”, Springer-Verlag
Tan, K.C. (2001) “A framework of supply chain management literature”, European Journal of
of Purchasing & Supply Management 7, p.39-48
Van Weele, A.J. (2010) “Purchasing and Supply Management. Analysis, Strategy, Planning
and Practise”. 5th edition

76
12 Appendix
Figure 8 Flowchart Accell

77
Figure(s) 9 Roller brakes
Weightings Longlist
Financial Performance
Supply Risk
Financial Performance Profitability impact
Total cost of ownership Value added by upgrade
Post design
freeze
scope
change
Importance of part to get leverage with
supplier
Environmental
impactExclusivity of use Innovation
Supplier
collaboration
Profitability impact 1,00 0,33 0,50 2,00 1,00 3,00 3,00 3,00 4,00
Total cost of ownership 3,00 1,00 2,00 3,00 3,00 3,00 3,00 3,00 4,00
Value added by upgrade 2,00 0,50 1,00 1,00 0,33 1,00 1,00 1,00 1,00
Post design freeze scope change 0,50 0,33 1,00 1,00 0,50 1,00 1,00 1,00 1,00
Importance of part to get leverage with supplier 1,00 0,33 3,00 2,00 1,00 1,00 1,00 1,00 1,00
Environmental impact 0,33 0,33 1,00 1,00 1,00 1,00 0,50 0,33 1,00
Exclusivity of use 0,33 0,33 1,00 1,00 1,00 2,00 1,00 1,00 1,00
Innovation 0,33 0,33 1,00 1,00 1,00 3,00 1,00 1,00 1,00
Supplier Collaboration 0,25 0,25 1,00 1,00 1,00 1,00 1,00 1,00 1,00
Sum 8,75 3,75 11,50 13,00 9,83 16,00 12,50 12,33 15,00
Financial Perforance Profitability impact
Total cost of ownership Value added by upgrade
Post design
freeze
scope
change
Importance of part to get leverage with
supplier
Environmental
impactExclusivity of use Innovation
Supplier
collaboration
Percentag
e
Value
used
Profitability impact 0,11 0,09 0,04 0,15 0,10 0,19 0,24 0,24 0,27 0,16 0,16
Total cost of ownership 0,34 0,27 0,17 0,23 0,31 0,19 0,24 0,24 0,27 0,25 0,25
Value added by upgrade 0,23 0,13 0,09 0,08 0,03 0,06 0,08 0,08 0,07 0,09 x
Post design freeze scope change 0,06 0,09 0,09 0,08 0,05 0,06 0,08 0,08 0,07 0,07 x
Importance of part to get leverage with supplier 0,11 0,09 0,26 0,15 0,10 0,06 0,08 0,08 0,07 0,11 0,11
Environmental impact 0,04 0,09 0,09 0,08 0,10 0,06 0,04 0,03 0,07 0,07 x
Exclusivity of use 0,04 0,09 0,09 0,08 0,10 0,13 0,08 0,08 0,07 0,08 x
Innovation 0,04 0,09 0,09 0,08 0,10 0,19 0,08 0,08 0,07 0,09 x
Supplier Collaboration 0,03 0,07 0,09 0,08 0,10 0,06 0,08 0,08 0,07 0,07 x
Sum 1,00 1,00 1,00 1,00 1,00 1,00 1,00 1,00 1,00 1,00 1,00
Supply Risk Lead time reliability Flexibility Forecasting Specification complexity
Number
of
suppliers Substitutability
Category
industry
capacity
constraints
Country of origin
Lead time reliability 1,00 1,00 1,00 4,00 4,00 3,00 0,33 4,00
Flexibility 1,00 1,00 1,00 4,00 4,00 4,00 1,00 4,00
Forecasting 1,00 1,00 1,00 3,00 3,00 3,00 4,00 4,00
Specification complexity 0,25 0,25 0,33 1,00 1,00 1,00 0,33 4,00
Number of suppliers 0,25 0,25 0,33 1,00 1,00 1,00 0,33 4,00
Substitutability 0,33 0,25 0,33 1,00 1,00 1,00 1,00 4,00
Category industry capacity constraints 3,00 1,00 0,25 3,00 3,00 1,00 1,00 4,00
Country of origin 0,25 0,25 0,25 0,25 0,25 0,25 0,25 1,00
Sum 7,08 5,00 4,50 17,25 17,25 14,25 8,25 29,00
Supply Risk Lead time reliability Flexibility Forecasting Specification complexity
Number
of
suppliers Substitutability
Category
industry
capacity
constraints
Country of originPercent
ages
Value
used
Lead time reliability 0,141176471 0,2 0,222222222 0,231884058 0,231884058 0,210526316 0,04040404 0,137931034 0,18 0,18
Flexibility 0,141176471 0,2 0,222222222 0,231884058 0,231884058 0,280701754 0,121212121 0,137931034 0,20 0,20
Forecasting 0,141176471 0,2 0,222222222 0,173913043 0,173913043 0,210526316 0,484848485 0,137931034 0,22 0,22
Specification complexity 0,035294118 0,05 0,074074074 0,057971014 0,057971014 0,070175439 0,04040404 0,137931034 0,07 x
Number of suppliers 0,035294118 0,05 0,074074074 0,057971014 0,057971014 0,070175439 0,04040404 0,137931034 0,07 x
Substitutability 0,047058824 0,05 0,074074074 0,057971014 0,057971014 0,070175439 0,121212121 0,137931034 0,08 x
Category industry capacity constraints 0,423529412 0,2 0,055555556 0,173913043 0,173913043 0,070175439 0,121212121 0,137931034 0,17 0,17
Country of origin 0,035294118 0,05 0,055555556 0,014492754 0,014492754 0,01754386 0,03030303 0,034482759 0,03 x
Sum 1 1 1 1 1 1 1 1 1 1
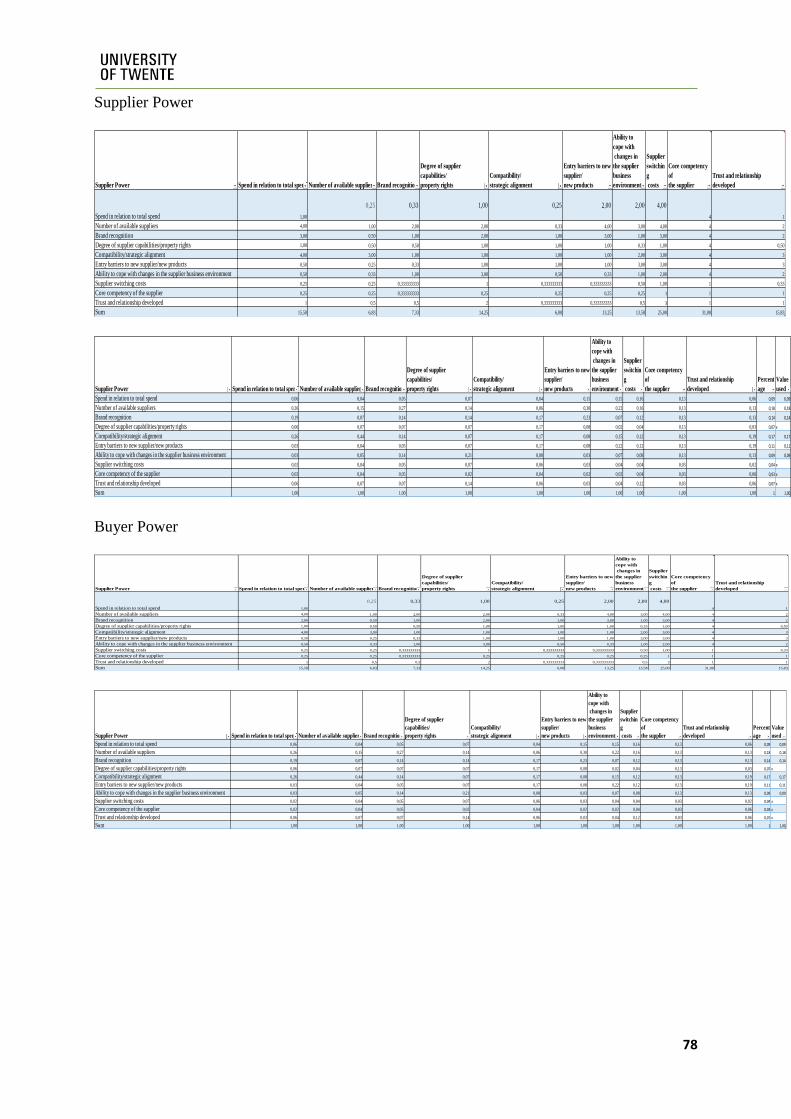
78
Supplier Power
Buyer Power
Supplier Power Spend in relation to total spend Number of available suppliers Brand recognition
Degree of supplier
capabilities/
property rights
Compatibility/
strategic alignment
Entry barriers to new
supplier/
new products
Ability to
cope with
changes in
the supplier
business
environment
Supplier
switchin
g
costs
Core competency
of
the supplier
Trust and relationship
developed
Spend in relation to total spend 1,00
0,25 0,33 1,00 0,25 2,00 2,00 4,00
4 1
Number of available suppliers 4,00 1,00 2,00 2,00 0,33 4,00 3,00 4,00 4 2
Brand recognition 3,00 0,50 1,00 2,00 1,00 3,00 1,00 3,00 4 2
Degree of supplier capabilities/property rights 1,00 0,50 0,50 1,00 1,00 1,00 0,33 1,00 4 0,50
Compatibility/strategic alignment 4,00 3,00 1,00 1,00 1,00 1,00 2,00 3,00 4 3
Entry barriers to new supplier/new products 0,50 0,25 0,33 1,00 1,00 1,00 3,00 3,00 4 3
Ability to cope with changes in the supplier business environment 0,50 0,33 1,00 3,00 0,50 0,33 1,00 2,00 4 2
Supplier switching costs 0,25 0,25 0,333333333 1 0,333333333 0,333333333 0,50 1,00 1 0,33
Core competency of the supplier 0,25 0,25 0,333333333 0,25 0,25 0,25 0,25 1 1 1
Trust and relationship developed 1 0,5 0,5 2 0,333333333 0,333333333 0,5 3 1 1
Sum 15,50 6,83 7,33 14,25 6,00 13,25 13,58 25,00 31,00 15,83
Supplier Power Spend in relation to total spend Number of available suppliers Brand recognition
Degree of supplier
capabilities/
property rights
Compatibility/
strategic alignment
Entry barriers to new
supplier/
new products
Ability to
cope with
changes in
the supplier
business
environment
Supplier
switchin
g
costs
Core competency
of
the supplier
Trust and relationship
developed
Percent
age
Value
used
Spend in relation to total spend 0,06 0,04 0,05 0,07 0,04 0,15 0,15 0,16 0,13 0,06 0,09 0,09
Number of available suppliers 0,26 0,15 0,27 0,14 0,06 0,30 0,22 0,16 0,13 0,13 0,18 0,18
Brand recognition 0,19 0,07 0,14 0,14 0,17 0,23 0,07 0,12 0,13 0,13 0,14 0,14
Degree of supplier capabilities/property rights 0,06 0,07 0,07 0,07 0,17 0,08 0,02 0,04 0,13 0,03 0,07 x
Compatibility/strategic alignment 0,26 0,44 0,14 0,07 0,17 0,08 0,15 0,12 0,13 0,19 0,17 0,17
Entry barriers to new supplier/new products 0,03 0,04 0,05 0,07 0,17 0,08 0,22 0,12 0,13 0,19 0,11 0,11
Ability to cope with changes in the supplier business environment 0,03 0,05 0,14 0,21 0,08 0,03 0,07 0,08 0,13 0,13 0,09 0,09
Supplier switching costs 0,02 0,04 0,05 0,07 0,06 0,03 0,04 0,04 0,03 0,02 0,04 x
Core competency of the supplier 0,02 0,04 0,05 0,02 0,04 0,02 0,02 0,04 0,03 0,06 0,03 x
Trust and relationship developed 0,06 0,07 0,07 0,14 0,06 0,03 0,04 0,12 0,03 0,06 0,07 x
Sum 1,00 1,00 1,00 1,00 1,00 1,00 1,00 1,00 1,00 1,00 1 1,00
Supplier Power Spend in relation to total spend Number of available suppliers Brand recognition
Degree of supplier
capabilities/
property rights
Compatibility/
strategic alignment
Entry barriers to new
supplier/
new products
Ability to
cope with
changes in
the supplier
business
environment
Supplier
switchin
g
costs
Core competency
of
the supplier
Trust and relationship
developed
Spend in relation to total spend 1,00
0,25 0,33 1,00 0,25 2,00 2,00 4,00
4 1
Number of available suppliers 4,00 1,00 2,00 2,00 0,33 4,00 3,00 4,00 4 2
Brand recognition 3,00 0,50 1,00 2,00 1,00 3,00 1,00 3,00 4 2
Degree of supplier capabilities/property rights 1,00 0,50 0,50 1,00 1,00 1,00 0,33 1,00 4 0,50
Compatibility/strategic alignment 4,00 3,00 1,00 1,00 1,00 1,00 2,00 3,00 4 3
Entry barriers to new supplier/new products 0,50 0,25 0,33 1,00 1,00 1,00 3,00 3,00 4 3
Ability to cope with changes in the supplier business environment 0,50 0,33 1,00 3,00 0,50 0,33 1,00 2,00 4 2
Supplier switching costs 0,25 0,25 0,333333333 1 0,333333333 0,333333333 0,50 1,00 1 0,33
Core competency of the supplier 0,25 0,25 0,333333333 0,25 0,25 0,25 0,25 1 1 1
Trust and relationship developed 1 0,5 0,5 2 0,333333333 0,333333333 0,5 3 1 1
Sum 15,50 6,83 7,33 14,25 6,00 13,25 13,58 25,00 31,00 15,83
Supplier Power Spend in relation to total spend Number of available suppliers Brand recognition
Degree of supplier
capabilities/
property rights
Compatibility/
strategic alignment
Entry barriers to new
supplier/
new products
Ability to
cope with
changes in
the supplier
business
environment
Supplier
switchin
g
costs
Core competency
of
the supplier
Trust and relationship
developed
Percent
age
Value
used
Spend in relation to total spend 0,06 0,04 0,05 0,07 0,04 0,15 0,15 0,16 0,13 0,06 0,09 0,09
Number of available suppliers 0,26 0,15 0,27 0,14 0,06 0,30 0,22 0,16 0,13 0,13 0,18 0,18
Brand recognition 0,19 0,07 0,14 0,14 0,17 0,23 0,07 0,12 0,13 0,13 0,14 0,14
Degree of supplier capabilities/property rights 0,06 0,07 0,07 0,07 0,17 0,08 0,02 0,04 0,13 0,03 0,07 x
Compatibility/strategic alignment 0,26 0,44 0,14 0,07 0,17 0,08 0,15 0,12 0,13 0,19 0,17 0,17
Entry barriers to new supplier/new products 0,03 0,04 0,05 0,07 0,17 0,08 0,22 0,12 0,13 0,19 0,11 0,11
Ability to cope with changes in the supplier business environment 0,03 0,05 0,14 0,21 0,08 0,03 0,07 0,08 0,13 0,13 0,09 0,09
Supplier switching costs 0,02 0,04 0,05 0,07 0,06 0,03 0,04 0,04 0,03 0,02 0,04 x
Core competency of the supplier 0,02 0,04 0,05 0,02 0,04 0,02 0,02 0,04 0,03 0,06 0,03 x
Trust and relationship developed 0,06 0,07 0,07 0,14 0,06 0,03 0,04 0,12 0,03 0,06 0,07 x
Sum 1,00 1,00 1,00 1,00 1,00 1,00 1,00 1,00 1,00 1,00 1 1,00

79
Figure(s) 10 - Tires
Weighting
Financial Performance
Supply Risk
Financial Performance Profitability impact
Total cost of ownership Value added by upgrade
Post design
freeze
scope
change
Importance of part to get leverage with
supplier
Environmental
impactExclusivity of use Innovation
Supplier
collaboration
Profitability impact 1,00 0,33 0,50 2,00 1,00 3,00 3,00 3,00 4,00
Total cost of ownership 3,00 1,00 2,00 3,00 3,00 3,00 3,00 3,00 4,00
Value added by upgrade 2,00 0,50 1,00 1,00 0,33 1,00 1,00 1,00 1,00
Post design freeze scope change 0,50 0,33 1,00 1,00 0,50 1,00 1,00 1,00 1,00
Importance of part to get leverage with supplier 1,00 0,33 3,00 2,00 1,00 1,00 1,00 1,00 1,00
Environmental impact 0,33 0,33 1,00 1,00 1,00 1,00 0,50 0,33 1,00
Exclusivity of use 0,33 0,33 1,00 1,00 1,00 2,00 1,00 1,00 1,00
Innovation 0,33 0,33 1,00 1,00 1,00 3,00 1,00 1,00 1,00
Supplier Collaboration 0,25 0,25 1,00 1,00 1,00 1,00 1,00 1,00 1,00
Sum 8,75 3,75 11,50 13,00 9,83 16,00 12,50 12,33 15,00
Financial Perforance Profitability impact
Total cost of ownership Value added by upgrade
Post design
freeze
scope
change
Importance of part to get leverage with
supplier
Environmental
impactExclusivity of use Innovation
Supplier
collaboration
Percentag
e
Value
used
Profitability impact 0,11 0,09 0,04 0,15 0,10 0,19 0,24 0,24 0,27 0,16 0,16
Total cost of ownership 0,34 0,27 0,17 0,23 0,31 0,19 0,24 0,24 0,27 0,25 0,25
Value added by upgrade 0,23 0,13 0,09 0,08 0,03 0,06 0,08 0,08 0,07 0,09 x
Post design freeze scope change 0,06 0,09 0,09 0,08 0,05 0,06 0,08 0,08 0,07 0,07 x
Importance of part to get leverage with supplier 0,11 0,09 0,26 0,15 0,10 0,06 0,08 0,08 0,07 0,11 0,11
Environmental impact 0,04 0,09 0,09 0,08 0,10 0,06 0,04 0,03 0,07 0,07 x
Exclusivity of use 0,04 0,09 0,09 0,08 0,10 0,13 0,08 0,08 0,07 0,08 x
Innovation 0,04 0,09 0,09 0,08 0,10 0,19 0,08 0,08 0,07 0,09 x
Supplier Collaboration 0,03 0,07 0,09 0,08 0,10 0,06 0,08 0,08 0,07 0,07 x
Sum 1,00 1,00 1,00 1,00 1,00 1,00 1,00 1,00 1,00 1,00 1,00
Supply Risk Lead time reliability Flexibility Forecasting Specification complexity
Number
of
suppliers Substitutability
Category
industry
capacity
constraints
Country of origin
Lead time reliability 1,00 1,00 1,00 4,00 4,00 3,00 0,33 4,00
Flexibility 1,00 1,00 1,00 4,00 4,00 4,00 1,00 4,00
Forecasting 1,00 1,00 1,00 3,00 3,00 3,00 4,00 4,00
Specification complexity 0,25 0,25 0,33 1,00 1,00 1,00 0,33 4,00
Number of suppliers 0,25 0,25 0,33 1,00 1,00 1,00 0,33 4,00
Substitutability 0,33 0,25 0,33 1,00 1,00 1,00 1,00 4,00
Category industry capacity constraints 3,00 1,00 0,25 3,00 3,00 1,00 1,00 4,00
Country of origin 0,25 0,25 0,25 0,25 0,25 0,25 0,25 1,00
Sum 7,08 5,00 4,50 17,25 17,25 14,25 8,25 29,00
Supply Risk Lead time reliability Flexibility Forecasting Specification complexity
Number
of
suppliers Substitutability
Category
industry
capacity
constraints
Country of originPercent
ages
Value
used
Lead time reliability 0,141176471 0,2 0,222222222 0,231884058 0,231884058 0,210526316 0,04040404 0,137931034 0,18 0,18
Flexibility 0,141176471 0,2 0,222222222 0,231884058 0,231884058 0,280701754 0,121212121 0,137931034 0,20 0,20
Forecasting 0,141176471 0,2 0,222222222 0,173913043 0,173913043 0,210526316 0,484848485 0,137931034 0,22 0,22
Specification complexity 0,035294118 0,05 0,074074074 0,057971014 0,057971014 0,070175439 0,04040404 0,137931034 0,07 x
Number of suppliers 0,035294118 0,05 0,074074074 0,057971014 0,057971014 0,070175439 0,04040404 0,137931034 0,07 x
Substitutability 0,047058824 0,05 0,074074074 0,057971014 0,057971014 0,070175439 0,121212121 0,137931034 0,08 x
Category industry capacity constraints 0,423529412 0,2 0,055555556 0,173913043 0,173913043 0,070175439 0,121212121 0,137931034 0,17 0,17
Country of origin 0,035294118 0,05 0,055555556 0,014492754 0,014492754 0,01754386 0,03030303 0,034482759 0,03 x
Sum 1 1 1 1 1 1 1 1 1 1
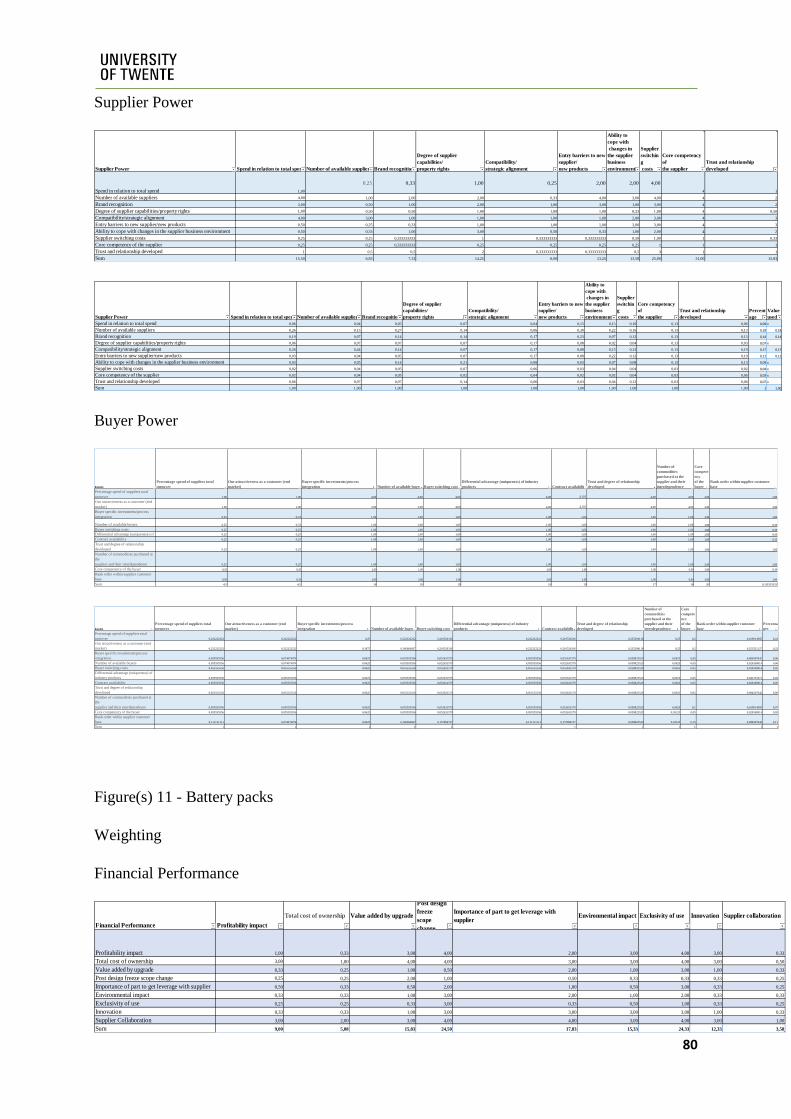
80
Supplier Power
Buyer Power
Figure(s) 11 - Battery packs
Weighting
Financial Performance
Supplier Power Spend in relation to total spend Number of available suppliers Brand recognition
Degree of supplier
capabilities/
property rights
Compatibility/
strategic alignment
Entry barriers to new
supplier/
new products
Ability to
cope with
changes in
the supplier
business
environment
Supplier
switchin
g
costs
Core competency
of
the supplier
Trust and relationship
developed
Spend in relation to total spend 1,00
0,25 0,33 1,00 0,25 2,00 2,00 4,00
4 1
Number of available suppliers 4,00 1,00 2,00 2,00 0,33 4,00 3,00 4,00 4 2
Brand recognition 3,00 0,50 1,00 2,00 1,00 3,00 1,00 3,00 4 2
Degree of supplier capabilities/property rights 1,00 0,50 0,50 1,00 1,00 1,00 0,33 1,00 4 0,50
Compatibility/strategic alignment 4,00 3,00 1,00 1,00 1,00 1,00 2,00 3,00 4 3
Entry barriers to new supplier/new products 0,50 0,25 0,33 1,00 1,00 1,00 3,00 3,00 4 3
Ability to cope with changes in the supplier business environment 0,50 0,33 1,00 3,00 0,50 0,33 1,00 2,00 4 2
Supplier switching costs 0,25 0,25 0,333333333 1 0,333333333 0,333333333 0,50 1,00 1 0,33
Core competency of the supplier 0,25 0,25 0,333333333 0,25 0,25 0,25 0,25 1 1 1
Trust and relationship developed 1 0,5 0,5 2 0,333333333 0,333333333 0,5 3 1 1
Sum 15,50 6,83 7,33 14,25 6,00 13,25 13,58 25,00 31,00 15,83
Supplier Power Spend in relation to total spend Number of available suppliers Brand recognition
Degree of supplier
capabilities/
property rights
Compatibility/
strategic alignment
Entry barriers to new
supplier/
new products
Ability to
cope with
changes in
the supplier
business
environment
Supplier
switchin
g
costs
Core competency
of
the supplier
Trust and relationship
developed
Percent
age
Value
used
Spend in relation to total spend 0,06 0,04 0,05 0,07 0,04 0,15 0,15 0,16 0,13 0,06 0,09 x
Number of available suppliers 0,26 0,15 0,27 0,14 0,06 0,30 0,22 0,16 0,13 0,13 0,18 0,18
Brand recognition 0,19 0,07 0,14 0,14 0,17 0,23 0,07 0,12 0,13 0,13 0,14 0,14
Degree of supplier capabilities/property rights 0,06 0,07 0,07 0,07 0,17 0,08 0,02 0,04 0,13 0,03 0,07 x
Compatibility/strategic alignment 0,26 0,44 0,14 0,07 0,17 0,08 0,15 0,12 0,13 0,19 0,17 0,17
Entry barriers to new supplier/new products 0,03 0,04 0,05 0,07 0,17 0,08 0,22 0,12 0,13 0,19 0,11 0,11
Ability to cope with changes in the supplier business environment 0,03 0,05 0,14 0,21 0,08 0,03 0,07 0,08 0,13 0,13 0,09 x
Supplier switching costs 0,02 0,04 0,05 0,07 0,06 0,03 0,04 0,04 0,03 0,02 0,04 x
Core competency of the supplier 0,02 0,04 0,05 0,02 0,04 0,02 0,02 0,04 0,03 0,06 0,03 x
Trust and relationship developed 0,06 0,07 0,07 0,14 0,06 0,03 0,04 0,12 0,03 0,06 0,07 x
Sum 1,00 1,00 1,00 1,00 1,00 1,00 1,00 1,00 1,00 1,00 1 1,00
Kolom1
Percentage spend of suppliers total
turnover
Our attractiveness as a customer (end
market)
Buyer specific investments/process
integration Number of available buyers Buyer switching costs
Differential advantage (uniqueness) of industry
products Contract availability
Trust and degree of relationship
developed
Number of
commodities
purchased at the
supplier and their
interdependence
Core
compete
ncy
of the
buyer
Rank order within supplier customer
base
Percentage spend of suppliers total
turnover 1,00 1,00 4,00 4,00 4,00 4,00 4,00 4,00 4,00 4,00 2,00
Our attractiveness as a customer (end
market) 1,00 1,00 3,00 3,00 4,00 4,00 4,00 4,00 4,00 4,00 3,00
Buyer specific investments/process
integration 0,25 0,33 1,00 1,00 1,00 1,00 1,00 1,00 1,00 1,00 1,00
Number of available buyers 0,25 0,33 1,00 1,00 1,00 1,00 1,00 1,00 1,00 1,00 0,33
Buyer switching costs 0,25 0,25 1,00 1,00 1,00 1,00 1,00 1,00 1,00 1,00 0,33
Differential advantage (uniqueness) of 0,25 0,25 1,00 1,00 1,00 1,00 1,00 1,00 1,00 1,00 0,50
Contract availability 0,25 0,25 1,00 1,00 1,00 1,00 1,00 1,00 1,00 1,00 0,33
Trust and degree of relationship
developed 0,25 0,25 1,00 1,00 1,00 1,00 1,00 1,00 1,00 1,00 1,00
Number of commodities purchased at
the
supplier and their interdependence 0,25 0,25 1,00 1,00 1,00 1,00 1,00 1,00 1,00 2,00 2,00
Core competency of the buyer 0,25 0,25 1,00 1,00 1,00 1,00 1,00 1,00 0,50 1,00 0,33
Rank order within supplier customer
base 0,50 0,33 1,00 3,00 3,00 2,00 3,00 1,00 0,50 3,00 1,00
Sum 4,5 4,5 16 18 19 18 19 17 16 20 11,83333333
Kolom1
Percentage spend of suppliers total
turnover
Our attractiveness as a customer (end
market)
Buyer specific investments/process
integration Number of available buyers Buyer switching costs
Differential advantage (uniqueness) of industry
products Contract availability
Trust and degree of relationship
developed
Number of
commodities
purchased at the
supplier and their
interdependence
Core
compete
ncy
of the
buyer
Rank order within supplier customer
base
Percenta
ges
Percentage spend of suppliers total
turnover 0,222222222 0,222222222 0,25 0,222222222 0,210526316 0,222222222 0,210526316 0,235294118 0,25 0,2 0,169014085 0,22
Our attractiveness as a customer (end
market) 0,222222222 0,222222222 0,1875 0,166666667 0,210526316 0,222222222 0,210526316 0,235294118 0,25 0,2 0,253521127 0,22
Buyer specific investments/process
integration 0,055555556 0,074074074 0,0625 0,055555556 0,052631579 0,055555556 0,052631579 0,058823529 0,0625 0,05 0,084507042 0,06
Number of available buyers 0,055555556 0,074074074 0,0625 0,055555556 0,052631579 0,055555556 0,052631579 0,058823529 0,0625 0,05 0,028169014 0,06
Buyer switching costs 0,055555556 0,055555556 0,0625 0,055555556 0,052631579 0,055555556 0,052631579 0,058823529 0,0625 0,05 0,028169014 0,05
Differential advantage (uniqueness) of
industry products 0,055555556 0,055555556 0,0625 0,055555556 0,052631579 0,055555556 0,052631579 0,058823529 0,0625 0,05 0,042253521 0,05
Contract availability 0,055555556 0,055555556 0,0625 0,055555556 0,052631579 0,055555556 0,052631579 0,058823529 0,0625 0,05 0,028169014 0,05
Trust and degree of relationship
developed 0,055555556 0,055555556 0,0625 0,055555556 0,052631579 0,055555556 0,052631579 0,058823529 0,0625 0,05 0,084507042 0,06
Number of commodities purchased at
the
supplier and their interdependence 0,055555556 0,055555556 0,0625 0,055555556 0,052631579 0,055555556 0,052631579 0,058823529 0,0625 0,1 0,169014085 0,07
Core competency of the buyer 0,055555556 0,055555556 0,0625 0,055555556 0,052631579 0,055555556 0,052631579 0,058823529 0,03125 0,05 0,028169014 0,05
Rank order within supplier customer
base 0,111111111 0,074074074 0,0625 0,166666667 0,157894737 0,111111111 0,157894737 0,058823529 0,03125 0,15 0,084507042 0,11
Sum 1 1 1 1 1 1 1 1 1 1 1 1
Financial Performance Profitability impact
Total cost of ownership Value added by upgrade
Post design
freeze
scope
change
Importance of part to get leverage with
supplierEnvironmental impact Exclusivity of use Innovation Supplier collaboration
Profitability impact 1,00 0,33 3,00 4,00 2,00 3,00 4,00 3,00 0,33
Total cost of ownership 3,00 1,00 4,00 4,00 3,00 3,00 4,00 3,00 0,50
Value added by upgrade 0,33 0,25 1,00 0,50 2,00 1,00 3,00 1,00 0,33
Post design freeze scope change 0,25 0,25 2,00 1,00 0,50 0,33 0,33 0,33 0,25
Importance of part to get leverage with supplier 0,50 0,33 0,50 2,00 1,00 0,50 3,00 0,33 0,25
Environmental impact 0,33 0,33 1,00 3,00 2,00 1,00 2,00 0,33 0,33
Exclusivity of use 0,25 0,25 0,33 3,00 0,33 0,50 1,00 0,33 0,25
Innovation 0,33 0,33 1,00 3,00 3,00 3,00 3,00 1,00 0,33
Supplier Collaboration 3,00 2,00 3,00 4,00 4,00 3,00 4,00 3,00 1,00
Sum 9,00 5,08 15,83 24,50 17,83 15,33 24,33 12,33 3,58
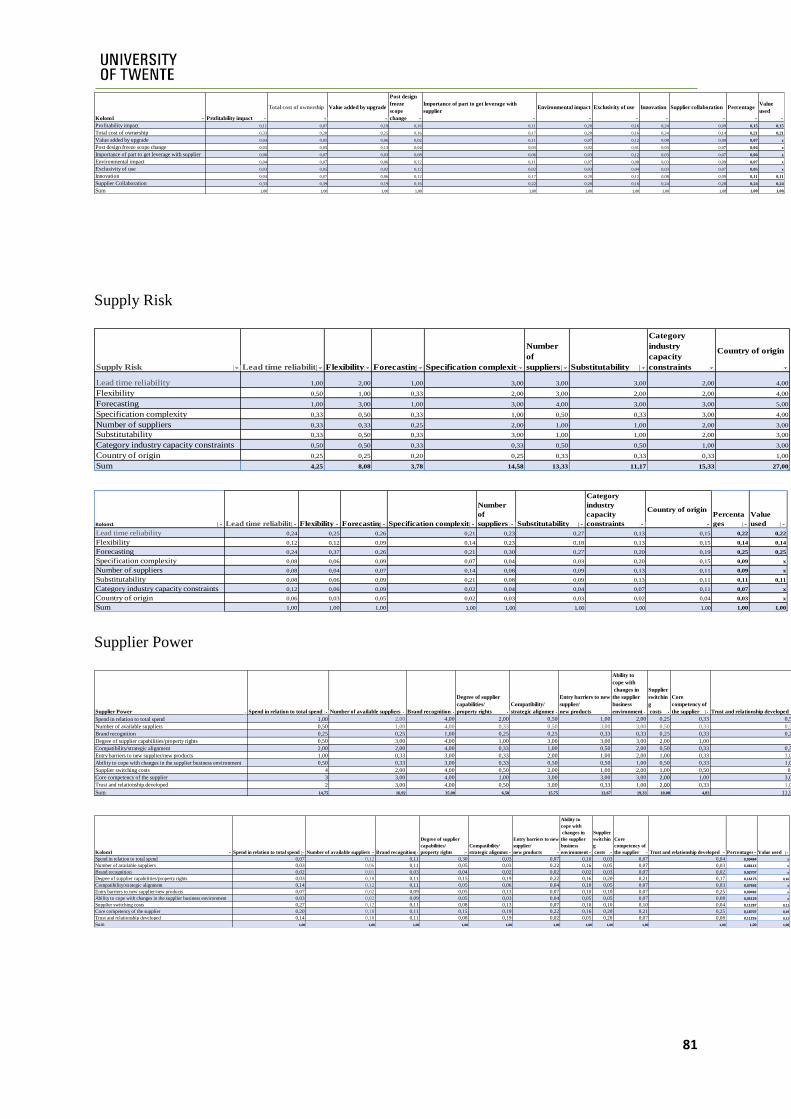
81
Supply Risk
Supplier Power
Kolom1 Profitability impact
Total cost of ownership Value added by upgrade
Post design
freeze
scope
change
Importance of part to get leverage with
supplierEnvironmental impact Exclusivity of use Innovation Supplier collaboration Percentage
Value
used
Profitability impact 0,11 0,07 0,19 0,16 0,11 0,20 0,16 0,24 0,09 0,15 0,15
Total cost of ownership 0,33 0,20 0,25 0,16 0,17 0,20 0,16 0,24 0,14 0,21 0,21
Value added by upgrade 0,04 0,05 0,06 0,02 0,11 0,07 0,12 0,08 0,09 0,07 x
Post design freeze scope change 0,03 0,05 0,13 0,04 0,03 0,02 0,01 0,03 0,07 0,04 x
Importance of part to get leverage with supplier 0,06 0,07 0,03 0,08 0,06 0,03 0,12 0,03 0,07 0,06 x
Environmental impact 0,04 0,07 0,06 0,12 0,11 0,07 0,08 0,03 0,09 0,07 x
Exclusivity of use 0,03 0,05 0,02 0,12 0,02 0,03 0,04 0,03 0,07 0,05 x
Innovation 0,04 0,07 0,06 0,12 0,17 0,20 0,12 0,08 0,09 0,11 0,11
Supplier Collaboration 0,33 0,39 0,19 0,16 0,22 0,20 0,16 0,24 0,28 0,24 0,24
Sum 1,00 1,00 1,00 1,00 1,00 1,00 1,00 1,00 1,00 1,00 1,00
Supply Risk Lead time reliability Flexibility Forecasting Specification complexity
Number
of
suppliers Substitutability
Category
industry
capacity
constraints
Country of origin
Lead time reliability 1,00 2,00 1,00 3,00 3,00 3,00 2,00 4,00
Flexibility 0,50 1,00 0,33 2,00 3,00 2,00 2,00 4,00
Forecasting 1,00 3,00 1,00 3,00 4,00 3,00 3,00 5,00
Specification complexity 0,33 0,50 0,33 1,00 0,50 0,33 3,00 4,00
Number of suppliers 0,33 0,33 0,25 2,00 1,00 1,00 2,00 3,00
Substitutability 0,33 0,50 0,33 3,00 1,00 1,00 2,00 3,00
Category industry capacity constraints 0,50 0,50 0,33 0,33 0,50 0,50 1,00 3,00
Country of origin 0,25 0,25 0,20 0,25 0,33 0,33 0,33 1,00
Sum 4,25 8,08 3,78 14,58 13,33 11,17 15,33 27,00
Kolom1 Lead time reliability Flexibility Forecasting Specification complexity
Number
of
suppliers Substitutability
Category
industry
capacity
constraints
Country of originPercenta
ges
Value
used
Lead time reliability 0,24 0,25 0,26 0,21 0,23 0,27 0,13 0,15 0,22 0,22
Flexibility 0,12 0,12 0,09 0,14 0,23 0,18 0,13 0,15 0,14 0,14
Forecasting 0,24 0,37 0,26 0,21 0,30 0,27 0,20 0,19 0,25 0,25
Specification complexity 0,08 0,06 0,09 0,07 0,04 0,03 0,20 0,15 0,09 x
Number of suppliers 0,08 0,04 0,07 0,14 0,08 0,09 0,13 0,11 0,09 x
Substitutability 0,08 0,06 0,09 0,21 0,08 0,09 0,13 0,11 0,11 0,11
Category industry capacity constraints 0,12 0,06 0,09 0,02 0,04 0,04 0,07 0,11 0,07 x
Country of origin 0,06 0,03 0,05 0,02 0,03 0,03 0,02 0,04 0,03 x
Sum 1,00 1,00 1,00 1,00 1,00 1,00 1,00 1,00 1,00 1,00
Supplier Power Spend in relation to total spend Number of available suppliers Brand recognition
Degree of supplier
capabilities/
property rights
Compatibility/
strategic alignment
Entry barriers to new
supplier/
new products
Ability to
cope with
changes in
the supplier
business
environment
Supplier
switchin
g
costs
Core
competency of
the supplier Trust and relationship developed
Spend in relation to total spend 1,00 2,00 4,00 2,00 0,50 1,00 2,00 0,25 0,33 0,50
Number of available suppliers 0,50 1,00 4,00 0,33 0,50 3,00 3,00 0,50 0,33 0,33
Brand recognition 0,25 0,25 1,00 0,25 0,25 0,33 0,33 0,25 0,33 0,25
Degree of supplier capabilities/property rights 0,50 3,00 4,00 1,00 3,00 3,00 3,00 2,00 1,00 2
Compatibility/strategic alignment 2,00 2,00 4,00 0,33 1,00 0,50 2,00 0,50 0,33 0,33
Entry barriers to new supplier/new products 1,00 0,33 3,00 0,33 2,00 1,00 2,00 1,00 0,33 3,00
Ability to cope with changes in the supplier business environment 0,50 0,33 3,00 0,33 0,50 0,50 1,00 0,50 0,33 1,00
Supplier switching costs 4 2,00 4,00 0,50 2,00 1,00 2,00 1,00 0,50 0,5
Core competency of the supplier 3 3,00 4,00 1,00 3,00 3,00 3,00 2,00 1,00 3,00
Trust and relationship developed 2 3,00 4,00 0,50 3,00 0,33 1,00 2,00 0,33 1,00
Sum 14,75 16,92 35,00 6,58 15,75 13,67 19,33 10,00 4,83 11,92
Kolom1 Spend in relation to total spend Number of available suppliers Brand recognition
Degree of supplier
capabilities/
property rights
Compatibility/
strategic alignment
Entry barriers to new
supplier/
new products
Ability to
cope with
changes in
the supplier
business
environment
Supplier
switchin
g
costs
Core
competency of
the supplier Trust and relationship developed Percentages Value used
Spend in relation to total spend 0,07 0,12 0,11 0,30 0,03 0,07 0,10 0,03 0,07 0,04 0,09484 x
Number of available suppliers 0,03 0,06 0,11 0,05 0,03 0,22 0,16 0,05 0,07 0,03 0,08113 x
Brand recognition 0,02 0,01 0,03 0,04 0,02 0,02 0,02 0,03 0,07 0,02 0,02707 x
Degree of supplier capabilities/property rights 0,03 0,18 0,11 0,15 0,19 0,22 0,16 0,20 0,21 0,17 0,16173 0,16
Compatibility/strategic alignment 0,14 0,12 0,11 0,05 0,06 0,04 0,10 0,05 0,07 0,03 0,07692 x
Entry barriers to new supplier/new products 0,07 0,02 0,09 0,05 0,13 0,07 0,10 0,10 0,07 0,25 0,09482 x
Ability to cope with changes in the supplier business environment 0,03 0,02 0,09 0,05 0,03 0,04 0,05 0,05 0,07 0,08 0,05129 x
Supplier switching costs 0,27 0,12 0,11 0,08 0,13 0,07 0,10 0,10 0,10 0,04 0,11287 0,11
Core competency of the supplier 0,20 0,18 0,11 0,15 0,19 0,22 0,16 0,20 0,21 0,25 0,18707 0,19
Trust and relationship developed 0,14 0,18 0,11 0,08 0,19 0,02 0,05 0,20 0,07 0,08 0,11226 0,11
Sum 1,00 1,00 1,00 1,00 1,00 1,00 1,00 1,00 1,00 1,00 1,00 1,00

82
Buyer Power
Buyer Power Percentage spend of suppliers total turnover Our attractiveness as a customer (end market) Buyer specific investments/process integration Number of available buyers Buyer switching costs Differential advantage (uniqueness) of industry products Contract availability Trust and degree of relationship developed
Number of commodities
purchased at the
supplier and their
interdependence
Core
competency
of the buyer Rank order within supplier customer base
Percentage spend of suppliers total turnover 1,00 0,50 0,50 0,33 0,25 2,00 3,00 0,33 3,00 4,00 0,50
Our attractiveness as a customer (end market) 2,00 1,00 2,00 3,00 1,00 3,00 3,00 1,00 2,00 1,00 2,00
Buyer specific investments/process integration 2,00 0,50 1,00 0,50 0,33 3,00 3,00 1,00 3,00 0,50 3,00
Number of available buyers 3,00 0,33 2,00 1,00 0,33 1,00 2,00 0,33 2,00 0,33 0,33
Buyer switching costs 4,00 1,00 3,00 3,00 1,00 4,00 2,00 1,00 3,00 0,50 3,00
Differential advantage (uniqueness) of industry
products 0,50 0,33 0,33 1,00 0,25 1,00 0,50 0,25 2,00 0,33 0,33
Contract availability 0,33 0,33 0,33 0,50 0,50 2,00 1,00 0,25 3,00 0,50 0,33
Trust and degree of relationship developed 3,00 1,00 1,00 3,00 1,00 4,00 4,00 1,00 4,00 2,00 3,00
Number of commodities purchased at the
supplier and their interdependence 0,33 0,50 0,33 0,50 0,33 0,50 0,33 0,25 1,00 0,33 0,33
Core competency of the buyer 0,25 1,00 2,00 3,00 2,00 3,00 2,00 0,50 3,00 1,00 2,00
Rank order within supplier customer base 2,00 0,50 0,33 3,00 0,33 3,00 3,00 0,33 3,00 0,50 1,00
Summe 18,42 7,00 12,83 18,83 7,33 26,50 23,83 6,25 29,00 11,00 15,83
Kolom1 Percentage spend of suppliers total turnover Our attractiveness as a customer (end market) Buyer specific investments/process integration Number of available buyers Buyer switching costs Differential advantage (uniqueness) of industry products Contract availability Trust and degree of relationship developed
Number of
commodities
purchased at the
supplier and their
interdependence
Core
compete
ncy
of the
buyer Rank order within supplier customer base
Percentag
es Value used
Percentage spend of suppliers total
turnover 0,05 0,07 0,04 0,02 0,03 0,08 0,13 0,05 0,10 0,36 0,03 0,09 x
Our attractiveness as a customer (end
market) 0,11 0,14 0,16 0,16 0,14 0,11 0,13 0,16 0,07 0,09 0,13 0,13 0,13
Buyer specific investments/process
integration 0,11 0,07 0,08 0,03 0,05 0,11 0,13 0,16 0,10 0,05 0,19 0,10 x
Number of available buyers 0,16 0,05 0,16 0,05 0,05 0,04 0,08 0,05 0,07 0,03 0,02 0,07 x
Buyer switching costs 0,22 0,14 0,23 0,16 0,14 0,15 0,08 0,16 0,10 0,05 0,19 0,15 0,15
Differential advantage (uniqueness) of
industry products 0,03 0,05 0,03 0,05 0,03 0,04 0,02 0,04 0,07 0,03 0,02 0,04 x
Contract availability 0,02 0,05 0,03 0,03 0,07 0,08 0,04 0,04 0,10 0,05 0,02 0,05 x
Trust and degree of relationship
developed 0,16 0,14 0,08 0,16 0,14 0,15 0,17 0,16 0,14 0,18 0,19 0,15 0,15
Number of commodities purchased at
the
supplier and their interdependence 0,02 0,07 0,03 0,03 0,05 0,02 0,01 0,04 0,03 0,03 0,02 0,03 x
Core competency of the buyer 0,01 0,14 0,16 0,16 0,27 0,11 0,08 0,08 0,10 0,09 0,13 0,12 0,12
Rank order within supplier customer
base 0,11 0,07 0,03 0,16 0,05 0,11 0,13 0,05 0,10 0,05 0,06 0,08 x
Sum 1,00 1,00 1,00 1,00 1,00 1,00 1,00 1,00 1,00 1,00 1,00 1,00 1,00

83
Questionnaires
Roller brakes
Commodity matrix
Scale 1 2 3 4 5
To what extend do roller brakes
influence the price of the bikes?
X
To what extend do roller brakes cause
costs from a TCO point of view?
X
To what extent do roller brakes create
leverage with the suppliers?
X
To what extent does an exclusivity
clause currently have an influence as a
selling point?
X
To what extend does an innovation
increase sales?
X
To what extend is supplier
collaboration necessary to reduce
costs?
X
Scale 1 2 3 4 5
To what extend is the lead time
reliability a problem in the industry?
X
To what extend is it difficult to
forecast required supply of
commodity?
X
To what extend does the limited
number of suppliers cause supply
risks?
X
To what extend is this commodity
easily substitutable on the market?
X

84
To what extend is the industry of the
market subject to capacity constraints?
X
Power Matrix
Scale 1 2 3 4 5
How does the capability of the supplier
influence his power in the market for roller
brakes?
X
Is there a lack of capable suppliers on the
market?
X
Is it difficult to introduce a new
products/supplier to the roller brake market?
X
Is the supplier rather independent of buyers
when producing (developing) the commodity?
X
Is the supplier able to cope with unexpected
changes in the business environment? (e.g.
demand changes)
X
Does the supplier have several products and/or
business lines which contribute to his financial
end results?
X
Scale 1 2 3 4 5
Do we buy a substantial part of the suppliers
total turnover?
X
Is our sourcing process independent of the
suppliers manufacturing process? (joined
development etc.)
X
Can we easily source this product from another
supplier?
X
Are the products sourced by the supplier part
of segments considered unimportant (financial
X

85
result) for the Accell Group compared to other
segments? (eg. E-bike sector vs City bikes)
To what extend do we source several products
from this supplier?
X
Do we hold a top position (volume) within the
suppliers customer base?
X
How attractive are we due to our size on the
end market?
X
Are we considered a trustworthy buyer with
the supplier?
X
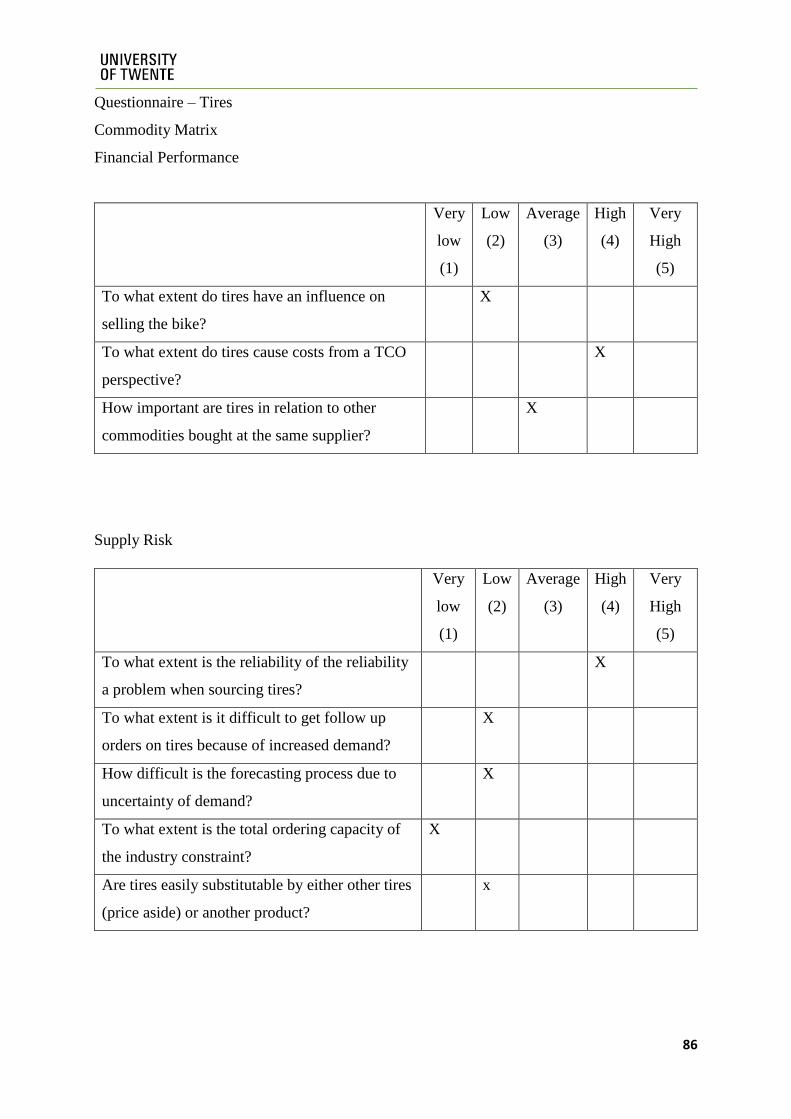
86
Questionnaire – Tires
Commodity Matrix
Financial Performance
Very
low
(1)
Low
(2)
Average
(3)
High
(4)
Very
High
(5)
To what extent do tires have an influence on
selling the bike?
X
To what extent do tires cause costs from a TCO
perspective?
X
How important are tires in relation to other
commodities bought at the same supplier?
X
Supply Risk
Very
low
(1)
Low
(2)
Average
(3)
High
(4)
Very
High
(5)
To what extent is the reliability of the reliability
a problem when sourcing tires?
X
To what extent is it difficult to get follow up
orders on tires because of increased demand?
X
How difficult is the forecasting process due to
uncertainty of demand?
X
To what extent is the total ordering capacity of
the industry constraint?
X
Are tires easily substitutable by either other tires
(price aside) or another product?
x
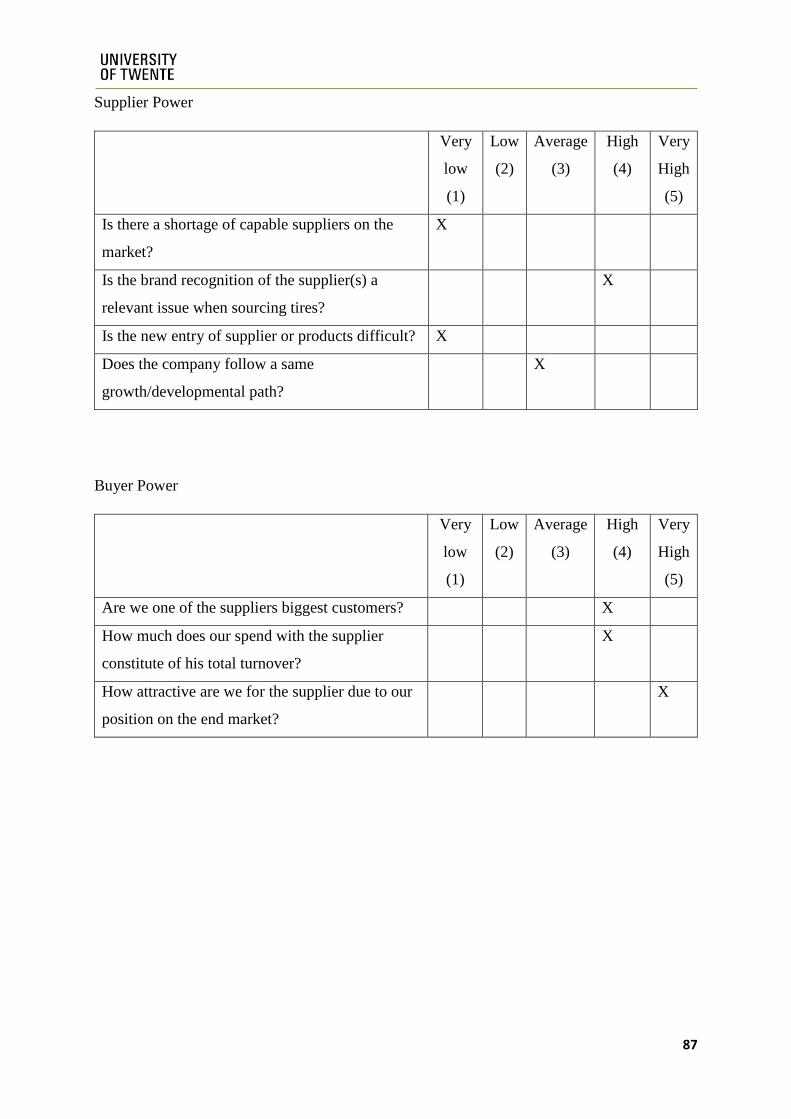
87
Supplier Power
Very
low
(1)
Low
(2)
Average
(3)
High
(4)
Very
High
(5)
Is there a shortage of capable suppliers on the
market?
X
Is the brand recognition of the supplier(s) a
relevant issue when sourcing tires?
X
Is the new entry of supplier or products difficult? X
Does the company follow a same
growth/developmental path?
X
Buyer Power
Very
low
(1)
Low
(2)
Average
(3)
High
(4)
Very
High
(5)
Are we one of the suppliers biggest customers? X
How much does our spend with the supplier
constitute of his total turnover?
X
How attractive are we for the supplier due to our
position on the end market?
X

88
Questionnaire – Battery packs
Commodity Matrix
Financial Performance
Very
low
(1)
Low
(2)
Average
(3)
High
(4)
Very
high
(5)
To what extent do battery packs influence the sales
price of the bike?
X
To what extent do battery packs cause costs from a
TCO point of view?
X
To what extent do environmental regulations
connected to battery packs have an influence on the
costs of the bike?
X
To what extent would an innovation of the battery
increase sales?
X
To what extent is supplier collaboration necessary
to reduce costs?
X
Supply Risk
Very
low
(1)
Low
(2)
Average
(3)
High
(4)
Very
high
(5)
To what extent is lead time reliability a problem
with battery packs?
X
To what extent does the inflexible nature of the
production/ordering of battery packs pose a
problem?
X
To what extent is forecasting a problem when
sourcing battery packs? (due to eg. unknown
demand, frequent demand fluctuations)
X

89
To what extent can the lack of viable substitutes for
battery packs be labeled a risk?
X
Power Matrix
Supplier Power
Very
low
(1)
Low
(2)
Average
(3)
High
(4)
Very
high
(5)
To what extent are technical capabilities of the
supplier important when sourcing battery packs?
X
Did the supplier already or will he invest resources
(money, time, human resources) into this
relationship and to what extent?
X
Is manufacturing battery packs the core
competency of this supplier?
X
To what extent did the supplier prove to be reliable
and trustworthy?
X
Buyer Power
Very
low
(1)
Low
(2)
Average
(3)
High
(4)
Very
high
(5)
To what extent are we an attractive customer on
the end market?
X
Is our sourcing process independent of the
suppliers manufacturing process? (joined
development etc.)
X
To what extent did we prove reliable and
trustworthy as a company?
X

90
Are the products sourced by the supplier part of
segments considered unimportant (financial result)
for the Accell Group compared to other segments?
(eg. E-bike sector vs City bikes)
X
Guidance notes
Financial Performance Explanation – Relevancy of use
Profitability impact The impact of the commodity on selling the end product in the
market
Total Cost of Ownership The impact of the commodity from a TCO perspective on the end
product
Value added by upgrade The increase in sales due to an upgrade of this particular part of
the end product.
Post design
freeze scope change
The costs of changing the specifications of this commodity after
the initial design and into the production period.
Importance of part to get
leverage with supplier
The leverage that can be used by this commodity on other
commodities of the end product due to its interconnectedness.
Exclusivity of use The increase in sales due to the exclusivity of use of this
commodity on the end product in the market.
Innovation The increase in sales due to an innovation this commodity on the
end product in the market.
Supplier collaboration The supplier collaboration needed to decrease costs of this
commodity and the end product.
Environmental impact The costs caused by eg. environmental regulations, requirements
that have to be accounted for with this commodity.

91
Supplier Power Explanation
Spend in relation to our total spend The percentage of the commodities bought from the supplier in
relation to the total spend of the buyer.
Number of available buyers The number of available buyers in the suppliers market.
Brand recognition The degree to which the brand of the supplier has a special
positioning with the customer and/or end consumer.
Degree of supplier
capabilities/property rights
The degree to which the supplier is known for its technical
capability and sophistication or innovativeness.
Compatibility/strategic alignment The degree to which the strategic development is in line with our
strategic development.
Entry barriers to new
suppliers/buyers
The degree to which the market allows for a fast and easy entry of
new suppliers and products (high fixed costs, development of
knowledge, experience?).
Supplier switching costs The costs of switching the buyer for the supplier (e.g. buyer
specific adaptions of the manufacturing facilities).
Ability to cope with changes in the
business environment
The degree to which the supplier can situationally adapt to market
changes (e.g. sudden demand changes, change of market
requirements).
Core competency of the supplier The degree to which the product sold is a core competency of the
supplier.
Trust and relationship developed The degree to which the relationship has built up trust in the
capabilities of the supplier.
Supply Risk Explanation
Lead time reliability The unreliability of the lead time caused by eg. the way of production
of the commodity.
Flexibility The difficulty to re-order this commodity within a short period of
time due to eg. differing specifications, or long production processes
Forecasting The difficulty to forecast this commodity due to eg. uncertainty of
demand.
Specification complexity The degree of complexity of the specification of this commodity eg.
specialized or standardized product.
Number of suppliers The number of supplier capable of delivering this commodity.
Substitutability The possibility to substitute this commodity on the end product with a
similar product.
Category industry capacity
constraints
The amount of available capacity in the market.
Country of origin The difficulty of the delivery process due to the production in a
certain country or region.

92
Buyer Power Explanation
Percentage spend of suppliers total
turnover
The percentage of spend of the suppliers total turnover.
Our attractiveness as a customer
(end market)
The degree to which the size of our market share is of interest for
the respective supplier .
Buyer specific investments/process
integration
The degree to which resource investments, that have been carried
out or will be carried out, connected to e.g. co-development
project, joint financing with the supplier increase our buying
power.
Number of available suppliers The number of available suppliers in the market.
Differential advantage (uniqueness)
of industry products
The degree to which the buyer needs unique supplies due to a
unique market .
Contract availability The degree to which an existing contract prevents (sudden)
changes.
Trust and degree of relationship
developed
The degree to which the relationship has developed trust into the
buyers reliability and capabilities.
Number of commodities purchased
at the supplier and their
interdependence
The degree to which several commodities are purchased at a
supplier and how those are dependent on each other.
Core competency of the buyer The degree to which the bought commodity(-ies) are important to
the buyer (strategic, leverage, bottleneck, non/critical).
Rank order within supplier customer
base
The positioning of the buying company within the suppliers
customer base portfolio.