MASTER THESIS - Cloud Object Storage | Store & … Master thesis was ... Table 7 Post-experimental...
37
MASTER THESIS Variable-rate Pricing of Electric Vehicle Charging; Exploring consumer behavior using TamagoCar app By Angelos Tsereklas-Zafeirakis MSc in Business Administration and Management RSM - Erasmus University Coach: Professor Wolfgang Ketter Co-reader: Konstantina Valogianni December 2015
Transcript of MASTER THESIS - Cloud Object Storage | Store & … Master thesis was ... Table 7 Post-experimental...

MASTER THESIS
Variable-rate Pricing of Electric Vehicle Charging;
Exploring consumer behavior using TamagoCar app
By Angelos Tsereklas-Zafeirakis
MSc in Business Administration and Management
RSM - Erasmus University
Coach: Professor Wolfgang Ketter
Co-reader: Konstantina Valogianni
December 2015

2
The copyright of the master thesis rests with the author. The author is responsible for
its contents. RSM is only responsible for the educational coaching and cannot be held
liable for the content.

3
This Master thesis was initiated by my profound interest in the field of Renewable
Energy Business, which is explained by the great positive impact it can have on the
everyday lives of each one of us. Electric Vehicles are a great example of how
humanity can move from a state of resources consumption and polluting to a state of
recycling and sustainability.
For the completion of this Master thesis, there are some people that I would really like
to thank. First of all, I would like to thank Prof. Ketter for the opportunity he gave me
to be involved with the topic of Electric Vehicles as well as for the trust in me to
conduct a challenging experiment in a Master-student class. Also, I want to sincerely
thank PhD candidate Konstantina Valogianni for her empowering stance and critical
guidance throughout the whole thesis. Konstantina’s insights and recommendations
played a crucial role in the formation of this thesis and for that I am deeply grateful.
In addition, I want to thank the scientific developers Govert Buijs and Erik
Kemperman for their pivotal contribution in the development and modification of
TamagoCar application and their constant availability to resolve problems throughout
the experimental period. Finally, I want to thank Dr. Yashar Ghiassi Farrokhfal and
PhD candidate Micha Kahlen for their enabling role in the execution of the
experiment in the class of Designing Business Applications, where they were
lecturers.
In addition to my academic supervisors, I would like to take some time and thank my
friends and family for all of their support during my studies in Rotterdam. My
girlfriend, Anna-Rosa, for always making me happy as well as my closest friends in
Rotterdam: Nikitas, Aliki, Burcu, Sneha, Nikki, Valerio and Hamza for all the good
times we had.
Angelos Tsereklas-Zafeirakis
November 2015

4
The continuous growth of global electricity demand is an issue that becomes more
and more urgent these days. Although the revolution of renewable sources of energy
has surpassed all expectations over the past decade, the existing static power grid has
not yet been able to cope with the new dynamic electricity production pattern. Thus,
innovative ways to balance the load and shift the demand are imperative in order to
facilitate a sustaining electric power grid.
Electric Vehicles (EVs), which are rapidly gaining significant market shares across
the globe, consist of a unique opportunity not only to move to a new low-carbon
mobility era but also to balance the electricity grid. Although, many studies have
focused on finding optimal pricing mechanisms and solutions to coordinate EV
charging, they are based primarily on simulation results, which assume that EV
drivers are represented by intelligent agents that are fully rational.
This study bridges the gap between theoretical approaches and real-world behavior by
taking into account the behavioral aspect of the users. Specifically, a 21 days
experiment is conducted where 154 users are provided with a smartphone application,
the TamagoCar app, which simulates the operation and charging of an EV. Through
TamagoCar app, two smart-charging pricing mechanisms are tested; 1) Real-Time
pricing (RTP), where the prices presented to the users are related to the electricity
retail-prices and 2) Variable-rate pricing, where pricing is also correlated with the
energy capacity desired by the users.
Results reveal that Variable-rate pricing mechanism significantly improves the
observed phenomenon of demand peaks when compared to the smart-pricing
alternative of Real-Time Pricing and leads to an average Peak-to-Average ratio
reduction of 80-87%. In addition, the study shows that users do not experience a
significant difference in the cognitive load required to use the two different pricing
mechanisms.
This finding implies that variable-rate pricing could be a viable alternative to RTP
when it comes to EV smart-charging coordination and thus further examination with
real EV drivers is proposed. In addition, the study presents a user-friendly and already
applicable interface that can be used in reality in future research projects.
5
Preface ....................................................................................................................................... 2
Acknowledgements ................................................................................................................... 3
Executive Summary ................................................................................................................... 4
Table of contents ....................................................................................................................... 5
List of tables............................................................................................................................... 6
List of figures ............................................................................................................................. 6
List of equations ........................................................................................................................ 7
1. Introduction ....................................................................................................................... 8
1.1 Electric Vehicles ......................................................................................................... 8
1.2 Research Question................................................................................................... 10
2. Theoretical background ................................................................................................... 11
2.1 Literature Review .................................................................................................... 11
2.1.1 Demand Side Management ............................................................................. 11
2.1.2 Related Work on EV Smart Charging ............................................................... 12
2.2 Variable-rate pricing ................................................................................................ 14
2.3 Conceptual Framework formulation ....................................................................... 15
3. Methodology ................................................................................................................... 18
3.1 Introduction ............................................................................................................. 18
3.2 Experimental Group ................................................................................................ 19
3.3 Pre-experiment survey: Battery Design .................................................................. 19
3.4 Experimental design ................................................................................................ 20
3.4.1 Week 1: RTP ..................................................................................................... 20
3.4.2 Week 2: Variable rate with constant a ............................................................ 21
3.4.3 Week 3: Variable rate with variable a ............................................................. 22
3.5 Leaderboard functionality ....................................................................................... 22

6
3.6 Post-experiment survey: Cognitive Load ................................................................. 23
3.7 Example of using the app (Week 2) ......................................................................... 23
4. Results ............................................................................................................................. 24
4.1 Introduction ............................................................................................................. 24
4.2 Sample ..................................................................................................................... 24
4.3 Experimental Treatment ......................................................................................... 27
4.4 Cognitive Load ......................................................................................................... 29
5. Conclusion ....................................................................................................................... 31
5.1 Introduction ............................................................................................................. 31
5.2 Key Conclusion......................................................................................................... 31
5.3 Limitations ............................................................................................................... 32
5.4 Managerial Implications .......................................................................................... 33
Reference List .......................................................................................................................... 34
Table 1 Transportation mode .................................................................................................. 19
Table 2 Descriptive statistics for average daily commute distance (in km) ............................ 20
Table 3 Operating system ....................................................................................................... 20
Table 4 Gender distribution .................................................................................................... 24
Table 5 Descriptive Statistics of the experiment ..................................................................... 25
Table 6 Peak to Average Ratio ................................................................................................. 29
Table 7 Post-experimental survey results on cognitive load ................................................... 29
Figure 1 Conceptual Model ..................................................................................................... 16
Figure 2 TamagoCar application main page ............................................................................ 18

7
Figure 3 Retail Prices during the 24-h ..................................................................................... 21
Figure 4 Screenshot from variable-rate pricing mechanism charging .................................... 21
Figure 5 Age distribution ......................................................................................................... 25
Figure 6 Commute pattern in km during the 24-h .................................................................. 26
Figure 7 24h charging pattern of 10 random users during week 1 (RTP scheme) .................. 26
Figure 8 Charging pattern before Standardization (in kWh) ................................................... 27
Figure 9 Charging pattern after Standardization (in kWh/kWh) ............................................. 27
Figure 10 Charging pattern of Week 2 and 3 seperately ........................................................ 28
Equation 1Variable –rate pricing formula ............................................................................... 14
Equation 2 Peak to Average Ratio (PARP) ............................................................................... 16
Equation 3 Objective function ................................................................................................. 22
Equation 4 at depending on the retail price ............................................................................ 22
Equation 5 Score formula ........................................................................................................ 22
Equation 6 Towing cost ........................................................................................................... 23

8
The demand for electricity is continuously increasing and will continue to increase
over the next decades. It is projected that by 2040, global net electricity generation
only from central producers will almost double to an amount of 39.034 billion kWh
annually from an amount of 20.240 billion kWh in 2010 (EIA, 2013). In addition,
world energy-related carbon dioxide emissions are expected to rise from 31,2 billion
metric tons in 2010 to 36,4 billion metric tons in 2020 and 45,5 billion metric tons in
2040 according to IEO2013 Reference case (EIA, 2013). Policy makers,
understanding the direct climate implication of an increased energy demand, have
already established strict policy regulations that set specific greenhouse gases (GHG)
emission limits for the foreseeable future. Specifically, the European Union, being
responsible for around 10% of GHG emissions in 2012, made a unilateral
commitment to reduce overall greenhouse gas emissions from its 28 Member States
by 20% in 2020 compared to 1990 (EU-Commission, 2014). This policy has already
resulted in a notable 19% decrease of EU’s total GHG emissions in 2012 compared to
1990 (EU-Commission, 2014).
Even though the overall aggregated energy industry efficiency has improved in terms
of GHG emissions, road transport, with a share of 22% of EU’s total CO2 emissions,
has increased its emissions at a total rate of 27% between 1990 and 2009 (Vicente,
2011). It is argued that technological progress in increasing the fuel efficiency of
Internal Combustion Engine (ICE) vehicles over the last decade has not been able to
keep pace with the increasing demand of mobility (Kihm & Trommer, 2014). On the
other hand, Electric Vehicles (EVs), which consume 50% less energy on average and
can reduce carbon emissions by 60-100% compared to gas fuel vehicles seem like a
viable alternative over ICE (Koroleva et al.,2014).
1.1 Electric Vehicles
Many governments, such as Norway, the Netherlands, the USA et al., seem to have
also realized the potential societal benefits of an EV policy adaption and have
invested heavily in R&D, infrastructure as well as in fiscal motives in order to further
incentivize customers and render EVs commercially attractive. Specifically, total EV
spending by EVI (Electric Vehicles Initiative) countries has already reached the
9
amount of $16 billion between 2008 and 2014 resulting in a global EV fleet consisting
of more than 665.000 vehicles in stock and representing almost 1% of total passenger
cars in 2014 (EIA, 2015). Norway plays the leading role in terms of EV market
penetration, which accounts for an astonishing 12,5%, with Netherlands, the USA and
Sweden following at a rate of 3,9, 1,5 and 1,4% respectively. Sales of EVs in
California already exceeded 100.000 in 2014, and the state is well on its way to
doubling that figure (Hant, 2014). It is also estimated that in less than 5 years the
amount of EVs will increase by 20 times, resulting in more than 20 million EVs on a
global scale (Trigg et al., 2013). Assuming a global average of 12.000 km per car
driven annually and efficiency of 0,2kWh/km, the total energy consumption surplus
will be more than Portugal’s total electricity net generation (43 billion kWh/ year).
This fact that will pose several challenges in the way the electricity industry is
currently operating.
One of the direct implications of the aforementioned potential fast adoption of EVs is
that it will add an additional burden to the grid and further sharpen the problem of
demand peaks. The existing power grid was originally designed to distribute
electricity from large, constantly generating producers to individual consumers. On
the other hand, renewable sources of energy, such as photovoltaic panels,
characterized by Schleicher-Tappeser (2012) as the most disruptive energy
technology, have already enabled consumers of all sizes to produce power themselves
(prosumers) operating with a new bottom-up control logic and creating new
innovative business models (e.g. cloud solar initiatives1). The combination of both
top-down grid structure and increasing bottom-up decentralized production will result
in conflicts with the current power grid control infrastructure and render the electricity
supply highly uncertain and unreliable.
On the demand side, EVs, during charging time, have the capability to almost double
the average household load and exacerbate the already high Peak to Average Ratio
(PAR) (Mohsenian-Rad, 2010). In addition, they can also result in degradation of the
power quality, voltage problems and potential utility’s and consumer’s equipment
damage. Hence, methods for balancing the increasing demand are imperative to
facilitate a safe transition to the new decentralized environment.
1 http://www.gocloudsolar.com/

10
1.2 Research Question
As discussed, the fast penetration of renewable energy sources, such as wind and
solar, in the global energy mix already necessitates new ways of load balancing and
demand reshaping. Electric Vehicles are a great opportunity for the electric grid to be
more stable due to their availability that enables the redistribution of their charging
throughout the day.
In theory, there are many models that describe through simulations how EV charging
can be optimally coordinated in order to achieve a more balanced electrical grid
(Clement-Nyns et al., 2010; Rotering & Ilic, 2011; Moura et al., 2011; Vandael et
al.,2013). However, these studies assume that EV drivers are represented by
intelligent agents that are fully rational and do not account for the actual human
behavior. In addition, according to Maes (1994), the actual users tend not to trust the
intelligent agents, a fact that creates an additional gap between theoretical approaches
and reality.
In this study, we try to bridge this gap by conducting a real-world experiment and
providing the users with an intelligent agent (a smartphone application), so that they
are enabled to intervene and interact with the agent when they think this is
appropriate.
Through this prism the research question of this study is the following:
i. How can EV charging be better organized so that all stakeholders (drivers,
grid operators) are enabled to reap the benefits of moving to an electric
mobility economy?
Based on this fundamental question, a series of important sub-questions arise:
a. Which smart-charging mechanism can better serve this purpose?
b. What is the role of Information Technology in this quest and what is
the role of the EV driver? How can they optimally be combined?

11
2.1 Literature Review
The literature review will initially address how the topic of demand side management
evolved over the last 30 years and gradually focus more on the literature of EV
charging and coordination. The latter is a field that was introduced and popularized in
the 90’s (Kempton&Letendre, 1997) and has since then gained a lot of scientific
attraction due to its increasingly significant societal relevance.
2.1.1 Demand Side Management
Traditionally, electric utilities2 used to invest in capital intensive methods, such us
pumped storage water plants, flywheels, compressed air etc. in order to store energy
in times where the supply exceeded the demand. In the late 1980’s utilities began
recognizing that energy conservation could also take the form of a provided service
that can lead to similar levels of energy service with fewer kilowatt-hours and at a
lower cost (Masters, 2013). What emerged was a process called integrated resource
planning (IRP) or least cost planning (LCP) (Masters, 2013), which consisted of
utilities’ programs that targeted at controlling energy consumption on the consumer’s
side of the electric meter. These programs are also known as Demand Side
Management (DSM) programs. In their initial implementation DSM programs
included conservation and energy efficiency programs, fuel substitution programs and
load management programs (Masters, 2013). Regarding the latter category, the
programs usually aimed at either reducing consumption or shifting consumption.
According to Mohsenian-Rad (2010), shifting residential consumption can be
achieved mainly through two methods; Direct Load Control (DLC) (Top down-
control approach) and Smart Pricing (bottom-up control). Direct Load Control allows
utilities to remotely control certain appliances of a household, such as lighting,
HVAC, refrigerators etc., in order to provide balancing power. Recently, the concept
of Smart Home Appliances and its impact on load shifting constituted a central point
of interest for different research communities such as Computer and Natural Scientists
2 An electric utility is an electric power company (often a public utility) that engages
in the generation, transmission, and distribution of electricity for sale generally in
a regulated market- Wikipedia
12
(Stamminger, 2008; Son, 2010; Gottwalt, 2011). However, concerns regarding private
privacy still act as a barrier in the rapid development and adaption of DLC initiatives.
On the other hand, Smart Pricing targets at reducing load peaks by giving to
consumers price incentives to switch consumption when demand is high. A
commonly used residential peak reduction strategy is Time-of-Use (ToU) pricing.
Typical ToU tariffs signal high prices during work-hours while offering lower prices
at late-night hours. According to Faruqui & Sergici (2010), the adaption of a ToU
tariff system can yield reductions of 3-6% in peak demand. Another smart pricing
alternative is Critical Peak Pricing (CPP), which can take a time-invariant or ToU rate
structure with a dispatchable high or “critical” price during periods of system stress
(Herter, 2007). Again, empirical evidence revealed that when CPP is implemented
and accompanied with several enabling technologies, it can also lead to reductions of
peak demand at an impressive rate of 27-44% (Faruqui & Sergici, 2010). Finally, Real
Time Pricing (RTP) is one of the most popular but also controversial alternatives of
smart pricing. In the US, more than 70 utilities offered voluntary RTP tariffs from
mid-1980s till 2004 with a motive to achieve better customer satisfaction rates, reduce
load peaks, shift load but also encourage load growth (Barbose et al, 2004). While
these programs revealed moderate load reductions, they did not provide enough
evidence on the potential positive implications they could have on the wholesale
market performance and the utility resource planning. Newer studies also highlight
the consumers’ lack of awareness about their electricity consumption as an important
factor of the preference of traditional pricing schemes over RTP (Dütschke & Paett,
2013). In contrast, Borenstein (2005) argues that RTP can lead to large long-term
societal and economic gains that can by far outweigh the cost for the largest
consumers. In his paper he estimates that ToU schemes capture only a mere 20% of
the efficiency gains that can be achieved through RTP.
2.1.2 Related Work on EV Smart Charging
Smart pricing in the smart grid era and instant forecasting is becoming increasingly
important in a variety of complex and dynamic markets (Ketter et al., 2012; Ketter et
al., 2015). Specifically on EV charging, the literature covers a wide range of scientific
fields. In their majority, researchers have focused on the technical challenges of
introducing EVs to the existing grid by recognizing new opportunities, such as using
13
the EVs’ batteries as a storage source for balancing the load curve (V2G) (Kempton&
Letendre, 1997; Peterson et al., 2010), and proposing coordinated charging control
mechanisms (Clement-Nyns et al., 2010; Rotering & Ilic, 2011; Moura et al., 2011).
Vandael et al. (2013) describe a three-step top-down approach to coordinate the EV
charging, while Kahlen et al. (2012) develop a centrally coordinated fleet operator
business model that yields significant profits for the fleet aggregator. Many
companies have also realized the added value of EVs in the future energy scheme,
most notable of which being the collaboration of Enel, Endesa and Nissan that jointly
developed a two-way charger capable of supporting a V2G initiative (Enel, 2015).
The municipality of Utrecht has also already installed 20 bidirectional charging
stations, co-developed by Stedin and a conglomerate of partner companies and
institutions (Van Jaarsveldt, 2015).
Regarding smart pricing, Lyon et al. (2012) evaluate the feasibility of shifting
charging demand by using ToU and RTP schemes, proposing that ToU pricing is
worthwhile under all evaluated scenarios, while RTP, although better in terms of
expected returns, is still not able to justify the additional investment in smart grid
infrastructure needed. In addition, in order to reduce the common observed
phenomenon of herding, when a RTP tariff is applied, Valogianni et al. (2015)
propose a mutliagent approach that applies a hybrid pricing mechanism to coordinate
charging. According to this approach, which is defined as Variable-Rate pricing,
prices are signaled to EV users as a function of charging rate (KW) resulting in a
notable average Peak Reduction of 9,61% when compared to a Real-world scenario
and 16% when compared to a rate-independent scenario where day-ahead prices are
signaled that vary during the 24 hour-period but are static and do not change
dynamically (Similar to RTP).
However, EV users’ actual response and behavior to smart pricing mechanisms are
difficult to be estimated just based on theoretical assumptions. Rathnayaka et al.
(2011) identify and comprehensively analyze prosumer behavioral patterns in order to
propose an optimal multi-agent architecture. In an effort to understand, which factors
can influence consumers’ decisions to charge their EVs at different times, Koroleva et
al. (2014) developed a smartphone application, the TamagoCar app (See paragraph
3.1), which simulates the experience of owning and charging an EV. By altering the
14
pricing mechanisms that are signaled to the end-users (Flat Tariff, ToU, RTP), it is
observed that they are willing to redistribute their charging behavior.
2.2 Variable-rate pricing
Building on the work of Koroleva et al. (2014) and Valogianni et al. (2015), this
thesis will explore the impact of variable-rate charging in load curve balancing
through TamagoCar app with the aim to measure the users’ actual behavior when
compared to the behavior of intelligent EV agents.
According to the model of Valogianni et al. (2015), EV users are represented by an
intelligent agent, who is responsible for charging the EV. The grid operator is then
represented by a control agent, who broadcasts price signals to the EV agents and is
responsible for monitoring their aggregate consumption taking into account the
existing production level. The proposed price function that is broadcasted every time-
step t by the control operator and is dependent on the charging rate has the following
form:
Pt (rt) = P0,t + atrt
Equation 1Variable –rate pricing formula
where rt is the charging rate in time step t, at is the slope of the price curve with
respect to charging rate and P0,t is the price for zero demand, which can be
determined as a percentage of the wholesale price of electricity at time t. As
previously stated, Valogianni et al. proved that the introduction of a variable rate
charging mechanism through intelligent EV agents led to significant balancing of the
demand when compared to the rate-independent pricing mechanism and a Real World
scenario. However, these outcomes are purely based on simulations results assuming
cost minimizing intelligence agents. We are taking this work to the next level by
putting the mechanism in practice. We provide the EV owners with an intelligent
agent (smart-phone application) and let them decide on how to use it.
15
2.3 Conceptual Framework formulation
The main objective of the current thesis is to test the boundaries of variable-rate
charging mechanism in the real world through TamagoCar app and assess the
behavior of EV users when compared to the intelligent EV agents.
In addition this thesis aims:
1. At measuring the impact of cognitive load required for this method to be
implemented directly to end EV users and comparing their results with the
ones of the intelligent EV agents
2. At providing recommendations about improving the method so that is directly
applicable to real experiments
3. At analyzing the managerial implications stemming from a successful
implementation of variable-rate pricing and the shared value that can be
created among multiple stakeholders (EV users, grid operator, society)
As previously mentioned, Valogianni et al (2014) found that the introduction of
variable-rate pricing led to 9,61% PARP reduction when compared to a real-world
charging scenario and 16% when compared to rate-independent pricing. Based on the
latter finding and not having any additional evidence that contradicts it, it is expected
that variable-rate pricing will lead to significant balancing of the demand when
compared to rate-independent pricing (RTP).
H1: Variable–rate pricing mechanism will lead to significant balancing of the demand
as compared to rate-independent pricing (RTP)
In addition, Valogianni et al (2014) observed that when selecting a variable at that is
correlated with the Retail price, the EV agents adjust this value in order to reach the
desired load profile. This leads to an even better aggregate demand curve than with
constant at. Accordingly, we expect that a similar pattern will be observed in the
present thesis.
H2: Inserting a variable at that depends on the Retail Price each time period t will
result in better balancing results than having a constant at

16
Finally, it is expected that variable-rate pricing modelling will increase the amount of
decision-making time required. This fact will most probably lead to additonal
cognitive loading of the users.
H3: Variable-rate pricing will present higher values of cognitive load
Figure 1 Conceptual Model
Peak to average ratio (PARP)
The balancing of the demand will be measured primarly through PARP. The PARP is
a measurement of the highest peak of a load curve divided by the average. The more
efficient the grid, the fewer the demand peaks. The formula that calculates the PARP
is the following:
𝐏𝐀𝐑𝐏 = |𝐱|𝐏𝐞𝐚𝐤
𝟐
𝐱𝐑𝐌𝐒𝟐
Equation 2 Peak to Average Ratio (PARP)
Pricing mechanism
The pricing mechanism variable will represent different experimental conditions that
will be described in the next chapter. To illustrate the hypothesis that a change in the
pricing mechanism will lead to a differentiation of the Peak to Average Ratio, the
pricing mechanisms under examination will be defined as nominal variables
expressing different experimental treatments.
0: Rate-independent pricing (RTP)
1: Variable-rate pricing with constant a
2: Variable-rate pricing with variable a
Cognitive load
According to Simon (1996), people are not totally rational and do not always respond
in a perfect cost minimizing manner. Most of the times they can be influenced by the

17
cognitive load which can result in them taking sub-optimal solutions. Thus, this thesis
will measure the amount of cognitive load of each user to confirm if there were
significant differences among the three pricing shemes.
According to Pass and Merrienborer (1994), Cognitive Load (CL) is imposed on the
cognitive system during the completion of a task. There are three types of cognitive
load: intrisic, extraneous and germane CL. The former refers to the intrinsic nature of
the material and cannot be easily altered (e.g., the calculation of 1+1 versus solving
a differential equation). The extraneous CL is induced by inadequate instructional
design. The latter, germane CL, directly reflects learners' efforts to construct and store
schemas during learning (Sweller, Van Merrienboer, & Paas, 1998). For this thesis,
the level of intrisic CL will be measured in order to assess if high levels of smart
charging complexity led to unexpected decisions.

18
3.1 Introduction
In order to measure the actual behavior of the EV users under different pricing
schemes, a mobile application that simulates the EV usage was employed.
TamagoCar app, developed by RSM in collaboration with TU Delft, consists of an
innovative and well suited platform to explore the objective of this thesis. In
particular, TamagoCar app provides the users with the experience of operating and
charging a car while commuting on foot, by bike, by car or by train/bus (Koroleva et
al., 2015). The app uses GPS services to measure the distances covered by the users
and discharges the EV battery accordingly. The users have to manually start/end their
commutes through the “Commute Now” functionality and recharge their batteries
using the “Charge” functionality. In addition, the users can monitor their charging and
commuting history using the “History” button and compare their aggregated scores to
their fellow users through the “Leaderboard” functionality (See Figure 2). The
application was developed both in Android and iOS environments.
Figure 2 TamagoCar application main page

19
3.2 Experimental Group
The experiment was conducted among students of the Master in Business Information
Management at Rotterdam School of Management. The students were urged to use
the app during their daily commutes from or to the university regardless of the
transportation mode (bike, bus, bike etc.). The participation in the experiment was
optional but secured bonus grades to the participants. Specifically 0,2 points were
awarded to all participants provided that they will commute once per day on average
and another 0,2 were awarded to the top 30 most efficient drivers based on their
leaderboard score. This way the students were motivated not only to participate in the
experiment but also to optimize their charging profile as efficient as possible.
3.3 Pre-experiment survey: Battery Design
In order to decide the size of the simulated battery, an initial questionnaire was
distributed that asked the participants to specify how many kilometers they commute
on average every day. In addition, the questionnaire asked the participants to specify
the transportation mode they intended to use in their daily commutes as well as which
operation system they had in their mobile phones. The specific questions as well as
the descriptive statistics are presented below:
1. How do you commute on your daily transportation?
2. Can you give an approximation of the total distance you travel every day
(back and forth)
3. What is the operation system of your mobile phone?
Transportation mode frequencies
Frequency Percent Valid
Percent
Cumulative
Percent
Train/tram/bus 45 28,7 28,7 28,7
Bike 97 61,8 61,8 90,4
Car/motorcycle 8 5,1 5,1 95,5
Foot 7 4,5 4,5 100
Total 157 100 100
Table 1 Transportation mode
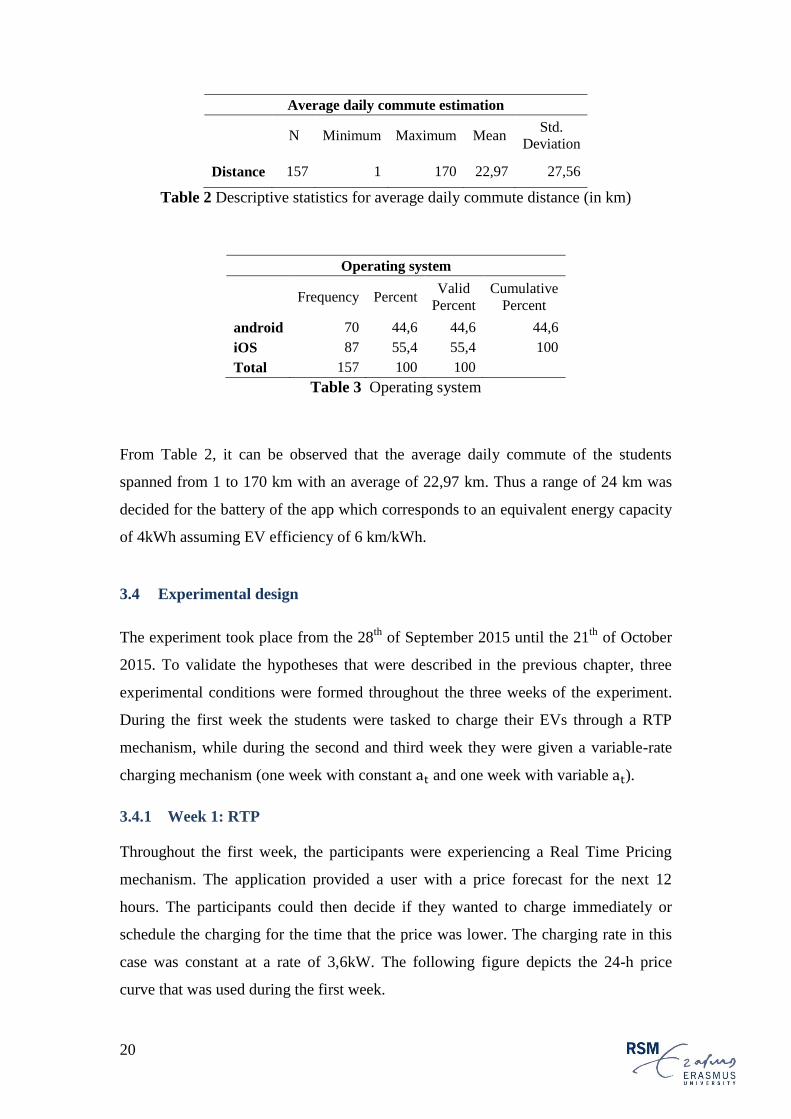
20
Average daily commute estimation
N Minimum Maximum Mean Std.
Deviation
Distance 157 1 170 22,97 27,56
Table 2 Descriptive statistics for average daily commute distance (in km)
Operating system
Frequency Percent
Valid
Percent
Cumulative
Percent
android 70 44,6 44,6 44,6
iOS 87 55,4 55,4 100
Total 157 100 100
Table 3 Operating system
From Table 2, it can be observed that the average daily commute of the students
spanned from 1 to 170 km with an average of 22,97 km. Thus a range of 24 km was
decided for the battery of the app which corresponds to an equivalent energy capacity
of 4kWh assuming EV efficiency of 6 km/kWh.
3.4 Experimental design
The experiment took place from the 28th
of September 2015 until the 21th
of October
2015. To validate the hypotheses that were described in the previous chapter, three
experimental conditions were formed throughout the three weeks of the experiment.
During the first week the students were tasked to charge their EVs through a RTP
mechanism, while during the second and third week they were given a variable-rate
charging mechanism (one week with constant at and one week with variable at).
3.4.1 Week 1: RTP
Throughout the first week, the participants were experiencing a Real Time Pricing
mechanism. The application provided a user with a price forecast for the next 12
hours. The participants could then decide if they wanted to charge immediately or
schedule the charging for the time that the price was lower. The charging rate in this
case was constant at a rate of 3,6kW. The following figure depicts the 24-h price
curve that was used during the first week.

21
Figure 3 Retail Prices during the 24-h
3.4.2 Week 2: Variable rate with constant a
In order to experiment with the variable-rate pricing mechanism, a new module had to
be introduced to the existing version of the app. For this, a cost minimization
algorithm was developed and inserted in the app. The users had to select their desired
battery capacity and time availability (h) through the sliding bars of the application.
Then, the cost minimization algorithm returned the total charging price to the user
(See Figure 4).
Figure 4 Screenshot from variable-rate pricing mechanism charging
0
0,05
0,1
0,15
0,2
0,25
0,3
1 2 3 4 5 6 7 8 9 10 11 12 13 14 15 16 17 18 19 20 21 22 23 24
€/k
Wh
Hour

22
The objective function of the minimization algorithm is calculated by first multiplying
Equation 1with rt to find the total price for time period t and then replacing P0,t with
the Retail Price (Rt) for time t. The sum of all the prices between the current hour, n,
and the availability period n+h is the objective function. The goal of the algorithm is
to calculate the optimal charging schedule that would minimize the total cost of
charging for the user.
𝑚𝑖𝑛 ∑ Rtrt+at ∗ rt2
n+h
t=n
Equation 3 Objective function
The Retail prices that were used for this experimental setting were the same as with
those of week 1 for comparison purposes. Also, throughout week 2 αt had a constant
value of 0,2 for all time periods t.
3.4.3 Week 3: Variable rate with variable a
In order to examine the validity of H2, at was correlated with the Retail Price. To
better observe the difference between the results of Week 2 and Week 3, it was
decided to correlate at with Rt but keep always a minimum at of 0,2.
at = 0,2 + Rt − 0,08
Equation 4 𝐚𝐭 depending on the retail price
3.5 Leaderboard functionality
As previously described, in order to add the social element to the application and
incentivize the participants to charge as efficiently as possible, a leaderboard
functionality was designed. The score of the users depended on their average cost paid
per kWh. In addition, a penalty was given when the users were commuting without
having enough battery. The equation for the score was calculated as follows:
Score = (Total cost spent for charging + towing cost) / Total kWh charged
Equation 5 Score formula
23
Where,
Towing cost = (towed distance/6)*0.37
Equation 6 Towing cost
3.6 Post-experiment survey: Cognitive Load
Finally, to assess the level of mental effort that every experimental condition required
from the participants, a post-experiment survey was handed. Based on the self-rating
measurement scale of cognitive load proposed by Bratfish et al. (1971), the questions
for the three weeks were structured in the following way:
“During the … week, when you were deciding on how to charge your Electric Vehicle
more efficiently, did you feel that you made a great deal of mental effort?
Please rate your effort on the 5-point scale”.
3.7 Example of using the app (Week 2)
Before moving to the results of the experiment, a real case example of using the app
will be described. This way the reader will have the opportunity to easily understand
how the participants experienced the simulated ownership and operation of the EV.
On the 7th
of October, user 83 had to go from his house to Erasmus University by bike
in order to attend the class of Designing Business Applications. At 7:48, he logged in
TamagoCar app and pressed the commute button. After 9 minutes, he ended his 1,7
km commute. During this time he consumed 0,28 kWh of his simulated EVs battery
that left him with 1,39 kWh from a total battery capacity of 4kWh (as explained in
paragraph 3.3).
In order to recharge his battery for future usage, he decided to use the charging
functionality of the app at 8:00. As shown in Figure 4, the user after experimenting
with different availability hours and desired capacity values, he selected to charge his
EV for 1 hour to a total capacity of 1,77 kWh. This choice signaled a total cost of
0,045 € or 0,118€/kWh, which resulted from the cost-minimization routine as
described in paragraph 3.4.2.

24
4.1 Introduction
In the first chapter the subject under examination was introduced and the research
question of the study was specified (Paragraph 1.2). In the second and third chapter
the study focused on the specific smart charging mechanisms that would be examined
and formulated the proposed framework under which the developed hypotheses would
be tested. This chapter will evaluate whether the developed hypotheses are supported.
The chapter starts with the analysis of the sample and continues with the experimental
treatment of the data. Finally, the post-experimental survey on cognitive load is
analyzed. The conclusions of the results are presented in the following chapter.
4.2 Sample
The total number of students that took part in the experiment was 154. Of those
59,7% were male and 36,4% female (Table 4). The average age of the sample was
23,22 years old, which can be considered as a rather young and tech-savvy sample
(Table 5). The age distribution of the sample is depicted in Figure 5.
The average distance covered throughout the three weeks of the experiment was
117.571 km or 19,60 kWh when converted to energy-equivalent units (See Paragraph
3.3). To account for location mistakes in the commute functionality, all commutes
that had an average speed of more than 34km/s (or 122,4 km/h) were deleted. The
average capacity charged per user was 23,54 kWh, which implies that the users were
charging considerably more than they actually needed for their commutes.
Gender
Frequency Percent
Valid
Percent
Cumulative
Percent
Female 56 36,4 36,4 40,3
Male 92 59,7 59,7 100,0
Not Mentioned 6 3,9 3,9 3,9
Total 154 100,0 100,0
Table 4 Gender distribution

25
Figure 5 Age distribution
Descriptive Statistics
N Minimum Maximum Mean
Std.
Deviation
Age 147 20 27 23,22 1,46
Distance 154 0 862422 118334,88 118569,53
Charges 154 2,64 94,84 23,54 15,06
Table 5 Descriptive Statistics of the experiment
The driving behavior in terms of km at each hour of the day between the different
pricing schemes (RTP, Variable-rate pricing with constant a, Variable-rate pricing
with variable a) is depicted in Figure 6. The driving was done primarily during the
day (6-19) whereas there were only small amounts of commutes covered during the
night hours (21-5). In addition, there was a commonly observed driving peak between
3-6 PM and at 7-8 AM, which could be explained by commutes of the students from
and to the university. However the total distance covered during the first week was
much higher: 8900,72 km when compared to 5056,10 and 4266,76 km of week 2 and
week 3 accordingly. This fact is attributed to the rules of the experiment that required
one commute per day on average from the participants. This means that some students
may did complete their required commutes already from the first and second week. In

26
addition, the decline in the distance commuted can be explained by the accumulated
cognitive load that was required by the participants in the time horizon of the
experiment. To counterbalance this effect and to secure the validity of the result, a
standardized evaluation of the charging patterns will be proposed in the next
paragraph.
Figure 6 Commute pattern in km during the 24-h
A typical example of the charging pattern can be observed in Figure 7. In the graph,
the charging behavior of 10 random users during week 1 is presented. We can see that
most of the charging happens early in the morning (3-6 am) or after 2pm. This pattern
can be explained by the low retail prices at 6am and 4pm (See Figure 3), which
created notable herding phenomena during these specific timeframes. In the next
paragraph we will investigate whether these phenomena also exist in the total
experimental sample and whether the introduction of a variable-rate pricing
mechanism can alleviate the herding problem.
Figure 7 24h charging pattern of 10 random users during week 1 (RTP scheme)
0
200
400
600
800
1000
0 1 2 3 4 5 6 7 8 9 10 11 12 13 14 15 16 17 18 19 20 21 22 23 24 25
km
Week.1
Week.2
Week.3
0
1000
2000
3000
4000
5000
6000
7000
8000
9000
10000
3 6 8 9 10 11 12 14 15 16 17 18
Wh
52
55
57
70
72
75
76
83
85
88

27
4.3 Experimental Treatment
As described in paragraph 2.3, we want to test whether the amount of capacity
charged at each hour of the day is significantly different between the different pricing
mechanisms. For that, the total charging amount per hour was divided by the total
distance commuted each week (converted in kWh). In Figure 8 and Figure 9, the
charging pattern before and after the standardization is presented.
Figure 8 Charging pattern before Standardization (in kWh)
Figure 9 Charging pattern after Standardization (in kWh/kWh)
By taking a first look at the graphs, we can observe that there is a notable
improvement in terms of peak reduction between week 1 and weeks 2 and 3, which
means that variable-rate pricing contributed to a remarkable smoothing of the demand
curve. As described in the previous paragraph and explained by Valogianni et al.
(2014), this effect can be attributed to the phenomenon of herding at 6 AM and 4 PM
during the first week, which is explained by the retail price curve; as observed in
0
100
200
300
400
500
600
700
0 1 2 3 4 5 6 7 8 9 10 11 12 13 14 15 16 17 18 19 20 21 22 23
kW
h Week.1
Week.2
Week.3
0
0,05
0,1
0,15
0,2
0,25
0,3
0,35
0,4
0,45
0 1 2 3 4 5 6 7 8 9 10 11 12 13 14 15 16 17 18 19 20 21 22 23
KW
h/k
Wh
Week.1
Week.2
Week.3
28
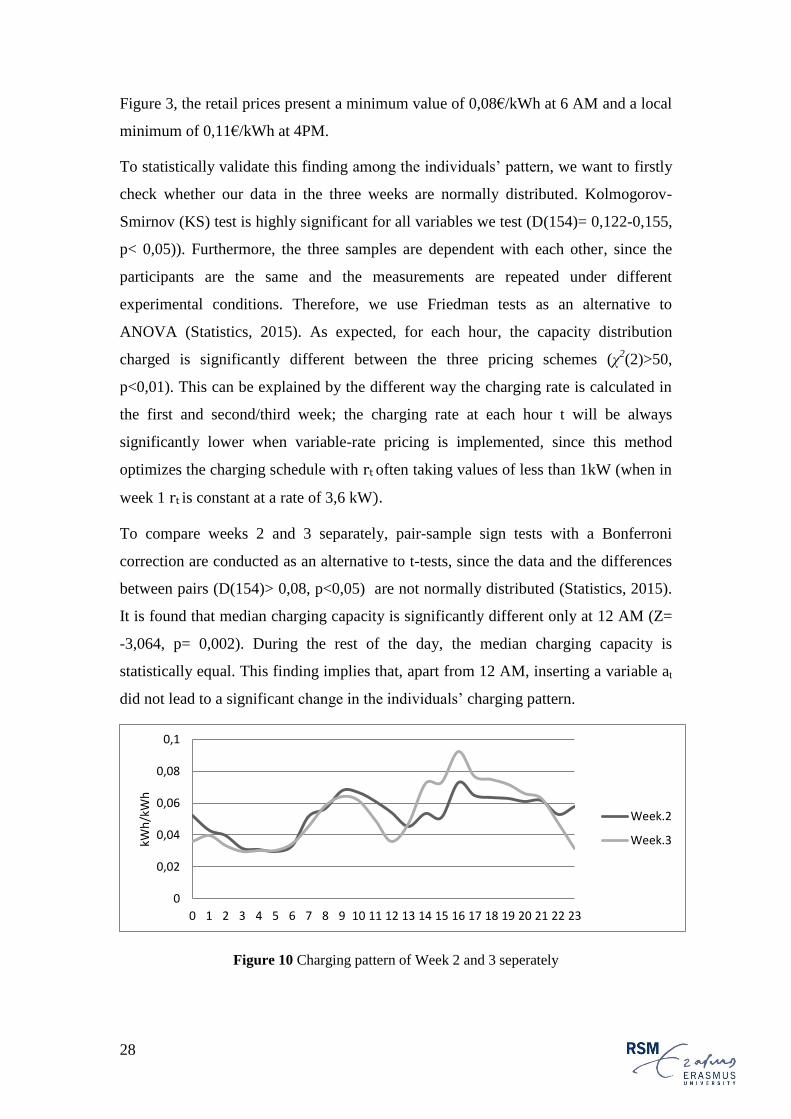
Figure 3, the retail prices present a minimum value of 0,08€/kWh at 6 AM and a local
minimum of 0,11€/kWh at 4PM.
To statistically validate this finding among the individuals’ pattern, we want to firstly
check whether our data in the three weeks are normally distributed. Kolmogorov-
Smirnov (KS) test is highly significant for all variables we test (D(154)= 0,122-0,155,
p< 0,05)). Furthermore, the three samples are dependent with each other, since the
participants are the same and the measurements are repeated under different
experimental conditions. Therefore, we use Friedman tests as an alternative to
ANOVA (Statistics, 2015). As expected, for each hour, the capacity distribution
charged is significantly different between the three pricing schemes (χ2(2)>50,
p<0,01). This can be explained by the different way the charging rate is calculated in
the first and second/third week; the charging rate at each hour t will be always
significantly lower when variable-rate pricing is implemented, since this method
optimizes the charging schedule with rt often taking values of less than 1kW (when in
week 1 rt is constant at a rate of 3,6 kW).
To compare weeks 2 and 3 separately, pair-sample sign tests with a Bonferroni
correction are conducted as an alternative to t-tests, since the data and the differences
between pairs (D(154)> 0,08, p<0,05) are not normally distributed (Statistics, 2015).
It is found that median charging capacity is significantly different only at 12 AM (Z=
-3,064, p= 0,002). During the rest of the day, the median charging capacity is
statistically equal. This finding implies that, apart from 12 AM, inserting a variable at
did not lead to a significant change in the individuals’ charging pattern.
Figure 10 Charging pattern of Week 2 and 3 seperately
0
0,02
0,04
0,06
0,08
0,1
0 1 2 3 4 5 6 7 8 9 10 11 12 13 14 15 16 17 18 19 20 21 22 23
kWh
/kW
h
Week.2
Week.3
29
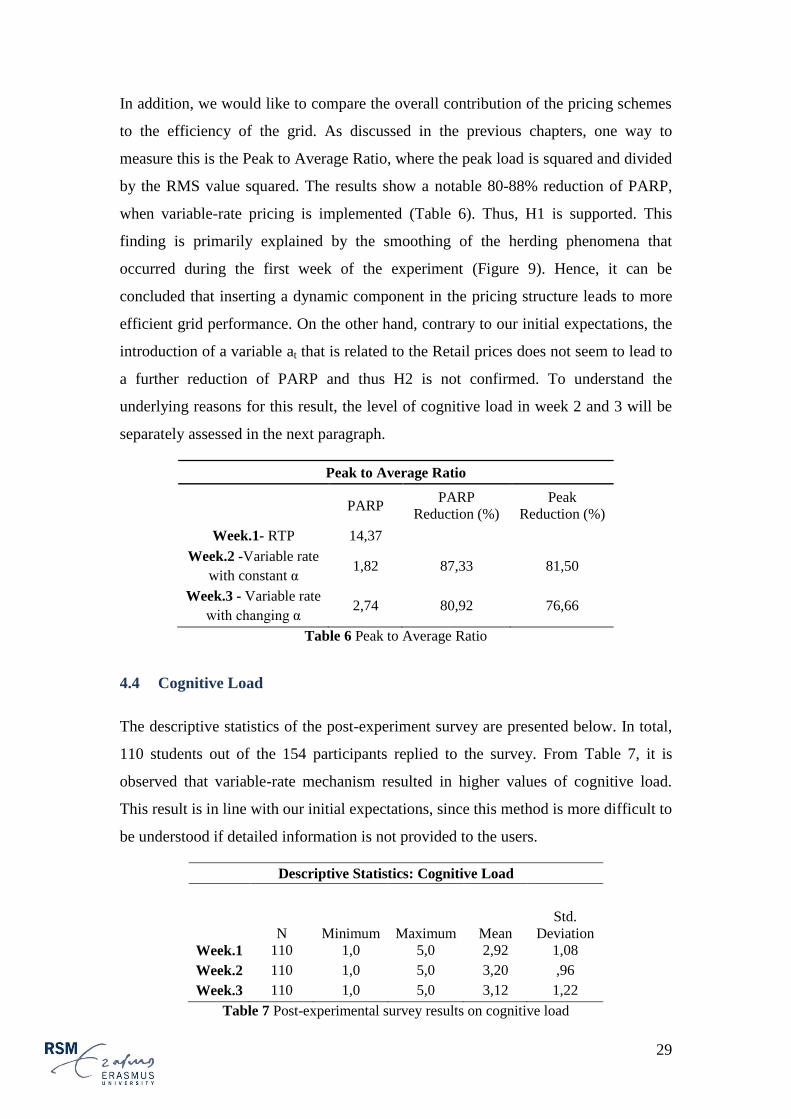
In addition, we would like to compare the overall contribution of the pricing schemes
to the efficiency of the grid. As discussed in the previous chapters, one way to
measure this is the Peak to Average Ratio, where the peak load is squared and divided
by the RMS value squared. The results show a notable 80-88% reduction of PARP,
when variable-rate pricing is implemented (Table 6). Thus, H1 is supported. This
finding is primarily explained by the smoothing of the herding phenomena that
occurred during the first week of the experiment (Figure 9). Hence, it can be
concluded that inserting a dynamic component in the pricing structure leads to more
efficient grid performance. On the other hand, contrary to our initial expectations, the
introduction of a variable at that is related to the Retail prices does not seem to lead to
a further reduction of PARP and thus H2 is not confirmed. To understand the
underlying reasons for this result, the level of cognitive load in week 2 and 3 will be
separately assessed in the next paragraph.
Peak to Average Ratio
PARP PARP
Reduction (%)
Peak
Reduction (%)
Week.1- RTP 14,37
Week.2 -Variable rate
with constant α 1,82 87,33 81,50
Week.3 - Variable rate
with changing α 2,74 80,92 76,66
Table 6 Peak to Average Ratio
4.4 Cognitive Load
The descriptive statistics of the post-experiment survey are presented below. In total,
110 students out of the 154 participants replied to the survey. From Table 7, it is
observed that variable-rate mechanism resulted in higher values of cognitive load.
This result is in line with our initial expectations, since this method is more difficult to
be understood if detailed information is not provided to the users.
Descriptive Statistics: Cognitive Load
N Minimum Maximum Mean
Std.
Deviation
Week.1 110 1,0 5,0 2,92 1,08
Week.2 110 1,0 5,0 3,20 ,96
Week.3 110 1,0 5,0 3,12 1,22
Table 7 Post-experimental survey results on cognitive load

30
To examine whether variable-rate pricing led to statistically significant higher values
of cognitive load, the responses of week 2 and week 3 will be treated as one. The KS
test reveals that neither the samples (D(110)= 0,155-0,217, p<0,05) nor the pair
differences are normally distributed (D(110)= 0,106, p<0,05) and thus a pair-sample
sign test with a Bonferroni correction is conducted. The results of the test suggest that
the introduction of variable-rate mechanism did not lead to significant median
differences in the cognitive load of the participants (Z=-0,804, p=0,421). Thus H3 is
not confirmed. This result implies that the participants did not have to make a
significant amount of additional mental effort to use variable-rate mechanism, even
though the mechanism was perceived as more difficult to understand, as observed in
the feedback session of the questionnaire. This phenomenon can be attributed to the
fact that the mobile application was suggesting already optimal pricing solutions to
the participants and thus they did not have to be cognitive overloaded to perform in an
efficient way.
Finally, by comparing the cognitive load of Week 2 and Week 3 separately, it is also
observed that no statistical difference is found (Z= -0,733, p=0,464). This finding is
logical since the participants got more acquainted with variable-rate mechanism
already from week 2, resulting in non-significant but still lower levels of cognitive
load during week 3 (See Table 7).

31
5.1 Introduction
The first chapter of the study formulated the problem statement and research
questions. By means of the theoretical and empirical part, the research questions can
now be answered. This chapter interprets the results following from the experimental
part of the study and analyzes its limitations as well as managerial implications.
5.2 Key Conclusion
The main contribution of this study was to bridge the existing gap between the
theoretical approaches and the reality of EV charging by taking into account the
behavioral aspect of EV users (See paragraph 1.2). In addition, this study intended to
evaluate the best smart charging practices that would lead to a more efficient electric
grid. TamagoCar application played a crucial role in this quest, since it enabled the
users to interact with their smartphones by letting them intervene when they believed
this was appropriate.
The study resulted in the following key conclusions:
1. In line with the results of Valogianni et al. (2014), the introduction of
Variable-rate pricing mechanism significantly improved the observed
phenomenon of demand peaks when compared to the smart-pricing alternative
of Real-Time Pricing and led to an average PARP reduction of 80-87%. This
means that variable-rate pricing, which now has been tested both in a
simulated and in a reality scenario, tends to result in a significant smoothing of
the demand curve. The underlying reason pertains to the fact that EV users are
cost-minimizers and thus when they were to select based on a RTP scheme,
they were choosing only the cheapest time-frames. This in turn resulted in
great demand peaks (herding phenomena) during these hours (Figure 6),
which variable-rate pricing mechanism managed to smoothen.
2. Introducing a variable at parameter that was depending on the Retail Price did
not lead to an even better smoothing of the demand curve. This result was not
expected since variable at made prices more aggressive and this would have

32
incentivized users to distribute their charging profile in a more efficient way.
The result may be explained by the difficulty that the users were facing to
understand the underlying mechanism of variable-rate pricing already from
Week 2. As explained in paragraph 4.3 no significant difference was observed
in the cognitive load experienced in week 2 and week 3.
3. The cognitive load required by the students did not significantly change when
variable-rate pricing was introduced. This result implies that similar
mechanisms can be introduced in real-world initiatives without requiring
greater amounts of mental effort from the users, while simultaneously helping
in improving the efficiency of the electric grid.
5.3 Limitations
Before concluding with the managerial implications of the study, an overview of the
limitations of the experiment will be presented. This part aims at establishing the
limits of the present study while proposing modifications for future research
initiatives.
Firstly, the experiment was conducted in a smart mobile phone environment as part of
a university course. The 154 participants (students) were motivated to frequently use
the app in order to obtain a bonus grade in the course. This means that the result could
have been different if the mechanism was applied in a real-world experiment with real
EV drivers. In this case the drivers would have had real motives to use the app in
order to save money on their charging costs. Nevertheless, the study presented an
interface of real-time pricing mechanisms that could already be applied to real-world
experiments and is user friendly (See Figure 4). In addition it confirmed that variable-
rate pricing can lead to a more efficient grid.
Related to the first limitation, it should be underlined that our sample was of a really
young age (Mean age: 23), which can be considered as a rather tech-savvy sample.
This fact was augmented by the academic background of the participants, who were
attending the Master in Business Information Management. By changing the profile of
our sample, different results could have been observed.
Finally, a major limitation of the study resulted from several GPS/location
miscalculations that occurred during the experiment. When using the commute

33
functionality, some participants noticed that the app calculated more kilometers than
they actually were doing. To counterbalance this phenomenon, a data clearing based
on the commute speed was conducted before the experimental treatment (paragraph
4.2). However, it should be mentioned that this effect did not influence the results of
the study, since the charging patterns (research objective) were accurately measured.
5.4 Managerial Implications
In light of the continuous increase of renewable sources of energy in the global energy
mix as well as the fast acceleration of electric mobility, innovative ways of increasing
demand flexibility are imperative. This study resulted in two main managerial
implications on how EV charging can optimally be organized to secure an efficient
electric grid, while taking into account the behavioral aspect of the EV driver.
From the side of the grid operator
Real-time pricing without a dynamic proposal creates herding in times when retail
prices are low. Herding in turn creates demand peaks and destabilizes the grid. For a
successful peak reduction, variable-rate pricing mechanism is proposed. With this
method, pricing is not only related to the retail prices, but also to the amount of
capacity desired by the EV drivers. The study presented a 77-82% reduction in peak
load when moving from Real-Time Pricing to variable-rate pricing.
From the side of the driver
The study revealed that intelligent agents can actually work with and support humans.
Through the usage of a smart phone application, people can monitor and in many
cases override the decisions of the agents if they think this is appropriate.
Additionally, the interaction between human and intelligent agent does not seem to
cognitively overload the users and thus such a methodology is proposed for future
real-world experiments.
34
Barbose, G., Goldman, C., Neenan, B., 2004. A survey of utility experience with real
time pricing. Lawrence Berkeley National Laboratory.
Borenstein, S., 2005. The long-run efficiency of real-time electricity pricing. The
Energy Journal, 93-116.
Chang, C.-C., & Yang, F.-Y. (2010). Exploring the cognitive loads of high-school
students as they learn concepts in web-based environments. Computers &
Education, 55(2), 673–680. http://doi.org/10.1016/j.compedu.2010.03.001
Clement-Nyns, K., Haesen, E., Driesen, J., 2010. The impact of charging plug-in
hybrid electric vehicles on a residential distribution grid. Power Systems, IEEE
Transactions on 25, 371-380.
Dütschke, E., Paetz, A.-G., 2013. Dynamic electricity pricing—Which programs do
consumers prefer? Energy Policy 59, 226-234.
EIA, U. (2015). International Energy Outlook 2013. US Energy Information
Administration, Washington, DC. Retrieved from:
http://www.eia.gov/forecasts/ieo/pdf/0484%282013%29.pdf
EIA,U. (2015). International Energy Outlook 2014. US Energy Information
Administration, Washington, DC. Retrieved from:
http://www.eia.gov/beta/aeo/#/?id=15-IEO2014®ion=4
0&cases=Reference&start=2005&end=2040&f=Q&linechart=15-IEO2014.2.
Enel. 2015. Endesa and Nissan Creating E-Mobility 2.0. Retrieved from:
https://www.enel.com/en-GB/media/news/endesa-and-nissan-creating-e-
mobility-2-0/p/090027d98244a9aa
EU-Commission. 2014. Retrieved from http://ec.europa.eu/clima/policies/g-
gas/index_en.htm
Faruqui, A., Sergici, S., 2010. Household response to dynamic pricing of electricity: a
survey of 15 experiments. Journal of Regulatory Economics 38, 193-225.
Gottwalt, S., Ketter, W., Block, C., Collins, J., Weinhardt, C., 2011. Demand side
management—A simulation of household behavior under variable prices. Energy
Policy 39, 8163-8174.
Hunt, T., 2014. Utilities Are Building the Infrastructure for California’s Shift to EVs.
Retrieved from http://www.greentechmedia.com/articles/read/california-steps-
up-again-on-electric-vehicles
Herter, K., 2007. Residential implementation of critical-peak pricing of electricity.
Energy Policy 35, 2121-2130.

35
Kahlen, M., Valogianni, K., Ketter, W., van Dalen, J., 2012. A profitable business
model for electric vehicle fleet owners, Smart Grid Technology, Economics and
Policies (SG-TEP), 2012 International Conference on. IEEE, pp. 1-5.
Kempton, W., Letendre, S.E., 1997. Electric vehicles as a new power source for
electric utilities. Transportation Research Part D: Transport and Environment 2,
157-175.
Kempton, W., Tomić, J., 2005. Vehicle-to-grid power fundamentals: Calculating
capacity and net revenue. Journal of power sources 144, 268-279.
Ketter, W., Collins, J., Gini, M., Gupta, A., & Schrater, P. (2012). Real-time tactical
and strategic sales management for intelligent agents guided by economic
regimes. Information Systems Research, 23(4), 1263-1283.
Ketter, W., Peters, M., Collins, J., and Gupta, A. (2015). A multiagent competitive
gaming platform to address societal challenges. MIS Quarterly, Forthcoming.
Kihm, A., Trommer, S., 2014. The new car market for electric vehicles and the
potential for fuel substitution. Energy Policy 73, 147-157.
Koroleva, K., Kahlen, M., Ketter, W., Rook, L., Lanz, F., 2014. TamagoCar: Using a
Simulation App to explore Price Elasticity of Demand for Electricity of Electric
Vehicle Users.
Kromer, M.A., 2007. Electric powertrains: opportunities and challenges in the US
light-duty vehicle fleet. Massachusetts Institute of Technology.
Lyon, T.P., Michelin, M., Jongejan, A., Leahy, T., 2012. Is “smart charging” policy
for electric vehicles worthwhile? Energy Policy 41, 259-268.
Maes, P. (1994). Agents that reduce work and information overload. Communications
of the ACM, 37(7), 30–40. http://doi.org/10.1145/176789.176792
Masters, G.M., 2013. Renewable and efficient electric power systems. John Wiley &
Sons.
Mohsenian-Rad, A.-H., Wong, V.W., Jatskevich, J., Schober, R., Leon-Garcia, A.,
2010. Autonomous demand-side management based on game-theoretic energy
consumption scheduling for the future smart grid. Smart Grid, IEEE Transactions
on 1, 320-331.
Moura, S.J., Fathy, H.K., Callaway, D.S., Stein, J.L., 2011. A stochastic optimal
control approach for power management in plug-in hybrid electric vehicles.
Control Systems Technology, IEEE Transactions on 19, 545-555.
Paas, F. G. W. C., & Van Merriënboer, J. J. G. (1994). Instructional control of
cognitive load in the training of complex cognitive tasks. Educational
Psychology Review, 6(4), 351–371. http://doi.org/10.1007/BF02213420

36
Peterson, S.B., Whitacre, J., Apt, J., 2010. The economics of using plug-in hybrid
electric vehicle battery packs for grid storage. Journal of Power Sources 195,
2377-2384.
Rathnayaka, A.D., Potdar, V.M., Hussain, O., Dillon, T., 2011. Identifying prosumer's
energy sharing behaviours for forming optimal prosumer-communities, Cloud
and Service Computing (CSC), 2011 International Conference on. IEEE, pp.
199-206.
Rotering, N., Ilic, M., 2011. Optimal charge control of plug-in hybrid electric vehicles
in deregulated electricity markets. Power Systems, IEEE Transactions on 26,
1021-1029.
Salies, E., 2013. Real-time pricing when some consumers resist in saving electricity.
Energy Policy 59, 843-849.
Saunders, M., Lewis, P., 2012. Doing research in business and management: An
essential guide to planning your project. Financial Times Prentice Hall.
Schleicher-Tappeser, R., 2012. How renewables will change electricity markets in the
next five years. Energy policy 48, 64-75.
Son, Y.-S., Pulkkinen, T., Moon, K.D., Kim, C., 2010. Home energy management
system based on power line communication. Consumer Electronics, IEEE
Transactions on 56, 1380-1386.
Stamminger, R., Broil, G., Pakula, C., Jungbecker, H., Braun, M., Rüdenauer, I.,
Wendker, C., 2008. Synergy potential of smart appliances. Report of the Smart-
A project.
Statistics, L. ,2015. Laerd Statistics. Retrieved from https://statistics.laerd.com/
Sweller, J., Merrienboer, J. J. G. van, & Paas, F. G. W. C. (n.d.). Cognitive
Architecture and Instructional Design. Educational Psychology Review, 10(3),
251–296. http://doi.org/10.1023/A:1022193728205
Trigg, T., Telleen, P., Boyd, R., Cuenot, F., D’Ambrosio, D., Gaghen, R., Gagné, J.,
Hardcastle, A., Houssin, D., Jones, A., 2013. Global EV outlook: Understanding
the electric vehicle landscape to 2020. IEA, Paris, France.
Valogianni, K., Ketter, W., Collins, J., 2015. A multiagent approach to variable-rate
electric vehicle charging coordination, Proceedings of the 2015 International
Conference on Autonomous Agents and Multiagent Systems. International
Foundation for Autonomous Agents and Multiagent Systems, pp. 1131-1139.
Vandael, S., Claessens, B., Hommelberg, M., Holvoet, T., Deconinck, G., 2013. A
scalable three-step approach for demand side management of plug-in hybrid
vehicles. Smart Grid, IEEE Transactions on 4, 720-728.

37
Van Jaarsveldt, J., 2015. Utrecht debuts solar powered car chargers. Retrieved from:
http://www.nltimes.nl/2015/06/10/utrecht-debuts-solar-powered-car-chargers/
Vicente, A., 2011. Laying the foundations for greener transport. TERM 2011:
Transport indicators tracking progress towards environmental targets in Europe,
EEA Report 7/2011. European Environment Agency, Copenhagen, Denmark.