Master of Science Thesis - COnnecting REpositories · 4.6 Discussion on power plant characteristics...
125
LAPPEENRANTA UNIVERSITY OF TECNOLOGY DEPARTMENT OF ELECTRICAL ENGINEERING Laboratory of Electricity Markets and Power Systems ______________________________________________________________ Master of Science Thesis Assessment of Environmental Impacts of Power Generation Examiners: Professor Satu Viljainen Professor Jarmo Partanen Author: Niko Jauhiainen __________________ Sepänkatu 41 A 3 Niko Jauhiainen 80100, Joensuu +358 – 407183370
Transcript of Master of Science Thesis - COnnecting REpositories · 4.6 Discussion on power plant characteristics...

LAPPEENRANTA UNIVERSITY OF TECNOLOGY DEPARTMENT OF ELECTRICAL ENGINEERING Laboratory of Electricity Markets and Power Systems______________________________________________________________
Master of Science Thesis
Assessment of Environmental Impacts of Power Generation
Examiners: Professor Satu Viljainen Professor Jarmo Partanen
Author: Niko Jauhiainen __________________
Sepänkatu 41 A 3 Niko Jauhiainen
80100, Joensuu
+358 – 407183370

Preface This master’s thesis was made in Czech Technical University in Prague under supervision
of Professor Jiří Tůma from the department of power systems.
I would like thank Prof. Ing. Jiří Tůma, DrSc for supervising my master thesis and for
helping and advising me with his expert knowledge. In addition I would like to thank
Professor Satu Viljainen for all the help and advice she gave me in the end of the project.
I also would like to thank my family and friends for all the strong support that they gave
me during my studies.

Abstract Author: Niko Jauhiainen
Name: Assessment of Environmental Impacts of Power Generation
Department: Electrical Engineering / Electricity Markets
Year: 2008
Place: Prague
Master’s thesis, Lappeenranta University of Technology
125 pages, 42 figures, 33 tables and 2 appendices
Examiners: Professor Satu Viljainen
Professor Jarmo Partanen
Keywords: power generation, environmental impact, climate change, renewable energy
source
Through indisputable evidence of climate change and its link to the greenhouse gas
emissions comes the necessity for change in energy production infrastructure during the
coming decades. Through political conventions and restrictions energy industry is pushed
toward using bigger share of renewable energy sources as energy supply. In addition to
climate change, sustainable energy supply is another major issue for future development
plans, but neither of these should come with unbearable price. All the power production
types have environmental effects as well as strengths and weaknesses. Although each
change comes with a price, right track in minimising the environmental impacts and
energy supply security can be found by combining all possible low-carbon technologies
and by improving energy efficiency in all sectors, for creating a new power production
infrastructure of tolerable energy price and of minor environmental effects.
GEMIS-Global Emission Model for Integrated Systems is a life-cycle analysis program
which was used in this thesis to make indicative energy models for Finland’s future energy
supply. Results indicate that the energy supply must comprise both high capacity nuclear
power as well as large variation of renewable energy sources for minimization of all
environmental effects and keeping energy price reasonable.

Assessment of Environmental Impacts of Power Generation
1
Table of contents
1 Introduction................................................................................................................. 10 2 Environment and Power Industry ............................................................................... 11
2.1 Energy consumption and emissions.................................................................... 11 2.1.1 Global and Europe’s energy production and consumption......................... 11 2.1.2 Energy consumption in EU......................................................................... 13
2.2 Climate change ................................................................................................... 15 2.3 Intergovernmental Panel on Climate Change ..................................................... 16 2.4 Greenhouse gases................................................................................................ 16
3 Environmental policies ............................................................................................... 19 3.1 International climate conventions ....................................................................... 19
3.1.1 United Nations Framework Convention on Climate Change ..................... 19 3.1.2 The Kyoto Protocol..................................................................................... 19 3.1.3 European Climate Change Programme....................................................... 22 3.1.4 Emissions trading and Kyoto mechanisms ................................................. 23 3.1.5 Renewable energy roadmap of EU ............................................................. 24
3.2 Environmental issue areas .................................................................................. 25 3.2.1 Air ............................................................................................................... 25 3.2.2 Water........................................................................................................... 26 3.2.3 Waste and residues...................................................................................... 27 3.2.4 Other issues................................................................................................. 27
3.3 Environmental management ............................................................................... 28 3.3.1 Environmental Management systems ......................................................... 28 3.3.2 Environmental Impact Assessment............................................................. 28 3.3.3 Green certificates ........................................................................................ 29 3.3.4 Eco-labelling ............................................................................................... 29 3.3.5 Feed-in tariff ............................................................................................... 29
3.4 Environmental protection and permitting ........................................................... 30 3.5 Fiscal measures and instruments......................................................................... 30
4 Energy production technologies ................................................................................. 31 4.1 Principles of power production........................................................................... 31 4.2 Conventional condensing power plants .............................................................. 34
4.2.1 Back-pressure power generation................................................................. 35 4.2.2 Gas-Turbine generation .............................................................................. 36 4.2.3 Combined Heat and Power ......................................................................... 36
4.3 Nuclear power..................................................................................................... 37 4.4 Renewable energy............................................................................................... 39
4.4.1 Hydropower ................................................................................................ 39 4.4.2 Wind power................................................................................................. 41 4.4.3 Biomass energy........................................................................................... 42 4.4.4 Other renewable energy sources ................................................................. 43
4.5 Carbon Capture and Storage ............................................................................... 44 4.5.1 Carbon capture ............................................................................................ 44 4.5.2 Carbon storage ............................................................................................ 46 4.5.3 Policies........................................................................................................ 48
4.6 Discussion on power plant characteristics .......................................................... 49 5 Power generations effects on environment ................................................................. 52
5.1 Effects from solid fuels....................................................................................... 55

Assessment of Environmental Impacts of Power Generation
2
5.2 Effects from fossil fuels ...................................................................................... 57 5.3 Nuclear power..................................................................................................... 58 5.4 Hydropower ........................................................................................................ 60 5.5 Wind power......................................................................................................... 61 5.6 Solar power, photo voltaic .................................................................................. 63 5.7 Assessment of total environmental effects ......................................................... 64 5.8 Measures for effect reductions............................................................................ 66
6 Economical aspects..................................................................................................... 68 6.1 Relation between environment and economics................................................... 68 6.2 Effects of Climate Change .................................................................................. 70
6.2.1 The Stern Review........................................................................................ 71 6.2.2 Criticism on the Stern Review .................................................................... 72 6.2.3 Reflection on Stern review.......................................................................... 75
7 Scenario calculation on Finland energy production.................................................... 76 7.1 About GEMIS and life-cycle analysis ................................................................ 76
7.1.1 The life cycle assessment method............................................................... 77 7.1.2 Stages of LCA............................................................................................. 78 7.1.3 GEMIS and LCA process ........................................................................... 82 7.1.4 GEMIS database, processes, products and scenarios.................................. 83
7.2 Research of Pöyry Energy Oy............................................................................. 88 7.3 Electricity production and demand predictions in Finland ................................. 90 7.4 Assumptions on electricity generation possibilities............................................ 94
7.4.1 Hydropower ................................................................................................ 94 7.4.2 Wind power................................................................................................. 96 7.4.3 Biomass....................................................................................................... 96 7.4.4 Nuclear power............................................................................................. 96 7.4.5 Condensing power plants and CCS ............................................................ 97
7.5 The task and targets of the review ...................................................................... 97 7.6 Modelling Finland energy production structure with GEMIS............................ 98
7.6.1 Energy models for Finland.......................................................................... 98 7.6.2 Results....................................................................................................... 103 7.6.3 Environmental effects ............................................................................... 104 7.6.4 Economic aspects...................................................................................... 108 7.6.5 Capacity .................................................................................................... 111
8 Conclusions............................................................................................................... 113 9 References................................................................................................................. 116 ANNEX I ANNEX II

Assessment of Environmental Impacts of Power Generation
3
List of Tables Table 2.1 EU electricity sector emissions in 2005 .................................................... 14
Table 2.2 Gases and their GWP values compared to CO2 ......................................... 17
Table 3.1 Share of emissions in year 1990 ................................................................ 20
Table 3.2 Emissions targets from the Kyoto Protocol ............................................... 21
Table 3.3 EU15 burden sharing for achievement of EU 8 % emissions reductions .. 21
Table 3.4 Requirements of shares of renewable energy for member countries .......... 24
Table 3.5 ELVs for SO2 and NOx for plants to be built after 2003 ........................... 26
Table 4.1 Costs of storage of CO2 .............................................................................. 48
Table 4.2 Role of different electricity generation methods ........................................ 49
Table 5.1 Environmental effects in scale from different energy supplies ................. 55
Table 5.2 Example of nuclear fuel chains taxonomy ................................................. 58
Table 5.3 Dose estimates for the public and workers from major fuel cycle stages of
nuclear power ............................................................................................. 59
Table 5.4 Effects from hydropower during construction and operation .................... 61
Table 5.5 Stages and effects from wind power .......................................................... 62
Table 5.6 Example on emissions from 500 kW wind turbine from Denmark ........... 62
Table 5.7 Example of Solar PV emissions during whole life-cycle ........................... 63
Table 7.1 Life cycle impact categories ...................................................................... 81
Table 7.2 Interconnection capacities from Finland .................................................... 92
Table 7.3 Hydropower production estimates from three Nordic countries used in
Pöyry Energy research ............................................................................... 95
Table 7.4 Wind power production ............................................................................. 96
Table 7.5 Finland’s energy production in year 2007 by energy sources .................... 98
Table 7.6 Finland’s energy production in year 2015 by energy sources .................... 99
Table 7.7 Finland’s energy production in year 2020 by energy sources .................. 100
Table 7.8 Base for Finland’s energy production in year 2030 by energy sources.... 101
Table 7.9 Finland’s energy production in year 2030 scenarios by energy sources .. 101
Table 7.10 Shares of energy sources in model scenarios of 2030 .............................. 102
Table 7.11 Greenhouse gases from the models calculated by GEMIS including waste
treatment, mobile transport and construction ........................................... 105
Table 7.12 Greenhouse gases from the models calculated by GEMIS excluding waste
treatment, mobile transport and construction ........................................... 105

Assessment of Environmental Impacts of Power Generation
4
Table 7.13 Airborne emissions from the models calculated by GEMIS including waste
treatment, mobile transport and construction ........................................... 106
Table 7.14 Airborne emissions from the models calculated by GEMIS including waste
treatment, mobile transport and construction ........................................... 107
Table 7.15 Division of costs in different models into categories, including waste
treatment, mobile transport and construction ........................................... 109
Table 7.16 Division of costs in different models into categories, excluding waste
treatment, mobile transport and construction ........................................... 109
Table 7.17 Total peak load capacity need in models .................................................. 112
List of Figures Figure 2.1 World electricity generation by fuel .......................................................... 12
Figure 2.2 Worlds final consumption of energy .......................................................... 12
Figure 2.3 EU-25’s energy consumption in 2004 ........................................................ 13
Figure 2.4 EU-25 electricity production from 1990 – 2004 and projections for 2010,
2020 and 2030............................................................................................. 14
Figure 2.5 Graph showing deviation of temperature from 1890 (thin line) and CO2
concentration (thick line) ............................................................................ 15
Figure 2.6 Global anthropogenic GHG emissions ....................................................... 18
Figure 4.1 Schematic supply-stack............................................................................... 33
Figure 4.2 Condensing power plants process .............................................................. 35
Figure 4.3 BPP plants process...................................................................................... 36
Figure 4.4 Gas-turbine power plants process .............................................................. 36
Figure 4.5 Combined-cycle-process for combined power and heat production .......... 37
Figure 4.6 PWR-nuclear power plant process ............................................................. 38
Figure 4.7 Structure of costs for nuclear, coal and gas energy ................................... 39
Figure 4.8 Hydroelectric dam schematic picture.......................................................... 41
Figure 4.9 Schematic diagram of tree main CCS technologies ................................... 45
Figure 4.10 Principle of carbon capture and storage ..................................................... 47
Figure 4.11 Investment costs of different generation types .......................................... 50
Figure 5.1 Radiological effects from nuclear power ................................................... 60
Figure 5.2 Total GHG emission generated by power production chains CO2,eq ......... 65
Figure 6.1 Environmental Kuznet’s curve .................................................................. 69

Assessment of Environmental Impacts of Power Generation
5
Figure 6.2 De-coupling: the relationship between GDP, emissions and energy
consumption in 2002................................................................................... 70
Figure 6.3 Estimates of Climate change costs.............................................................. 73
Figure 6.4 Ramsey’s rule on saving ............................................................................ 73
Figure 6.5 Example with possible market interest 3,3 %............................................. 74
Figure 7.1 Stages of LCA ............................................................................................ 79
Figure 7.2 Single unit-process...................................................................................... 80
Figure 7.3 LCA process with GEMIS.......................................................................... 82
Figure 7.4 GEMIS and LCI and LCIA......................................................................... 83
Figure 7.5 Energy production chain and effects caused during the processes ............ 86
Figure 7.6 Process chain in GEMIS ............................................................................. 87
Figure 7.7 Price formation in ELMO-model................................................................ 90
Figure 7.8 Electricity production divided by sources in 2007 .................................... 91
Figure 7.9 Finland’s power supply in 2007.................................................................. 91
Figure 7.10 Peak-time capacity demand and available capacity in Finland from 2003
until 2030, separate el. prod. means condensing power supply ................. 93
Figure 7.11 Finland’s energy consumption and forecast .............................................. 94
Figure 7.12 Demand and supply in Finland in years 2007, 2015, 2020 and 2030, open
position is filled with imported energy ..................................................... 104
Figure 7.13 Results of CO2 equivalent calculations from GEMIS when waste treatment,
mobile transport and construction are included ........................................ 106
Figure 7.14 Airborne emissions from energy models .................................................. 108
Figure 7.15 External and Internal costs of models....................................................... 110
Figure 7.16 Investment costs of energy models ........................................................... 110
Figure 7.17 Specific costs of energy models................................................................ 111
Figure 7.18 Peak capacity and demand when 6 % wind is available........................... 112

Assessment of Environmental Impacts of Power Generation
6
List of Acronyms and Variables Acronyms
AOX Absorbable Organic Halogens
AQFWD Air Quality Framework Directive
ART Advanced Renewable Tariff
BAT Best Available Technique
BOD Biological Oxygen Demand
BPP Back-Pressure Power
BWR Boiling Water Reactor
CANDU Canadian Deuterium Uranium-Reactor
CCGT Combined Cycle Gas Turbines
CCS Carbon Capture and Storage
CDM Clean Development Mechanism
CEC Cumulated Energy Cost
CER Cumulated Energy Requirement
CHP Combined Heat and Power
CH4 Methane
CMR Cumulated Material Requirement
CO Carbon monoxide
COD Chemical Oxygen Demand
COP Conference of Parties
CO2 Carbon dioxide
ECCP European Climate Change Programme
EIA Environmental Impact Assessment
ELV Emission Limit Value
EMAS International standard for environmental management
EMS Environmental Management System
EPR European Pressure Reactor
ERU Emission Reduction Unit
EU European Union
FENCH Full Energy Chain calculation
FGD Flue-Gas-Desulphurization
FIT Feed-In Tariff

Assessment of Environmental Impacts of Power Generation
7
GEMIS Global Emissions Model for Integrated Systems
GHG Greenhouse Gas
GhK Gesamthochschule Kassel
GWP Global Warming Potential
HF Hydrogen Fluorine
HFC Hydro Fluorocarbon
IEA International Energy Agency
IGCC Integrated Gasification Combined Cycle
IOA Input-Output Analysis
IPCC Intergovernmental Panel on Climate Change
IPPC Integrated Pollution Prevention and Control
ISO International Standardisation Organisation
LCA Life-Cycle Analysis / Life-Cycle Assessment
LCI Life-Cycle Inventory Analysis
LCIA Life-Cycle Impact Assessment
LCPD Large Combustion Plant Directive
N Nitrogen
NECD National Emission Ceiling Directive
NH3 Ammonia
NMOVOC Non-methane Volatile Organic Compound
NOx Nitrogen Oxides
N2O Nitrous Oxide
OECD Organisation for Economic Co-operation and Development
P Phosphor
PCB Polychlorinated Biphenyl
PCT Polychlorinated Terphenyl
PFC Per-fluorocarbon
PM Total Suspended Particulate Matter
PM1 Particulate Matter ≤1 µm in Aerodynamic Diameter
PM2.5 Particulate Matter ≤2,5 µm in Aerodynamic Diameter
PM10 Particulate Matter ≤10 µm in Aerodynamic Diameter
ppm Parts Per Million
PV Photo Voltaic

Assessment of Environmental Impacts of Power Generation
8
PWR Pressure Water Reactor
RES Renewable Energy Source
REV Reference Emission Value
SF6 Sulphur-hexafluoride
TEMIS Total Emissions Model for Integrated Systems
TOPP Tropospheric O-zone Precursor Potential
UNEP United Nations Environment Program
UNFCCC United Nations Framework Convention on Climate Change
WFD Water Framework Directive
WMO World Meteorological Organisation
WWEA World Wind Energy Association
Variables
A GDP per capita, €
Amaz income where T reaches Tmax
c0 Consumption in time 0
c1 Consumption in time 1
ch Heat Capacity of fluid, kJ/kgC
cp Coefficient of performance
ECi Efficiency of control equipment for reaction of emissions of
pollutant i, %
eF Fuel consumption expressed as an energy flow rate, GJ/y
eFi Estimated fuel consumption by combustion device i, GJ/y for
gas or L/y for liquid fuels
EFi Factor for emissions of pollutant I from specified type of
source, GJ/y for gas or L/y for liquid fuels
Ei Emissions of pollutant I form specified source (t/y)
g Acceleration due to gravity, ~9,81 m/s2
gc Conversion factor for kJ/s to GJ/y
H Effective pressure head of water across the turbine, m
ho Outlet Enthalpie, kJ/kg
hi Inlet Enthalpie, kJ/kg
I Environmental impact

Assessment of Environmental Impacts of Power Generation
9
m Mass flow rate of process fluid, kJ/kgC
η Thermal efficiency, %
PW Power, W
P Population
Q Volume flow rate, m3/s
T Technology
t0 Annual operating hours
Tmaz maximum value of T
v Wind speed, m/s
ρ Density of air, kg/m3
ηg Efficiency of generator
ηb Efficiency of gearbox/bearings
εlow income elasticity of T at low incomes
εhigh income elasticity of T at high incomes
δ Discount rate
γ Flexibility of financial benefit

Assessment of Environmental Impacts of Power Generation
10
1 Introduction
Energy sector is going to go through changes during the following decades. Prices of fossil
fuels have gone up and concern for environmental effects caused by the use of fossil fuels
have aroused interest in changing current energy infrastructure for more sustainable and
less polluting. Energy sector is one of the biggest sources of greenhouse gas emission
source in the world, therefore big part of the change has to happen in this sector. Change
can be made by switching to renewable energy sources or to other low emission
production types. One possibility is also to invest in emission reducing technologies for
existing plants or equipping new plants with them. But, as a matter of fact, these renewable
energy sources and low emission production types have also environmental effects.
Moreover, switching to these production methods comes with higher expenses.
Aim of this thesis was to examine legislative, technical and economical aspect involved in
environmental effects caused by power generation and to form an opinion how power
generation infrastructure should evolve with consideration of all these three
aforementioned aspects.
This thesis begins with theory part by describing current situation in the world concerning
energy and environment, in addition how environment is effected by human activities.
Thesis continues by describing environmental legislations and conventions that influence
energy industry followed by chapters describing the principles of power generation types
and environmental effects caused by them.
Chapter 7 is practical part of the thesis where a case examination was made. Computations
of the case were made with program GEMIS for generating scenarios for Finland’s energy
production in 2007, 2015, 2020 and three different models for 2030. Computations for the
scenarios environmental effects were made with Life-cycle Assessment method which the
GEMIS uses. The method and GEMIS are further described in chapter 7.

Assessment of Environmental Impacts of Power Generation
11
2 Environment and Power Industry
Power industry and environment hold a link between each other through which there are
effects both ways. Energy industry has environmental impacts through its activities and the
effects may change the essence of the environment e.g. by causing climate change, which
in turn has harmful impacts on industrial processes and world economy. This chapter will
explain the evolution of power generation and shares of natural resources used in the
world. Furthermore, climate change and its causes are explained.
2.1 Energy consumption and emissions
Power systems consist of power generation, power transmission and distribution and
finally consumption of energy. This report will concentrate on the power generations
environmental effects due to the fact that it is the largest contributor of environmental
effects caused by the energy sector. /1/
2.1.1 Global and Europe’s energy production and consumption
Energy consumption has increased during last decades evenly and largest share of it is
produced with fossil fuels. Consumption of energy is also expected to rise with steady
pace while the global economy is rising. From the worlds electricity supply 66,6 % was
produced with fossil fuels in the year 2005. From total energy supply in the world, the
share of fossil fuels was 82,8 % in year 2005. Figure 2.1 shows the evolution of electricity
generation in the world from 1971 until 2005. / 2/

Assessment of Environmental Impacts of Power Generation
12
Figure 2.1 World electricity generation by fuel /2/
From final consumption of energy oil holds the largest share. Electricity’s share of final
consumption of energy was 16,3 % in 2005. Oil’s share was 43,4 %. Figure 2.2 describes
the evolution of world final consumption of energy from 1971 to 2005. /2/
Figure 2.2 Worlds final consumption of energy /2/

Assessment of Environmental Impacts of Power Generation
13
2.1.2 Energy consumption in EU
Primary energy consumption in EU has been projected to grow during 1990 – 2010 by
average of 1 % per year. Growth of consumption differs across the member countries. 75
% of EU’s energy consumption was satisfied by energy from fossil fuels sources in 2007
and largest energy source was oil with 37 % share. Figure 2.3 represents the shares of
energy sources used for energy in 2004. /3/
Figure 2.3 EU-25’s energy consumption in 2004 /3/
Energy sources used for electricity production in EU are shown on figure 2.4.
Furthermore, some projections for future production are shown. Largest single source is
nuclear power with share of 31 % and fossil fuels cover 53,9 % from total energy
produced. /3/
EU-25 Energy consumption in 2004
Renewables 6%
Nuclear 15 %
Natural gas 24 %
Coal and lignite 18 %
Oil 37 %

Assessment of Environmental Impacts of Power Generation
14
Figure 2.4 EU-25 electricity production from 1990 – 2004 and projections for 2010, 2020 and 2030
/3//4/
CO2 emissions from electricity production in EU are mainly coming from coal-condensing
power plants. CO2 emissions coming from electricity and heat production are 31,8 % of
total CO2 emission in EU. Table 2.1 describes the greenhouse gas emission in EU are and
share of emissions from electricity and heat production in year 2005. /5/
Table 2.1 EU electricity sector emissions in 2005 /5/
Total emissions [Mt CO2 eq]
% of total GHG
emissions
Emissions from
electricity and heat
generation [Mt CO2 eq]
% of total emissions
from electricity and
heat generation
% of emissions
from electricity and heat
generation out of total
CO2 4259 82,5 1354 98,9 31,8
CH4 418 8,1 1 0,1
N2O 415 8 14 1 3,4
HFCs 57 1,1
PFCs 6 0,1
SF6 9 0,2
5144 100 1369 100

Assessment of Environmental Impacts of Power Generation
15
2.2 Climate change
Water vapour and some compounds, like carbon dioxide, which occur in small
concentrations in the atmosphere, are disrupting heat leaving from earth, thereby
increasing earth’s temperature. This natural greenhouse effect occurs in periods of time
and it can increase earth’s temperature by over 30 degrees of Celsius. /6/
Human activities such as using fossil fuels as energy source, has increased the amount of
greenhouse gases, thereby making the greenhouse effect stronger than normal. Studies
show that pre-industrial levels of carbon dioxide was about 280 ppm (parts per million),
and in year 2000 same level was 368 ppm, and growing approximately 1,5 ppm annually.
In methane’s case, the concentration in the atmosphere has doubled. According to
Intergovernmental Panel on Climate Change, Greenhouse effect, caused by greenhouse gas
concentration in atmosphere, has been calculated to raise earths average temperature by
1,4 – 5,8 °C by the year 2100. Effects from the temperature increase are estimated to raise
oceans water level by 0,1 – 0,9 m causing storms and hurricanes and changing
considerably earth’s humidity levels of soil, courses of ocean currents and the
precipitation. Figure 2.5 describes the deviation of temperature from year 1890 until 1990
and the change of CO2 concentration in atmosphere in parts per million (ppm). /7/
Figure 2.5 Graph showing deviation of temperature from 1890 (thin line) and CO2 concentration (thick
line) /7/
Assessment of Environmental Impacts of Power Generation
16
2.3 Intergovernmental Panel on Climate Change
The Intergovernmental Panel on Climate Change (IPCC) is a scientific intergovernmental
body set up by the World Meteorological Organization (WMO) and by the United Nations
Environment Programme (UNEP). Its constituency is made of /7/:
The governments: the IPCC is open to all member countries of WMO and UNEP.
Governments participate in plenary Sessions of the IPCC where the main decisions
about the IPCC work programme are taken and reports are accepted, adopted and
approved. They also participate on reviewing of IPCC Reports.
The scientists: hundreds of scientists all over the world contribute to the work of
the IPCC as authors, contributors and reviewers.
The people: as United Nations body, the IPCC work aims at the promotion of the
United Nations human development goals.
The IPCC was established to provide the decision-makers and others interested in climate
change with an objective source of information about climate change. “The IPCC does not
conduct any research nor does it monitor climate related data or parameters. Its role is to
assess on a comprehensive, objective, open and transparent basis the latest scientific,
technical and socio-economic literature produced worldwide relevant to the understanding
of the risk of human-induced climate change, its observed and projected impacts and
options for adaptation and mitigation” /7/. IPCC reports are supposed to be neutral with
respect to policy, although they need to deal objectively with policy relevant scientific,
technical and socio economic factors. They should be of high scientific and technical
standards, and aim to reflect a range of views, expertise and wide geographical coverage.
/7/
2.4 Greenhouse gases
In nature occurs temperature and climate changing in periods naturally, but this change
seems to have been accelerated to un-natural speed after industrialization of the world.
Main reason for this acceleration is caused by greenhouse gas (GHG) emissions, of which
carbon dioxide is largest single greenhouse gas. Approximately 75 % of all carbon dioxide
emissions are created from combustion process of fossil fuels (lignite, coal, oil and natural

Assessment of Environmental Impacts of Power Generation
17
gas). Also peat is considered as fossil fuel due to its long formation time, approximately
2000 – 3000 years. Destruction of rainforests also causes large amount of carbon dioxide
emissions. Methane emissions caused by human activities comes from waste dumps,
animal husbandry, production of fuel and cultivation of rice. Causes for nitrous oxide
emissions are nitrogenous eutrophication, production of nitric acid and combustion
processes. Nearly two-thirds of emissions in the world are coming from the activities
associated with electricity production and the transport sector. Electricity generation alone
accounts for third of over all global emissions. /6/
Greenhouse gases (GHG) are mostly natural part of nature, but there are also gases which
results of human activities. Naturally occurring GHG are /8/:
Carbon dioxide (C02)
Methane (CH4)
Nitrous oxide (N2O)
Un-naturally occurring, from industry processes emitted GHG are /8/:
Hydro-fluorocarbons (HFCs)
Perfluorocarbons (PFCs)
Sulphur hexafluoride (SF6),
IPCC has formulised a way to calculate the effects of different GHG. The Global Warming
Potential (GWP) is the measure of the ability of a gas to affect climate change compared to
a reference gas, which is CO2. The atmospheric lifetime of gases differs highly e.g.
methane stays in atmosphere for 20 years and nitrous oxide stays for over 100 years.
Therefore, the results are integrated over different time intervals. Table 2.2 shows GWP
values that have been calculated with 100 year time horizon. /7/
Table 2.2 Gases and their GWP values compared to CO2 /7/
Gas type GWP values Carbon dioxide (CO2) 1 Methane (CH4) 23 Nitrous Oxide (N2O) 296 Sulphur hexafluoride (SF6) 22.200 Tetrafluoromethane (CF4) 6.500 Hydrofluorocarbons (HFCs) 1.300 Chlorofluorocarbons (CFCs) 9.300 Hydrochlorofluorocarbons (HCFCs) 1.700

Assessment of Environmental Impacts of Power Generation
18
Calculations of emissions in this thesis have been made with multiplying emissions from
all other than CO2 gases with the GWP value to make them comparable. All emissions are
then summed up together as CO2 equivalents. Figure 2.6 shows the change of CO2,eq in the
world from 1970 until 2004. /7/
Figure 2.6 Global anthropogenic GHG emissions /7/ a) Global annual emissions for anthropogenic
GHGs from 1970 – 2004, b) Share of different anthropogenic GHGs in total emissions in
2004 in terms of CO2-eq, c) Share of different sectors in total anthropogenic GHG emissions
in 2004 in terms of CO2 e.g. forest includes deforestation
As the climate problem is global, solution for the problem has to be found in global level
and continued down with the pyramid to state and consumer level. Following chapters will
explain more of conventions and framework in different scales to counter and minimize
the effects of electricity industry.
CO2 fossil fuel use 56,6 %
CO2 (other) 2,8 %
CO2 (deforestation, decay of biomass, etc) 17,3 %
CH4 14,3 %
N2O 7,9 %
F-gases 1,1 %
Energy supply 25,9 %
Transport 13,1 %
Residential and commercial buildings 7,9 %
Industry 19,4 %
Agriculture 13,5 %
Forestry 17,4 %
Waste and wastewater 2,8 %
b)
c)
0 5
10 15 20 25 30 35 40 45 50
1970 1980 1990 2000 2004
GtC
O2-e
q /y
r
CO2 from fossil fuel use and other sources CH4 from agriculture, waste and energy
CO2 from deforestation, decay and peat N2O from agriculture and others
a)

Assessment of Environmental Impacts of Power Generation
19
3 Environmental policies
Environmental legislations and regulations have a huge impact on the electricity industry
and the price of electricity and fuel. These rules and regulations set up framework, in
which electricity industry has to operate. These laws come from both international and
domestic front and their instruments for environmental framework can be divided into
legislative and non-legislative instruments, depending on the nature of the legal acts. Some
are meant to be strict laws when others are voluntary agreements to motivate industry to
lower their emissions.
3.1 International climate conventions
This Chapter will describe how the power industry is affecting specific environmental
areas and describes the legislations and regulations for these areas mostly inside EU. List
of all directives and decision effecting energy industry in EU can be found in Annex I. /9/
3.1.1 United Nations Framework Convention on Climate Change
United Nations Framework Convention on Climate Change (UNFCCC), international
treaty, was set up on 21 March 1994, to set up overall framework to cope with climate
change challenges. Essentially convention sees that global climate has been and is being
affected by emissions of GHGs and the responsibility for this has to be shared. Convention
has members from 192 States. /10/
Under the Convention, governments are to /10/:
gather and share information on greenhouse gas emissions, national policies and
best practices
launch national strategies for addressing greenhouse emissions and adapting to
expected impacts, including the provision of financial and technological support to
developing countries
cooperate in preparing for adaptation to the impacts of climate change
3.1.2 The Kyoto Protocol
Member states of UNFCCC saw that their commitments were not adequate enough to slow
down the climate change, so governments decided that stronger and more detailed
commitments had to be made. Kyoto Protocol, self-standing agreement negotiated within

Assessment of Environmental Impacts of Power Generation
20
the member states of UNFCCC was adopted at Conference of Parties (COP) 3 in Kyoto,
Japan, on 11 December 1997. /10/
Requirements of the Protocol states that developed countries have to reduce their GHG
emissions (CO2, N2O, CH4, SF6, PFC and HFC) within a five-year timeframe between
2008 and 2012, by at least 5,2 % against the baseline of 1990 level. Burden of emissions
cuts are shared by all countries, though heavier burden is placed upon developed countries,
for they have historically contributed more to the problem compared with developing
countries. To European Union the commitment to reduce GHG emissions were 8 % during
the target period 2008 to 2012. Table 3.1 shows the share of world emissions contributed
by single countries in the year 1990. /10/
Table 3.1 Share of emissions in year 1990 /9/
Country Emissions [%] Country Emissions
[%] Country Emissions [%]
Australia 2,1 Greece 0,6 Netherlands 1,2
Austria 0,4 Hungary 0,5 New Zealand 0,2
Belgium 0,8 Iceland 0,0 Norway 0,3
Bulgaria 0,6 Ireland 0,2 Poland 3,0
Canada 3,3 Italy 3,1 Portugal 0,3 Czech Republic 1,2 Japan 8,5 Russian
Federation 17,4
Denmark 0,4 Latvia 0,2 Slovakia 0,4
Estonia 0,3 Lichtenstein 0,0 Spain 1,9
Finland 0,4 Romania 1,2 Sweden 0,4
France 2,7 Luxembourg 0,1 Switzerland 0,3 Germany 7,4 Monaco 0,0 UK 4,3 USA 36,1
Kyoto protocol affects all major sectors of the economy and for that reason it is considered
the most far-reaching agreement on environment, but which many countries, especially
developing countries like India and China, are hesitant to ratify. Some countries chose not
to ratify it and only agreed with it. The Kyoto agreement entered into force on 16 February
2005. The Kyoto Protocol entered into force when 55 countries ratified it. Table 3.2
describes the emission targets set to EU and other countries. /10/

Assessment of Environmental Impacts of Power Generation
21
Table 3.2 Emissions targets from the Kyoto Protocol /11/
Parties
Emissions target (expressed in relation to emission in the base
year or period) [%]
Austria, Belgium, Bulgaria, Czech Republic, Denmark, Estonia, European Community, Finland, France, Germany, Greece, Ireland, Italy, Latvia, Liechtenstein, Lithuania, Luxembourg, Monaco, Netherlands, Portugal, Romania, Slovakia, Slovenia, Spain, Sweden, Switzerland, United Kingdom of Great Britain and Northern Ireland
- 8
United States of America - 7
Canada, Hungary, Japan, Poland - 6
Croatia - 5
New Zealand, Russian Federation, Ukraine 0
Norway + 1
Australia + 8
Iceland + 10
Countries reductions of GHG emissions are to be from the baseline from their 1990 levels,
in exception countries with economics in transition, which may choose different baseline.
Moreover, countries may choose a baseline of 1990 or 1995 for its emissions of HFC, PFC
and SF6. Table 3.3 describes more in detail the emission targets from the EU member
countries between the years 2008 and 2012. These burdens were later followed by
requirements for renewable energy source share in each member state in EU. EUs
Renewable Energy Roadmap is described later in chapter 3.5.1. /12/
Table 3.3 EU15 burden sharing for achievement of EU 8 % emissions reductions /12/
Member state Change-% compared to year 1990. Emissions between years 2008 – 2012 [%]
Luxembourg -28 Denmark -21 Germany -21 Austria -13 Great-Britain -12,5 Belgium -7,5 Italy -6,5 Netherlands -6 Finland 0 France 0 Sweden +4 Ireland +13 Spain +15 Greece +25 Portugal +27

Assessment of Environmental Impacts of Power Generation
22
According to UNFCCC rough estimate the total amount of emissions should be decreased
by 60 % by the year 2100 from its levels in the beginning of century for stopping the
concentration of GHG in the atmosphere on safe levels. For this estimation to happen there
should be stricter emission constrictions. Stabilization of the atmospheric concentration
will take at least 100 due to rapid growth of global population and consumption, slow
changes in economies and energy technologies and slow removal of atmospheric
substances from the atmosphere. /10/
Changing of the countries allowed emissions is done by trading Kyoto Protocol units,
which are called Kyoto mechanisms /13/:
Emissions trading
Joint Implementation
Clean Development Mechanism
Units attained from other country are added to the countries assigned amount where as
transferred unit amount will be subtracted from the assigned amount. The mechanisms
allow developed counties to earn and trade emissions credits from projects implemented
domestically or in foreign country. /13/
3.1.3 European Climate Change Programme
Introduction of response measures has been active in EU, at domestic level. May 2002
Kyoto Protocol was ratified as a body by EU followed by the adoption of a decision on
burden sharing between EU15. /13/
After initial addressing of climate change in 1991 with limitation of CO2 emission levels
and improvement of energy efficiency, EU adopted European Climate Change Programme
(ECCP I) in 2000. Objective was to formulate strategies within EU for achieving 8 %
GHG emission reductions, specified by Kyoto Protocol. Second phase of the ECCP
(ECCP II) was launched on 24 October 2005, and its concentration points are; ECCP I
review, aviation, CO2 and cars, Carbon capture and storage, adaptation, EU emission
trading scheme review. /13/

Assessment of Environmental Impacts of Power Generation
23
3.1.4 Emissions trading and Kyoto mechanisms
The ECCP set Directive that set in place “cap and trade” framework for the emissions, by
focussing initially on CO2 for selected industrial sectors (Pulp and paper, glass, cement
and ceramics, iron and steel, energy). In the directive “cap” stands for the overall quantity
of allowances that can be distributed by the state for their industry in trading sector and the
specific installation. /13/
Kyoto mechanisms are /13/:
Joint implementation Joint implementation refers to measures through which a
country can achieve emission reductions in another country
which is defined as an economy in transition. In this way,
countries can agree on the transfer of emission reduction units
(ERU) from one country to another. The ERUs are removed
from the emission rights of the economy in transition in
question and transferred to the account of the other country
which implements the joint implementation project in the
economy in transition.
Clean development Clean development mechanism (CDM) is similar to joint
implementation, but the emission reduction takes place in a
country for which no emission goal has been defined in the
Kyoto Protocol (normally in developing countries). Emission
reduction units achieved through CDM projects are referred to
as CER (certified emission reduction).
Emission trading Emissions trading is a mechanism through which states can
trade in emission rights. It can be expected that especially
Russia, the Ukraine and Poland can sell their excess emission
allowances to those countries which find it hard to achieve their
emission goals.

Assessment of Environmental Impacts of Power Generation
24
3.1.5 Renewable energy roadmap of EU
At present EU is importing 50 % of its energy and fuel for it. With current developments
in the economic growth and population increase the corresponding figure will be 70 %
during next 20 - 30 years, if changes are not made to the energy policy in EU. EU gas
imports are expected to be 80 % in 25 years from total consumption. In the world energy
demand and emissions are expected to grow 60 % until year 2030. By then and world’s
oil-consumption will have increased by 20 % from 1994 and it will continue to increase by
1,6 % annually. In addition according to IPCC greenhouse gases will have increased
worlds temperature by 0,6°C, and it will further rise by 1,4 - 5,8°C by the turn of the
century. Table 3.5 describes the requirements of the green paper for member states’ share
in renewable energy sources by the year 2020. /14a/
Table 3.4 Requirements of shares of renewable energy for member countries /14b/
Member State Share of renewable in 2005 [%] Share required by 2020 [%] Austria 23.3 34 Belgium 2.2 13 Bulgaria 9.4 16 Cyprus 2.9 13 Czech Republic 6.1 13 Denmark 17 30 Estonia 18 25 Finland 28.5 38 France 10.3 23 Germany 5.8 18 Greece 6.9 18 Hungary 4.3 13 Ireland 3.1 16 Italy 5.2 17 Latvia 34.9 42 Lithuania 15 23 Luxembourg 0.9 11 Malta 0 10 The Netherlands 2.4 14 Poland 7.2 15 Portugal 20.5 31 Romania 17.8 24 Slovak Republic 6.7 14 Slovenia 16 25 Spain 8.7 20 Sweden 39.8 49 United Kingdom 1.3 15

Assessment of Environmental Impacts of Power Generation
25
With Commissions Renewable Energy Roadmap EU decided to make legally binding
agreement to increase share of renewable energies to target 20 % of EU total energy
consumption by year 2020 from current 5,5 % (2005) share. EU will miss the previous
target of 12 % by year 2010, exceeding about 10 %. Targets also included 20 % decrease
of GHG emissions and 20 % increase of efficiency by year 2020. Achievement of target 20
% lower emissions will reduce CO2 emissions in range of 600 – 900 Mt in 2020. With
CO2-price of 25 €/tonne, the additional total CO2 benefit can be calculated at a range of
150 - 200 billion €. /14a/
3.2 Environmental issue areas
Number of specific environmental issue areas can be specified for the power industry.
Those areas are air, climate change, water and waste and residues. This chapter describes
environmental issue areas and how EU legislation affects energy industry through these
issues.
3.2.1 Air
Power industry’s harmful impact on air quality is mostly caused by the emissions from
thermal power plants. Environmental problems caused by the main emission SO2, NOx and
dust, include acidification, eutrophication and harm to public health. Key directive for air
pollution is Directive 2001/80EC that regulates emissions in air, by limiting emissions of
certain pollutants from large combustion plants. The Directive is also referred to as the
LCP Directive, Large Combustion Plant Directive (LCPD). The Emission Limit Values
(ELV) are prescribed for individual plant commissioned before 27 November 2002.
Furthermore, for all existing plants commissioned before 1 July 1987 has been formulated
national emissions reductions. For SO2 the target was 70 % reduction in 2003 in
comparison to 1980 emissions. For NOx, 40% reduction in 1998 compared to the
emissions in the same reference year. In 2016, the emission limit for the NOx of solid fuels
will become even stricter for plants of more than 500 MW. Table 3.6 describes the ELV
for SO2 and NOx from plants to be built after 2003. /9/

Assessment of Environmental Impacts of Power Generation
26
Table 3.5 ELVs for SO2 and NOx for plants to be built after 2003 /15/
SO 2 [mg/m3] NOx [mg/m3] Plant size [MW] 50 - 100 100 - 300 > 300 50 - 100 100 - 300 > 300
Solid fuels 850 200 200 400 200 200 Liquid fuels 850 400-200 200 400 200 200 Biomass 200 200 200 400 300 200 Natural gas 35 35 35 150 150 100
Other directives for Air /15/:
- Directive 1992/32/EC: Reduction of sulphur content of heavy fuel oil of
1,00 % by mass and gas oils of 0,02 % as of 1 July 2000 and 0,1 % as of 1
January 2008.
- Directive 96/61/EC: Provides the structure for air quality management in
the EU, also known as Air Quality Framework Directive (AQFWD)
- Directive 2001/81/EC: National emission ceilings for certain atmospheric
pollutants (NECD), limits national emissions of SO2, NOx, VOC and NH3.
3.2.2 Water
Hydropower has been used for a long time for the production of electricity and with
current trends in energy policies it plays a vital role in GHG reductions as a power source
and regulation power for e.g. wind power. Thus, damming rivers and making artificial
lakes for the hydropower has negative impact on environment, in spite of its GHG
emission free power production principles. Lakes and rivers are also used in cooling
systems of thermal and nuclear power plants, which may lead to release of substances in
the water causing possible environmental impact on the ecosystem /15/. Environmental
permissions also state how warm water is allowed to be released back to the watercourse.
Cause of this is that during warm seasons power plants may have to lower their production
so the released water is not too warm /14c/.
Water protection policy in EU is governed by Directive 2000/60/EC, also known as Water
Framework Directive (WFD). Objectives of WFD are: “An environmental objective
stipulating that by 2015 all surface waters shall have reached (at least) good ecological and
chemical status and ground waters to have reached (at least) good quantitative and
chemical status; and, secondly, to streamline EU water legislation by repealing old
directives.” /15/

Assessment of Environmental Impacts of Power Generation
27
3.2.3 Waste and residues
Power industry produces by its activities wastes of non-hazardous and hazardous nature.
Recovering and disposing these wastes through whole chain of activity fields (generation,
transmission and distribution) cause inevitably environmental impacts and economic costs.
Directives for waste and residues /15/:
- Directive 75/442/EEC: European framework on waste management
- Directive 91/689/EEC: Hazardous waste from electricity industry
- Council Regulation 259/93/EC: Supervision and control of shipments of
waste within, into and out of European Community
- Directive 99/31/EC: Disposal of waste, landfill of waste
- Directive 96/59/EC: Disposal of PCBs/PCTs, (Polychlorinated Biphenyls /
Polychlorinated Terphenyls) requirements for electricity industry to dispose
of equipment containing more than 5 litres of PCB
- Directive 2000/76/EC:ncineration of waste
3.2.4 Other issues
Biodiversity protection and its Directive 92/43/EEC, on the conservation of natural
habitats and of wild fauna and flora, has also role in power industries regulation. The
directives aim to ensure biodiversity and conservation of specific natural habitats is
managed by the EU member state, which is required to designate Natura 2000 areas. /15/
Natura 2000 areas may raise a number of concerns for the power industries. Building in
these areas is prohibited and emissions caused by installations in the vicinity of those areas
may have consequences. For example building hydropower plant or an artificial lake for
hydropower, may prove to be impossible due to Natura 2000. /15/
Small note can be made because of environmental noise and the Directive 2002/49/EC
relating to the assessment and management of environmental noise. Noise caused by
electricity production (e.g. wind power) may have impact on the environment and its
inhabitants, at least humans. /15/

Assessment of Environmental Impacts of Power Generation
28
3.3 Environmental management
In addition for the environmental legislation there has to exist a working method for
managing of the environmental impact with proper structured and systematic framework.
To monitor the management there has to be monitoring and verifications system. This
section will describe some measures to manage environmental policy within a state or
individual company.
3.3.1 Environmental Management systems
Environmental Management systems (EMS) can be registered by electricity companies for
two available international standards: ISO 14001 or EMAS. Distinctive feature of an EMS
is that it is voluntary, though it has been implemented in fair number of electricity
companies. Intention of EMS is to help companies to manage requirements posed by
environmental legislations. Differences between EMAS and ISO 14001 standards are
described in Annex II. /9/
3.3.2 Environmental Impact Assessment
Environmental impact assessment (EIA) procedure is to ensure that environmental aspects
and concerns are taken into account during the planning and before the execution of power
industrial projects. EIA gives possibility to identify and assess environmental
consequences and take in to account the public opinion before authorisation is given. /9/
Directives concerning EIA:
- Directive 85/337/EEC: Assessment of the effects of certain public and
private projects on the environment
- Directive 2001/42/EC: Assessment of the effects of certain plans and
programmes on the environment
Voluntary environmental agreements made between operators and lawmakers can provide
flexible alternative to legislative measures for achievement of environmental objectives.
For the time being agreements in electricity industry does not exist, although e.g. car
manufactures have reached agreements in EU Member States. Inclusion of more
environmental characteristics and provisions in the technical standardisation process could
simplify environmental legislation. /9/

Assessment of Environmental Impacts of Power Generation
29
3.3.3 Green certificates
Green certificates are market-based approach for supporting renewable electricity.
Demand for the certificates can be voluntary or through requiring the power suppliers to
have a certain percentage of renewable electricity in their portfolio. Through these ways,
these tradable certificates can be received by investing in renewable energy or by
acquiring them from other market participant. /15/
3.3.4 Eco-labelling
Eco-labelling and its subset environmental product declaration can be defined as energy
markings of the products in general. In power industries case, question is about electricity.
The ISO standard ISO 14020 recognises three types of eco-labels;
- Type I (third-party certified labels)
- Type II (self-declarations)
- Type III (third-party certified environmental product declarations)
On an EU level, there exists the Type I eco-label “the EU flower” (established through
Regulation 880/92 and amended through Regulation 1980/2000). Whilst this label system
does not have criteria for electricity (i.e. it is not applicable to electricity), there are
national systems that do have. Proposed Directive concerning common rules for the
internal market in electricity and natural gas proposes provisions for disclosure of some
environmental aspects of electricity production, even though it is yet unclear what the final
requirements will be. Some electricity companies have developed Type III environmental
product declarations where the environmental impacts of the entire electricity production
chain are presented based on a life-cycle approach. /9/
3.3.5 Feed-in tariff
Feed-in tariff is measure for states internal market, which has also effects on international
markets in case open electricity markets. Feed-in tariffs purpose is to promote renewable
energy with a tariff, which would ensure the renewable power producer with base price,
which the producer would get for the electricity fed-in to the power system, even though
the market price would be less than the base price. /9/
There are Electricity feed laws, feed-in tariffs (FITs) and Advanced Renewable Tariffs
(ARTs) which differ in the way the tariffs are set. Tariffs are different depending on the

Assessment of Environmental Impacts of Power Generation
30
technology used (wind power, solar PV, biomass) and also within technologies with
project size or productivity in certain area. Countries such as Germany, Denmark and
Spain have boosted their wind power production by using FITs and many other have done
similar with wind power and other renewable energy sources, countries are: Australia,
Austria, Canada, China, Czech Republic, Great Britain, France, Greece, Ireland, Italy,
New Zealand, Netherlands, Portugal, South Africa, Turkey, some states of USA. /16/
3.4 Environmental protection and permitting
Environmental permitting and protection falls under larger directive package Directive
96/61/EC concerning integrated pollution prevention and control (IPPC). Below IPPC are
environmental controls e.g. Strategic Environmental assessment, Environmental Impact
Assessment, Seveso Directive and the Environmental Management and Audit System
(EMAS). Some elements of IPPC /15/:
- Both new and existing combustion plants with thermal capacity exceeding
50MW requires permit for operation
- The permits must be based on “Best Available Technique” (BAT) (i.e.
technology and methods of operation must be effective and advanced to
minimize all significant plant emissions)
- Encourages for use of Reference Emissions Values (REV) to minimize
transfer of pollutants from one
3.5 Fiscal measures and instruments
Fiscal instruments are mainly taxation or levy of taxes on e.g. certain fuels falls on
individual states authorities. Under EU legislation is mentioned that fiscal matters will not
be EU matter if they interfere with the Internal Markets. Nevertheless, in European states
there has become large range of different fiscal instruments including; Taxes on sulphur
content in fuels, charges on certain emissions and taxes on water use. With large variety of
these instruments the influence on power industry is eminent. /15/
One exception on EU energy taxation is EU taxation regime, which was adapted on 1
January 2004 and it states that taxation levels will amount to 0,5 EUR/MWh electricity for
business use and 1.0 EUR/MWh for non-business use. /15/

Assessment of Environmental Impacts of Power Generation
31
4 Energy production technologies
This chapter will describe the main technologies and their characteristics that are used in
energy industry for power generation. Furthermore, technologies that can be used to
improve the older technologies by minimizing the impact of power generation on the
environment are described.
4.1 Principles of power production
Energy production is conversion process where primary energy sources are converted into
electricity and heat. Three main conversion types can be specified /17/:
Transforming mechanical energy into electricity; i.e. thermal, wind and
hydro power plants
Conversion of solar radiation into electricity; i.e. solar power plant/photo
voltaic
Electrochemical conversion; i.e. Fuel cells
Power production technologies that use these main energy conversion processes can be
separated into three main categories /18/:
Fossil-fuel fired condensing power plants
Nuclear power plant
Renewable energy power plants
In addition can be specified number of technologies producing power in “small-scale”.
Those are: Internal combustion engines, Fuel cells, micro gas turbines and Stirling
engines. /18/
Share of certain power production types in use within states and regions depends on
following factors /19/:
Time alternation of consumption
Supply of energy source (fuel, water, sun etc.)
Heat loads in use
Cost structure of the power plants

Assessment of Environmental Impacts of Power Generation
32
Production categories
Power supply is divided into different categories depending on how they are used. Method
of application for these supplies comes from their operational principles. Those categories
are /19/:
Base power supply: Supply with big capacity, typically large investment
and production operation time long: > 6000 h
Intermediate-power supply: Supply with medium or small capacity, used
also as distributed generation, operation time: ~ 2000 … 6000 h
Peak load and reserve power supply: Simple and small stations with fast
power output and usually expensive operating costs, fairly short operating
time: < 2000 h
Regulating power supply: Power supply with fast changeable power output
that can be used fast
Some power generation types can be utilized in many different categories, though they
may be in optimal use only in one category. On the other hand, optimal use of supplies is
sometimes not possible when certain supply is not available enough or available at all (e.g.
hydro). In the case of Finland where base supply is produced with nuclear, hydro and
combined heat and power (CHP), and conventional condensing power stations and gas-
turbine plants are used to cover extra-power needs and peak-loads. Nordic power systems
power regulation is mainly done by hydropower in each country and all the countries take
part in the regulation operations via interconnection lines. Figure 4.1 illustrates the price
formation during high and low demand. /19/

Assessment of Environmental Impacts of Power Generation
33
Figure 4.1 Schematic supply-stack with two demand curves for low and high demand /20/
Figure 4.1 has schematic supply stack and on it are two demand curves superimposed. The
price of electricity is not volatile for price changes while the stack in low demand is flat,
but on high demand even a small increase in consumption can raise the prices
dramatically. /20/
Electricity as a commodity and different energy sources
The main difference between electricity and normal bulk commodity production is that the
supply and consumption of electricity must be balanced at each point in time. And also it
should be understood that various energy production options bring about completely and
genuinely different types of impacts, such as greenhouse gas effects and hypothetical
accidents or long-term potential radiological impacts of nuclear waste disposal. The
aggregation or comparison of these types of impacts is unavoidably involved with
significant uncertainties that may raise many differences in the ways people value certain
impacts i.e. degradation of environment, own health. /21/
Hydro Nuclear
Coal
Oil
Gas
Total production volume
Mar
gina
l pro
duct
ion
cost
Low High

Assessment of Environmental Impacts of Power Generation
34
Power supply’s effects on environment are mostly due to their fuel source. Following
chapter will explain more about conventional power generation technologies and following
list explains the main energy carriers (fuels) they use for power production /17/:
- Coal and lignite
- Crude Oil and Natural Gas liquids
- Oil Shale
- natural Bitumen and Extra-Heavy Oil
- Natural Gas
- Uranium / Nuclear power
- Hydro power
- Peat
- Solar
- Geothermal
- Wind
- Tidal
- Wave
4.2 Conventional condensing power plants
Conventional condensing power plant is usually fossil-fuel fired, but there are also plants
for e.g. peat. Typically condensing plants uses coal as fuel and it can be made as power
plant supplying base power or intermediate-power depending on the unit size. Condensing
coal-fired power plant can also use other, more expensive and easier firing-up like heavy
oil or gas, fuels as reserve fuel. /19/
Today’s steam cycle power plants have efficiency or roughly 43 %. Main reason for the
“low” efficiency rate is due to the alloys ability to withstand heat and pressure in the steam
cycle. Raising the currently used 560 °C to 700 °C could raise efficiency rate to 52 % and
lower the emissions of CO2 by 35 %. /18/
Fuel consumption of single boiler may be estimated from the amount of actual heat
transferred to the process, the thermal efficiency of one unit and annual operating hours.
Following equation is fuel consumption of steam boilers /22/:
Assessment of Environmental Impacts of Power Generation
35
( ) c0
0ihF 8760100 g
thhcme ⋅⋅⋅−⋅=
η& (4.1)
Where,
eF rate of fuel consumption expressed as an energy flow rate and based on the
higher heating value of the gas (GJ/y),
m mass flow rate of the process fluid being heated (kg/s),
ch specific heat capacity of the process fluid (kJ/kg⋅C),
hi inlet enthalpie of the process water/steam (kJ/kg),
ho outlet enthalpie of the process water/steam (kJ/kg),
η thermal efficiency of the heater or boiler (percent),
tO annual operating hours (h), and
gc factor to convert from units of kJ/s to GJ/y, = 31.536
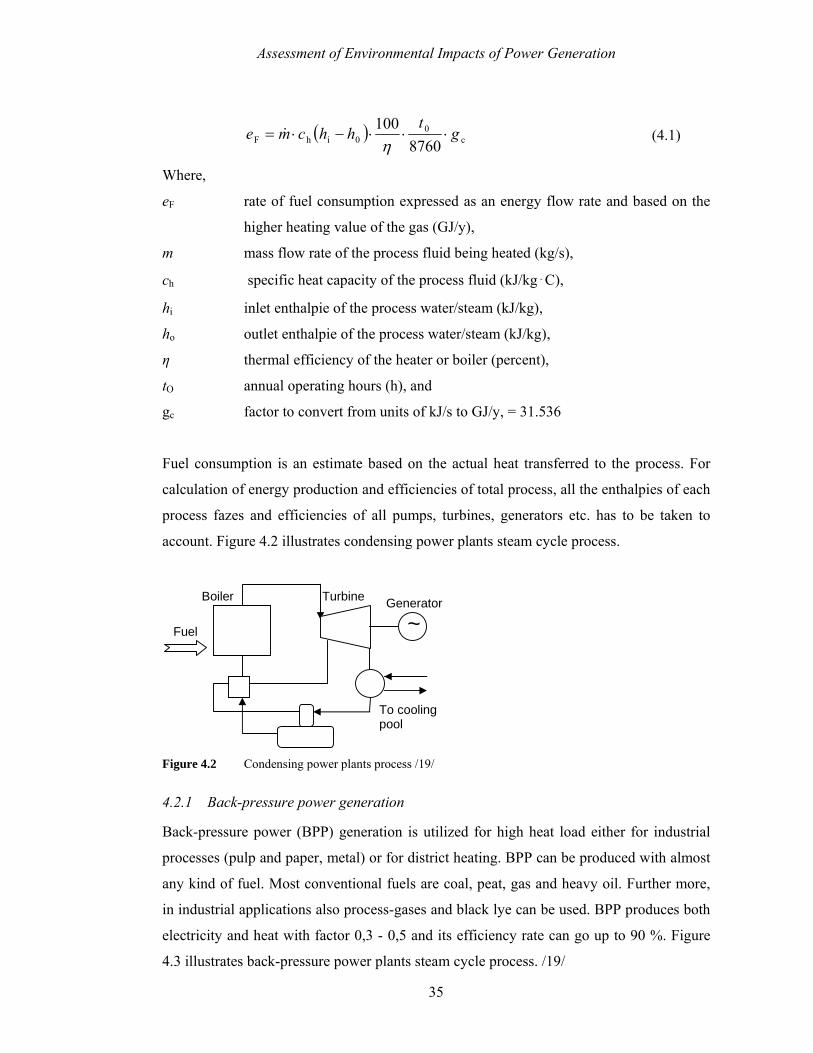
Fuel consumption is an estimate based on the actual heat transferred to the process. For
calculation of energy production and efficiencies of total process, all the enthalpies of each
process fazes and efficiencies of all pumps, turbines, generators etc. has to be taken to
account. Figure 4.2 illustrates condensing power plants steam cycle process.
Figure 4.2 Condensing power plants process /19/
4.2.1 Back-pressure power generation
Back-pressure power (BPP) generation is utilized for high heat load either for industrial
processes (pulp and paper, metal) or for district heating. BPP can be produced with almost
any kind of fuel. Most conventional fuels are coal, peat, gas and heavy oil. Further more,
in industrial applications also process-gases and black lye can be used. BPP produces both
electricity and heat with factor 0,3 - 0,5 and its efficiency rate can go up to 90 %. Figure
4.3 illustrates back-pressure power plants steam cycle process. /19/
Boiler Turbine Generator
~ Fuel
To cooling pool
Assessment of Environmental Impacts of Power Generation
36
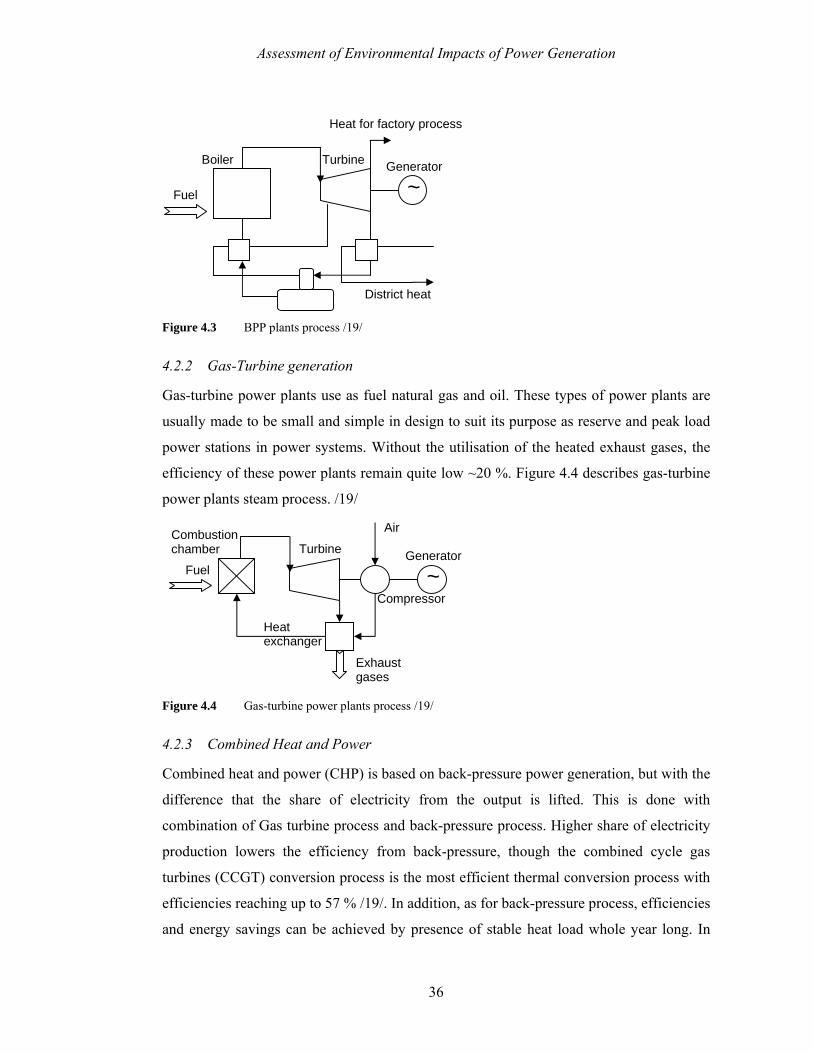
Figure 4.3 BPP plants process /19/
4.2.2 Gas-Turbine generation
Gas-turbine power plants use as fuel natural gas and oil. These types of power plants are
usually made to be small and simple in design to suit its purpose as reserve and peak load
power stations in power systems. Without the utilisation of the heated exhaust gases, the
efficiency of these power plants remain quite low ~20 %. Figure 4.4 describes gas-turbine
power plants steam process. /19/
Figure 4.4 Gas-turbine power plants process /19/
4.2.3 Combined Heat and Power
Combined heat and power (CHP) is based on back-pressure power generation, but with the
difference that the share of electricity from the output is lifted. This is done with
combination of Gas turbine process and back-pressure process. Higher share of electricity
production lowers the efficiency from back-pressure, though the combined cycle gas
turbines (CCGT) conversion process is the most efficient thermal conversion process with
efficiencies reaching up to 57 % /19/. In addition, as for back-pressure process, efficiencies
and energy savings can be achieved by presence of stable heat load whole year long. In
Boiler Turbine Generator
~
Heat for factory process
District heat
Fuel
Combustion chamber Turbine Generator
~ Fuel
Exhaust gases
Heat exchanger
Air
Compressor

Assessment of Environmental Impacts of Power Generation
37
figure 4.5 can be seen combined-cycle process for combined power and heat production.
/18/
Figure 4.5 Combined-cycle-process for combined power and heat production /19/
4.3 Nuclear power
Nuclear power plant is basically a condensing power plant where the heat energy is created
in nuclear reactor. Conventional reactor uses as fuel Uranium’s isotope U235 which is
located in fuel rods inside the reactor. Nuclear reaction inside the reactor heats up the
coolant/moderator surrounding the fuel rods and the coolant is directed to thermal
exchanger. Heated steam from the thermal exchanger leads to turbines connected to
electric generators /19/. Following equations describe the fission reaction inside the reactor
/23/:
UUn 23692
23592 →+ (4.2)
MeVnKrBaU 17738936
14456
23692 +++→ (4.3)
Where, n are neutrons, U Uranium, Ba is Barium, Kr is Krypton.
Neutron are slowed by moderator (normal or heavy water) so they are more likely to cause
further fission reactions or be captured by control rods. Each second or third neutron must
be captured for keeping the reaction stable. /23/
There are light and heavy water reactors. Terms come from the moderating water
surrounding the fuel rods. Most nuclear reactors in the world are light water reactors. Most
common light water reactors are Pressure Water Reactor (PWR) and Boiling Water
Reactor (BWR) being 68 % of all reactors in the world in 2003. Heavy water reactor, e.g.
Canadian Deuterium Uranium reactor CANDU, uses heavy deuterium water as moderator
District heat
Combustion chamber
Gas Turbine
Generator
Fuel Exhaust gases
Compressor Steam Turbine
~ Air
~ Generator

Assessment of Environmental Impacts of Power Generation
38
and as fuel it uses natural uranium. Natural uranium is 99,3 % U238 and 0,7 % U235 and
CANDU reactor converts the U238 to useful Pu239. /24/
Figure 4.6 PWR-nuclear power plant process /19/
Nuclear power plants are built to be base power supplying plants. Characteristics of
Nuclear power plants are big capacity (biggest under construction is 1600 MW), and long
service time, 40-60 years. Moreover, in construction of nuclear power plant is included
large investment and due to the long building time (7 – 9 years) just the interest expenses
during construction are circa 12 % from total fixed costs. Extra expenses rise also from
additional security systems, plant decommissioning and handling of nuclear waste and
spent fuel. Benefits can be realized from stable price of the fuel, low energy production
costs and zero emission from production. /24/
Beneficial factor for nuclear power is the un-fluctuating price of its fuel. Price of Uranium
has been moderately stable, specially compared to other non-renewable energy fuels. But
if the price of the fuel would suddenly go up, this would not have major effect on the
energy price of nuclear power due to nuclear power plants cost structure presented on
figure 4.7. Share of capital costs for nuclear power plants are 60 % when the same
percentage for gas or coal are circa 20 % and 30 %. Share of fuel price from nuclear
energy are 15 %, from which the price of uranium is about third. Share of fuel price from
the price of produced energy with natural gas or coal are 70 % and 40 %, which makes the
energy price easily fluctuating with the changes in the fuel market price. In nuclear powers
case, if the price of uranium goes double, the price of produced energy rises about 5 %.
/24/
Generator Reactor Turbine
~
To cooling pool
Heat exchanger

Assessment of Environmental Impacts of Power Generation
39
Figure 4.7 Structure of costs for nuclear, coal and gas energy /24/
Efficiency rate of nuclear power plant is moderate 35 - 45 %, depending on the reactor,
and it is mainly used only to produce electricity. There are no technological obstacles to
use nuclear power for production of CHP, and thereby for district heating, and only
difference between conventional condensing power plant and nuclear power plant exist in
the turbine system. This would raise nuclear power efficiency rate to over 60 % and also
lower GHG emission in the air caused by fossil-fuel use for creating heat. Main issue is to
build the nuclear power plant near the residential areas. Otherwise building a long distance
district heat transmission line would not be the most cost-effective way to reduce
emissions in heating. In Europe there exists some nuclear power plants used for heat
production also, in countries like Russia, Bulgaria and Switzerland. /24/
4.4 Renewable energy
Renewable energy sources (RES) are those energy sources which are recurrent in the
world. Those are hydro, biomass, wind, solar thermal, solar photovoltaic, geothermal,
wave and tidal energy. Renewable energy has become biggest energy trend in 21st century
in electricity generation. Investments on renewable energy have multiplied and it will
continue while countries are struggling to lower their emissions and to transform their
production mix more sustainable for fossil-fuel free world.
4.4.1 Hydropower
Hydropower plants are usually situated in the rivers, main river-beds and on the banks of
rivers. Conventional hydropower plant uses waters potential energy for electricity
production. Water is directed from watercourses main lake to water turbines and the
Gas energy
Fuel 70 %
Operating 10 %
Capital 20 %
Nuclear energy
Capital 60 %
Operating 15 %
Waste disposal 10 %
Fuel 15 %
Coal energy
Capital 30 %
Operating 20 %
Fuel 40 %
Waste disposal 10 %

Assessment of Environmental Impacts of Power Generation
40
turbines uses the kinetic energy of the water for electricity production with generator.
Following equation is the general formula for any hydro system’s power output /25/:
HQgP ⋅⋅⋅⋅= ρηW (4.4)
Where,
PW Mechanical power produced at the turbine shaft, W
η Hydraulic efficiency of the turbine, kg/m3
g Acceleration due to gravity,~ 9.81 m/s2
Q Volume flow rate passing through the turbine, m3/s
H Effective pressure head of water across the turbine, m
Hydropower is the most reliable part of electricity power system and it is used mostly for
electricity power systems regulation purposes i.e. for keeping the balance between demand
and supply of electricity. Power regulation possibilities with other forms of electricity
generation are eminently worse, resulting from used alloys temperature changing speeds
restrictions. Set backs from hydro power may arise from water resources seasonal essence.
With low water supply season hydropower has to be replaced with some other, more
expensive means. /19/
Costs from hydropower plants are nearly fully from investment costs from plants and
possible artificial lakes constructions. Operation time is long with hydropower plants are
usually long, ~ 40 years. Fuel for the plant is free and operating costs are minimal due to
automation and remote control. Operation costs are mostly dissipation from transmission
of electricity, due to long distance transmission. /19/
Largest share of RES energy is produced with hydropower in the world. Beneficial
characteristics are: free fuel, emissions free production and high efficiency rates, between
75 and 90 % of the energy input can be converted into electricity. Unfortunately increase
of capacity in OECD countries is for environmental reasons no longer possible in larger
scale. All potential places have been harvested for use already. Capacity increase maybe
possible still through replacing technology in older power plants for newer more efficient
machinery. Figure 4.8 is a schematic picture of hydroelectric dam. /18/

Assessment of Environmental Impacts of Power Generation
41
Figure 4.8 Hydroelectric dam schematic picture
4.4.2 Wind power
Energy from wind is harvested by using onshore or offshore wind turbines individually or
with several units consisting wind farms. Energy of wind rotates turbines from where the
power is transferred to generator, which transforms the energy into electricity. Capacity of
single wind turbine is now days usually 1 – 3 MW and its efficiency factors are 43 – 44 %.
However, capacity factor range from 20 – 40 %, at the upper end of the range in
favourable sites. Following equation is the general formula for calculating power from a
single wind turbine /26/:
bgpW vcAP ηηρ ⋅⋅⋅⋅⋅= 35,0 (4.5)
Where,
PW Power produced, W
ρ Density of air, kg/m3
cp Coefficient of performance, (0,59 Betz limit, 0,35 for a good
design)
v Wind speed, m/s
ηg Efficiency of generator
ηb Efficiency of gearbox/bearings
Wind energy production has increased the most from all RES supplies. World wide
capacity in the end of 2007 was 93,7 GW with 19,7 GW added in 2007 /27/. Wind power
is one of the most attractive RES supplies with its abundant energy source and zero
emissions. Wind turbines operation time is 15 to 25 years. /25/
~
Potential energy water reservoir
Kinetic energy
Dam
Generator
Turbine
Outlet
Electricity
Assessment of Environmental Impacts of Power Generation
42
Even with large benefits and strong support for wind energy, there are many factors
against large scale wind energy production. Due to unpredictability of wind appears also
possibility of that wind power is not operational at all. This means that almost total amount
of wind power installed to the power gird needs the same amount of regulating power due
to the fact that wind power has hardly any substitution capacity, the more wind capacity,
the less it compensates other capacity. Wind power requires fast regulating power. For
instance, in Germany during Christmas 2004 from the network of E.On Netz dropped wind
power capacity from 6000 MW to 40 MW in 2 days. The fall was at some point even 1000
MW per hour. Capacity loss of this magnitude requires large amount of regulating backup
power. /28/
4.4.3 Biomass energy
Biomass is organic material such as wood, crops, waste, landfill methane gas, alcohol fuels
and energy is released by combustion. Electricity sector is the second largest secondary
transformation of biomass after charcoal production. Process industries such as sugar,
wood and chemical pulping use their by-products for producing CHP with biomass for
their own uses and feeding surplus electricity to the power grid. Used bio-fuels are: corn,
sugar canes, pellets, wood chips, straws, black liquor, bagasse, landfill methane, anaerobic
digestors, vegetable oils etc. Energy is harvested or converted to another fuel from
biomass by /18/:
- Burning
- Fermenting in zero-oxygen space to produce bio-gas
- By manufacturing ethanol from biomass
Most common biomass energy conversion process is direct combustion, which brings out
some problems with certain biomass fuels. Only external combustion technologies can be
used because biomass may contain elements harmful for engines. Efficiency is a vital issue
with energy. At present efficiencies are relatively low, around 32 %, with CHP use up to
45 %. Big issue also comes if biomass is used to create bio-fuels. Then energy consumed
by the conversion process maybe close to equal to the energy the bio-fuel could create, or
less. /18/

Assessment of Environmental Impacts of Power Generation
43
4.4.4 Other renewable energy sources
As other RES supplies can be mentioned solar thermal, solar photovoltaic, geothermal,
wave and tidal energy /17/. Significance of these supplies will grow in future, but for now
they are not technologically or economically mature to be eminent part of Europe’s power
generation mix. Locally, e.g. photo voltaic in household scale might have significant
savings in electricity consumption and installed solar energy collectors can pay themselves
back in 1 – 3 years. /29/
Solar energy systems are mainly beneficial for household applications to lower yearly
energy consumption from the grid. Photo voltaic (PV) systems are characterized as capital-
intensive with zero fuel costs and very small operating costs. Furthermore, it has zero
GHG emissions from its energy production. PV systems have very low efficiency (< 15 %)
and its capacity factor also really low. In Germany capacity factor can reach up to 10 %,
which is considered to be favourable for Europe. In California, USA, where should be
more favourable sites for PV systems, the capacity factor reaches up to 22 % /30/. Due to
these efficiencies and small capacities, PV systems are not mature enough technologies for
large scale production in Europe. On the other hand Australia has invested on larger scale
PV system for electricity production for 45.000 homes needs. Generation capacity of the
solar power station is 154 MW. /31/
Although at present geothermal energy has been exploited mainly only in couple of
regions where there is volcanic activity, in the future technology will present possibilities
to exploit it economically also in regions which are not known to be so warm. Geothermal
power plants operate continuously and it can be categorized as base load power plant.
Geothermal production is renewable energy source with a lot of potential in future
electricity production, although now it is mainly used for heat production. Energy
generating capacity of geothermal energy and heat recovered by ground source heat pumps
is estimated to be more than 100 GW. Even though geothermal energy is RES, dry steam
and flash steam plants emit low levels of CO2, NO2, and S, although ~ 5 % of the levels
emitted by fossil fuel-fired power plants. Some geothermal power plants have been
equipped control systems which inject GHG emissions back into earth. /17/

Assessment of Environmental Impacts of Power Generation
44
Wave power is energy harvested from the ocean surface waves. This technology is not
efficient or economically competitive yet for larger scale power production. Challenges lie
in wave power slow motion for electric generators, corrosion and damage salt water, high
cost of electricity produced. /17/
Tidal power uses two possible principles of exploiting tidal energy. Possibilities are to
exploit the movement of water cause by the tidal currents or rise and fall of sea level
caused by the tides. Motion of the water is converted to electricity by turbines connected to
generators. Wave and tidal power are RES and could be used as part of solution for carbon
free electricity generation though they are not technologically or economically ready. /17/
4.5 Carbon Capture and Storage
While fossil fuel based energy production is and will probably remain for decades as the
most important source of energy, it is important to minimize emissions from power plants
using fossil fuels. Furthermore, as long as coal prices remain low enough and coal
resources are sufficient for next century it is not economically reasonable to abandon coal
as source of energy. Energy sector produces > 60 % of world’s total CO2 emissions and
from that power generation is 40 % from energy sectors CO2 emissions. Due to these
emissions it is important to start using different technologies to minimize these emissions.
One of these technologies is Carbon Capture and Storage. /1/
4.5.1 Carbon capture
Carbon capture and storage (CCS) technologies are used to take away CO2 during the
energy production process and storing the extracted carbon. There are three main
technologies and their principles depend upon when the carbon is extracted from the
energy production process; in the beginning, in the middle or in the end. These
technologies are /1/:
- Pre-combustion capture
- Oxy-fuelling
- Post-combustion capture
Figure 4.9 describes as schematic diagram the three main CCS technologies.

Assessment of Environmental Impacts of Power Generation
45
Figure 4.9 Schematic diagram of tree main CCS technologies /32/
Pre-combustion utilizes gasification of coal into synthetic gaseous mixture of hydrogen
and CO (“syngas”) before combustion. CO2 and additional hydrogen are then produced
from the syngas by reacting the carbon monoxide with additional steam. CO2 is extracted
from the syngas by absorption by liquid solvent of solid absorbent and CO2 can be
released either by heating or reducing pressure. The remaining hydrogen is combusted in
Integrated Gasification Combined Cycle (IGCC) plant, in which coal (or any other solid or
liquid fuel) is gasified, without emissions of CO2. Syngas also can be used as feedstock for
liquid fuels or chemical manufacturing. Applications of pre-combustion capture used in
industries such as ammonia and hydrogen production. /1/
With Oxy-fuelling fossil fuel is combusted in pure oxygen rather than air. Flue gas, or
rather mainly water vapour, resulting from this the flue gas has a very high CO2
concentration (greater than 80 % by volume), which makes it easy to be extracted. Water
vapour is removed by cooling and compressing the gas. Oxy-fuel-systems are being
developed on small scale, in laboratory or in pilot projects. /1/
Post-combustion CO2 capture (Steam power plants)Conventional power plant with CO2 scrubber
Coal Air
Conventional Steam PP
Flue gas cleaning
CO2 Capture
CO2
Coal
O2 Boiler Flue gas
cleaning Conden-sation
Gasi-fication
Gas cleaning
CO2 Capture
CCGTCoal
O2
Pre-combustion CO2 capture (IGCC power plants) IGCC process
Oxy-fuel process
CO2
CO2/H2O
CO210 m3/s, 45 vol-% CO2
1.000 m3/s, 13 vol-% CO2
Development demand
H2 Turbine

Assessment of Environmental Impacts of Power Generation
46
In Post-combustion method CO2 is captured from the exhaust gases produced by
combustion of fuel (coal, natural gas, oil or biomass) at end-of-pipe. There are various
options for extraction depending on the volume and composition of the flue gases. One
way is to capture CO2 with liquid solvent. CO2 is then released from the liquid with heat.
Same technology is used in food and beverage industry and in fertilizer manufacturing.
/18/
The three methods differ from one another in some ways. For instance pre-combustion
compared with post-combustion processes, the CO2 concentration in the former method is
higher which allows CO2 capture in lower temperatures. Furthermore, pre-combustion
processes CO2 capture involves production of syngas and hydrogen, which makes it more
complicated, although additional benefits are realised from these gases. /1/
Type of method used is influenced highly by the fossil fuel used in the combustion,
although all methods have similar disadvantage of requiring additional energy, between 10
– 40 %, according to estimates, which also depend on plant type. It is also estimated that
this energy penalty will drop efficiency rates of power plants by 5 to 12 %. Emissions of
CO2 can be lowered using these technologies by 70 - 90 %. Due to lack of experience and
knowledge on CCS using it in power plant may increase costs of electricity generation by
50 % or more. CCS has not been applied on large scale fossil-fuel power plant, although
pilot projects on capture and storage are under way. First large scale power plants
equipped with carbon capture technologies are estimated to be ready by 2015 – 2020. /1/
4.5.2 Carbon storage
Captured CO2 is transported for storage. Retaining CO2 so that it will not reach
atmosphere is one of the big issues in CCS. Means of storing CO2 are geological, ocean
storage, mineral carbonation and use or re-use of CO2. Geological storage is already in use
and being tested. /1/
Geological storage involves injection of CO2 in dense form rock formations below the
Earths surface. Injection of CO2 is already been implemented into gas and oil reservoirs,
deep saline formations or un-minable coal beds. Other possibilities for CO2 geological
storage lies in basalts, oil or gas shales, salt caverns and abandoned mines. According to

Assessment of Environmental Impacts of Power Generation
47
IEA Greenhouse Gas R&D Programme, depleted oil and gas fields could accommodate
0,92 trillion tonnes of CO2, which is 45 % of expected emissions between years 2000 –
2050 in the world. Furthermore, storage space in saline reservoirs could be up to 10 trillion
tonnes. Figure 4.10 shows the principle of carbon storage. /1/
Figure 4.10 Principle of carbon capture and storage /32/
Ocean storage has been studied for many years but no pilot or demonstration programmes
have been implemented. Ocean storages principles are to inject CO2 deep in to the ocean,
depths greater than 1000 meters. Another possibility for CO2 storage is mineral
carbonation, which have been researched and demonstrated for a while. Method is to fix
the CO2 in silicate rocks. This method is not yet ready for commercial deployment due to
its energy intensive procedure and its need for transportation in scale. Use and re-use of
CO2 is already being carried in applications in industries such as urea and methanol
production, in horticulture, refridgerating, food packing, welding, beverage production and
fire extinguishers. /1/
As well as carbon capture still is in the beginning of its development process, so is storing
the captured CO2. There are no long term data storing and the projects for it are in first
stages of implementation or have not started yet. Concerns about technical integrity of the
storage and the potential health risks involved need to be addressed. Sudden or gradual
leakages may occur and the effects on people and animals through groundwater reservoirs
or soil are not known. Also potential danger lies to marine ecosystem and organisms.
These potential risks require development of monitoring techniques. Table 4.1 describes
the projected costs of storage of CO2 four different storage technologies. /1/

Assessment of Environmental Impacts of Power Generation
48
Table 4.1 Costs of storage of CO2 /1/
Storage Option Cost range [€*/Tonne CO2] Notes
Geological storage 0,31 - 0,50 – net injected Excluding revenues from enhanced oil recovery or
enhanced coal-bed methane
Geological storage: Monitoring and Verification 0,06 - 0,19 – net injected
Covers pre-injection, injection and post-injection monitoring
and depends on regulatory requirements
Ocean storage 3 - 19 – net injected Including offshore transportation
of 100-500 km, excluding monitoring and verification
Mineral carbonation 31 - 63 – net mineralised Range for the best case studied. Includes additional energy use
for carbonation *converted to Euros with currency rate of 24.4.2008, EUR-USD 1,57
4.5.3 Policies
Regulatory framework is one of the key issues for CCS deployment in large scale. CCS is
energy intensive and expensive, but according to IPCC, CCS could deliver up to 15 - 55 %
to the mitigation effort of lowering CO2 emissions worldwide until year 2100. There are
several governmental incentives to make CCS more favourable technology /1/:
- Taxation of emissions: Making storage of CO2 cheaper
- Development of cap-and-trade emissions programmes: For recognizing
stored CO2 as non-emitted; absolving the requirement of units for CO2
generated in storing of CO2
- Recognizing CCS as a mechanism for emissions reduction
- Offering of financial incentives for generation using CCS; feed-in tariffs.
- Mandate the use of CCS for certain sources or subsidies for CCS
installation costs

Assessment of Environmental Impacts of Power Generation
49
4.6 Discussion on power plant characteristics
Essentially in different countries resources have been channelled for construction of power
generating plants which results in the lowest possible energy costs, taking in to account the
investment, operating and maintenance costs. In generation mix it is best to utilize all
different generation types to make flexible power system to cope with different overall
load patterns. Furthermore, power system which uses wide range of fuels is not so
sensitive for fluctuating fuel prices, when single fuel is not dominant. Temptation of
constructing especially coal-fired condensing power plants has been great in the past, due
to cheap price of coal, good heat value, nuclear powers bad reputation and availability of
other competitive energy source. With Kyoto protocol and EU’s renewable energy share
targets comes the burden to change the existing infrastructure, at least in some countries
which are heavily dependent on imports of gas, oil and coal.
Table 4.2 Role of different electricity generation methods
Capacity and delivery surety
Regulation capability
GHG emissions
Renew-able
Cost-effective-ness
Availability of additional capacity
CHP + 0 + (+) + (+) Nuclear ++ 0 ++ 0 + ++ Condensing ++ + 0 0 0 ++ Hydro ++ ++ ++ ++ + + Wind 0 - ++ ++ - ++ Energy efficiency + (+) ++ + + +
With new era of investing mainly on low-carbon technology or renewable energy sources,
availability of energy sources is again one of the main issues. Even with the desire of
changing the power system for more sustainable and low-carbon supply, some
technologies can not be used in some geographical regions:
- OECD countries hydropower possibilities are used
- Wind power is not suited for low average wind speed areas
- Solar power needs long term light regions
- Cultivation of energy crops may lead to higher food prices

Assessment of Environmental Impacts of Power Generation
50
Some plants are suitable for base-load operation, while others are used for peak
production. Plants with intermittent source of operation need backup capacity. In
electricity generation systems, plants with different operational characteristics are
included. Figure 8.1 describes the investment costs of power plants and projected
investment costs in the future.
Figure 4.111 Investment costs of different generation types /!8/
In v e s tm e n t c o s ts o f p o w e r g e n e ra tio n ty p e s
0
500
1000
1500
2000
2500
3000
3500
4000
L IG N IT E2 00 52 03 0
2 0 30 C C S2 0 50 C C S
C O A L2 00 52 03 0
2 0 30 C C S2 0 50 C C S
IG C C2 00 52 03 0
2 0 30 C C S2 0 50 C C S
C C G T2 00 52 03 0
2 0 30 C C S2 0 50 C C S
H Y D R O E L E C T R ICH y d ro R -o -R
H y d ro s to ra g e
B IO M A S SS ta n d -a lon e
C o -fire d (o n ly w ith e .g . C o a l p lan t)
W IN DO n s h o re 2 00 5
O n s ho re 2 03 0 /5 0O ffs ho re 2 00 5
O ffsh o re 20 3 0 /5 0
N U C L E A R L ig h t W a te r 2 0 0 5L ig h t W a te r 2 0 3 0L ig h t W a te r 2 0 5 0
F as t B re e de r 2 00 5F as t B re e de r 2 03 0F as t B re e de r 2 05 0
H ig h T e m p e ra tu re 2 0 0 5H ig h T e m p e ra tu re 2 0 3 0H ig h T e m p e ra tu re 2 0 5 0
[€ /k W h ]

Assessment of Environmental Impacts of Power Generation
51
The system characteristics play an important role in making decisions on new plant
investment. The grid capacity, existing backup arrangements, type of loads and several
other factors all need to be taken into account. In some cases, combined production of
power and heat may be feasible. In open electricity markets, the cost of alternative supply
is important.
Characteristics of the measures to be taken for reducing environmental impacts tend to be
expensive and the actions themselves will not bring extra profit, excluding the benefits
from improving the efficiency in different parts of power generation process, which will
bring benefits through energy savings. Investing on technology for reducing emissions
such as CCS will bring benefit by reduction of costs from carbon taxes and through
decreasing need to purchase carbon allowances, though energy penalty resulting from the
use of technology like CCS must be noted.

Assessment of Environmental Impacts of Power Generation
52
5 Power generations effects on environment
All types of power generation create harmful effects on environment, to the general public
and the workers and the ways to impact are numerous and some times it is hard to define
the overall effects of them. There are no single ways to estimate scale of total effects when
the effecting ways are so dissimilar. It was defined in 1970 that main factors causing
environmental effects are caused by use of fossil fuels causing NOx and SO2 fallouts into
the environment. These sour fallouts produce environmental effects such as loss of fishes,
forestry damage and corrosion on buildings. In the air these emissions can travel thousands
of kilometres and cause further damage on health and environment. /6/
Acidification
Acidification is caused by sulphur oxide and nitrogenous oxide emissions. Effects are
starting to show when pH value of watercourses or rainwater decreases below pH 5.
Acidification causes in water fish kills and in nature worsening of tree condition or even
death. Furthermore, water that has sulphate dissolved in it, washes away important
nutrients from form the topsoil and acidification of ground water leads to dissolving of
aluminium, which is toxic to the plants. /6/
Particulate matter and concern for heath
The term particulate matter (PM) is equivalent to the term atmospheric aerosol and defines
a suspension of airborne solid particles. Size and chemical composition are regarded as the
most important characteristics of such particles, while surface area and possibly particle
number may also be important. A single particle usually contains a mixture of chemical
and physical (solid, liquid) constituents. The PM10 concentration is the mass per volume
unit (µg/m3) of particles with an diameter smaller than 10 micro-metres (µm). The larger
particles contained in the PM10 size fraction reach the upper part of the lung. The smaller
particles of this size fraction (in particular PM2.5 and PM1.0, with diameters smaller than
2.5 and 1.0 µm) penetrate more deeply into the lung and reach the alveolar region. PM is
often differentiated by chemical constituents (e.g., sulphates, heavy metals and organics),
as well as by source-related constituents (e.g., diesel soot). Today, it has become common
practice to denote the PM2.5 as the “fine fraction” and particles with diameters between 2.5
and 10 µm (PM2.5-10) as the “coarse fraction”. /22/

Assessment of Environmental Impacts of Power Generation
53
Large and very small particles have a limited residence time in the atmosphere. Particles in
the size range between approximately 0.1 and a few µm remain in the atmosphere much
longer (typically several days to a week) and can consequently be transported over long
distances (1,000 kilometres or more). PM is emitted directly from “primary” sources
(primary PM) and is also formed in the atmosphere by the reaction of precursor gases
(secondary PM). Other common distinctions are natural/anthropogenic sources and
combustion/non-combustion sources. The emission estimates from non-combustion
sources have a high degree of uncertainty. /22/
Primary PMs are e.g. /6/:
- Soot formed from combustion, consisting from carbon
- chemical compounds, which are in gas form in burning temperatures, but
return to solid from after cooling
Secondary PMs are e.g. /6/:
- Sulphur oxides conversion to sulphuric acid
- Nitrous oxides conversion to nitric acid
Emissions from combustion
During combustion process with fossil or carbon based fuel combustion gases are released.
These exhaust gas compounds of oxygen with sulphur, nitrogen, carbon etc. depending on
the quality of the fuel. Combustion with coal produces the most greenhouse gases
compared with other fossil fuels and natural gases CO2 emissions are third less than oil
and coal. The level and mixture of pollutants depend on the fuel and the technology used.
The emission level is different at different power levels and weather the plant takes part in
the frequency regulating, where as in steady-state operation and in transient-state
emissions levels differ. /22/
Estimation of emissions for some combustion processes can be relatively easy, but for
some it can be made only roughly. Relatively good estimates can be made of CO2, NOx,
SO2, thermal emissions and solid waste. There are measurements and estimates of total
dust and PM10 emissions, but this is less true for the finer fractions, PM2.5, PM1 and nano-
particles. The impacts of these emissions depend on the location, recipient and scale of the
operation. The impacts, for example, of thermal releases into the sea are different from

Assessment of Environmental Impacts of Power Generation
54
those into an inland water body. The impacts of poor air quality in sparsely populated
areas differ from those in urban areas or other area with higher population intensity. /22/
Determination of amount of specific pollutant i can be determined with following equation
/22/:
⎟⎠⎞
⎜⎝⎛ −⋅⋅⋅= −
100110 6 i
FiiECEFeE
i (5.1)
Where,
eFi Estimated fuel consumption (GJ/y for gas or L/y for liquid
fuels) by combustion device i,
Ei Emissions of pollutant I form specified source (t/y)
EFi Factor for emissions of pollutant I from specified type of source
(GJ/y for gas or L/y for liquid fuels),
ECi Efficiency of control equipment for reaction of emissions of
pollutant i, %
Harmful impacts of power generation start already from the beginning of energy
production chain and that is acquiring of the fuel. Using of natural resources is already
environmental impact, as are changing of landscape and nature for the plant and power
lines. Effects come also from the refining and production of fuel, which also include waste
management. The effects have to be measured from the whole production chain of energy
which will add up to the differences of effecting ways. Simplest way may be to measure
only effects which happen in large quantities like pollutant concentration in the air or
water and acidification of soil. /6/
From table 5.1, it can be seen that the most harmful types of energy production are coal,
oil and gas and from two sources which are considered renewable burning wood and peat
have also harmful side-effects.

Assessment of Environmental Impacts of Power Generation
55
Table 5.1 Environmental effects in scale from different energy supplies /6/
Harmful impacts Fuels for energy production
Coal Oil Gas Peat Wood Nuclear power
Hydro-power
Wind power
Using of non-renewable sources X X X X X
Landscape X X X X Watercourses regulation X X
Watercourses heating X X X X X X
Noise X Radiation X Air quality X X X X X Acidification X X X X X Eutrophication X X X X X Climate change X X X X X
Quantitative measurements of certain environmental effects are often dependent on human
valuation. Especially in case of health concerns coming from different energy forms is
especially hard to calculate. Division of environmental effects to residue effects and
economically relevant external costs is particularly hard when they are essentially
dependent on society’s sense of moral. Valuation of effects has been done to climate
change by number of studies, The Stern Review as most renowned of them. Due to the
nature of Climate change being an environmental effect of global extent it has been put
forward as main environmental issue recently. The amount of environmental effects,
emissions and other, are influenced by numerous factors. These factors are e.g. technology
used (age, efficiency, type), fuel characteristics, location, transportation of fuel and
equipment, regulations etc. Following chapters will describe the effects from different
production types and the parameters involved in them. /33/
5.1 Effects from solid fuels
Power generation chain begins with procurement of fuel. Extraction of the fuel causes
environmental effects due to the emissions coming from the machines extracting it, and
also extracting of the fuel can be harmful for the landscape. Extraction of peat may cause
changes in currents of watercourses due to the organic material and minerals from soil that
get into the watercourse. /6/

Assessment of Environmental Impacts of Power Generation
56
When solid fuels are used in combustion plants they emit large quantities of pollutants
such as SO2, NOx, CO2 and particles. Also these plants usually use coolant water from near
by river of watercourse and then they dump the cooling water back. This will rise the
temperature in the water course causing eutrophication when the vegetation of the
watercourse gets too much sun also during winter. Wood chips as a fuel doesn’t produce
SO2 emissions. /6/
Combustion process of carbon and other solid fuels produces bottom ashes and fly ashes
which contain heavy metals and radioactive substances. Those are extracted with filters,
but they have to be disposed of as problem-waste. Biomass ashes may be used also in
production of fertilizer and building material. /34/
Solid fuels’ main factors influencing GHG emissions /35/:
- Fuel characteristics; carbon content and caloric value; e.g. washing coal for
improved caloric value
- Type of mine and location
- Fuels extraction way; methane releases, recovering and transportation needs
involved
- Feedstock characteristics; moisture content and heating value of used fuel
- Fuel mix for electricity and power needs in fuel supply and plant
construction and decommissioning
- Type of technology; e.g. combined cycle operation
- Energy used for feedstock: growth (biomass), harvesting (biomass) and
transport
- Technology of the plant; efficiency is of essence with biomass power
production while it is currently quite low.
- Assumed lifetime of installation
CO2 emission factor for biomass is neutral i.e. carbon releases from the burning of biomass
is equal to the biogenic uptake during plant growth. So it releases same amount as it takes
in during its growth. /35/

Assessment of Environmental Impacts of Power Generation
57
Emission formation
Three main chemical reactions in combustion reactions are /36/:
22 COOC →+ (5.1)
OHOH 222 2→+ (5.2)
22 SOOS →+ (5.3)
Presence of sulphur with the true fuel materials, carbon and hydrogen, is cause of the latter
reaction. Furthermore, if the combustion temperature is too high, following disassociation
reactions occur /36/:
NOON ⋅→+ 222 (5.4)
222 22 NOON ⋅→⋅+ (5.5)
22 22 OCOCO +⋅→⋅ (5.6)
All of these reactions are endothermic, and result in pollutants NOx and CO.
5.2 Effects from fossil fuels
Obtaining oil and gas cause landscape impacts onshore and offshore, bigger issues are the
methane emissions during the procurement and transportation of the fuels. It must also be
noted that methane is far more dangerous and effective GHG than CO2. Also on the
surfaces of the transfer pipes gather some natural radioactive substances, which results in
that the tube lines have to be handled as problem-waste. /35/
Combustion of oil and gas produces GHG emission and the coolant water eutrophication.
Problem with the warm coolant water is partly solved with back-pressure and CHP plants
where the warm coolant water is directed for heating purposes which increases the
efficiency of the plant also. /6/
Fossil fuels’ main factors influencing GHG emissions /35/:
- Fuels extraction way; methane releases, recovering and transportation needs
involved
- Transmission loses for natural gas; also methane leakages
- Conversion efficiency
- Type of technology; e.g. combined cycle operation
- Fuel mix for electricity and power needs in fuel supply and plant
construction and decommissioning

Assessment of Environmental Impacts of Power Generation
58
- Assumed lifetime of installation
Emissions formation is similar with oil and gas as with other solid fuel combustion.
5.3 Nuclear power
Construction of the plant and the procurement of the fuel with waste disposal are the main
indirect way that nuclear power produces GHG emission. Land use and ecological effects
on the environment are minimal compared to the amount of power produced. Table 5.2
describes an example of nuclear fuel chains taxonomy.
Table 5.2 Example of nuclear fuel chains taxonomy /33/
Fuel chain processes Effecting factors Effects Mining and enrichment - Particles in air
- NOx in air - Emissions of radioactive substances
- Radiological health effects
Refining of fuel - Emissions of radioactive substances - Heavy metal wastes - Energy needs for rectifying - U235 waste
- Radiological health effects
Construction of plant - CO2, SO2, NOx, - Particles - Dust - Noise
- Landscape effects - Need of space
Plant operation - Emissions of radioactive substances - Warm water emissions - Waste waters - CO2, SO2, NOx, - Particles - Low-and middle-active substances - Conventional wastes
- Radiological health effects - Curable cancers - Serious hereditary effects - Effects on nature
Decommissioning of plant - Discharging wastes Handling of low-and middle-active substances
- Emissions of radioactive substances
- Radiological health effects
Final location of high active wastes
- Emissions of radioactive substances
- Radiological health effects
Transportation - Emissions of radioactive substances - CO2, SO2, NOx, - Particles
- Radiological health effects
Accidents - Emissions of radioactive substances
- Radiological health effects

Assessment of Environmental Impacts of Power Generation
59
During production nuclear power emits radiation, which causes very small addition to the
total amount of radiation been directed to a person. Human gets radiation in the world by
average 2,8 m Sievert in a year, nuclear production causes 0,0002 mSv of that. Large
amounts of waste are produced during ore mining and enrichment of the fuel ore. These
wastes coming from the production and decommissioning have to be treated and put to
final location for minimising the radiation effects. The final resting place for the used fuel
of nuclear power is usually in deep caves of under bed-rock where it can’t harm the
environment. /6/ Table 5.3 describes the dose estimates for public and workers from major
fuel cycle stages. Figure 5.1 radiation exposures during different stages of nuclear fuel
cycle.
Table 5.3 Dose estimates for the public and workers from major fuel cycle stages of nuclear power
/21/
Public (generic calculations) Workers (operational data) Collective dose truncated at
500 (manSv/GWa) Annual collective dose
(manSv/GWa) Fuel Cycle Stage
Once-through Reprocessing
Average annual
dose to the critical group
(mSv/a)
Once through Reprocessing
Mining and Milling 1,0 0,8 0,30-0,50 0,02-0,18 0,016-0,14
Fuel conversion and enrichment 0,008-0,02 0,006-0,016
Fuel Fabrication 0,0009 0,020
0,007 0,094 Power generation 0,6 0,6 0,000-
0,0008 1,0-2,7 1,0-2,7
Reprocessing vitrification
Not applicable 1,2 0,40 Not
applicable 0,014
Transportation Trivial Trivial Trivial 0,005-0,02 0,005-0,03 Disposal (*) (*) (*) Trivial Trivial
Total 1,6 2,6 Not applicable 1,04-2,93 1,14-2,99
(*) No releases during the first 500 a
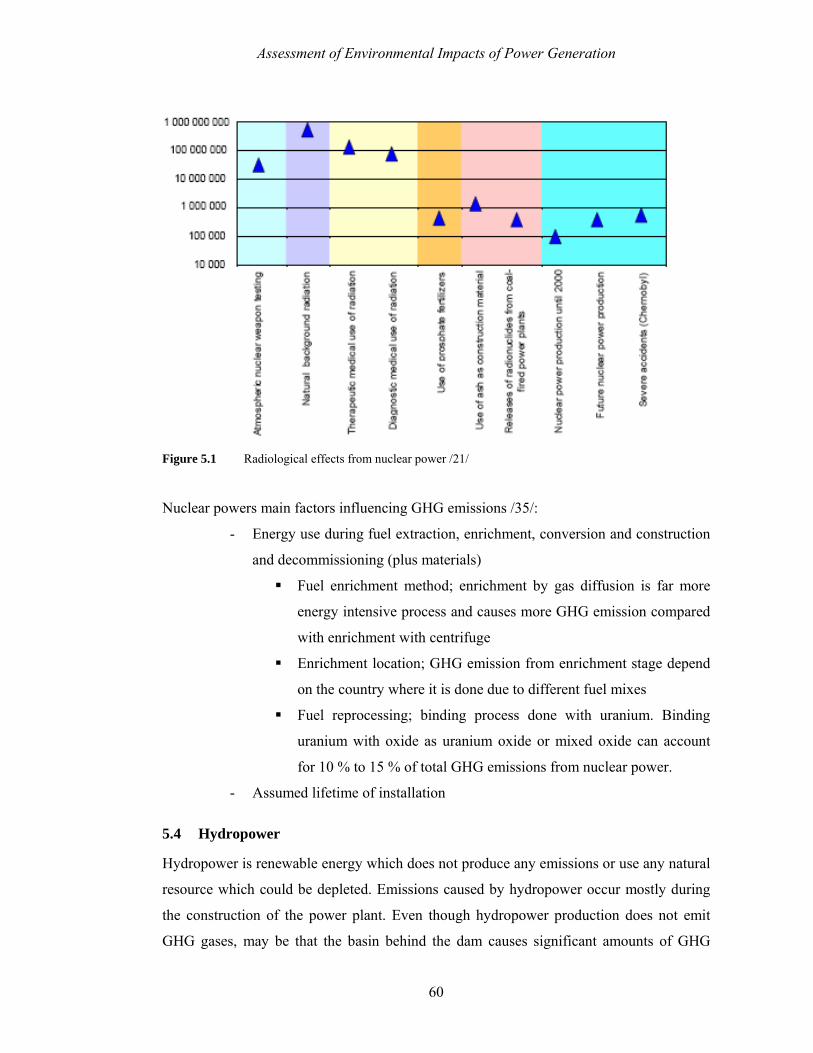
Assessment of Environmental Impacts of Power Generation
60
Figure 5.1 Radiological effects from nuclear power /21/
Nuclear powers main factors influencing GHG emissions /35/:
- Energy use during fuel extraction, enrichment, conversion and construction
and decommissioning (plus materials)
Fuel enrichment method; enrichment by gas diffusion is far more
energy intensive process and causes more GHG emission compared
with enrichment with centrifuge
Enrichment location; GHG emission from enrichment stage depend
on the country where it is done due to different fuel mixes
Fuel reprocessing; binding process done with uranium. Binding
uranium with oxide as uranium oxide or mixed oxide can account
for 10 % to 15 % of total GHG emissions from nuclear power.
- Assumed lifetime of installation
5.4 Hydropower
Hydropower is renewable energy which does not produce any emissions or use any natural
resource which could be depleted. Emissions caused by hydropower occur mostly during
the construction of the power plant. Even though hydropower production does not emit
GHG gases, may be that the basin behind the dam causes significant amounts of GHG
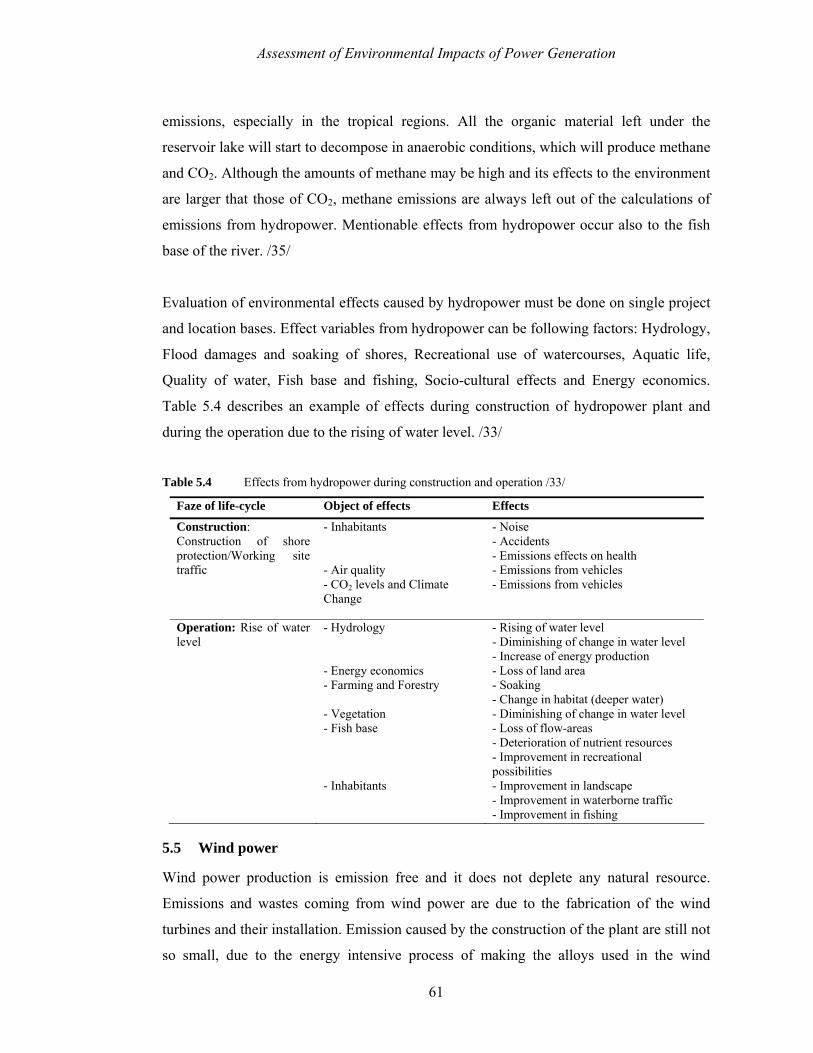
Assessment of Environmental Impacts of Power Generation
61
emissions, especially in the tropical regions. All the organic material left under the
reservoir lake will start to decompose in anaerobic conditions, which will produce methane
and CO2. Although the amounts of methane may be high and its effects to the environment
are larger that those of CO2, methane emissions are always left out of the calculations of
emissions from hydropower. Mentionable effects from hydropower occur also to the fish
base of the river. /35/
Evaluation of environmental effects caused by hydropower must be done on single project
and location bases. Effect variables from hydropower can be following factors: Hydrology,
Flood damages and soaking of shores, Recreational use of watercourses, Aquatic life,
Quality of water, Fish base and fishing, Socio-cultural effects and Energy economics.
Table 5.4 describes an example of effects during construction of hydropower plant and
during the operation due to the rising of water level. /33/
Table 5.4 Effects from hydropower during construction and operation /33/
Faze of life-cycle Object of effects Effects
Construction: Construction of shore protection/Working site traffic
- Inhabitants - Air quality - CO2 levels and Climate Change
- Noise - Accidents - Emissions effects on health - Emissions from vehicles - Emissions from vehicles
Operation: Rise of water level
- Hydrology - Energy economics - Farming and Forestry - Vegetation - Fish base - Inhabitants
- Rising of water level - Diminishing of change in water level - Increase of energy production - Loss of land area - Soaking - Change in habitat (deeper water) - Diminishing of change in water level - Loss of flow-areas - Deterioration of nutrient resources - Improvement in recreational possibilities - Improvement in landscape - Improvement in waterborne traffic - Improvement in fishing
5.5 Wind power
Wind power production is emission free and it does not deplete any natural resource.
Emissions and wastes coming from wind power are due to the fabrication of the wind
turbines and their installation. Emission caused by the construction of the plant are still not
so small, due to the energy intensive process of making the alloys used in the wind

Assessment of Environmental Impacts of Power Generation
62
turbines. Also the installation GHG burden can grow if they are installed in region with
possible earthquakes, due to making of heavy foundations, which can increase GHG
emissions. Table 5.5 describes the stages of wind turbine life curve and environmental
factors and effects caused by them. /35/
Table 5.5 Stages and effects from wind power /33/
Fazes of life cycle Effecting factors Environmental effects - Construction and setting up
- Emissions in air
- Health problems from emissions
- Operation and maintenance - Noise - Electromagnetic disturbances - Effects on animals and plants - Effects on appearance
- Noise level - Fluctuating light effects - Worsening of TV-and radio-signal - Changes in animal and plant life - Effects on natural experiences - Horizontal landscape effect
- Decommissioning - Emissions in air - Health problems from emissions
One of the environmental effects caused by wind power is noise which comes mainly from
the aerodynamic noise from blades and some additional noise is produced by individual
parts of the electricity producing machinery i.e. gearing, generator and cooling systems.
Intensity of the noise leaving from the turbine is about 100 – 110 dB in the immediate
vicinity, but it goes down to 40 dB in range of 200 – 300 m. Table 5.6 shows an example
of possible GHG emissions coming form wind turbine construction and maintenance. Must
be noted that these are highly state oriented and emissions are mostly due to fuel mix used
for the energy needs of production. /33/
Table 5.6 Example on emissions from 500 kW wind turbine from Denmark /33/
Faze \ Emission CO2 [g/kWh] SO2 [g/kWh] NOx [g/kWh] Construction of Wind turbine 12,1 0,05 0,04 Manufacturing of the material needed in operation 2,07 – 5,26 0,01 – 0,02 0,01 – 0,02
Additional environmental effects occur from the wind power due to bird and bat deaths
caused by the wind turbines onshore. Offshore wind turbines cause harmful effect on the
marine life. Also esthetical effects occur when wind farms are mainly situated on places
with clear view without obstacles. Those locations are hills, coasts and on the sea. /33/

Assessment of Environmental Impacts of Power Generation
63
Wind powers main factors influencing GHG emissions /35/:
- Energy use for blade manufacturing and building of installation; tower and
foundation
- Electricity production mix and construction regulations; highly country-
and site-specific e.g. onshore of offshore
- Capacity factor or annual yield; intermittence and penetration factor i.e.
sites average wind speed (50 % more wind → 200 % annual yield)
- Assumed lifetime of installation
5.6 Solar power, photo voltaic
Photo voltaic has no fuel costs and modest operating costs. Furthermore, it does not
produce GHG emissions from it energy production. Manufacturing and installation
processes are the only cause for photo voltaic GHG emission, which are the highest from
all RES production methods as seen from the figure 5.2. Manufacturing cost can be
reduced through using modern and more developed technology for production of cells. In
table 5.7 can be seen an example of emissions from PV construction. /35/
Table 5.7 Example of Solar PV emissions during whole life-cycle /33/
Multi-crystal silicon Single-crystal silicon Unit
Primary energy use 129.011 56.222 [MJ]
CO2 4.902 2.203 [kg]
NMVOC 4,3 2 [kg]
NOx 14 6 [kg]
Particles 2,3 1 [kg]
SOx 29,7 13,7 [kg]
Solar powers main factors influencing GHG emissions /35/:
- Quality and grade of silicon in cell production
- Type of technology; amorphous or crystalline
- Type, site and of installation; rooftop or facade and which country, due to
high differences of light amounts during year
- Fuel mix used in for productions electricity needs
- Annual yield
- Assumed lifetime of installation

Assessment of Environmental Impacts of Power Generation
64
5.7 Assessment of total environmental effects
Power generation has environmental effect throughout its production chain and none of
them can be discarded. In fossil fuels case emissions are sum of stack emissions from
combustion and other releases from up- and downstream activities. Typically 1 % of total
emissions can be attributed to the plant construction and decommissioning in case of fossil
fuel power plants. Key factor for hydro, solar and wind power are size and type of the
plant. Furthermore, geographical location and local construction regulative framework
have strong influence on the emission rate. /35/
Commonly used method for analysing the environmental impacts is Life-Cycle Analysis
(LCA). This method takes into account each mass and energy flows at each step of the
process chain for creating a product. Some times LCA is completed by an Input-Output
Analysis (IOA) which takes into account the indirect emissions from other economic
sectors attributing for the product creation e.g. electricity used in processing. Effect of
these indirect emissions can be significant, contributing for example 30 % higher emission
for fossil fuel power plants. GHG emissions of nuclear power can even double when
indirect emissions are taken into account. Ignoring up- and downstream activities for the
fossil fuel cycles would underestimate the total GHG emission rate between 5 % and 25 %.
In case of nuclear power and most renewable sources there are no GHG releases from the
generation, but there are emissions during fuel mining, preparation and transport, plant
construction and decommissioning, manufacturing of equipment and decay of organic
matter. Emission levels are influenced highly by the technology and geographical location
of the power plant. Furthermore, due to need of backup (secondary) power for intermittent
technologies, i.e. wind, solar and seasonal hydropower, question rises whether to include
backup in the calculations. Advantages of calculating primary and secondary power
separately are: Emissions for the primary system are determined on the use of given
technology, influence of annual yield (operation hours) can be clearly ascertained,
permitting of comparison between backup options. IAEA used in their study Full Energy
Chain (FENCH), which considers all the steps from “cradle to crave”. Figure 5.2
represents the results from IAEA study. /35/

Assessment of Environmental Impacts of Power Generation
65
Figure 5.2 Total GHG emission generated by power production chains CO2,eq /35/
The International Atom Energy Association (IAEA) research was made as part of their
Comparative Assessment of Energy Sources, which involved 6 specialist conferences
between years 1994 and 1998, for reviewing the GHG emission from the process chains
related to the production of electricity using: lignite, coal, oil, gas, nuclear, biomass, hydro,
wind and solar photovoltaic. Fossil fuels have the highest emission factors from which
natural gas emits half as much as coal or lignite and two-thirds of the estimate for fuel oil.
Lowest emissions come from nuclear and hydropower with 50 to 100 times lower
emissions than coal. /35/
T o ta l G H G e m is s io n s fr o m e n e r g y g e n e r a t io n c h a in s
0
200
400
600
800
1000
1200
1400
L IG N IT E1 9 9 0 s T e c h . ( h ig h )
1 9 9 0 s T e c h . ( lo w )2 0 0 5 - 2 0 2 0 T e c h .
C O A L1 9 9 0 s T e c h . ( h ig h )
1 9 9 0 s T e c h . ( lo w )2 0 0 5 - 2 0 2 0 T e c h .
O IL1 9 9 0 s T e c h . ( h ig h )
1 9 9 0 s T e c h . ( lo w )2 0 0 5 - 2 0 2 0 T e c h .
N A T U R A L G A S1 9 9 0 s T e c h . ( h ig h )
1 9 9 0 s T e c h . ( lo w )2 0 0 5 - 2 0 2 0 T e c h .
S O L A R P V1 9 9 0 s T e c h . ( h ig h )
1 9 9 0 s T e c h . ( lo w )2 0 0 5 - 2 0 2 0 T e c h .
H Y D R O E L E C T R ICR e s e r v o ir , t r o p ic a l a r e a
R e s e r v o ir ( h ig h ) R e s e r v o ir ( lo w )
R u n - o f - r iv e r r e s e r v o ir
B IO M A S Sh ig h
lo w
W IN DIn la n d ; < 1 0 %
In la n d ; 1 0 %C o a s t ; 3 5 %C o a s t ; 3 0 %
N U C L E A R h ig h
lo w
[ g C O 2 /k W h ]
Other chain steps Stack emissions
Assessment of Environmental Impacts of Power Generation
66
5.8 Measures for environmental effect reductions
Measures for minimizing the environmental effects can be categorized into technical
measures and legislative measures. Technical measures are measures that can improve the
energy production processes during the whole process chain and new technologies that can
be used for minimising the effects or new ways to produce energy. Legislative measures
are for making better framework for use of low-carbon technologies and for supporting
new technologies for making it beneficial to lower the emissions.
Technical measures for minimizing environmental impacts can be categorized as follows:
- Utilising only energy production methods that are characterized as low-
carbon technologies i.e. nuclear power, renewable energy sources (Bio-
energy, wind power, hydro power, solar etc.)
- Apply technologies to increase energy efficiency in the production,
industry, transportation etc.
- Increasing efficiency factor in energy production with e.g. by expanding
CHP production, rising process temperature and pressure with new alloys
- Transition between fossil fuels to less emitting ones e.g. change from use of
coal to gas
- Utilizing technologies which can filter or extract harmful pollutants from
the power generation process or fuels e.g. CCS, coal-to-liquid etc.
- Development of control centres for market information, i.e. electricity
price, CO2 price, congestion on transmission lines, water reservoirs, and
creating mechanism and technologies to help market participants to receive
the information in real time
- Availability and utilization of distributed generation during peak-load hours
e.g. solar power, wind power etc.
Legislative and economical measures for minimizing environmental impacts can be
categorized as follows:
- Taxation of emissions: emissions produced are cost for the industry,
making it cost-effective to reduce emissions
- Development of cap-and-trade emissions programmes

Assessment of Environmental Impacts of Power Generation
67
- Recognizing technical investments for emissions reduction as a mechanism
for emissions reduction e.g. CCS, filter systems, monitoring, coal-to-liquids
- Development of financial incentives e.g. feed-in-tariff, green certificates,
for plants producing low minor emissions of zero-emissions where it is
sensible e.g. CCS, renewable energy sources
- Mandate the use of emissions reducing technologies for certain sources or
subsidies for installation costs of the technologies
- Development of market-oriented approaches
- Progressing with pan-European electricity and CO2 market integration to
create common markets for all Europe, also market integration with CIS
EPC (Electricity Power Council of the Commonwealth of Independent
Countries) and European systems

Assessment of Environmental Impacts of Power Generation
68
6 Economical aspects
The relation between the environment and energy industry is clear through the impacts the
energy industry makes by its activities. Studies have been made on the relation between
environment and economics. This chapter will explain about that relation and also about
most known review on the economics of climate change, the Stern Review.
6.1 Relation between environment and economics
There are indications in which U-shaped relationship between emissions or concentrations
of GHG and income per head, the so-called ‘environmental Kuznet’s curve’ exists. Simon
Kuznet’s theory was originally about income per capita and inequality. Economic
inequality increases over time, but after critical average income is attained, it starts to
decrease. /37/
The evidences show that while the income per head grows, eventually emission level
saturates and then starts to decrease. Stern in his report finds that such a decrease is
unlikely globally, at least not until the emissions the GHG concentrations have risen to
destructive levels /37/. Environmental Kuznet’s Curve hypothesis can be formulated in
IPAT framework. In IPAT, an environmental impact is expressed with factors of
population, “affluence” (GDP per capita) and technology /38/:
TAPI ⋅⋅= (6.1)
Where,
I Environmental impact
P Population
A GDP per capita, €
T Technology
In empirical studies of environmental Kuznet’s curve hypothesis, a specific impact
indicator is chosen e.g. SO2 emissions could be chosen to represent environmental impact
I. Technology factor T is estimated by dividing I by GDP, and regression is performed on
a quadratic functional form /38/:
( )( ) ( ) ( )AcAbaAT 2lnlnln ⋅+⋅+= (6.2)
Where,

Assessment of Environmental Impacts of Power Generation
69
( ) max2
highlowmax ln21ln ATa ⋅⋅⋅+= εε (6.3)
maxhighlow ln Ab ⋅⋅= εε (6.4)
highlow21 εε ⋅−=c (6.5)
Where,
Tmaz maximum value of T
Amaz income where T reaches Tmax
εlow income elasticity of T at low incomes
εhigh income elasticity of T at high incomes
Illustrative picture of Kutznet’s curve can be seen on figure 6.1
Figure 6.1 Environmental Kuznet’s curve /37/
When societies get richer, new technology will substitute the old technology, which can
lead to emissions decrease from single society. But the problems comes from the fact that
concentration levels in atmosphere are global and it will take very long time for
developing countries to be in level that the emissions would start to fall. Therefore, single
societies cannot change the course of the concentration level on earth. /37/
On single society level the environmental Kuznet’s may be valid. Curves appearance may
be also culture-oriented and incidental due to different fuel mixes and standards of living
in different states. In Europe’s level also can be stated that during time period 1990 – 2000
Income per capita
Env
ironm
enta
l deg
rada
tion
Environment worsens
Environment improves
Turning point

Assessment of Environmental Impacts of Power Generation
70
EU-25 GDP of area grew 25 % also the electricity production grew 20 % whilst CO2
emissions reduced 2,3 % in absolute terms. /18/
Figure 6.2 illustrates the relationship between per capita GDP, energy use and emissions in
four countries; the United Kingdom, United States, Australia and Sweden. It reveals
significant differences in the relationship between GDP and energy use. United Kingdom
has the lowest energy intensity of the four, according to the figure. However, there are
much more dramatic differences in emissions. Australia and Sweden, for instance, have
almost identical per capita energy consumption, but Australia's per capita emissions are
almost three times Sweden's. Thus while energy intensity may play a part in "de-
coupling", the most dramatic gains are likely to be made in addressing the carbon intensity
of the fuel mix. De- coupling can be understood as disconnection of relation between GDP
and energy consumption or intensity. /39/
Figure 6.2 De-coupling: the relationship between GDP, emissions and energy consumption in 2002 /39/
6.2 Effects of Climate Change
As the chapter 5.9 explains the expensiveness of the possible measures for minimizing
GHG emissions and other impacts, this chapter explains about researches about the costs
for not doing anything. There are a lot of studies about the economic bases for climate
policies, but the most known and debated is The Review on the Economics of Climate
Change by economist Sir Nicolas Stern for the British government. Next chapters will go
through its main content and some criticism toward it.

Assessment of Environmental Impacts of Power Generation
71
6.2.1 The Stern Review
The Economics of Climate Change: The Stern Review was fabricated by Sir Nicholas
Stern and his 23 people work group. The Stern review is not the only one of its kind to
estimate possible costs of climate change, but it is by far the largest. Special note is that
the report doesn’t bring out any new knowledge or scientific facts for the climate change
or its impact on the societies instead it is review or summary of all previous researches,
although the conclusions differ from the previous studies. /40/
The Stern Review bases its analysis on the studies in which under business-as-usual
scenario shows what will happen if immediate measures are not taken to stabilize
concentration on safe level. Scenario states that the GHG concentration in the atmosphere
could be more than treble of the pre-industrial levels (greater than 850 ppm CO2-eq) by the
end of century. Trebling of the amount by year 2100 would give 50 % risk of temperatures
exceeding 5°C above pre-industrial levels. Knowledge is limited on environments or
human societies responding for to increases in temperature, but studies that The Review
gathered presented that the impact of climate change across multiple dimensions are likely
to be highly arched and the marginal damages increases exponentially as temperature rises.
Risks and damages are based on the assumption that the temperature will rise 5°C.
Damages of the climate change were explained on chapter 2.2 of this report. /37/
In principle the Review is cost-benefit analysis with aim to estimate the costs of inaction
and the benefits of action to minimize the emissions. The results are given with
percentages from global GDP value. Costs of inaction would bring a drop in global GDP
by 5 % now and forever and with some more pessimistic estimate the drop could be even
20 % or more. On the other hand, with changing of energy policy with emission
restrictions, the costs of stabilizing the concentration at 450 – 550 ppm CO2eq, thus
bringing down the risks of climate change, would cost about 1 % per year. /37/
The Review also discusses the policy instruments, such as promoting mitigation,
adaptation approaches and the international framework, on second half of the report.
Further discussion involves three strands of policy intervention – correcting the market
failure on GHG, technology policy and change of perspectives toward more responsible

Assessment of Environmental Impacts of Power Generation
72
behaviour. Importance of tax, trading and regulation in creation of a carbon price has been
brought up. /37/
Policy instruments effectiveness to bring GHG reductions, efficiency and working capital
available are key factors for desired effect. Moreover, for different states and different
sectors, different approaches will be appropriate and effective e.g. several EU countries
have posed high fuel taxes, whereas USA have seen more important vehicle efficiency
standardization. /35/
Emission trading was shown in the review to be efficient and bringing across country
boundaries. Ambitious targets and heavy restrictions on emissions with support of
effective mechanisms is driving private sector to invest on developing countries. Allowing
use of the CDM in developing countries has potential to increase the use of carbon finance
in poorer countries. /37/
The review also raises high importance on the support for the developing countries, so
they avoid locking in new high-carbon infrastructure during the next few years, when
substantial growth and investments is likely take place. /37/
6.2.2 Criticism on the Stern Review
The Stern review created considerably interest and debate. Even though the climate change
is widely debated issue, criticism toward the review did not focus on that, instead more on
the principles Stern used to calculate the costs of the climate change. The costs of climate
change were considerably larger compared to previous studies, then again costs of cutting
the emissions and slowing the change are considered cheap. Figure 6.3 illustrates Stern
Review and previous studies estimates on costs of climate change. /40/

Assessment of Environmental Impacts of Power Generation
73
Figure 6.3 Estimates of Climate change costs /41/
Economical issues brought up were about the discount rates Stern used in his calculations
for costs and benefits. Stern used as discount rates of 0,1 % and 1,3 % economic growth
per year, these counts for 1,4 % market interest per year, which is fairly low compared to
real market interest. /37/
Benefits from consumption are described by the size of the bar in 2007. Bigger the wealth
in the future, less benefit comes from saving. Saving is submitting benefits from
consumption, and investing on markets, where technology defines profit from investment.
Profit means extra-consumption in year 2107. Figure 6.4 illustrates Ramsey’s rule about
saving. The submitted “benefit” from 2007 consumption is the same size as the “benefit”
through saving from 2107. Former is grown with market growth and latter is corrected
down with discount rate. /40/
Figure 6.4 Ramsey’s rule on saving /40/
By using Sterns discount rate (time preference) and estimation for economic rate with 1 %
sacrifice on future to avoid 5 % GDP drop after 100 years we get as benefits compared to
Consumption
2007 2107
Consumption
Market profit
Discount

Assessment of Environmental Impacts of Power Generation
74
costs factor circa 4,5 with 1,4 % discount rate. But if the market interest is higher than 3,3
% per year factor of costs and benefits of environment policy are opposite.
For example, if GDP is 20.000 € per person in 2007, with 1,3 % GDP growth it will be
72.774 € in year 2107. 5 % drop of GDP in 2107 would be then 3639 €. In the year 2007,
with 1,4 market interest, 3639 € would be in value of 2007, 903 €. Cost of 1 % per year is
200 € makes benefit – cost factor 4,5.
With the market interest of 3,3 %, GDP drop of 5 % in 2107 would be valued in 2007 127
€ and factor would be 0,6. It would not be any more beneficial to invest 1 % of GDP
today. Figure 6.5 illustrates the example.
Figure 6.5 Example with possible market interest 3,3 % /40/
Formula for expected profit from saving can be written as follows if uncertainty is not
included in consumption /40/:
0
01
cccr −
+≈ γδ (6.6)
Where,
δ Discount rate
γ Flexibility of financial benefit
c1 Consumption in time 1
c0 Consumption in time 0
Often used figures for the parameters are δ=2 %, γ=2, 0
01
ccc − =2 %, this would lead to
market interest of 6 %. Stern reviews default values were δ=0,1 %, γ=1, 0
01
ccc − =1,3 %,
leading to market interest of 1,4 %. /40/
Market profit = 1,3 %
Market interest = 3,3 %
2007 2107
20.000 € 72.774
5 %
3639 € 127 €
1 %
200

Assessment of Environmental Impacts of Power Generation
75
Furthermore, due to chosen time preference and property effect Stern comes to
conclusions that action has to be taken now. This assumption has also risen several
questions, when most studies suggest that it is best to take gradual steps. The schedule
depends on market growth, costs and harms and in what amount are the harmful effects
irrevocable. Professor of economics William Nordhaus from Yale University criticised
discount rate assumption: “The Review’s unambiguous conclusions about the need for
extreme immediate action will not survive the substitution of discounting assumptions that
are consistent with today’s market place. So the central questions about global-warming
policy — how much, how fast, and how costly — remain open. The Review informs but
does not answer these fundamental questions”. /42/
6.2.3 Reflection on Stern review
The Stern Review is extensive report on costs and benefits of environment policy. The
economic contents are easily criticised due to the uncertainties climate change and its real
effects. The review tries to be independent research on facts proven by studies, when in
truth it is and political document /40/. Were the basis for the studies political agenda or
desire research how we can justify environment policy today it seems to have been
successful. Deliberately chosen rates show in full what are the full dangers if nothing is
done to prevent climate change from continuing. Furthermore, the research did help to
bring more debate on the issue. The fact that the climate change is happening and that
something has to be done with it has not been criticised as much.
Assessment of Environmental Impacts of Power Generation
76
7 Scenario calculation on Finland energy production
As the Stern Review stated, states are forced to act now to the issue of sustainability of
energy production and lowering of energy related GHG emissions. Question lies, which
road to follow for lowering the emissions. Choices vary from full investment to renewable
energy sources, combined resource channelling on RES and nuclear or continuation of
coal-fired power production, but equipping them with CCS or other emissions lowering
technology.
Following chapter will make an example calculation through different scenarios how the
emissions levels change with different approaches on energy policy. Example will be for
Finland and the calculations and the scenarios will be made with a program called GEMIS.
The scenario models follows partially research, estimations and assumptions made by
consulting unit of Pöyry Energy Oy in their report /46/. Following chapters will first
describe the GEMIS software used for Life-cycle analysis and then description of
Finland’s electricity production structure and assumptions of its development. In addition
short description of Pöyry Energy’s study methods are made.
7.1 About GEMIS and life-cycle analysis
Global Emissions Model for Integrated Systems (GEMIS) is a life-cycle analysis (LCA)
program and database for energy, material and transport systems. With the consideration
of variety of technologies in use as well as the diversity of environmental impacts, the
environmental effects caused by energy systems are considerably complex. /43/
During resent decades the studies of environmental impacts has gone forward starting from
energy carriers (fuels) air pollutant emissions in the early seventies, which was followed
by nuclear specific impacts, heating systems and a focus of attention for above all SO2 and
NOx. Release of GHG emissions and traffic sector started to be interesting in the end of
eighties. Up until now not only direct environmental effects from energy production
systems are regarded, but also the upstream processes. /43/
The origins of the program go to Germany, year 1987, where the first version 1.0 was
released. GEMIS was made as a tool for comparative assessment of environmental effects

Assessment of Environmental Impacts of Power Generation
77
of energy made by co-operation of Öko-Institut and Gesamthochschule Kassel (GhK).
English translation for GEMIS was available since 1990 which was called TEMIS, Total
Emissions Model for Integrate Systems. Between 1993 and 1995, EM (Environmental
Manual for Power Development) was developed. EM is similar to TEMIS, but the
database was specifically adjusted to developing countries, and new features for power
planning were added. Furthermore, the "check for compliance with emission standards" is
an original EM feature. The version of GEMIS used for the current report was 4.42 and it
has all models integrated. /43/
GEMIS uses the Life Cycle Analysis or Life Cycle Assessment (LCA) where also the
materials of construction of the processes are considered. “This integrated way of looking
at energy and material flows puts up high standards to database and computer modelling
and it cancels the distinction between “energy referred” environmental assessments and
such in other sectors (e.g. consumer goods, traffic)” as Öko Institut says in their
introduction for their program. /43/
7.1.1 The life cycle assessment method
LCA is a general method suitable for analysing products, processes or services regardless
of their nature or extent. The objective of LCA is to describe and evaluate the overall
environmental impacts of a certain action by analysing all stages of the entire process from
raw materials supply, production, transportation and energy generation to recycling and
disposal stages following actual use. LCAs should include all relevant physical-chemical
activities, that are connected with the supply of an (energy)-service or a product. All
relevant transports as well as the production of materials and auxiliary products should be
considered, too /21/. Environmental impacts of the supply of an energy-carrier or material
result from all processes should be involved. Auxiliary energies and the processes
supplying them cause environmental effects through indirect impacts resulting partially
from loops and other process chains. LCAs can not be calculated simply linear. The same
applies to the fact, that materials preliminary work is included in LCAs, which extends
data and modelling considerably. Besides energy flows, now also material flows have to
be considered as well as connections between both. Extraction, transports, conversions etc.
(with specific environmental impacts) have to be paid attention to in connection with
material process chains, too. /43/

Assessment of Environmental Impacts of Power Generation
78
LCA is a technique to assess the environmental aspects and potential impacts associated
with a product, process or service, by /17/:
- Compiling an inventory of relevant energy and material inputs and the
associated emissions to the environment;
- Evaluating the potential environmental impacts associated with identified
inputs and emissions
- Interpreting the results to facilitate making a more informed decision.
Inputs may be divided into the following stages /17/:
- Raw materials
- Manufacturing
- Use/reuse/maintenance
- Recycle/waste management
Outputs may be listed as the following /17/:
- The products
- Atmospheric emissions
- Waterborne wastes
- Solid wastes
- Co-products
- Other releases
Life Cycle Analysis was used in The World Energy Councils (WEC) study of various
energy production forms in 2002-2004 Studies Work Programme. The objective was to
identify existing LCA studies, review them and prepare a compilation report. /17/
7.1.2 Stages of LCA
The LCA process is a systematic approach that consists of four stages /17/:
- Goal definition and scoping
- Inventory analysis
- Impact assessment
- Interpretation
The three mains stages (Goal definition and scoping, Inventory analysis, Impact
assessment) are connected to interpretation. Stages of LCA are shown in Figure 7.1. /17/

Assessment of Environmental Impacts of Power Generation
79
Figure 7.1 Stages of LCA /17/
Goal definition and scoping:
In this stage the purpose and method of including life-cycle environmental impacts in LCA
are defined. The following six decisions should be made in the beginning of the LCA
process /17/:
- Definition of goal(s)
- Determination of information types needed
- Determination of way the data should be organised and the results
displayed
- Determination of what will or will not be in included
- Determination of required data accuracy
- Determination of ground rules for performing the analysis
Inventory analysis
Inventory analysis (LCI) is a process for quantifying the energy and raw material
requirements, atmospheric emissions, waterborne emissions, solid wastes and other
releases for the entire life cycle of a product, process or activity. In this analysis all
relevant data are collected and organized. The level of accuracy and detail of the collected
data is reflected throughout the whole LCA process. The outcome of the inventory analysis
is a list containing the quantities of pollutants released to the environment and the amount
of energy and materials consumed in the life cycle of the product. /17/
Goal definition & scoping
Inventory analysis
Impact assessment
Inter-pre- tation
-Product development
-Stratecic planning
-Marketing

Assessment of Environmental Impacts of Power Generation
80
Information for life cycle inventory is collected with following steps /17/:
- Development of a flow diagram of the processes being evaluated
- Development of data collection plan
- Collection of data
- Evaluation and reporting of results
In figure 7.2 displayed one unit process which is a single part of process flow which is
series of interconnected unit processes.
Figure 7.2 Single unit-process /17/
Impact assessment
Life-cycle impact assessments (LCIA) purpose is to determine and evaluate the potential
human health and environmental impacts of the environmental resources and releases
identified during the LCI process. Table 7.1 describes the common categories used from
impact analysis. /17/
Processing
(e.g. Combustion)
Product (e.g. Electricity)
By-product (e.g. Gypsum)
Airborne waste
Liquid waste Solid waste
Energy
Raw Material

Assessment of Environmental Impacts of Power Generation
81
Table 7.1 Life cycle impact categories /17/
Impact Category Scale Relevant LCI Data
Common Characterisat
ion Factor
Description of Characterisation
Factor Carbon Dioxide (CO2) Nitrous Oxide (N2O)
Methane (CH4) Chlorofluorocarbons (CFCs) Hydrochluorofluorocarbons
(HCFCs)
Global Warming Global
Methyl Bromide (CH3Br)
Global Warming
Factor (GWP
Conversion of data in to (e.g. CO2 equivalents)
Chlorofluorocarbons (CFCs) Hydrochluorofluorocarbons
(HCFCs) Halons
Stratospheric Ozone Depletion
Global
Methyl Bromide (CH3Br)
Ozone Depleting Potential
Conversion of data into
trichlorofluoromethane (CFC-11) equivalents
Regional Sulphur Oxides (SOx) Nitrous Oxide (N2O)
Hydrochloric Acid (HCL) Hydrofluoric Acid (HF)
Acidification Local
Ammonia (NH4)
Acidification Potential
Conversion of data in to hydrogen (H+)
ion equivalents
Photosphate (PO4) Nitrogen Oxides (NOx) Nitrogen dioxide (NO2)
Nitrates Eutrophication Local
Ammonia (NH4)
Eutrophication Potential
Conversion of data into phosphate (PO4)
equivalents
Photochemical Smog Local Non-methane volatile organic
compounds (NMVOC)
Photochemical Oxidant Creation Potential
Conversion of data into ethane (C4H6)
equivalents
Terrestrial Toxicity Local
Toxic chemicals with a reported lethal concentration to
rodents LC50
Converts LC5 date into equivalents
Aquatic Toxicity Local
Toxic chemicals with a reported lethal concentration to
fish LC50
Converts LC5 date into equivalents
Global Regional Human Health
Local
Total releases to air, water and
soil LC50 Converts LC5 date
into equivalents
Global Quantity of minerals used Regional Resource
Depletion Local Quantity of fossil fuels used
Resource Depletion Potential
Converts data into ratio of quantity of
resource versus quantity of resource
left in reserve
Land Use Global Quantity disposed of in a landfill Solid waste
Converts mass of solid waste into
volume using and estimated density
An LCIA provides a systematic procedure for classifying and characterising different
types of environmental effects, establishing a linkage between the product and processes
and its potential environmental impact. For example, with LCIA all the compounds that
may cause global warning are gathered and for each are determined GWP factor for
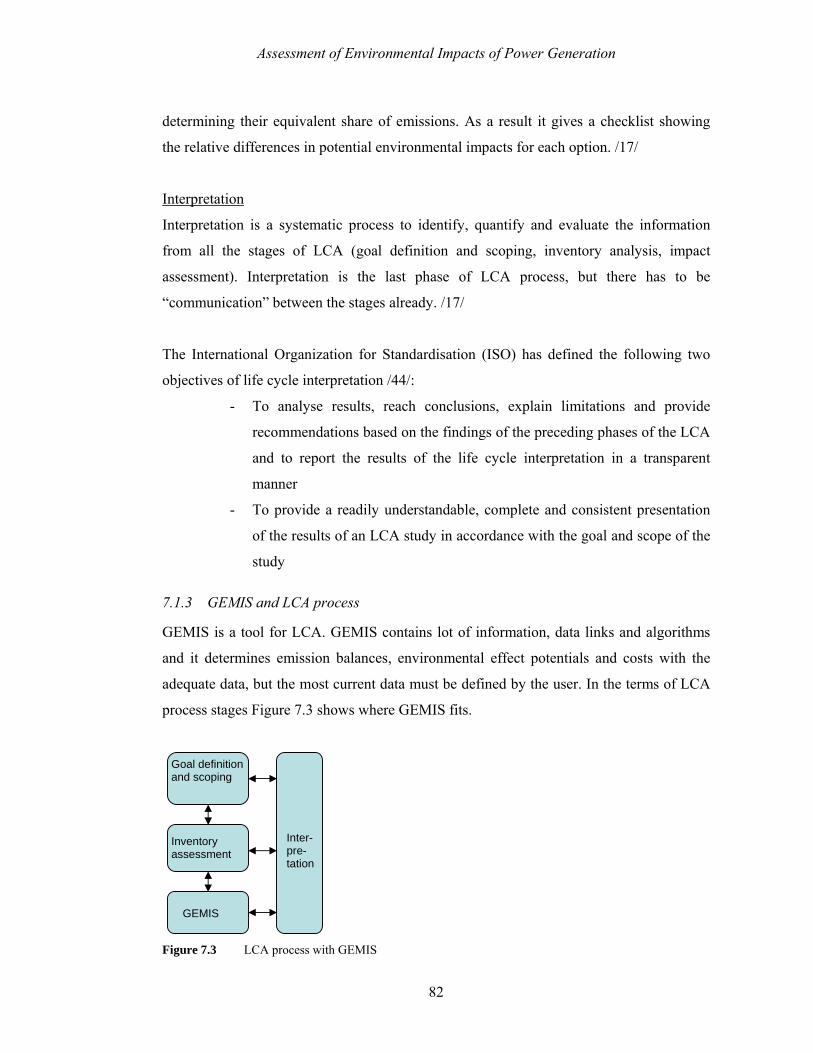
Assessment of Environmental Impacts of Power Generation
82
determining their equivalent share of emissions. As a result it gives a checklist showing
the relative differences in potential environmental impacts for each option. /17/
Interpretation
Interpretation is a systematic process to identify, quantify and evaluate the information
from all the stages of LCA (goal definition and scoping, inventory analysis, impact
assessment). Interpretation is the last phase of LCA process, but there has to be
“communication” between the stages already. /17/
The International Organization for Standardisation (ISO) has defined the following two
objectives of life cycle interpretation /44/:
- To analyse results, reach conclusions, explain limitations and provide
recommendations based on the findings of the preceding phases of the LCA
and to report the results of the life cycle interpretation in a transparent
manner
- To provide a readily understandable, complete and consistent presentation
of the results of an LCA study in accordance with the goal and scope of the
study
7.1.3 GEMIS and LCA process
GEMIS is a tool for LCA. GEMIS contains lot of information, data links and algorithms
and it determines emission balances, environmental effect potentials and costs with the
adequate data, but the most current data must be defined by the user. In the terms of LCA
process stages Figure 7.3 shows where GEMIS fits.
Figure 7.3 LCA process with GEMIS
Goal definition and scoping
Inter-pre-tation
Inventory assessment
GEMIS

Assessment of Environmental Impacts of Power Generation
83
LCA process with utilization of GEMIS starts normally with the stage of defining the
goal(s) and scoping, for determination of objective of the projects. Inventory assessment is
to determine which data has to be given for GEMIS. GEMIS has extensive database of
processes and products, but even with the upgrades and extensions for the program, some
data comes fast obsolete or the nature of the project requires special values. /43/ Figure 7.4
describes GEMIS data and category setting for the impact assessment.
Figure 7.4 GEMIS and LCI and LCIA /45/
7.1.4 GEMIS database, processes, products and scenarios
The GEMIS database is supplied with information on energy carriers (process chains and
fuel data) as well as different technologies for heat and electric power generation. /43/
GEMIS Qualitative Data
Quantitative Data
Risks (routine)
Ecosystem
Land use
Solid wastes
Flow Data
Cost Impacts
Environmental Impacts Internal
External
Materials fuel use, transport demands
Resource use (Primary & Secondary)
Airborne emissions
Greenhouse gases
User-defined emissions
Liquid
Land use

Assessment of Environmental Impacts of Power Generation
84
The information includes /43/:
- Fossil fuels (hard coal, lignite, natural gas, oil), renewable, nuclear, biomass
(residuals, and wood from short-rotation forestry, miscanthus, rape oil etc),
household waste and hydrogen (including fuel composition, and upstream
data)
- Processes for electricity and heat (various power plants, co-generators, fuel
cells, etc.)
- Materials: raw and base materials, and especially those for construction,
and auxiliaries (including upstream processes)
- Transports: airplanes, bicycles, buses, cars, pipelines, ships, trains, trucks
(for diesel, gasoline, electricity, and bio-fuels) and freight transport (trucks,
LDVs, train ships and pipelines)
- In addition processes for: waste treatment (disposal), monetary
The process data are given for a variety of different countries, and a special set of data
refer to the situation in developing counties. Each and every data item can be adjusted for
the work with the core database which covers more than 8000 processes in over 20
countries in the version 4.42, which was used in this report.
In the GEMIS total life-cycle analysis are included the impacts from “every step of the
way” i.e. fuel delivery, materials used for construction, waste treatment, and
transports/auxiliaries. For each process GEMIS database covers following details /43/:
- Efficiency, Power, Capacity factor, Lifetime
- Direct air pollutants: SO2, NOx, halogens, particles, CO, NMVOC
- greenhouse-gas emissions: CO2, CH4, N2O, SF6, all other GH gases defined
by the Kyoto protocol
- Solid wastes: ashes, overburden, FGD residuals, process wastes
- Liquid pollutants: AOX, BOD5, COD, N, P, inorganic salts
- Land use
Analyzing of costs is also included with the implemented data for fuels and energy
systems. Further more, GEMIS allows to asses the results of computations of
environmental and cost analyses by valuing the results as aggregated indicators /43/:

Assessment of Environmental Impacts of Power Generation
85
Resources into:
- CER (Cumulated Emission Requirement): indicator for energy systems and
can be used as a "proxy check" in life-cycle analyses (LCA)
- CMR (Cumulated Material Requirement): A quantitative measure of the
total amount of raw material needed to deliver a product or a service. In
GEMIS, the CMR is the material complement to the CER
Greenhouse gases into:
- CO2 equivalents: result of the aggregation of greenhouse gases which takes
into account their respective global warming potentials (GWP, see chapter
2.4)
Air pollutants into:
- SO2 equivalents: quantitative expression of the acidification potential based
on the relative acidity of SO2. In SO2 equivalents, also the air emissions
NO2, HCl, HF, NH3 and H2S are included
- Ozone-precursor equivalents: Or tropospheric ozone precursor potential
(TOPP) is the mass-based equivalent of the ozone formation rate from
precursors, measured ozone precursor equivalents. The TOPP represents the
potentially formation of near-ground (tropospheric) O3 (ozone) which can
cause summer smog.
In addition GEMIS calculates the external costs resulted by avoiding the emissions.
Products of GEMIS
Products in GEMIS represent the inputs and outputs of processes during the energy flow
chain. Products are the lines between the energy conversion processes as shown in figure
7.5 below. Important products are energy carriers and materials serving to link processes.
Products can be main products for the conversion or auxiliary products needed for the
main conversion. An important sub-type of different energy carriers are fuels e.g. coal, oil,
natural gas. /43/

Assessment of Environmental Impacts of Power Generation
86
Figure 7.5 Energy production chain and effects caused during the processes /45/
All products have connected to them information which is needed to calculate costs and
emission released from using these fuels /43/:
- Specified costs for materials and energy carriers (e.g. prices)
- fuel inventories of harmful substances
Processes
Processes represent an activity of converting a given energy or material input into another
energy or material output or an activity of transport. Processes are also described in the
figure 7.5 and as example of processes /43/:
- Power plants converting fuel (input) to electricity (output)
- Refineries converting fuel into another
- Steel works converting pig-iron to steel
- cars rendering person transport service
Extraction Transport
Conversion Transport
Combustion
Transport
Energy resource e.g. Oil
Air pollutants
Greenhouse gases Air pollutants
Greenhouse gases
Liquid/Soil wastes
Air pollutants
Greenhouse gases
Liquid/Soil wastes
Liquid/Soil wastes Land use
Air pollutants
Greenhouse gases
Liquid/Soil wastes
Land use
Land use
Air pollutants
Greenhouse gases
Liquid/Soil wastes
Land use
Product e.g. electricity Land use
Product e.g. Heat energy
Auxiliary energy flow
Main energy flow
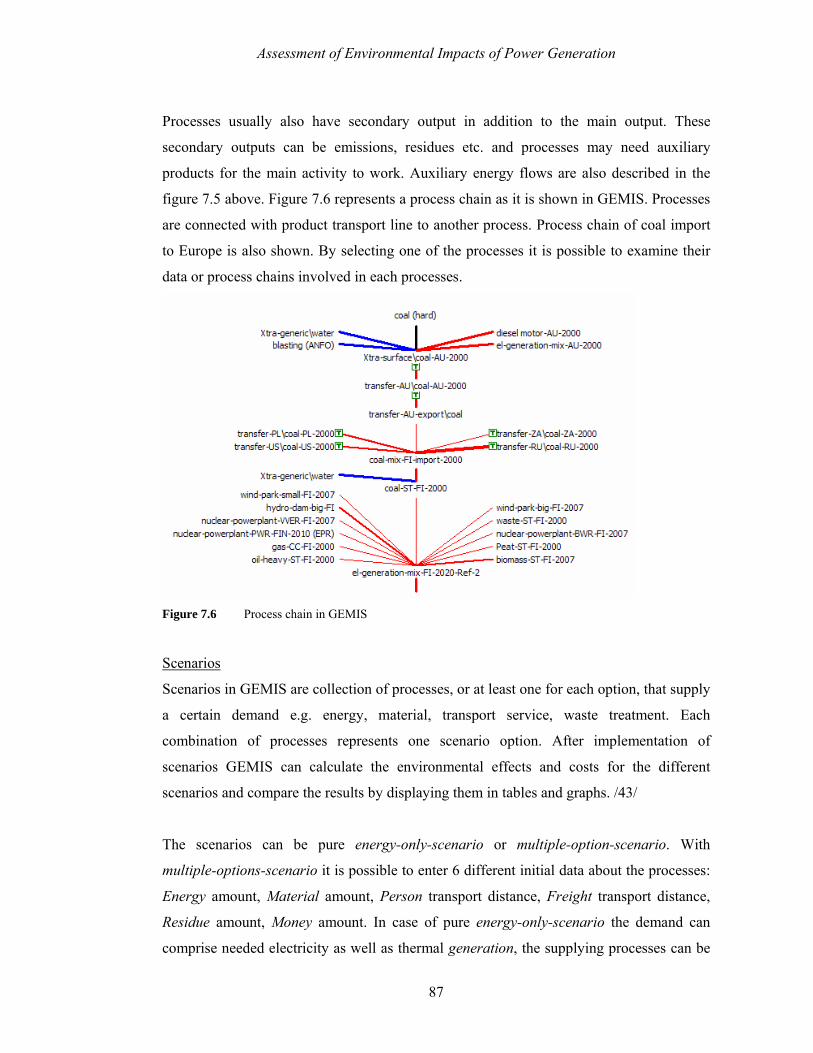
Assessment of Environmental Impacts of Power Generation
87
Processes usually also have secondary output in addition to the main output. These
secondary outputs can be emissions, residues etc. and processes may need auxiliary
products for the main activity to work. Auxiliary energy flows are also described in the
figure 7.5 above. Figure 7.6 represents a process chain as it is shown in GEMIS. Processes
are connected with product transport line to another process. Process chain of coal import
to Europe is also shown. By selecting one of the processes it is possible to examine their
data or process chains involved in each processes.
Figure 7.6 Process chain in GEMIS
Scenarios
Scenarios in GEMIS are collection of processes, or at least one for each option, that supply
a certain demand e.g. energy, material, transport service, waste treatment. Each
combination of processes represents one scenario option. After implementation of
scenarios GEMIS can calculate the environmental effects and costs for the different
scenarios and compare the results by displaying them in tables and graphs. /43/
The scenarios can be pure energy-only-scenario or multiple-option-scenario. With
multiple-options-scenario it is possible to enter 6 different initial data about the processes:
Energy amount, Material amount, Person transport distance, Freight transport distance,
Residue amount, Money amount. In case of pure energy-only-scenario the demand can
comprise needed electricity as well as thermal generation, the supplying processes can be

Assessment of Environmental Impacts of Power Generation
88
added and their operating time can be determined. Distribution system can also be included
with electricity and district heat and the demand is automatically increased by the
transmission and distribution losses, if the lengths of transport are given. /43/
Results
Results can be calculated for the each process available individually, or the results are
from fabricated scenarios. Individual results from GEMIS /43/:
- Greenhouse Gases - CO2, CH4, N2O, HCF, PCF, SF6
- Air Emissions - SO2, NOx, particulates, HCl, HF, CO, NMVOC, H2S, NH3
- Solid Wastes - ash, overburden etc.
- Liquid Effluents - AOX, BOD, COD etc.
- Resources Use: CEC, CER, and CMR
- Land Use - area affected by processes
- Costs - internal and external costs, and total costs (sum internal + external),
for energy-only-scenarios also investment- and average costs
- Employment effects
- Fuel Balance - the amounts of fuels used
- Process Turnover - detailed representation of the energy, material, and
transport turnover for all processes in each scenario option
GEMIS can show all of these results in tables and it is possible to compare different
scenarios with each other. GEMIS can also show the results graphically for chosen results
e.g. CO2 equivalents from each scenario.
7.2 Research of Pöyry Energy Oy
Finnish electricity industry wanted to create a vision how the Finland’s electricity
production structure will evolve during following decades, when electricity industry is
facing challenges set by aging production capacity, demands for competitive energy price,
low-carbon emissions and delivery guarantee, emissions restrictions, demand for
efficiency increase and targets of RES share in production. For these challenges to be met,
all the potential RES and CHP possibilities have to be utilized and also other new
production capacity.

Assessment of Environmental Impacts of Power Generation
89
The research generated scenarios for Finland’s electricity production structure for the
years 2015, 2020 and 2030 and gave as results /46/:
- The structure of Finland’s electricity production capacity, MWeq
- The structure of Finland’s electricity generation, GWheq/a
- Emissions from electricity production, tCO2/a
Scenarios were created with Pöyry’s Boiler- and power plant-database and ELMO-
electricity market model.
Boiler- and power plant-database
The Pöyry’s Boiler- and power plant-database include circa 2000 boilers, which covers 98
% of Finland’s energy productions fuel consumption. Coverage of boilers electricity
production is 100 % and consumption of coal, gas, peat and wood based fuels is nearly 100
%. Data base includes among others boiler ownership, location, commission date, plant
type, capacity, fuel consumption, production and emissions. /46/
The database includes in addition to current power plants also plants that are been
constructed and those which are planned for later construction. Needs for new power
plants are based on development of energy demand, competence of fuel sources and
production type and older plants coming obsolete. The database can be used to analyse
future energy production in Finland in different market situations e.g. effects of emissions
trading, changes in energy taxation, fuel prices, electricity demand and electricity market
price. /46/
ELMO-model
ELMO-electricity market model is developed by Pöyry Energy Oy for studying electricity
production structure and costs and also for studying the effects on them coming from
electricity market changes and from new plant investments. Modelling is done for each
hour by counting the equilibrium of supply and demand on Nordic market area. For
analysing future periods production structure is created. For each production unit is
defined variable costs (fuel price, other variable costs, emission allowances), which
defines the order in which they will operate, so that the cheapest will be first. Electricity

Assessment of Environmental Impacts of Power Generation
90
price is defined by the most expensive production unit. Price formation of the ELMO-
model is illustrated in figure 7.7. /46/
Figure 7.7 Price formation in ELMO-model /46/
7.3 Electricity production and demand predictions in Finland
Finland is energy intensive country due to its power intensive industrial structure and
northern location. Sparsely populated and fairly large land area in EU standards makes the
distances generally long, which has effect on transportation emissions and costs. Figure
7.8 shows the structure of Finland’s electricity production in year 2007 by energy source
and figure 7.9 describes the energy supply in 2007 through production types. Peak loads
occur during winter on very low temperatures and when water reservoirs are low energy
import is not available from Sweden or Norway.
Hydro
Condes. and CHP
Import / Export
Consump-tion
Fuel prices
CO2 price
Hyrdo power model
Thermal power model
Marginal system price (with optimized hydro power)
Energy production model
Fuel consumption
Balance
Emissions
Price effect from Emissions Trading
Market Price

Assessment of Environmental Impacts of Power Generation
91
Figure 7.8 Electricity production divided by sources in 2007 /47/
Figure 7.9 Finland’s power supply in 2007/47/
Nordic countries form a fairly consistent electricity market area which electricity market
price is determined in Nordic electricity power exchange Nord Pool. Congestion points
still occur between border interconnection lines and longitudinal transmission within the
countries of Finland, Sweden and Norway. Finland has also interconnection lines between
Estonia and Russia. Table 7.2 shows the capacities of Finland’s interconnection lines and
planned ones.
Nuclear power24,9 %
Condense etc16,1 %
Net imports13,9 %
Hydro power15,5 %
Co-generation district heating
16,1 %
Wind power0,2 %
Co-generation (CHP), Industry
13,3 %
Hydro power15,5 %
Wind power0,2 %
Bio fuel10,9 %
Waste fuels0,7 %
Natural gas11,4 %
Coal14,8 %
Oil 0,4 %
Net imports13,9 %
Nuclear power24,9 %
Peat7,3 %

Assessment of Environmental Impacts of Power Generation
92
Table 7.2 Interconnection capacities from Finland /48/
Voltage [kV] Capacity from Finland [MW]
Capacity to Finland [MW]
220 400 400
1200 1600
400 550 550 Sweden
110 80 80 Norway 100 100 100
110 - 100 2X400 -
400 - 1400 Russia
110 - 60 Estonia 150 350 350
Total 3045 4240
During time of inspection there will be several power plants coming obsolete due to
tightening environmental legislation and ageing of the power plants. Some estimates say
that almost third of Finland’s power generating capacity will come obsolete by the year
2020, which would be 4000 MW. Pöyry Energy made the estimations of capacity and they
were based on /46/:
- Estimates of the market participants
- Operation time defined by the LCP-directive (see chapter 3.1.6), for those
plants for which it affects
- Other thermal plants on the bases of Pöyry’s own database
- Two nuclear power units are expected become obsolete during end of year
2027 and 2030
Figure 7.10 displays the estimated energy capacity from 2003 to 2030 including the
expected energy demand curve.

Assessment of Environmental Impacts of Power Generation
93
Figure 7.10 Peak-time capacity demand and available capacity in Finland from 2003 until 2030, separate
el. prod. means condensing power supply /46/
The maximum capacity in the figure 7.10 does not show the importing capacities or the
system reserves i.e. Gas-turbine plants for maintaining operational reliability and 90% of
hydropower capacity reserved for frequency regulation and transient disturbances. Source
for these statistical peak load capacity is the Finland’s Transmission System Operator
(TSO) Fingrid and the Finnish Electricity Market Authority. /46/
Finnish electricity demand is expected to rise due to favourable predictions on economic
development and stable growth. Growth of the demand will slow down resulting from
growing energy efficiency, technological development and partly political control. Figure
7.11 describes the expected energy consumptions in Finland. /46/
Separate Electricity prod.Distric heating CHP prod.
Nuclear power
Industrial CHP
Hydro power
Demand

Assessment of Environmental Impacts of Power Generation
94
Figure 7.11 Finland’s energy consumption and forecast /47/
7.4 Assumptions on electricity generation possibilities
Assumptions are made according to resent studies about the potential of Biomass,
hydropower and wind power capacity addition in Finland. These generation types were
chosen because of their restrictions for extra capacity possibilities.
7.4.1 Hydropower
Amount of hydropower is expected to rise in Finland and in other Nordic countries, which
is of essence for Finland also. The rise of Finland’s hydropower capacity is due to
additional power plant capacity and estimations of production increase resulting from the
climate change. Estimations and assumptions are based on research done by Vesirakentaja
Oy in year 2007 and it was done for Finnish electricity industry. /49/
Result of the research was that in Finland there exists in total 1710 MW, in energy 6,7
TWh/a, un-built hydropower potential, which is about half of hydropower operational
currently. Hydropower suitable for electricity systems regulation needs could be built 470
MW, in energy 1,3 TWh/a, by the year 2020. Fourth of this capacity would be
implemented as change of plant machineries in already existing plants. For many of the
potential sites from hydropower exists environmental regulations and decisions which
could without re-evaluation prevent the projects implementation. Major possibilities exist
in Ounas- and Ii-river where exists sites for 460 MW extra capacity, in energy 1,6 TWh/a.
Both of these water courses are protected areas. Small hydropower plants are possible to
0
20
40
60
80
100
120
1930 40 50 60 70 80 90 2000 2010 2020 2030
TWh
Stat.
Forecast

Assessment of Environmental Impacts of Power Generation
95
build for the amount of 63 MW, 223 GWh/a which are expected to be realized before year
2020, unless the state subsidy policy changes for support of hydropower. The rest of the
potential hydropower sites are protected areas which means the border-rivers which have
hydropower potential of 502 MW, 2872 GWh/a, but construction of hydropower in these
areas is not realistic. These rivers are part of Natura 2000 (see chapter 3.1.9) and these
rivers are important part of fishing industry. In addition building on border-rivers is not
possible only on Finland’s decision. /49/
In total hydropower economically and technically eminent potential is 9834 MW, 2976
GWh/a from which hydropower which are not protected and raise of power output from
old plants 367 MW, 639 GWh/a. Hydropower potential in protected areas totals on amount
569 MW, 2337 GWh/a. Protection legislations on state level are special protection law on
Ounas-river and protection of rapids are the rest. Vuotos-river is partly Natura-2000 area.
/49/
Pöyry Energy used in their calculations growth of hydropower capacity 450 MW, 1,5
TWh/a, until year 2020 and total of 900 MW, 3,0 TWh/a until year 2030 which are fully
capable for regulation purposes. According to ILMAVA-review medium water-reservoir
year hydropower production would increase 7 – 12 % from years 1961 – 1990 until years
2021 – 2050 due to raining and excessive penetration caused by the climate change. In the
research was used figures 0,5 TWh until year 2020 and total of 1,0 TWh until year 2030
for increase of hydropower production. Table 7.3 describes the hydropower production
estimates in Nordic countries. /46/
Table 7.3 Hydropower production estimates from three Nordic countries used in Pöyry Energy
research /46/
Implemented [TWh] 2010 [TWh] 2020 [TWh] 2030 [TWh]
Finland 13 14 15,5 15,5 (17) Sweden 65 66 68 70 Norway 119 122 123 125
Total 197 201 206 212

Assessment of Environmental Impacts of Power Generation
96
7.4.2 Wind power
Wind power predictions are described on table 7.4. Estimations and assumptions are based
on the research which was had done by Finnish Energy Industries and the research was
done by Greenstream Network Oyj.
In the end of year 2007 there was 107 wind turbines in Finland which totalled in 110 MW
in capacity. Total wind energy in year 2007 was 190 GWh which was 0,2 % of Finland
total electricity produced. Potential sites for wind energy protection exist in Finland near
the coast, on the sea and on mountains in Lapland. Research done by Greenstream
Networks Oyj showed that wind energy production in Finland could be 4,5 TWh, 1500
MW by the year 2020 and 7,5 TWh, 2500 MW by the year 2030. These figures were used
in the Pöyry Energy scenarios. Wind power production estimates are described on table
7.4. /50/
Table 7.4 Wind power production /46/
2007 [TWh] 2015 [TWh] 2020 [TWh] 2030 [TWh]
Wind energy production
0,2 2,0 4,5 7,5
7.4.3 Biomass
Finland’s biomass potential exist in use of biomass coming from wood product. Largest
fuel source are black liquor which is used in forest industrial processes and solid wood
products which are both side products from forest industry, those are; powder, bark, wood
chips and so called forest fuels i.e. forest chips and stomps.
Use of black liquor is expected to rise 15 % from the medium of year 2000 from circa 40
TWh. Energy amount coming from wood bases fuels was about 28 TWh in 2006, from
which 6 TWh was from forest fuels. Use of solid wood products is expected to rise from
the part of forest fuels and the total energy from wood based products is expected to be
circa 35 TWh by the year 2020. /46/
7.4.4 Nuclear power
Finland two nuclear units are expected to be decommissioned in years 2027 and 2030.
Currently in Finland there is one nuclear unit under construction with capacity of 1600

Assessment of Environmental Impacts of Power Generation
97
MW and it is expected to be operational during the year 2011. There are applications on
way for building 1-3 new units in Finland during the years 2010 – 2030 but no decisions
have been made further from environmental mapping. In scenarios are used new nuclear
units with the same capacity as the new unit in production. /46/
7.4.5 Condensing power plants and CCS
Further condensing power plants are expected to be built after the base load requirements
are filled with nuclear, hydro and CHP production and in addition all potential wind extra-
power. Choices for condensing power plants are to use coal-fired, peat, natural-gas and oil-
fired gas turbines. Coal-fired power plants are expected to be realized. Use of CCS is
expected to be possible by commercially ready for larger power plants by the years 2015 –
2020, thus the first condensing plants are expected to be equipped with CCS added after
2020. /1/
7.5 The task and targets of the review
Following review introduces scenarios of Finland’s electricity production structure for
years 2015, 2020, and 3 scenarios for year 2030. Scenario calculations were done with
GEMIS. Basis for the scenarios were the demand of peak-load and the remaining capacity
in the year 2030 after obsolete power plants. The remaining capacity was filled with using
all potential RES, CHP and nuclear.
Results form the scenarios are:
- The structure of Finland’s electricity generation for 2007, 2015, 2020 and 3
scenarios for 2030, GWheq/a
- The structure of Finland’s electricity production capacity, MWeq
- GHG Emissions from electricity production and from the fuel production
chain for each model of energy production , CO2,eq/a
- Airborne Emissions from electricity production and from the fuel
production chain for each model of energy production , SO2,eq/a
- Costs of electricity production, €/MWh
Emissions and costs are calculated with program GEMIS which uses Life-Cycle Analysis
(LCA) for calculating emissions and costs coming from beginning (fuel mining) to end
(decommissioning) of power production chains life-curve.

Assessment of Environmental Impacts of Power Generation
98
7.6 Modelling Finland energy production structure with GEMIS
Finland’s energy production in year 2007 will be used as reference for the calculations for
the following years. Energy models for years 2015 and 2020 will be made in accordance
with planned power plant decommissions and power plant construction plans. For 2020
model will be made also in accordance with Finland’s commitment to increase the share of
renewable energy source use to 38 % (see table 3.4) by the year 2020, and assumptions are
made in that respect. For the energy model for 2030 there are 3 scenarios made with
different possibilities to meet the energy demand when more previous capacity has become
obsolete. Share of electricity import is assumed to drop due to the growing demand for
electricity and tightening capacity situation in St. Petersburg area as well as Finland’s
desire to be less dependent on imports.
7.6.1 Energy models for Finland
Following models represents energy production in Finland in 2007, 2015, 2020 and tree
scenarios for 2030. 2007 model is reference model taken from actual shares of energy
source use according to the Finnish Energy Industries. /47/
2007
Finland’s energy production by energy source in 2007 is described on table 7.5.
Table 7.5 Finland’s energy production in year 2007 by energy sources
2007 Without Import [TWh] [%] [%] [TWh]
Waste 0,63 0,7 0,81 0,63 Biomass 9,84 10,9 12,66 9,84 Peat 6,59 7,3 8,48 6,59 Natural Gas 10,29 11,4 13,24 10,29 Oil 0,36 0,4 0,46 0,36 Coal 13,36 14,8 17,19 13,36 Hydro 14,00 15,5 18,00 14,00 Wind 0,18 0,2 0,23 0,18 Nuclear 22,48 24,9 28,92 22,48 Imports 12,55 13,9
Total 90,3 100 100 77,75

Assessment of Environmental Impacts of Power Generation
99
Nuclear power was one quarter of whole energy consumption with the biggest share
followed by hydropower and mostly condensing power and heat production with Coal.
Share of electricity import was noticeably large with 13,9 % and 12,6 TWh. Share of
import is expected to increase.
2015
In table 7.6 can be seen the energy production in year 2015 with it the estimate shares and
energy amounts.
Table 7.6 Finland’s energy production in year 2015 by energy sources
Difference to 2007 2015 Demand 101 TWh [TWh] [TWh] [%]
0 Waste 0,64 0,67 2 Biomass 12 12,53 0 Peat 6,8 7,10
-0,3 Natural Gas 10 10,44 0 Oil 0,4 0,42 0 Coal 13,4 14,00
0,5 Hydro 14,5 15,15 1,8 Wind 2 2,09
13,5 Nuclear 36 37,60 Total 95,74 100 Imports 5,26
Main changes in 2015 are the additional capacity from new nuclear power reactor of 1600
MW. Share of biomass, hydropower and wind power have also increased as described in
chapters 7.5.1, 7.5.2 and 7.5.3 with energy amounts of 2, 0,5 and 1,8 TWh. 0,3 TWh of gas
power has decreased due to substitution with nuclear power. It is assumed that it would not
be possible to build a new nuclear reactor until 2015 due to long construction time (at least
6 with the new reactor) and long process of state approval for construction.
2020
In table 7.7 can be seen the energy production in year 2020 with it the estimate shares and
energy amounts.

Assessment of Environmental Impacts of Power Generation
100
Table 7.7 Finland’s energy production in year 2020 by energy sources
Difference to 2015 2020 Demand 106,5 TWh
Share of Renewables
[TWh] [TWh] [%] [%] 0 Waste 0,64 0,64 38,22 6 Biomass 18,5 18,36 0 Peat 6,8 6,75 -3 Natural Gas 7 6,95 0 Oil 0,4 0,40 -4 Coal 11,4 11,32 1 Hydro 15,5 15,39
2,5 Wind 4,5 4,47 0 Nuclear 36 35,74
Total 100,74 100 Imports 5,76
Finland’s undertake on EU’s targets on renewable energy shares are the main issue in
changes in energy production in 2020. Further more approximately 7 TWh of energy will
be decreased due to decommissioning of old condensing power plants. Hydropower and
wind power amount has increased with 1 and 2,5 TWh as described in chapters 7.5.1 and
7.5.2. In hydropower’s case, it is the limit of additional capacity unless the environmental
laws in Finland are changed. Wind power is also reaching for limits unless there regulating
power is installed into the power system. Because of these reasons the production of
biomass, mainly wood products, has to increase by 6 TWh, in case that the import level is
assumed to be approximately the same as in 2015, if Finland is to achieve the target of 38
% share of renewable resources in power production mix. It would be possible that a new
nuclear power plant would also be available by year 2020 if the state policy would be
favourable during years 2008 – 2013. It is still assumed that new reactor would not be
ready by this time due to long building process and unfavourable pro-longings in the
building process of new nuclear reactor. If a new reactor would be made by the year 2020
it would not still change the necessity of increasing power production from RES, and the
new reactor would only substitute fossil-fuel power plants. Situation is different if energy
import is yet again increased to 2007 level.
2030
In table 7.8 can be seen the base energy production in year 2030 with it the estimate shares
and energy amounts.

Assessment of Environmental Impacts of Power Generation
101
Table 7.8 Base for Finland’s energy production in year 2030 by energy sources
2030 Demand 114,6 TWh Difference to 2020 Base Model
[TWh] [TWh] [%] 0 Waste 0,64 0,71 0 Biomass 18,5 20,62 0 Peat 6,8 7,58 -1 Natural Gas 6 6,69 0 Oil 0,4 0,45 -2 Coal 9,4 10,47 0 Hydro 15,5 17,27 0 Wind 4,5 5,01 -8 Nuclear 28 31,20
Total 89,74 100 Open positon 24,86
In year 2030 two nuclear reactors has been shut down in Loviisa, and the amout of energy
is decreased by 8 TWh from 2020 power level. Furthermore, 3 TWh of condensing and
CHP production has been decommissioned during last 10 year. Open position between the
power production capacity and the projected power demand is 24,86 TWh. This amount
should be filled with new power generation capacity between years 2020 and 2030. Table
7.9 describes 3 possible models from the year 2030 and table 7.10 energy source shares in
the models.
Table 7.9 Finland’s energy production in year 2030 scenarios by energy sources
Nuclear Model
Nuclear + RES model
Combination Model
Base difference [TWh] Base
difference [TWh] Base difference [TWh]
0 Waste 0,64 0 Waste 0,64 0 Waste 0,64 0 Biomass 18,5 2,5 Biomass 21 2 Biomass 20,5 -3 Peat 3,8 0 Peat 6,8 0 Peat 6,8
-5 Natural Gas 1 -3 Natural
Gas 3 3 Natural Gas 9
0 Oil 0,4 0 Oil 0,4 0 Oil 0,4 -8,4 Coal 1 -7 Coal 2,4 2,7 Coal 12,1
0 Hydro 15,5 1,5 Hydro 17 0 Hydro 15,5 0 Wind 4,5 3 Wind 7,5 3 Wind 7,5
40,5 Nuclear 68,5 27 Nuclear 55 13,5 Nuclear 41,5 113,84 113,74 113,94 Import 0,76 Import 0,86 Import 0,66
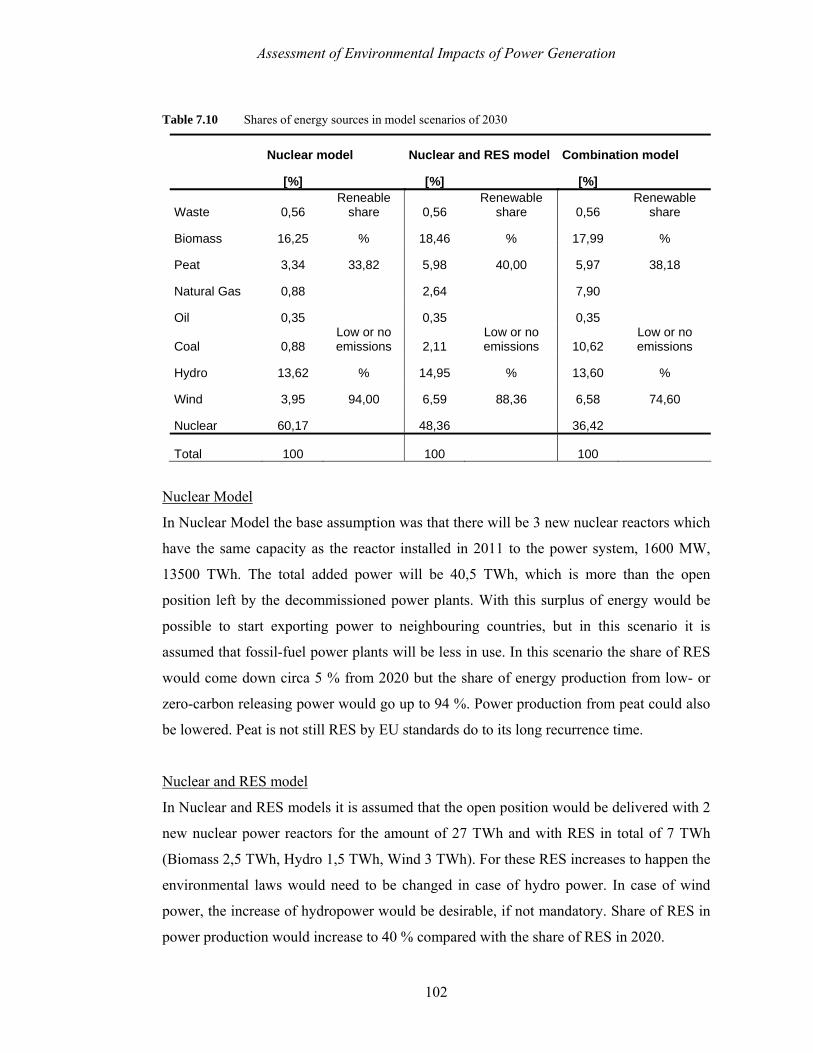
Assessment of Environmental Impacts of Power Generation
102
Table 7.10 Shares of energy sources in model scenarios of 2030
Nuclear model Nuclear and RES model Combination model
[%] [%] [%]
Waste 0,56 Reneable
share 0,56 Renewable
share 0,56 Renewable
share
Biomass 16,25 % 18,46 % 17,99 %
Peat 3,34 33,82 5,98 40,00 5,97 38,18
Natural Gas 0,88 2,64 7,90
Oil 0,35 0,35 0,35
Coal 0,88 Low or no emissions 2,11
Low or no emissions 10,62
Low or no emissions
Hydro 13,62 % 14,95 % 13,60 %
Wind 3,95 94,00 6,59 88,36 6,58 74,60
Nuclear 60,17 48,36 36,42
Total 100 100 100
Nuclear Model
In Nuclear Model the base assumption was that there will be 3 new nuclear reactors which
have the same capacity as the reactor installed in 2011 to the power system, 1600 MW,
13500 TWh. The total added power will be 40,5 TWh, which is more than the open
position left by the decommissioned power plants. With this surplus of energy would be
possible to start exporting power to neighbouring countries, but in this scenario it is
assumed that fossil-fuel power plants will be less in use. In this scenario the share of RES
would come down circa 5 % from 2020 but the share of energy production from low- or
zero-carbon releasing power would go up to 94 %. Power production from peat could also
be lowered. Peat is not still RES by EU standards do to its long recurrence time.
Nuclear and RES model
In Nuclear and RES models it is assumed that the open position would be delivered with 2
new nuclear power reactors for the amount of 27 TWh and with RES in total of 7 TWh
(Biomass 2,5 TWh, Hydro 1,5 TWh, Wind 3 TWh). For these RES increases to happen the
environmental laws would need to be changed in case of hydro power. In case of wind
power, the increase of hydropower would be desirable, if not mandatory. Share of RES in
power production would increase to 40 % compared with the share of RES in 2020.

Assessment of Environmental Impacts of Power Generation
103
Combination model
In Combination model only one new nuclear reactor is built by the year 2030 with amount
13,5 TWh in a year. This still leaves a open position of 11,4 TWh. It is assumed that new
hydro power will not be built due to the existing environmental laws in place for the
possible hydropower sites. Wind power has been increased by 3 TWh according to
estimates by Greenstream /50/. This amount needs regulating power which can be supplied
by the interconnections and new fast gas turbines. Biomass production has also been
increased by 2 TWh, though in addition of biomass power production also, especially
wood product bio-fuels, starts coming limits. Forest would need to be cleared just for
energy production, thus influencing the forest industries material needs. Additional RES
will not still be enough to satisfy the demand, if the amount of import is to be kept in
minimum. There would have to be more fossil fired CHP plants and condensing power
plants. Coal condensing has been increased by 2,7 TWh, so by one 600 MW condensing
power plant or IGCC power plant and with 3 TWh, two 250 MW CCGT natural gas power
plants
7.6.2 Results
Amount of energy produced by the energy production models are ascending as is the
demand. Further increase is explained by the lower amount of imported amount. Figure
7.12 shows the amount of energy produced in different models. Open position is filled
with energy import.

Assessment of Environmental Impacts of Power Generation
104
Figure 7.12 Demand and supply in Finland in years 2007, 2015, 2020 and 2030, open position is filled
with imported energy
Biggest differences between the models come from the production of nuclear power and it
can seen in the three energy sources of the 3 scenarios from 2030 how in the combination
model that the energy production with coal has said the same without second nuclear
reactor. This is because of need for base power which is produced mainly with coal-
condensing power plants and nuclear power.
7.6.3 Environmental effects
Table 7.11 and 7.12 below describe the results from GEMIS for GHG emissions from the
different energy production models. Difference between the results in the tables comes
from different method of calculating the emissions. Table 7.11 shows the emissions from
whole life-cycle i.e. in the calculation has been included emissions coming from waste
treatment, mobile transports and construction of the facilities. Table 7.12 describes the
emissions coming mostly from the production of energy.
2015 2030 Nuclear
2030 Nuclear + RES
2030 Combination
Energy purchasing in Finland
0
20
40
60
80
100
120
2007 2020
Ener
gy [T
Wh]
Nuclear Wind Hydro Coal Oil Natural Gas Peat Biomass Waste Demand

Assessment of Environmental Impacts of Power Generation
105
Table 7.11 Greenhouse gases from the models calculated by GEMIS including waste treatment, mobile
transport and construction
GHG emissions
Option CO2
equivalent [kg]
CO2 [kg]
CH4 [kg] N2O [kg]
Perfluoro-methane
[kg]
Perfluoro-ethane [kg]
2007 2,10E+10 1,95E+10 4,91E+07 1,19E+06 19,58 2,46
2015 2,18E+10 2,03E+10 4,97E+07 1,26E+06 21,12 2,65
2020 1,80E+10 1,67E+10 3,91E+07 1,18E+06 18,47 2,32
2030 Nuclear 4,82E+09 4,44E+09 9,57E+06 5,34E+05 6,08 0,76 2030 Nuclear + RES 7,36E+09 6,75E+09 1,70E+07 7,37E+05 8,37 1,05
2030 Combination 1,94E+10 1,80E+10 4,47E+07 1,28E+06 19,90 2,50
In tables 7.11 and 7.12, it can be seen that CO2 emissions from 2007 to 2015 increase due
to the increase of power produced with biomass and stable production of power with
fossil-fuels. Worth of noticing is also that the power production increased between years
2007 and 2015 about 18 TWh.
Table 7.12 Greenhouse gases from the models calculated by GEMIS excluding waste treatment, mobile
transport and construction
GHG emissions
Option CO2
equivalent [kg]
CO2 [kg]
CH4 [kg]
N2O [kg]
Perfluoro-methane [kg]
Perfluoro-ethane [kg]
2007 1,92E+10 1,79E+10 4,50E+07 1,15E+06 16,12 2,02
2015 1,98E+10 1,84E+10 4,52E+07 1,21E+06 17,06 2,14
2020 1,59E+10 1,48E+10 3,44E+07 1,14E+06 13,76 1,73 2030 Nuclear 3,47E+09 3,18E+09 6,17E+06 5,06E+05 1,46 0,18
2030 Nuclear + RES
5,69E+09 5,19E+09 1,29E+07 7,02E+05 3,07 0,39
2030 Combination 1,72E+10 1,59E+10 3,97E+07 1,23E+06 14,60 1,83
Difference of the two calculation methods, whether the upstream and down stream
processes emissions are included, are e.g. 2007 1,8 million tonnes of CO2 equivalents.
That is about 9,4 percent rise from the emission level of only production emissions. Figure
7.13 shows the results from in graph form from the table 7.11.

Assessment of Environmental Impacts of Power Generation
106
Figure 7.13 Results of CO2 equivalent calculations from GEMIS when waste treatment, mobile transport
and construction are included
Regardless of the calculation method similarities can be seen in the scale of emissions
from the 2030 scenarios. Nuclear and Nuclear + RES models prove to be the least GHG
emitting models, thought the Combination models GHG emissions exceeds the emissions
from 2020. Tables 7.13 and 7.14 describe the airborne emission from the power generation
models.
Table 7.13 Airborne emissions from the models calculated by GEMIS including waste treatment,
mobile transport and construction
Option TOPP
equivalent [kg]
SO2 equivalent
[kg] SO2 [kg] NOx
[kg] HCl [kg] Particulates [kg]
NMVOC [kg]
2007 6,20E+07 5,97E+07 2,52E+07 4,68E+07 1,88E+06 3,66E+06 2,16E+06
2015 6,57E+07 6,32E+07 2,66E+07 4,96E+07 2,02E+06 3,84E+06 2,24E+06
2020 6,81E+07 6,48E+07 2,65E+07 5,19E+07 2,24E+06 3,76E+06 2,13E+06
2030 Nuclear 4,43E+07 3,98E+07 1,46E+07 3,40E+07 1,56E+06 2,19E+06 1,22E+06
2030 Nuclear + RES
5,66E+07 4,98E+07 1,76E+07 4,34E+07 1,92E+06 2,56E+06 1,59E+06
2030 Combi-nation
7,27E+07 6,60E+07 2,53E+07 5,53E+07 2,24E+06 3,54E+06 2,31E+06

Assessment of Environmental Impacts of Power Generation
107
There are no differences between the calculation methods in the order of the models, but
there are differences in the amount of emissions. For example, the difference between the
two calculation methods in 2007 models are 9,1 thousand tonnes of TOPPeq. With airborne
emissions Nuclear and Nuclear + RES model are the least harmful gases emitting models
and the Combination model exceeds all. Worth noticing is that 2007 airborne emissions
are less than in 2015 and 2020 even with the difference of almost 10 % RES share, 2020
RES share 38 % compared with 2007 approximate 28 % share.
Table 7.14 Airborne emissions from the models calculated by GEMIS including waste treatment,
mobile transport and construction
Option TOPP
equivalent [kg]
SO2 equivalent
[kg] SO2 [kg] NOx
[kg] HCl [kg] Particulates [kg]
NMVOC [kg]
2007 5,26E+07 4,82E+07 1,85E+07 4,02E+07 1,66E+06 2,14E+06 1,67E+06
2015 5,53E+07 5,08E+07 1,95E+07 4,25E+07 1,78E+06 2,20E+06 1,70E+06
2020 5,76E+07 5,33E+07 2,02E+07 4,47E+07 2,05E+06 2,18E+06 1,55E+06
2030 Nuclear 3,80E+07 3,50E+07 1,26E+07 3,00E+07 1,53E+06 1,34E+06 8,40E+05
2030 Nuclear + RES
4,86E+07 4,33E+07 1,48E+07 3,83E+07 1,87E+06 1,50E+06 1,10E+06
2030 Combi-nation
6,12E+07 5,36E+07 1,85E+07 4,75E+07 2,04E+06 1,83E+06 1,67E+06
Figure 7.14 displays the airborne emissions as SO2 equivalent from the energy models
with waste treatment, mobile transport and construction included.

Assessment of Environmental Impacts of Power Generation
108
Figure 7.14 Airborne emissions from energy models
Noticeable from the airborne emissions results is the fact that even though the CO2
equivalent emissions have gone down in 2020 compared with the amount of 2007 and
2015, but the airborne emissions have gone up significantly. This is caused by the high
airborne emissions coming from wood product-based energy production. Combination
models airborne emissions surpass the emissions coming from the other models.
7.6.4 Economic aspects
GEMIS displays the costs from processes by giving out following costs:
- Internal costs: Sum of capital costs, fixed costs, variable costs and
fuel/input cost.
- External costs: Costs of emissions i.e. nuclear waste-fuel, SO2, NOx,
particulates, CO2,eq
- Investment costs: Investment costs from power plants
- Variable costs. Internal costs / produced energy
Table 7.15 below shows costs of energy production models calculated with all up and
down stream process costs included. Table 7.16 shows the costs when other processes are
not included.

Assessment of Environmental Impacts of Power Generation
109
Table 7.15 Division of costs in different models into categories, including waste treatment, mobile
transport and construction
Costs
Option Internal costs [€]
External Costs [€]
Internal + external costs [€]
Invest costs [€]
Variable costs [€/MWh]
2007 6,58E+09 1,05E+09 7,63E+09 2,93E+10 84,88731
2015 7,39E+09 1,35E+09 8,74E+09 3,36E+10 77,23626
2020 7,99E+09 1,25E+09 9,25E+09 3,61E+10 79,34686
2030 Nuclear 7,68E+09 1,52E+09 9,19E+09 4,03E+10 67,44069 2030 Nuclear + RES 8,30E+09 1,34E+09 9,65E+09 4,03E+10 73,00584 2030 Combination 8,65E+09 1,43E+09 1,01E+10 3,88E+10 75,90262
Table 7.16 Division of costs in different models into categories, excluding waste treatment, mobile
transport and construction
Costs
Option Internal costs [€]
External Costs [€]
Internal + external costs [€]
Invest costs [€]
Variable costs [€/MWh]
2007 6,54E+09 9,71E+08 7,51E+09 2,93E+10 8,45E+01 2015 7,36E+09 1,26E+09 8,62E+09 3,36E+10 7,68E+01 2020 7,94E+09 1,17E+09 9,11E+09 3,61E+10 7,89E+01 2030 Nuclear 7,63E+09 1,47E+09 9,10E+09 4,03E+10 6,71E+01 2030 Nuclear + RES 8,25E+09 1,28E+09 9,53E+09 4,03E+10 7,25E+01 2030 Combination 8,59E+09 1,34E+09 9,93E+09 3,88E+10 7,54E+01
Regardless of the calculation method, the total costs grow evenly until year 2020. Nuclear
scenario of 2030 is slightly cheaper than the 2020 model, but the nuclear + RES and the
combination models are more expensive. External costs resulting from emissions and
waste management are highest with the nuclear model, but the low fuel costs lower the
total costs still to its favour. The most expensive model is the Combination model with
high internal cost, and external costs also exceed just below costs of nuclear model. Figure
7.15 displays the internal and external costs in a graph.

Assessment of Environmental Impacts of Power Generation
110
Costs
0,00E+00
2,00E+09
4,00E+09
6,00E+09
8,00E+09
1,00E+10
1,20E+10
2007 2015 2020 2030 Nuclear 2030 Nuclear +RES
2030 Combination
Cos
ts [€
]
External costsInternal costs
Figure 7.15 External and Internal costs of models
Inspection of investment costs alone show how the high capital costs of nuclear power
raise the investment costs of Nuclear model high, but in truth with more accurate
inspection, can be noticed that the investment costs are the highest with Nuclear and RES
mode by 30 million € higher than Nuclear model. Figure 7.16 below shows a graph of the
investment costs.
Figure 7.16 Investment costs of energy models
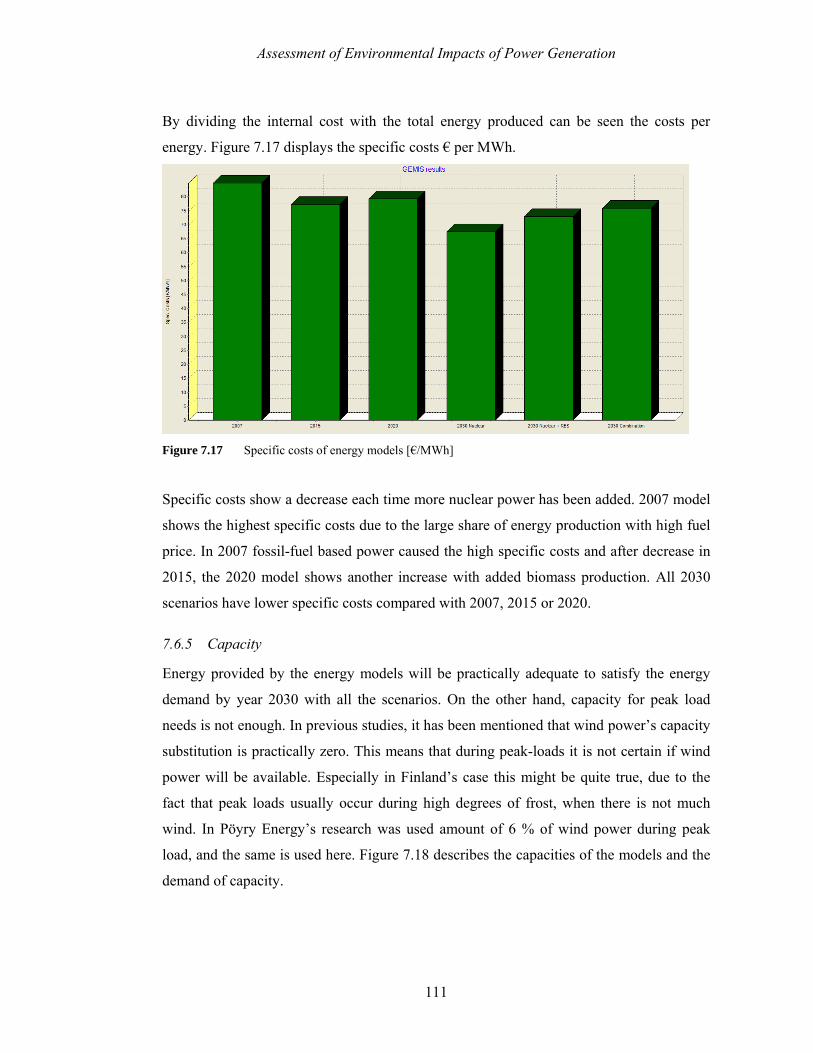
Assessment of Environmental Impacts of Power Generation
111
By dividing the internal cost with the total energy produced can be seen the costs per
energy. Figure 7.17 displays the specific costs € per MWh.
Figure 7.17 Specific costs of energy models [€/MWh]
Specific costs show a decrease each time more nuclear power has been added. 2007 model
shows the highest specific costs due to the large share of energy production with high fuel
price. In 2007 fossil-fuel based power caused the high specific costs and after decrease in
2015, the 2020 model shows another increase with added biomass production. All 2030
scenarios have lower specific costs compared with 2007, 2015 or 2020.
7.6.5 Capacity
Energy provided by the energy models will be practically adequate to satisfy the energy
demand by year 2030 with all the scenarios. On the other hand, capacity for peak load
needs is not enough. In previous studies, it has been mentioned that wind power’s capacity
substitution is practically zero. This means that during peak-loads it is not certain if wind
power will be available. Especially in Finland’s case this might be quite true, due to the
fact that peak loads usually occur during high degrees of frost, when there is not much
wind. In Pöyry Energy’s research was used amount of 6 % of wind power during peak
load, and the same is used here. Figure 7.18 describes the capacities of the models and the
demand of capacity.

Assessment of Environmental Impacts of Power Generation
112
Figure 7.18 Peak capacity and demand when 6 % wind is available, [MW]
Capacity need becomes smaller in 2015 with the new nuclear reactor, but after
decommissioning of several condensing plants by year 2020 and 2030 the peak load
capacity need grows. As table 7.2 showed, Finland’s importing capacity is 4240 MW,
which is more than enough to supply that capacity need, but it does not solve the problem
of being self-sufficient regarding power supply. Capacity need, in theory, could be
supplied with wind power, but due to wind powers intermittency availability of the
capacity is not certain. Full capacity from hydropower is not either guaranteed due to
seasonality of hydro power capacity. Table 7.17 describes the peak load capacity need in
different models with 6 % of wind capacity but full hydro capacity.
Table 7.17 Total peak load capacity need in models
2007 [MW]
2015 [MW]
2020 [MW]
2030 Nuclear [MW]
2030 Nuclear + RES [MW]
2030 Combination [MW]
Capacity need
1784 1770 2365 2445 2855 2315
Peak load capacity need requires still more investments on power capacity even if the
energy need would be satisfied, if imported energy is not desired or if it is not available.
Investment on power reserves will come with high price especially in case of Nuclear +
RES model where the capacity need is almost 3000 MW. The type of reserve power
depends on the duration of peak loads. With longer duration time it is reasonable to invest
on coal condensing plants rather then fast gas turbine plants.
Capacity and Demand
0 2007 2015 2020 2030 Nuclear 2030 Nuclear
+ RES 2030 Combination
Wind Waste Peat
GasOil Coal Nuclear Hydro
200
4000
6000
8000
10000
12000
14000
16000
18000
20000
Demand
Biomass

Assessment of Environmental Impacts of Power Generation
113
8 Conclusions
Objective of this thesis was to clarify environmental and energy policies at present and
what are the technological and economical backgrounds for the direction that energy
politics have taken. First part of this thesis went through the legislative framework in place
concerning environmental effects from power generation, described power generation
technologies in use as well as their means of causing environmental impacts and examined
the relationship between world economy and environmental impacts. Second part of this
thesis formulated an example computation for environmental effects from alternative
power generation possibilities in future in Finland.
At present political acts and public opinion is to lower GHG emission by building more
RES power supply, even though switching from fossil fuel sources to renewable sources
brings extra costs. At the present energy fuel prices changing to renewable sources will
raise the electricity prices. Comparing energy price between energy produced with nuclear
and wind, the factor is 2 - 3. In some cases additional drawbacks from RES appear from
the nature of being intermittent, so they are not suited for base power production, and they
are highly dependent on its location. RES are usually best suited for extra-power
production, but in most cases they can’t be calculated as extra-capacity.
The relationship between environment and world economics goes both ways and the
effects can be seen on both side in the long run. Weather or not the effects of climate
change will be 1,4 – 5 °C temperature increase and whether that will cause 5 - 20 % fall on
GDP of the world can be argued, but in any case environment will cause damage both to
the world economy and energy industry unless changes are made towards more sustainable
power production structure.
The example computation was made for this thesis with GEMIS (Global Emissions Model
for Integrated Systems) program to form scenarios for Finland’s power generation until
year 2030. GEMIS uses Life-Cycle Assessment method for calculating environmental
effects from integrated systems. Scenarios were made in accordance with Finland’s
possibility to add certain generation types and also with Finland’s commitment for

Assessment of Environmental Impacts of Power Generation
114
improving energy efficiency, increasing share of renewable energy sources use and
decreasing emissions.
The results of the calculations presented in this thesis are not exact and the models can not
fully describe the different technologies characteristics in fuel consumptions and emissions
being emitted. Furthermore the costs of power plants construction or operation are not
exact and costs of different emissions and releases can not be perfectly valued.
Nevertheless, the results shown by the GEMIS life-cycle analysis are indicative to the true
scale of results and conclusions can be made in that respect.
Some assumptions made in this computation can also be argued, but from the results can
be made estimates for other alternative energy model for the future. For instance the 2015
model shows an increase in emissions and 2020 shows an emission decrease at the cost of
electricity price, which will most likely rise due to higher production costs. Both of these
“faults” might be possible to correct by keeping the amount of imported energy the same
and by lowering the amount of energy produced with fossil-fuel sources or other
production types with higher marginal costs.
The scenarios for 2030 have also disputable issues. It has been assumed that the future
technologies used in the new power plants have higher efficiencies and lower emissions
than the existing power plants. CCS has not been added. CCS would lower the emissions
from the Combination-model from the part of new plants and it could be possible to add
CCS to the old plants in all of the models lowering the emissions from other models also.
Emission levels from Combination model would most likely be similar to emissions from
Nuclear + RES-model, but the costs would grow even higher, caused by lowering of
efficiencies and rise capital and operating costs. CCS was not included for the calculation
due to lack of data.
Another possibility for changes in energy modelling is the possibility that the energy
demand would not increase. With stable demand of 90 TWh from 2007, the need for new
capacity would only be directed at substituting power plants that are coming obsolete and
for substitution of imported energy. Emissions coming from energy production can be
lowered by changing into renewable energy sources or low-carbon energy sources. Right

Assessment of Environmental Impacts of Power Generation
115
course of action is not clear. RES guarantees continuous energy supply but with high cost,
intermittent power supply and possible effects on prices of other commodities e.g. effect
cultivation of biomass and bio-fuel on food prices. Nuclear power brings big supply of
cheap energy, but it has its waste handling requirements among other issues.
Seemingly best choice would be the Nuclear + RES model where there would be
continuous support for RES yet still energy production with decent price would be ensured
by large quantity of new nuclear power. Further need for large quantity of cheap energy in
Finland comes when last two older BWR reactors are decommissioned, which will happen
in following decade after 2030. As the coal resources are still abundant in close future,
further development and inauguration of CCS technologies would be beneficial. Nuclear +
RES-model also would require addition of hydropower, which would mean further
examination of environmental laws in place.
All of the energy models would still require additional reserve capacity. Peak load capacity
needs grow from 2007 steadily and none of the models can satisfy the capacity need.
Capacity would be in all of the models enough if full wind and hydro power could be
accounted for peak load capacity needs. Capacity need requires further investment on
reserve power plants or in Nuclear-models case retaining coal and gas power for reserve
purposes.
For countering the challenges of emission reduction would be best to concentrate on all
low-carbon emitting power production technologies, such as nuclear power, as well as to
promote and make more cost-effective the use of emission reducing technologies such as
CCS. Concentration on promoting only RES technologies is not beneficial for power
systems operation and it raises the energy prices unnecessarily while it is still possible to
produce cheap base power. Change will have to be made gradually so that all possible low-
carbon power production is used while it is still available. Future will bring new
challenges with depletion of fossil fuels and Uranium-235. Solution may be found in IV
generation nuclear reactors and possibly fusion technology, while many RES technologies
(e.g. solar, wave and geothermal) have to also become more mature for lowering the
energy price.

Assessment of Environmental Impacts of Power Generation
116
9 References
/1/ Fundamentals of Carbon Capture and Storage Technology, London, 2007,
The Petroleum Economist Ltd, ISBN: 1861862776
/2/ IAEA, Key World Energy Statistics, Paris, 2007, OECD/IAEA, www.iea.org
/3/ EUROSTAT, EU-25 Energy Fiches, 2006, EUROSTAT, TREN C1,
http://epp.eurostat.ec.europa.eu
/4/ Capros, P.,The Primes energy system model: Reference Manual, Athens,
/5/ Union of the Electricity Industry – EURELECTRIC, Environmental
Statistics of the European Electricity Industries; Trends in Environmental &
Sustainability Performance 2005-2006, Brussels, 2008, www.eurelectric.org
/6/ Vuori, R., Lautkaski, R., Lehtilä., A., Suolanen, V., Katsaus eri
energiatuotantomuotojen ympäristövaikutuksiin (Review on environmental
impacts of different energy production froms), Espoo, 2002, VTT – Research
Notes 2127, ISBN: 951-38-5948-7 (in Finnish)
/7/ IPCC- Intergovernmental Panel on Climate Change- www.ipcc.ch/ - Climate
Change 2007 Synthesis Report, Valencia, 2007, IPPC
/8/ Union of the Electricity Industry – EURELECTRIC, Environmental
Statistics of the European Electricity Industries; Trends in Environmental
Performance 2003-2004, Brussels, 2006, www.eurelectric.org
/9/ Union of the Electricity Industry – EURELECTRIC, Key Environmental
Protection Issues of the EU and CIS Power Market Integration, Brussels,
2005, EURELECTRIC, www.eurelectric.org
/10/ UNFCCC- United Framework Convention on Climate Change, United
Nations, http://unfccc.int/essential_background/items/2877.php
/11/ UNFCCC, Kyoto Protocol Reference Manual on Accounting of Emissions
and assigned Amounts, 2007, UNFCCC secretariat
/12/ EU burden sharing, internet: (ref. 5.5.2008) http://www.eea.europa.eu/
/13/ European Commission, The European Climate Change Programme, 2006,
European Communities, ISBN: 92-79-00411-5
/14a/ Commission of the European Communities, Renewable Energy Road Map:
Renewable energies in the 21st century: building a more sustainable future,
Brussels, 2007, COM(2006) 848 final

Assessment of Environmental Impacts of Power Generation
117
/14b/ Commission of the European Communities, Directive of the European
Parliament and of the Council on the promotion of the use of energy from
renewable sources, Brussels, 2008, COM(2008) 19 final
/14c/ Tekniikka&Talous-article, (ref. 5.5.2008) internet: http://www.tekniikka
talous.fi/energia/article25799.ece (in Finnish)
/15/ Union of the Electricity Industry – EURELECTRIC, Report Describing the
Current Environmental Legislation and Policy Situation in the CIP EPC and
EURELECTRIC regions, Brussels, 2003, EURELECTRIC, www.eurelectric.
org
/16/ Wind-Works, Feed laws, Feed-in Tariffs (ref. 5.5.2008) http://www.wind-
works.org/articles/feed_laws.html
/17/ World Energy Council, 2007 Survey of Energy Resources, World Energy
Council, Rome, 2007, ISBN: 0946121265
/18/ Union of the Electricity Industry – EURELECTRIC, The Role of Electricity;
A New Path to Secure, Competitive Energy in a Carbon-Constrained World,
Brussels, 2007, www.eurelectric.org
/19/ Elovaara, J., Laiho, Y., Sähkölatostekniikan perusteet (Fundamentals of
Power Plant Technology), 1988, Helsinki, Valopaino Oy, ISBN: 951-672-
285-7 (in Finnish)
/20/ Weron, R., Modelling and forecasting electricity loads and prices: a
statistical approach, 2006, Chichester, John Wiley &Sons Ltd., ISBN:
13 978-0-470-05753-7
/21/ World Energy Council, Comparison of Energy Systems Using Life Cycle
Assessment, World Energy Council, 2004, London, ISBN: 0 946121 16 8
/22/ Picard, D.J., Stribrny, M., Harrison, M.R:, Handbook for estimating
combustion emissions from the operation and construction of Canadian
natural gas systems, Guelph, 1999, GRI Canada
/23/ Nuclear Fission and Fusion, internet: (ref. 5.5.2008) http://www.lancs.ac.uk/
ug/suttond1/
/24/ Finergy, Hyvä tietää ydinenergiasta (Good to Know about Nuclear power),
Helsinki, 2004, Energia-alan keskusliitto ry Finergy, ISBN: 952-440-009-X
www.finergy.fi (in Finnish)

Assessment of Environmental Impacts of Power Generation
118
/25/ Mini-Hydro power, Internet document (ref. 5.5.2008) http://w3.tm.tue.nl/
fileadmin/tm/TDO/Indonesie/Hydro_Power.pdf
/26/ Wind turbines and the energy in the wind, Internet article, (ref. 5.5.2008)
http://www.ftexploring.com/energy/wind-enrgy.html
/27/ WWEA-World Wind Energy Association, Internet: (ref. 5.5.2008)
http://www.wwindea.org/
/28/ E.On Netz, Wind report 2005, Bayreuth, 2005, www.eon-netz.com
/29/ Cambray, G., Solar Cells Take Stellar Leap, internet article (ref. 5.5.2008)
http://209.85.129.104/search?q=cache:4VNfUxfRQYYJ:www.scienceinafric
a.co.za/2006/april/solar_panel.htm+photo+voltaic+in+household&hl=fi&ct=
clnk&cd=5
/30/ IEA, Distributed Generation in Liberalised Electricity Markets, Paris, 2002,
OECD/IEA, ISBN: 92-64-19802-4
/31/ Solar Systems, Victorian Project, internet: (ref. 5.5.2008)
http://www.solarsystems.com.au/154MWVictorianProject.html
/32/ Union of the Electricity Industry – EURELECTRIC, CO2 Capture and
Storage Brochure, Brussels, EURELECTRIC, www.eurelectric.org
/33/ Hongisto, M. et. al. Sähköntuotantovaihtoehtojen Ulkoiset Ympäristö-
kustannukset Päätöksenteon Apuna (Assessment of applicability of External
costs from Electricity Prodution Alternatives in decicion making), Helsinki,
1998, Finergy, ISBN: 952-440-003-0 (in Finnish)
/34/ Pels, J., de Nie, D., Kiel, J., Utilisation of ashes from biomass combustion
and gasification, Paris, 2005, ECN-RX—05-182
/35/ IAEA, Greenhouse Gas emissions of electricity generation chains, Assessing
the Difference, 2000, IAEA, Bulleting 42/2/2000
/36/ Fossil, internet article: (ref. 5.5.2008) http://www.eas.asu.edu/
~holbert/eee463/FOSSIL.HTML
/37/ Stern, N, The Stern review: Economics of Climate Change, Cambridge,
2006, Cambridge University Press.
/38/ Kemp-Benedict, E., Travelling Along the Environmental Kuznets Curve:
IPAT case Study Number 2, 2003, IPAT-S, http://www.kb-creative.net
/39/ United Kingdom Parliament, Committee on Science and Technology Second
Report: the economics of energy efficiency, London, 2005, House of Lords,
Assessment of Environmental Impacts of Power Generation
119
internet: (ref. 5.5.2008) http://www.publications.parliament.uk/pa/ld200506
/ldselect/ldsctech/21/2106.htm
/40/ Liski, M., Sternin raportti ja sen kritiikki (The Stern Reviw and critisism
toward it), Helsinki, Helsingin kauppakorkeakoulu (in finnish)
/41/ Adapted from a portion of Figure 1 in Tol and Yohe (2006) "A Review of the
Stern Review" ''World Economics'' in internet: (ref. 5.5.2008)
http://en.wikipedia.org/wiki/Stern_review
/42/ Nordhaus, W., The Stern Review on the Economics of Climate Change,
Yale, 2007, internet: (ref. 5.5.2008) http://nordhaus.econ.yale.edu /stern _050
307.pdf
/43/ Öko-Institut, GEMIS-Manual, Darmstadt, 2007, Öko-Institut www.oeko.de/,
www.gemis.de
/44/ ISO-International Organisation for Standardisation, ISO 14043:2000-
Environmental management – Life cycle assessment - Life cycle
interpretation, www.iso.org
/45/ Öko-Institut, GEMIS-presentation. Darmstadt. 2007, Öko-Institut,
www.oeko.de/, www.gemis.de
/46/ Pöyry Energy Oy, Sähköntuotantoskenaariot vuoteen 2030 (Electricity
production scenarios until year 2030), Espoo, 2008, Energiateollisuus, ISBN:
978-952-5615-21-0 (in Finnish)
/47/ Finnish Energy Industies, Energy year 2007, Helsinki, 2008,
Energiateollisuus, www.energia.fi
/48/ Nordel, Annual statstics 2006, 2006, Helsinki, Fingrid Oyj, www.nordel.org
/49/ Oy Vesirakentaja, Voimaa Vedestä 2007: Selvitys vesivoiman
lisäämismahdollisuuksista (Power from Water 2007: Review on increase
possibilities of hydro power), Helsinki, 2008, Energiateollisuus, ISBN: 978-
952-5615-19-7 (in Finnish)
/50/ GreenStream Network, Selvitys uusiutuvan energian lisäämisen
kustannuksista ja edistämiskeinoista (Review on costs and means of
fruthering the incresement of renewagle energy), 2007, Energiateollisuus
www.energia.fi (in Finnish)
Assessment of Environmental Impacts of Power Generation
120
ANNEX I EU legal acts
General overview
• Directive 92/43/EEC on the conservation of natural habitats and of wild fauna and flora
• Regulation No 1980/2000 on a revised Community eco-label award scheme • Directive 2001/77/EC on the promotion of electricity produced from renewable
energy sources in the internal electricity market • Regulation No 761/2001 allowing voluntary participation by organisations in a • Community eco-management and audit scheme (EMAS) • Directive 2002/49/EC relating to the assessment and management of environmental
noise
Environmental permitting and integrated environmental protection
• Directive 85/337/EEC on the assessment of the effects of certain public and private projects on the environment (as amended by Directive 97/11/EC)
• Directive 96/61/EC on integrated pollution prevention and control • Directive 96/82/EC on the control of major-accident hazards involving dangerous
substances • Directive 2000/76/EC on the incineration of waste • Commission Decision 2000/479EC on the implementation of a European Pollutant • Emission Register (EPER) according to Article 15 of Council Directive 96/61/EC
concerning integrated pollution prevention and control (IPPC) • Directive 2001/42/EC on the assessment of the effects of certain plans and
programmes on the environment
Air protection
• Directive 96/62/EC on ambient air quality assessment and management • Directive 1999/13/EC on the limitation of emissions of volatile organic compounds
due to the use of organic solvents in certain activities and installations • Directive 1999/30/EC relating to limit values for sulphur dioxide, nitrogen dioxide
and oxides of nitrogen, particulate matter and lead in ambient air • Directive 1999/32/EC relating to a reduction in the sulphur content of certain liquid
fuels • Directive 2000/69/EC relating to limit values for benzene and carbon monoxide in
ambient air • Directive 2001/80/EC on the limitation of emission of certain pollutants into the air
from large combustion plants • Directive 2001/81/EC on national emission ceilings for certain atmospheric
pollutants • Directive 2002/3/EC relating to ozone in ambient air

Assessment of Environmental Impacts of Power Generation
121
Water protection
• 2000/60/EC establishing a framework for Community Action in the field of water policy
• Decision 2455/2001/EC establishing the list of priority substances in the field of water policy
Waste management legislation
• Directive 75/439/EEC on the disposal of waste oil • Directive 75/442/EEC on waste (later amended by Directive 91/156/EEC) • Directive 91/689/EEC on hazardous waste • Council Regulation 259/93/EC on supervision and control of shipments of waste
within, into and out of the European Community • Directive 96/59/EC on the disposal of polychlorinated biphenyls and
polychlorinated terphenyls (PCBs/PCTs) • Directive 99/31/EC on the landfill of waste • Commission Decision 2000/532/EC establishing a list of wastes (as amended by
Commission decision 2001/118/EC) • Council Decision 2003/33/EC establishing criteria and procedures for the
acceptance of waste at landfills
Other formal EU documents
• Green Paper COM(2001)68 on integrated product policy • Communication COM(2001)580 on the implementation of the first phase of the
European Climate Change Programme • Decision No 1600/2002/EC laying down the Sixth Community Environment
Action Programme. • COM(2002)304 Amended proposal for a Directive concerning rules for the internal
markets in electricity and natural gas • Communication COM(2002)412 on Environmental Agreements at Community
Level • Within the Framework of the Action Plan on the Simplification and Improvement
of the Regulatory Environment • COM(2002)415 Proposal for a Directive on the promotion of cogeneration based
on a useful heat demand in the internal energy market

Assessment of Environmental Impacts of Power Generation
122
ANNEX II EMAS ISO/EN ISO 14001 Status Under legal bases (EU Member
States and EEA countries). Regulation of the European Parliament and the Council under public law
Under no legal bases. (International: world wide) ISO standard under private law
Organisation Entity to be registered shall not exceed the boundaries of the Member State, and it is intended to go towards entities and sites
Does not go towards entities or sites
Environmental policy Included commitment to continual improvement of environmental performance of the organisation
Does not include a commitment to the continual improvement of environmental performance but of the performance of the system
Initial environmental review Obligatory preliminary review, when is the first time that the organisation sets its environmental status
Initial review is recommended, but not required
Environmental aspects Identification and evaluation of the environmental aspects (direct and indirect). Establishment of criteria for assessing the significance of the environmental aspects
Required only a procedure able to identify environmental aspects
Legal compliance Obligatory to demonstrate it. Required full legal compliance. _ere is a compliance-audit
Only commitment to comply with applicable legal requirements. _ere is no compliance-audit
External communication Open dialogue with the public. Public Environmental Statement (validated for verifiers)
Not open dialogue with the public. Only is required to respond to relevant communication from external interested parts. Control by public is not possible
Continual improvement Required annual improvement Required periodically improvement without a defined frequency
Management review Is wider and requires an evaluation of the environmental performance of the organization, based in a performance-audit
Required an environmental performance in the management, but not through a performance audit
Contractors and suppliers Required influence over contractors and suppliers
Relevant procedures are communicated to contractors and suppliers
Employees involvement Active involvement of employees and their representatives
No
Internal environmental auditing Includes: system-audit, a performance-audit (= evaluation of environmental performance) and an environmental compliance-audit (= determination of legal compliance)
Included only system audit against the requirements of the standard
Auditor Required the independence of the auditor
Advised the independence of the auditor
Audits Check for improvement of environmental performance. Frequency required: 3 year cycle during which all areas are verified at least once
Check environmental system performance. No frequency required
External verification Accredited environmental verifiers No Verification/Certification Scope Verifiers accredited according to
NACE codes Certifiers accredited according to EAC code
Authorities are informed Obligation by Validation of Environmental Statement
No obligation
Logo Yes No


![ON THE STRENGTH OF RAMSEY’S THEOREM FOR PAIRScholak/papers/ramsey.pdf · Ramsey’s theorem was discovered by Ramsey [1930] and used by him to solve a decision problem in logic.](https://static.fdocuments.in/doc/165x107/5f90a061b1fcca4bc6367dad/on-the-strength-of-ramseyas-theorem-for-pairs-cholakpapers-ramseyas-theorem.jpg)