Massively Parallel Graph Analytics - Supercomputing for ...slotag/pres/pres_BW15.pdf · Performance...
22
Massively Parallel Graph Analytics Supercomputing for large-scale graph analytics George M. Slota 1,2,3 Kamesh Madduri 1 Sivasankaran Rajamanickam 2 1 Penn State University, 2 Sandia National Laboratories, 3 Blue Waters Fellow [email protected], [email protected], [email protected] Blue Waters Symposium 12 May 2015
Transcript of Massively Parallel Graph Analytics - Supercomputing for ...slotag/pres/pres_BW15.pdf · Performance...

Massively Parallel Graph AnalyticsSupercomputing for large-scale graph analytics
George M. Slota1,2,3 Kamesh Madduri1
Sivasankaran Rajamanickam2
1Penn State University, 2Sandia National Laboratories, 3Blue Waters [email protected], [email protected], [email protected]
Blue Waters Symposium 12 May 2015

Graphs are...
Everywhere
InternetSocial networks, communicationBiology, chemistryScientific modeling, meshes,interactions
Figure sources: Franzosa et al. 2012, http://www.unc.edu/ unclng/Internet History.htm

Graphs are...
Everywhere
InternetSocial networks, communicationBiology, chemistryScientific modeling, meshes,interactions
Figure sources: Franzosa et al. 2012, http://www.unc.edu/ unclng/Internet History.htm

Graphs are...
Big
Internet - 50B+ pages indexed by Google, trillions ofhyperlinksFacebook - 800M users, 100B friendshipsHuman brain - 100B neurons, 1,000T synapticconnections
Figure sources: Facebook, Science Photo Library - PASIEKA via Getty Images

Graphs are...
BigInternet - 50B+ pages indexed by Google, trillions ofhyperlinksFacebook - 800M users, 100B friendshipsHuman brain - 100B neurons, 1,000T synapticconnections
Figure sources: Facebook, Science Photo Library - PASIEKA via Getty Images

Graphs are...
Complex
Graph analytics is listed as one of DARPA’s 23 toughestmathematical challengesExtremely variable - O(2n
2) possible simple graph
structures for n verticesReal-world graph characteristics makes computationalanalytics tough
Skewed degree distributionsSmall-world natureDynamic

Graphs are...
Complex
Graph analytics is listed as one of DARPA’s 23 toughestmathematical challengesExtremely variable - O(2n
2) possible simple graph
structures for n verticesReal-world graph characteristics makes computationalanalytics tough
Skewed degree distributionsSmall-world natureDynamic

Graphs are...
Complex
Graph analytics is listed as one of DARPA’s 23 toughestmathematical challengesExtremely variable - O(2n
2) possible simple graph
structures for n verticesReal-world graph characteristics makes computationalanalytics tough
Skewed degree distributionsSmall-world natureDynamic

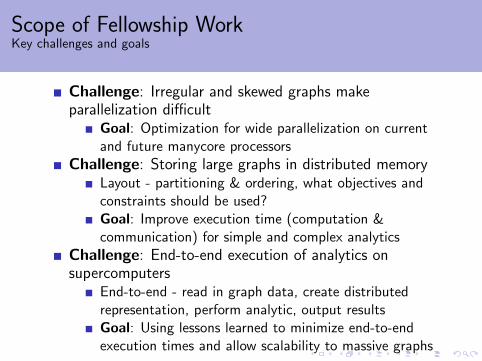
Scope of Fellowship WorkKey challenges and goals
Challenge: Irregular and skewed graphs makeparallelization difficult
Goal: Optimization for wide parallelization on currentand future manycore processors
Challenge: Storing large graphs in distributed memory
Layout - partitioning & ordering, what objectives andconstraints should be used?Goal: Improve execution time (computation &communication) for simple and complex analytics
Challenge: End-to-end execution of analytics onsupercomputers
End-to-end - read in graph data, create distributedrepresentation, perform analytic, output resultsGoal: Using lessons learned to minimize end-to-endexecution times and allow scalability to massive graphs

Scope of Fellowship WorkKey challenges and goals
Challenge: Irregular and skewed graphs makeparallelization difficult
Goal: Optimization for wide parallelization on currentand future manycore processors
Challenge: Storing large graphs in distributed memoryLayout - partitioning & ordering, what objectives andconstraints should be used?Goal: Improve execution time (computation &communication) for simple and complex analytics
Challenge: End-to-end execution of analytics onsupercomputers
End-to-end - read in graph data, create distributedrepresentation, perform analytic, output resultsGoal: Using lessons learned to minimize end-to-endexecution times and allow scalability to massive graphs

Optimizing for Wide ParallelismGPUs on Blue Waters and Xeon Phis on other systems
Observation: most graph algorithms follow a tri-nestedloop structure
Optimize for this general algorithmic structureTransform structure for more parallelism
1: Initialize temp/result arrays At[1..n], 1 ≤ t ≤ l. . l = O(1)2: Initialize S1[1..n].3: for i = 1 to niter do . niter = O(logn)4: Initialize Si+1[1..n]. .
∑i |Si| = O(m)
5: for j = 1 to |Si| do . |Si| = O(n)6: u← Si[j]7: Read/update At[u], 1 ≤ t ≤ l.8: for k = 1 to |E[u]| do . |E[u]| = O(n)9: v ← E[u][k]
10: Read/update At[v].11: Read/update Si+1.
12: Read/update At[u].

Optimizing for Wide ParallelizationApproaches for improving intra-node parallelism
Hierachical expansionDepending on degree of a vertex, parallelism handledper-thread, per-warp, or per-multiprocessor
Local Manhattan CollapseInner two loops (across vertices and adjacent edges inqueue) collapsed into multiple single loopper-multiprocessor
Global Manhattan CollapseInner two loops collapsed globally among all warps andmultiprocessors
General optimizationsOptimizations applicable to all parallel approaches -cache consideration, coalescing memory access, explicitshared memory usage, warp and MP-based primitives

Optimizing for Wide ParallelizationPerformance results - K20 GPUs on Blue Waters
H: Hierarchical, ML: Local collapse, MG: Global collapse,gray bar: Baseline
M: local collapse, C: coalescing memory access, S: sharedmemory use, L: local team-based primitives
Up to 3.25× performance improvement relative tooptimized CPU code!
●
●
●
●
●
●●
●
●●●
●
0
1
2
3
DB
pedia
XyceTest
Flic
kr
Liv
eJourn
al
uk−
2002
Wik
iLin
ks
uk−
2005
IndoC
hin
a
RM
AT
2M
GN
P2M
HV
15R
Graph
GT
EP
S
Algorithm ● H MG ML
●
●●
●
●
●
●●
●
●
0
1
2
3
DB
pedia
XyceTest
Flic
kr
Liv
eJourn
al
uk−
2002
Wik
iLin
ks
uk−
2005
IndoC
hin
a
HV
15R
Graph
GT
EP
S
Optimizations ● M(+C+S+)L M(+C+S) M(+C) Baseline+M

Distributed-memory layout for graphsPartitioning and ordering
Partitioning - how to distribute vertices and edges amongMPI tasks
Objectives - minimize both edges between tasks (cut)and maximal number of edges coming out of any giventask (max cut)Constraints - balance vertices per part and edges per partWant balanced partitions with low cut to minimizecommunication, computation, and idle time amongparts!
Ordering - how to order intra-part vertices and edges inmemory
Ordering affects execution time by optimizing formemory access locality and cache utilization
Both are very difficult with small-world graphs

Distributed-memory layout for graphsPartitioning and ordering part 2
PartitioningUsed PuLP partitioner for generating multi-constraintmulti-objective partitionsOnly partitioner available that’s both scalable to graphstested on and able to satisfy objectives/constraints
OrderingUsed traditional bandwidth reduction methods fromnumerical analysisAlso used more graph-centric methods based aroundbreadth-first search

Distributed-memory layout for graphsPerformance results
Speedups for subgraph counting algorithm forcommunication and computation
Effective partitioning can make considerable impact,ordering still important as graphs get large
Twitter uk−2005 sk−2005
0.0
0.5
1.0
1.5
0
2
4
0
2
4
6
Baseline
DG
L−M
C
DG
L−M
OM
C
Baseline
DG
L−M
C
DG
L−M
OM
C
Baseline
DG
L−M
C
DG
L−M
OM
C
Partitioner
Spe
edup
vs.
Bas
elin
e Twitter uk−2005 sk−2005
0.0
0.3
0.6
0.9
0.0
0.5
1.0
0.0
0.5
1.0
Baseline
RC
M
DG
L
Baseline
RC
M
DG
L
Baseline
RC
M
DG
L
Ordering
Spe
edup
vs.
Bas
elin
e

Large-scale graph analytics
Previous work for large graph analysis
External-memory systems - MapReduce/Hadoop-like,flash memoryTend to be slow and energy intensive
Using optimizations and techniques from fellowship workefforts
Implemented analytic suite for large-scale analytics(connectivity, k-core, community detection, PageRank,centrality measures)Ran on largest currently available public web crawl (3.5Bvertices, 129B edges)First known work that has successfully analyzed graph ofthat scale on a distributed memory system

Large-scale graph analytics
Ran algorithm suite on only 256 nodes of Blue Waters,execution time in minutes
Novel insights gathered from analysis - largestcommunities discovered, communities appear to havescale-free or heavy-tailed distribution
Largest Communities Discovered (numbers in millions)
Pages Internal Links External Links Rep. Page
112 2126 32 YouTube18 548 277 Tumblr
9 516 84 Creative Commons8 186 85 WordPress7 57 83 Amazon6 41 21 Flickr

Summary of accomplishments
Optimizations for manycore parallelism result in up to a3.25× performance improvement for graph analyticsexecuting on GPU
Modifications to in-memory storage of graph structureresults in up to a 1.48× performance improvement fordistributed analytics running with MPI+OpenMP on BlueWaters
First-ever analysis of largest to-date web crawl (129Bhyperlinks) on a distributed memory system
Running on 256 nodes of Blue Waters, we are able to runseveral complex graph analytics on the web crawl inminutes of execution time
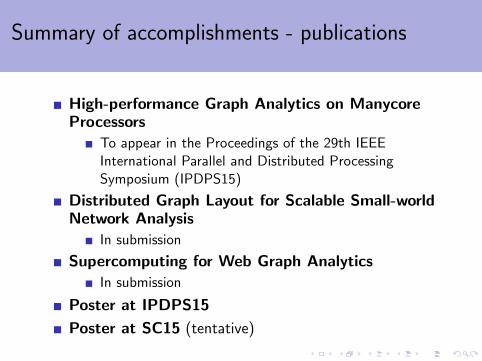
Summary of accomplishments - publications
High-performance Graph Analytics on ManycoreProcessors
To appear in the Proceedings of the 29th IEEEInternational Parallel and Distributed ProcessingSymposium (IPDPS15)
Distributed Graph Layout for Scalable Small-worldNetwork Analysis
In submission
Supercomputing for Web Graph Analytics
In submission
Poster at IPDPS15
Poster at SC15 (tentative)

Conclusions and Going Forward
Real-world graphs = big, complex, difficult to effectivelyrun on in parallel
Demonstrated methodology for thread-node-system leveloptimization for small-world skewed graphs
Hopefully this work will enable:
Implementation of more complex analytics for largenetworksScaling to larger networks and on larger future systemsGreater insight into larger networks than currentlypossible
Thanks to Blue Waters and NCSA!This research is part of the Blue Waters sustained-petascale computing project, which is supported by the National Science Foundation(awards OCI-0725070, ACI-1238993, and ACI-1444747) and the state of Illinois. Blue Waters is a joint effort of the University of Illinois atUrbana-Champaign and its National Center for Supercomputing Applications. This work is also supported by NSF grants ACI-1253881,CCF-1439057, and the DOE Office of Science through the FASTMath SciDAC Institute. Sandia National Laboratories is a multi-programlaboratory managed and operated by Sandia Corporation, a wholly owned subsidiary of Lockheed Martin Corporation, for the U.S.Department of Energy’s National Nuclear Security Administration under contract DE-AC04-94AL85000.