Massachusetts Leads the Way: Pay for Performance to Reduce ... · Patient-satisfaction surveys are...
26
Massachusetts Leads the Way: Pay for Performance to Reduce Racial/Ethnic Disparities VA Equity Conference Boston, MA September 13, 2010 Joel S. Weissman, Ph.D. Co-Authors: Jan Blustein, MD, Phd Andrew M. Ryan , Phd Tim Doran, MD Romana Hasnain-Wynia, PhD
Transcript of Massachusetts Leads the Way: Pay for Performance to Reduce ... · Patient-satisfaction surveys are...

Massachusetts Leads the Way: Pay for Performance to Reduce Racial/Ethnic
Disparities
VA Equity ConferenceBoston, MA
September 13, 2010
Joel S. Weissman, Ph.D.
Co-Authors:
Jan Blustein, MD, Phd
Andrew M. Ryan , Phd
Tim Doran, MD
Romana Hasnain-Wynia, PhD

Introduction
Disparities in health and health care continue to exist
“Pay for Performance” (P4P) has become increasingly common among both private and public payers
Until now, P4P has not been utilized to reduce disparities in performance between racial-ethnic groups

Pay-for-Performance and Disparities
Pay-for-Performance (of P4P) is the practice of rewarding providers to meet quality goals and to improve outcomes of care, rather than paying for the volume of services they provide.
Questions have been raised about potential impact of P4P on racial-ethnic disparities

Research Questions
Why and how was the MassHealthP4P/disparities program developed?
How has the program been implemented?
What are lessons learned?

Methods
Review public documents
Interview staff at Massachusetts’ Executive Office of Health and Human Services (Office of Medicaid), which was responsible for the P4P/disparities program.
Analyze hospital performance data
Speak to members of the hospital community about their experiences with the program.

Chapter 58-The Massachusetts Universal Health Care Law Also Mandated Hospital P4P
• Institute of Medicine’s Unequal Treatment in 2003
• Boston Task Force to Eliminate Racial and Ethnic Disparities (2004-5)
• State Commission to End Racial and Ethnic Disparities – Report (2007)
• Section 25 of Chapter 58 (2006)
• MassHealth hospital rate increases contingent on quality standards, including the reduction of racial and ethnic disparities.
MassHealth Hospital Pay for Performance, MassHealth Symposium, 2007

P4P Measures
1) Clinical Measures - Reward Hospitals to report data by Race/Ethnicity & to reduce differences in clinical processes
2) Structural Measures - Reward Hospitals to improve organizational factors that may reduce racial/ethnic health disparities.

Clinical P4P Measures
1) Maternity/Newborn indicators
2) Pediatric Asthma indicators
3) Pneumonia indicators
4) Surgical Infxn Prevention indicators
Criteria for Selection:
Office of Medicaid
Relevant (high impact on population)
Actionable (scientifically sound; within provider control)
Feasible (existing technical specs, minimized collection
burden, sufficient volume)
NQF -- evidence of a quality gap

Structural Measures:Implementing CLAS – The CCOSA*
(Selected Domains and Items)
HOSPITAL GOVERNANCE POLICY
Board adopted mission statement articulating cultural diversity as core value.
Board and senior management reflect the racial and ethnic mix of the actual population mix being served.
ADMINISTRATION & MANAGEMENT POLICY
Hospital provides diversity training for all clinical and nonclinical staff.
Hospital patient data is analyzed by race, ethnicity, and languages spoken.
SERVICE DELIVERY POLICY
Policies exist to include R/E communities in planning/design of services.
Hospital interpreter skill requirements are based on nationally recognized professional medical interpreter association standards.
CUSTOMER RELATIONS POLICY
Patient-satisfaction surveys are translated for non-English-speaking patients.
Interagency collaborative projects exist in racial/ethnic neighborhood communities in your service area.
* Cultural Competence Organizational Self-Assessment (CCOSA)

Financial Incentives
Rate Year [RY] 2008
– $4.5M was allocated for payments for performance on the structural measures;
By RY 2010, this was set to increase to $20M for performance on the structural measures and $12M for disparities on the clinical measures.
– >$300,000 per hospital for the structural measures, >$180,000 per hospital for the clinical measures.
– Compare with Premier Hospital Quality Incentive Demonstration = ~$33,000 per hospital per year from 2003 through 2006

FINDINGS

Care of minorities is relatively concentrated compared with whites
1.4%
11.6%
66.8%
7.9%
29.4%
79.4%
02
04
06
08
01
00
Cum
ula
tive d
istr
ibu
tion
(%
)
0 20 40 60Hospitals in Massachusetts
Minority patients White patients
4 most voluminous hospitals

Hospital-level Absolute Risk Differences (ARDs): White minus Black, RY 2009
-100
-50
05
01
00
Diffe
ren
ce W
hite-B
lack
No difference White sig higher
Black sig higher 95% CI
Mean White-black 95% CI Mean White-Black

Hospital-level Absolute Risk Differences (ARDs): White minus Latino, RY 2009
-100
-50
05
01
00
Diff
ere
nce
Wh
ite-H
isp
an
ic
No difference White sig higher
Hispanic sig higher 95% CI
Mean White-Hispanic 95% CI Mean White-Hispanic

Hospital-level Between Group Variance (BGV) Values
0
.05
.1.1
5.2
.25
BG
V
BGV: no difference BGV: sig lower
BGV: sig higher BGV 95% CI
Mean BGV Mean BGV 95% CI

RY08 CLAS Measure Rate Results
74%79%
73%
79%82%
86%
70%
76%
76%
81%
0%
20%
40%
60%
80%
100%
Ho
sp
ita
l M
ea
su
re R
ate
HD1-
Governance
Practices
HD1-Admin/Mgt
Practices
HD1-Service
Practices
HD1-Cust Reltn
Practices
HD-1 Total
Measure Rate
Hospital Practices Implemented by Organizational Core Function
RY07 Ave RY08 Ave
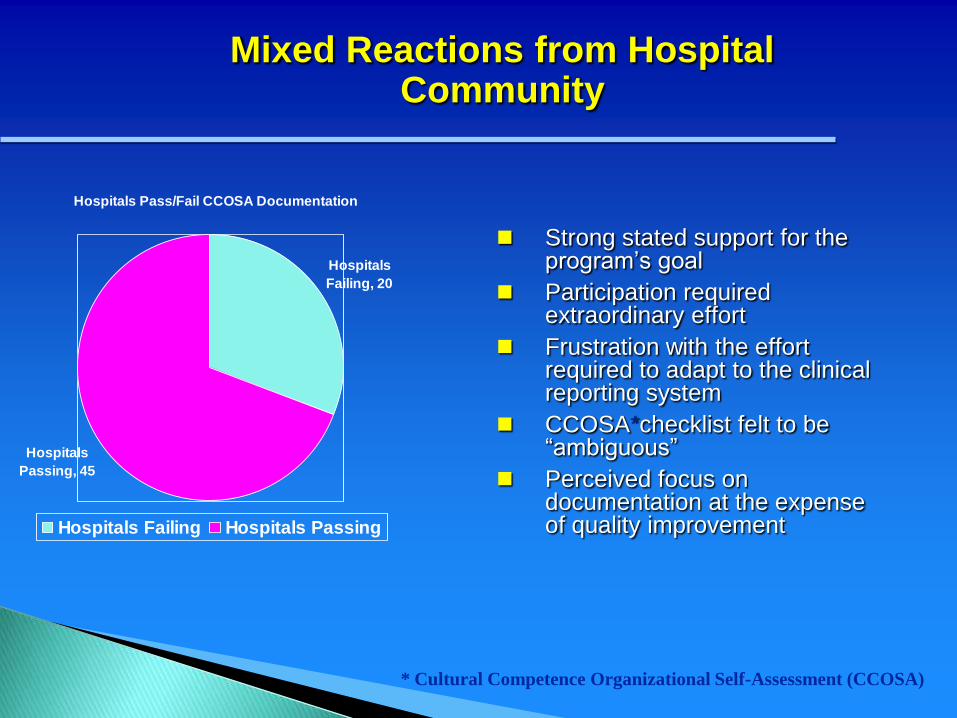
Mixed Reactions from Hospital Community
Hospitals Pass/Fail CCOSA Documentation
Hospitals
Failing, 20
Hospitals
Passing, 45
Hospitals Failing Hospitals Passing
Strong stated support for the program’s goal
Participation required extraordinary effort
Frustration with the effort required to adapt to the clinical reporting system
CCOSA*checklist felt to be “ambiguous”
Perceived focus on documentation at the expense of quality improvement
* Cultural Competence Organizational Self-Assessment (CCOSA)

Lessons
Context Matters
Sample size problems should be addressed up front
Disparities indicators may need to be re-considered after examining the data
Complex questions elicit nuanced answers
The “between” problem should be examined along with the “within” problem.
Acknowledgements
We thank Terri Yannetti, Phyllis Peters, and Iris Garcia-Caban, PhD, the entire staff of the Massachusetts Office of Medicaid, and Anuj Goel from the Massachusetts Hospital Association (MHA), for their help and guidance.
The views expressed in this presentation are those of the authors and no official endorsement by the Executive Office of Health and Human Services, the Office of Medicaid, or the MHA is intended or should be inferred.

“In order to eliminate disparities in health, we need leaders who care enough, know
enough, will do enough and are persistent enough.”
- David Satcher, M.D., Ph.D.
- Former Surgeon General of the U.S.

End of Presentation

Extra Unused Slides Follow

{I probably will not keep this slide}Health Disparities Measurement & Incentive Strategy
Strategy RFA08 (Yr.1)
HD-1 Structural MeasureRFA09 (Yr. 2)
HD-2 Clinical Measures
OverallApproach
Reward Hospitals to improve organizational factors that reduce racial/ethnic health disparities.
Reward Hospitals to report data by Race/Ethnicity & reduce disparities in clinical quality measures
Performance Measure Require Hospitals to implement CLAS standards regardless of patient R/E/L mix served.
Clinical Quality Measures: Maternity/Newborn indicators Pediatric Asthma indicators Pneumonia indicators Surgical Infxn Prevention indicators
Performance Assessment Method
CLAS Validation Rate CLAS Best Practice Rating CLAS Measure Score
Data Validation Rate (RY09)
Clinical Disparity Measure Score (RY2010)
Bonus Payment Approach
Earn payments for meeting performance thresholds on organizational factors (implementing CLAS).
Earn payments for meeting performance thresholds on clinical disparities measures

MATERNITY &NEWBORN
PEDIATRICASTHMA
SURGICAL INFECTION
PREVENTION
COMMUNITY ACQUIRED
PNEUMONIA
HEALTH DISPARITIES
MAT-1:Intrapartum Antibiotic prophylaxis for Group B Streptococcus
CAC-1:Children’s Asthma Care -Inpatient use of relievers
SCIP-1a:Prophylactic Antibiotic w/in 1hr prior to surgical incision
PN-1: Oxygenation Assessment(RETIRED)
HD-1: (RY09+RY10) Cultural & Linguistic Appropriate Service(CLAS) Standards
MAT-2:Perioperative Antibiotics for Cesarean section
CAC-2: Children’s Asthma Care -Inpatient use of Corticosteroids
SCIP-2a:Appropriate Antibiotic selection for surgical prophylaxis
PN-3b:Blood culture performed in ED prior to first antibiotic rec’d in
hospital
HD-2: (P4R in RY09)Clinical HealthDisparities
NICU-1:Neonatal Intensive Care -Administration of Antenatal steroids
CAC-3: Children’s Asthma Care -Home Mgt. Plan of Care (NEW in RY10)
SCIP-3a:Prophylactic Antibiotic discont. w/in 24 hrs after surgery end time
PN-4: Adult smoking cessation advice & counseling
HD-2: (P4P in RY10)Clinical Health Disparities (PHASE-
IN)
PN-5c:Initial Antibiotic
received within 6 hrs of arrival
PN-6: Appropriate Antibiotic selection for immuno-competent patients
MassHealth Acute Hospital Clinical Quality Measures Set*
MassHealth Presentation to Health Care Quality and Cost Council, Expert Panel on Performance Measurement, January 8, 2010 Meeting

Care of Minorities is Concentrated
Jan/Andy – Any chance we could make a graph out of this, e.g., a cumulative
distribution graph? y access = % of care; x access = number of hospitals
From text:
…2/3 of the opportunities from African-American patients emanated from 10
hospitals; 89% came from 20 hospitals; and 96% came from 30 hospitals.
Similarly, for Latino patients, 2/3 of the opportunities emanated from just 10
hospitals; 88% came from 20 hospitals, and 95% came from 30 hospitals. In
contrast, for white patients 40% of opportunities came from 10 hospitals, 63%
came from 20 hospitals, and 79% came from 30 hospitals. Eight of the state’s
hospitals reported zero opportunities for non-white patients.

Care of minorities relatively concentrated
Blacks– 66% of opportunities from 10 hospitals
– 89% of opportunities from 20 hospitals
Hispanics– 66% from 10 hospitals;
– 88% from 20 hospitals
Whites– 40% from 10 hospitals,
– 63% from 20 hospitals