Superconducting electron gun for CW operation of superconducting linacs

Y. Iwasa (05/08/03) 1
MASSACHUSETTS INSTITUTE OF TECHNOLOGYDEPARTMENT OF MECHANICAL ENGINEERING
DEPARTMENT OF NUCLEAR ENGINEERING2.64J/22.68J Spring Term 2003
May 8, 2003Lecture 10: Protection & HTS Magnets
Key magnet issues vs. Top; Areas of failure in superconducting magnetsØ Key problems: overheating; high voltage; overstressing; over pressureØ Protection against overheating: self-protecting magnets; normal zone propagation; active protection; detection of quenchØ High voltage — driven mode & persistent mode; overstressingØ Over pressure—bath cooled & CICCØ HTS Magnets & IssuesØ Bi-2223/Ag DataØ YBCO compositeØ Jc ( B )data @ 4.2, 10, and 20 K of superconductorsØ 1-D NZP of YBCO: Energy margin & NZP velocity (FSU/NHMFL)Ø Stability experiment & simulation of YBCO at 77 K (MIT)Ø 1-D NZP of YBCO: Energy margin & NZP velocity (ORNL)

Y. Iwasa (05/08/03) 2
Key Magnet Issues vs Top
ProtectionConductor
Mechanical
StabilityCryogenics
0 ~100Top [K]
Cost or Difficulty
LTS HTS

Y. Iwasa (05/08/03) 3
Areas of Failure in Superconducting Magnets
In the order of decreasing reported incidents.
Ø Insulation
Ø Mechanical
Ø System performance
Ø Conductor
Ø External system
Ø Coolant

Y. Iwasa (05/08/03) 4
Key Quench-Induced Problems
Ø Overheating
Ø High voltage
Ø Overstressing
Ø Over pressure

Y. Iwasa (05/08/03) 5
Overheating
Ø For a uniform energy conversion over the entire winding, aquench-induced Tmax will remains <100 K, an upper limit tokeep the differential thermal expansion stresses negligible.
Bo2
2 o
hcu (Tm t) - hcu (Top ) = 5.2 109 J/m3
Bo 115 T
1356 K 4.2 K
Energy Conversion

Y. Iwasa (05/08/03) 6
Protection Against Overheating
Ø Normal zone propagation speed, Unzp , fast enough to spread normal zone over most of the winding volume from a localized “hot spot” initially created. Specifically, a self- protecting magnet must satisfy:
1. Self-Protecting MagnetsBo
2a1
2a2
decay ~
a2 a1
Unzp
Ø “Large” magnets are not self-protecting.
Ø [Unzp]HTS << [Unzp]LTS : HTS magnets not self-protecting.
Y. Iwasa (05/08/03) 7
An Example
Ø Bo=8 T
Ø Emg=106 J
Ø Winding volume=0.06 m3 (~2 ft3 )
Bo
0.6 m
0.4 m
0.2 m
Unacceptable5801
Barely acceptable13010
< 100 K7050
Well below 100 K55100
RemarksTf [K]Winding %
Absorbing Emg

Y. Iwasa (05/08/03) 8
Normal Zone Propagation Velocity
Along Wire Axis--No Matrix
Normal Superconducting z
Cn
Tn
t zkn
Tn
z nJ 2 (normal state)
Cs
Ts
t zks
Ts
z (Superconducting state)
T
t
T
z
z
tUl
T
z (Ul: longitudinal velocity)

Y. Iwasa (05/08/03) 9
CnUldTn
d z
d
d zkn
dTn
d znJ 2
CsUldTs
d zd
d zks
dTs
d z
Assume kn , ks , and d 2Tn / d z2 0 near z 0
CnUld Tn
d t nJ 2 0 (z 0 )
ks
d 2Ts
d z2CsU l
dTs
d t0 (z 0)
Ts (z) = Ae cz Top CC sUl
ks

Y. Iwasa (05/08/03) 10
At z 0 Ts (0) = Tc
Ts (z) = (Tc Top )e (Cs Ul / ks )z Top
At z 0 kn (dTn /dz) = ks (dTs /dz)
kn nJ 2
CnUl
CsUl (Tc Top )
Ul J nkn
CnCs (Tc Top )

Y. Iwasa (05/08/03) 11
Cs Cn C0
Ul
J
C0
n kn
(Tc Top )
Ø Ul JØ Ul 1/C0 [Ul ]hts << [Ul]lts
In the presence of normal metal matrix:
UlJm
Ccdm km
(Tcs Top )
Note that Tcs Tt

Y. Iwasa (05/08/03) 12
With Cn( T ), Cs( T ), kn( T ):
Note that Tcs Tt
Ul J n(Tcs )kn (Tcs )
Cn(Tcs ) -1
kn (Tcs )d kn (T )
d TTcs
Cs (T )d TTop
Tcs Cs (T )d TTop
Tcs

Y. Iwasa (05/08/03) 13
1-D “Adiabatic” NZP—Experimental & Simulation Results
~10 cm
Slides 13-15: from R.H. Bellis and Y. Iwasa (Cryogenics, Vol. 34 1994)

Y. Iwasa (05/08/03) 14
Nb3Sn Tape @ 12 K & 225 A
Ul =50 cm/s
Experimental
SimulationTemperature Simulation
Tcs=13.7 K
Tc=16.5 K25 ms
150 ms
V1
V2
V3
V4
V1 V2 V3
V4
100 ms

Y. Iwasa (05/08/03) 15
Bi-2223/Ag Tape @ 14 K & 100 A Experimental
SimulationTemperature Simulation
10 s
60 s
[Ul ]hts =1 cm/s << [Ul ]lts
Tcs=44.4 K
Tc=93 K

Y. Iwasa (05/08/03) 16
2. Active Protection
Ø Widely used in large magnets.
Ø Dissipates most of the stored magnet energy into a“dump resistor” connected across the magnet terminals.
Ø A “hot spot” heated only over a “brief” period of current decay.
Ø Leads to another criterion for operating current density.
“Detect-and-Dump”
~RD
Lmg
r ( t )
VD

Y. Iwasa (05/08/03) 17
Lmg
dI (t )
d t[r (t ) + RD]I ( t ) = 0
For r( t ) << RD :
Lmg
dI (t )
d tRDI (t ) = 0 I (t ) = I op exp
RDt
Lmg
Jm (t ) = [Jop ]m expRD t
Lmg
With gk gd gq 0 :
AcdC cd (T )dT
d tm (T )
Am
I 2( t ) Cc d(T )dT
d tm (T )
Am
Acd
Jm2 (t )
Ccd (T )
m (T )dT
Am
Acd
[Jop ]m2 exp
2RDt
Lmg
dt
C cd (T )
m (T )T i
T f dT Z (Ti , Tf )Am
Acd
[Jop ]m2 exp
2Rd t
Lm g
dt0
Am
Acd
[Jop ]m2 Lmg
2RD
Z (Ti , Tf )Am
Acd
[Jop ]m2 Lmg
2RD
Am
Ac d
[Jop ]m2 2Em g I op
2
2VD I op
Am
Acd
[Jop ]m2 Em g
VDI op

Y. Iwasa (05/08/03) 18
0 0 00 0 0
Ccd (T ) m (T )
Ccd (T )
m (T )
T T T
Z(Ti , Tf )
Ti Tf
~T~1/T
~constant
Z (Ti , Tf )
Ccd (T )
m (T )Ti
T f
dT

Y. Iwasa (05/08/03) 19
T [K]
Z [1
016 A
2 s/
m4 ]
Z(T ) Functions:
1: Ag (99.99%)
2: Cu (RRR 200)
3: Cu (RRR 100)
4: Cu (RRR 50)
5: Al (99.99%)

Y. Iwasa (05/08/03) 21
[Jop ]m
Ac d
Am
VDIopZ (Ti , Tf )
Emg
[J op ]cd
f p Pcd Amq fm
m ( As + Am )2
“Protection” Criterion
“Cryostable” Criterion

Y. Iwasa (05/08/03) 22
Detect-and Dump : Options to improve [Jop]m
y Larger conductor; more expensive for given kA-my Larger current leads--greater heat inputy Larger ( I B ) forcey For a given power rating VI, higher I more expensive
1. Increase Iop
2. Increase VD
y Increased danger of voltage breakdown, particularly > 800 V in helium environment
3. Increase Z( Tf )
y Better to keep Tf below ~100 K-150 K y Cu better than Al
4. Reduce Emg
y Subdivision—common practice with HEP & Fusion magnets

Y. Iwasa (05/08/03) 23
Detection of Non-Recovering Quench
Vout( t )
V1( t )
V2( t )
ooR1
R2
L1
L2
r( t )
~
I( t )
I( t )
V1( t ) L1
dI( t )
dtr( t )I( t ) V2( t ) L2
dI( t )
dtVout ( t ) =V2( t ) -V1( t )
R2 L1 R1 L2 Vout ( t ) = -R2
R1 R2
r ( t )I(t )

Y. Iwasa (05/08/03) 24
High Voltage
Ø Driven mode magnet, i.e., operated with its power supply generally connected, except during a dump.
• High voltage, i.e., VD , appears across the magnet terminals.
Ø Persistent mode magnet, i.e., operated with its power supply
removed, except when the magnet is being charged. • Terminal voltage is zero; high internal voltage may be induced.

Y. Iwasa (05/08/03) 25
Persistent Mode Operation
~
Lmg
r ( t )
>
>
>
>
Heater
Persistent Switch
Disconnectable joint
Operation Steps
1. With persistent switch (PS) resistive (heater on), energize the magnet.
2. Turn off the heater; PS becomes superconducting; slowly bring the supply current back to zero.
3. Disconnect the current leads from the magnet terminals.
4. Magnet now operates in “persistent mode.”

Y. Iwasa (05/08/03) 26
r ( t ) represents:
1. quench-induced variable resistance; may lead to a high internal voltage OR
2. “small” constant resistance by imperfect splices; causes a “slow” field decay (time constant=Lmg / r ) in NMR & MRI magnets:
Persistent Mode Operation (Continued)
B( t ) B0e
(r / Lmg) tB0 1
r
Lm g
t (for Lm g/ r 1 hr)

Y. Iwasa (05/08/03) 27
Ø No internal voltage in a uniformly (100%) resistive magnet.
Ø Internal voltage in a partially resistive magnet.
Ø Large voltages can occur when a resistive zone confined to a small section.
Internal Voltage In Persistent Mode Magnet
~ 100%r ( t )
100%VL VR
No internal voltage

Y. Iwasa (05/08/03) 28
Internal Voltage in Persistent Mode
~50%
50% 10%
10%
10%
Top 50%
Top 10%Extent of r ( t )
Bottom 50%
Middle 10%
Bottom 10%

Y. Iwasa (05/08/03) 29
Ø For RD >> r ( t ), internal voltage is essentially due to the inductive voltage. The maximum inductive occurs at t =0 and it is equal VD .
Internal Voltage In Driven Mode Magnet
VL VD (RD >> r )
~RD
Lmg
r ( t )
VD
Effect of r ( t ) is neglected.

Y. Iwasa (05/08/03) 30
Ø Overstressing generally occurs in a multi-coil system.
• A quench in one coil increases the current in the rest of the coils—this is good for PROTECTION, because this increased current accelerates spreading of normal zones in the rest of the coils by inducing quenches in these coils.
• This increased current may also cause overstressing in these coils.
Overstressing

Y. Iwasa (05/08/03) 31
Io I1 I2
Io I1
I1
I2
R1
R2
L1
L2
I1
I2
r (t )
~ M
Io
Io
A quench in Coil 1 induces an extra current in Coil 2.
I1 I2
Overstress limit
I ( t )
t
Overstressing (& Protection)
Example: 2-Coil System
1. Helps spreading out normal zonefaster and over a large volume.
2. May overstress Coil 2

Y. Iwasa (05/08/03) 32
+–
Within Cryostat
Protection Circuit for an NMR Magnet
Y. Iwasa (05/08/03) 33
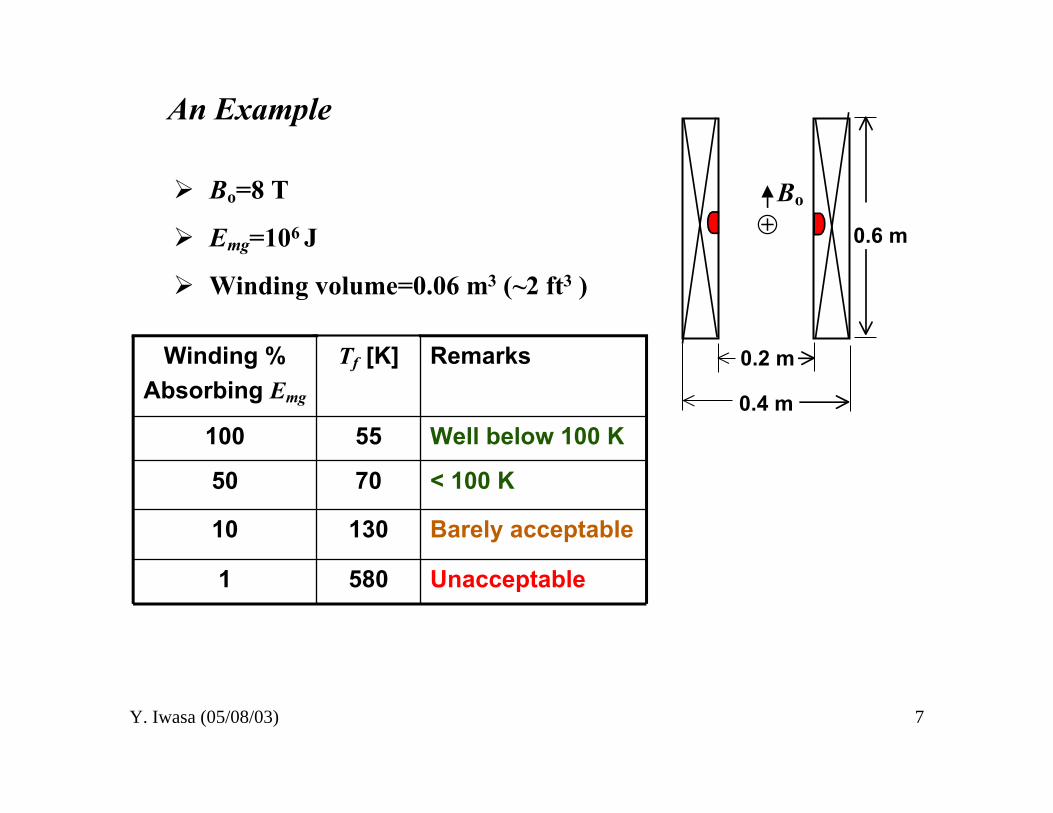
Over Pressure
Ø In every superconducting magnet system, driven, persistent, in which coolant is cryogen (helium, nitrogen), a quench generally causes generation of vapor within the cryostat, raising the cryostat pressure above a safe limit (no greater than ~ 1/3 atm).
• Cryostat must be equipped with a relief valve or a “burst” disk to permits a rapid release of the vapor from the cryostat.
Ø For CICC there is another problem of having to estimate the internal pressure generated in CICC.
• Conduit thickness and vent line diameter must be sized according to the maximum quench-induced internal pressure.

Y. Iwasa (05/08/03) 34
150YBCO
BSCCO 2223
Nb3Sn
MgB2
BSCCO 2212
NbTi
0 20 40 60 80 1000
50
100
T [K]
˚Hc2 [ T ]
HTS Magnets & Issues
HTS: YBCO; BSCCO; MgB2
LTS: Nb-Ti; Nb3Sn
Magnet Grade Conductors:NbTi; Nb3Sn; BSCCO 2223

Y. Iwasa (05/08/03) 35
BSCCO 2223 currently available as “magnet gradeconductor.”
Powder in Ag tube
Ø BSCCO 2212 being developed but not easily available.
Ø YBCO, compared with BSCCO, regarded more promising for electric power devices.
Ø MgB2 also regarded promising, because of its low cost.
HTS

Y. Iwasa (05/08/03) 36
Bi-2223 High Current Density Wire: Non-Reinforced
Thickness (avg): 0.21 (+/-0.02mm)Width (avg): 4.1 (+/- 0.2mm)Min. Critical Stress: 75 MPaMin. Critical Strain: 0.15%Min. Bend Dia: 100 mm
0
0.2
0.4
0.6
0.8
1
0 20 40 60 80 100
Stress at 77K (MPa)
Ic/I
c(o)
0
0.0004
0.0008
0.0012
0.0016
0.002
Str
ain
Ic/Ic(o) Strain
Variable Specifications:Min. Ic: 115 A—135 APiece Length: 100 m —200 m
Slides 35-39: Based on American Superconductor Corp. Data Sheets

Y. Iwasa (05/08/03) 37
0
0.2
0.4
0.6
0.8
1
0 50 100 150 200 250 300 350
Stress at 77K (MPa)
Ic/Ic(o
)
0
0.1
0.2
0.3
0.4
0.5
0.6
0.7
Str
ain
(%
)
Ic/Ic(o) Strain
Bi-2223 High Strength Reinforced Tape
Thickness (avg): 0.31 (+/-0.02mm)Width (avg): 4.1 (+/- 0.2mm)Min. Critical Stress: 265 MPaMin. Critical Strain: 0.4%Min. Bend Dia: 70 mm
Variable Specifications:Min. Ic: 115 A—135 APiece Length: 100 m —300 m
Stainless Steel Strips

Y. Iwasa (05/08/03) 38
Scaling Ratio to 77K (self-field) in // External Field
0
1
2
3
4
5
6
0 1 2 3 4 5 6 7 8
Parallel Magnetic Field (Tesla)
Sca
ling
Rat
io, I
c(T
,B)/
Ic(7
7K,0
)
20
35
50

Y. Iwasa (05/08/03) 39
Scaling Ratio to 77K (self-field) in External Field
0
1
2
3
4
5
6
0 1 2 3 4 5 6 7 8
Perpendicular Magnetic Field (Tesla)
Sca
ling
Rat
io, I
c(T
,B)/
Ic(7
7K,0
)
20K
35K50K

Y. Iwasa (05/08/03) 40
Scaling Ratio, 77K to 4.2K
0.00
1.00
2.00
3.00
4.00
5.00
6.00
0 2 4 6 8 10 12
Magnetic Field, Tesla
Bpar, 4.2K
Bperp, 4.2K

Y. Iwasa (05/08/03) 45
1-D NZP in YBCO Composite—Energy Margin & NZP Velocity
Keithley2001 DMM*
Keithley2001 DMM*
Keithley2001 DMM*
Keithley2000 DMM
Keithley2000 DMM
Keithley2000 DMM
Keithley2000 DMM*
HP 6286ADC-P/S
HP 8112Apulse generator
HP 6681ADC-P/S
Keithley2000 DMM
Keithley2001 DMM*
500 A / 100 mV
V3 V2 V1 Vcernox1 Vcernox2
Vtot
V(I)
GPIB
HTS sample NiCr heater
Vcernox3
*set on buffer read for increased speed/resolution
Slides 45-51: Based on Justin Schwartz ( DOE Meeting July 2002)

Y. Iwasa (05/08/03) 46
Bi2223 tape: Recovery
0.000
0.002
0.004
0.006
0.008
6 7 8 9 10 11 12 13 14 15
Time (s)
Vo
ltag
e (V
) V1
80
90
100
110
0 10 20 30 40 50
Time (s)
Tem
per
atu
re (
K)
V3
V2
C1
C2

Y. Iwasa (05/08/03) 36
Bi-2223 High Current Density Wire: Non-Reinforced
Thickness (avg): 0.21 (+/-0.02mm)Width (avg): 4.1 (+/- 0.2mm)Min. Critical Stress: 75 MPaMin. Critical Strain: 0.15%Min. Bend Dia: 100 mm
0
0.2
0.4
0.6
0.8
1
0 20 40 60 80 100
Stress at 77K (MPa)
Ic/I
c(o)
0
0.0004
0.0008
0.0012
0.0016
0.002
Str
ain
Ic/Ic(o) Strain
Variable Specifications:Min. Ic: 115 A—135 APiece Length: 100 m —200 m
Slides 36-40: Based on American Superconductor Corp. Data Sheets

Y. Iwasa (05/08/03) 48
Iop=19 A; Ic=22 A
80.6
80.7
80.8
80.9
81.0
81.1
0 10 20 30 40 50
Time (s)
Tem
per
atu
re (
K) C1 (closest)
C3 (closest)
C2

Y. Iwasa (05/08/03) 49
0.00E+00
5.00E-03
1.00E-02
1.50E-02
2.00E-02
2.50E-02
3.00E-02
0 1 2 3 4 5 6 7 8
Time (s)
Vo
ltag
e (V
)
NZP @ 19 A & 80.6 K
PrimaryHeater pulse
V1 V2 V3
V4 100

Y. Iwasa (05/08/03) 50
0
10
20
30
40
50
60
70
80
90
50 60 70 80 90 100
Fraction I/Ic (%)
Min
imu
m Q
uen
ch E
ner
gy
(mJ)
Energy Margin vs. I/Ic (Ic =22 A @ 80.6 K )

Y. Iwasa (05/08/03) 51
NZP Velocity vs. I/Ic
0.00
0.20
0.40
0.60
0.80
1.00
50 60 70 80 90 100
I/Ic (%)
Qu
ench
Pro
pag
atio
n
Vel
oci
ty (
cm/s
)

Y. Iwasa (05/08/03) 52
Quench/Recovery Experiment & Simulation
Bath cooling @77K
Forced-flow cooling @ 2-3 atm 80-81K

Y. Iwasa (05/08/03) 53
Forced Flow Experimental Setup
PressureGauge
PressureRegulator
LiquidNitrogen
77K Hx RT Hx
77K (Styrofoam Bath)
High-Pressure (3-atm) Section
Water
N2 Gas Tank
NeedleValve
Shut/OpenValve
VolumeMeter
SampleHolder

Y. Iwasa (05/08/03) 54

Y. Iwasa (05/08/03) 55
New Forced-Flow Sample Holder

Y. Iwasa (05/08/03) 56

Y. Iwasa (05/08/03) 57

Y. Iwasa (05/08/03) 58

Y. Iwasa (05/08/03) 59

Y. Iwasa (05/08/03) 60
Sample 2: V( I ) Plot @77K [ Ic=105A ] [ Source-Measured Ic > 100A ]
-5
0
5
10
15
20
0 20 40 60 80 100 120
V [u
V]
I [A]

Y. Iwasa (05/08/03) 61
Sample 2: Forced-Flow (~81K; 5cm/s)
0
50
100
150
200
I [A
]
24A
170A
45A
0
250
500
750
1000
0 1 2 3 4 5 6
V [m
V]
Time [s]
24A
71A
65A45A
65A
71A

Y. Iwasa (05/08/03) 62
Sample 2: Forced-Flow (~81K; 3cm/s)
0
200
400
600
800
1000
0 1 2 3 4 5 6
V [m
V]
Time [s]
24A
0
50
100
150
200
I [A
]
24A
45A
45A
65A
65A

Y. Iwasa (05/08/03) 63
Sample 2: Forced-Flow (@81K)
0
200
400
600
800
1000
0 1 2 3 4 5
V [m
V]
Time [s]
170A/65A (3cm/s)
170A/65A (5cm/s)

Y. Iwasa (05/08/03) 64
Sample 2: Forced-Flow (5cm/s) & Bath
0
200
400
600
800
1000
0 1 2 3 4 5 6
V [m
V]
Time [s]
170A/75A (Bath)
170A/71A (5cm/s)
Y. Iwasa (05/08/03) 65
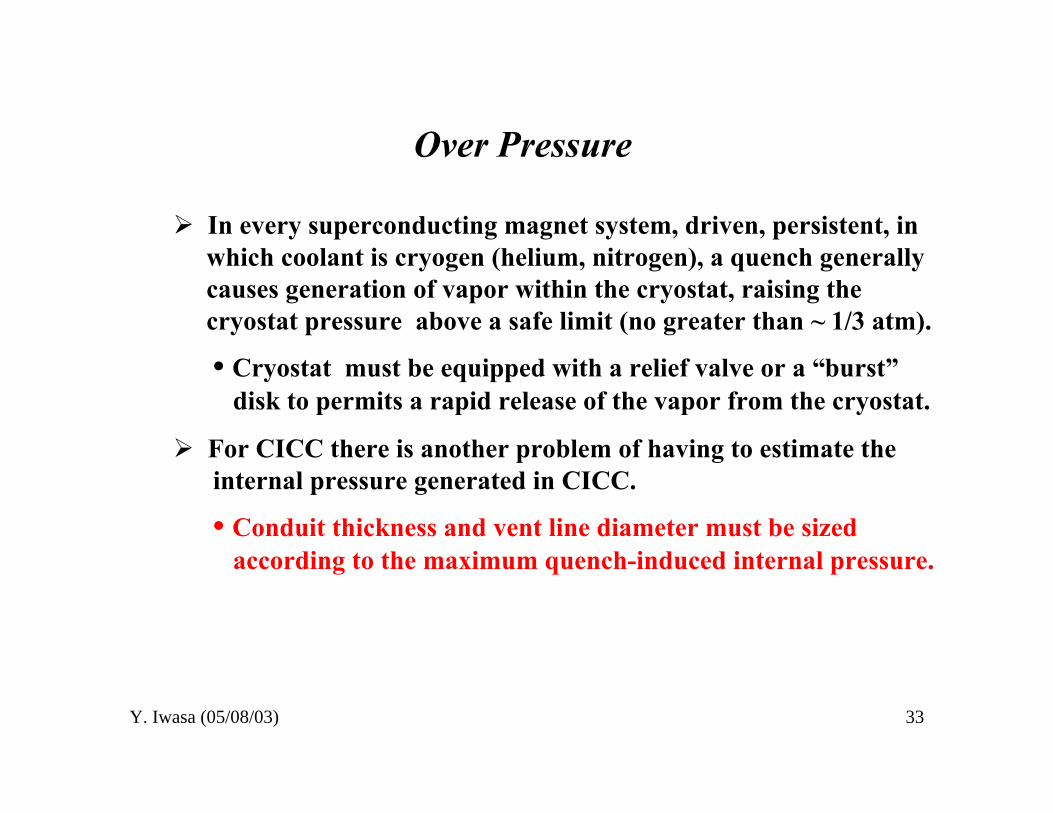
Simulation
3.08.0 PrRe023.0=Nu
( )( )[ ] 3/2PrRe/04.01
PrRe/0668.066.3
LD
LDNu
++=
3000Re ≥
3000Re <
0.849°10-20.5791°10-513768.62884.0
0.12470.1228°10-32079779.983.0
κ(W/m K)µ(Pa s)Cp(j/kg K)ρ(kg/m3)T(K)
Nitrogen Properties at 2 bar( From Handbook of Cryogenic Engineering, I. G. WeisendΙΙ, 1998)
, turbulent flow
, laminar flow
Q = h Tw =hAs(Tw-Tf)
h=kNu/D

Y. Iwasa (05/08/03) 66
Sample 2: Bath @77 K & Simulation
0
200
400
600
800
1000
1200
V [m
V]
MeasurementSimulation
45A
24A
65A
65A
45A
24A
0
50
100
150
200
250
300
350
0 1 2 3 4 5
T [K
]
Time [s]
75A
20A
40A
60A

Y. Iwasa (05/08/03) 67
Sample 2: Forced-Flow (3 cm/s) & Simulation
0
50
100
150
200
250
300
350
0 1 2 3 4 5
T [K
]
Time [s]
Entrance Middle
65A
45A
24A
Exit
0
200
400
600
800
1000
1200V
[mV
]MeasurementSimulation
45A
24A
65A
65A
45A
24A

Y. Iwasa (05/08/03) 68
Sample 2: Forced-Flow (5 cm/s) & Simulation
0
50
100
150
200
250
300
350
0 1 2 3 4 5
T [K
]
Time [s]
45A
65A
71A
24A
Entrance Middle Exit
0
200
400
600
800
1000
1200
V [m
V]
45A
24A
65A
71A
71A
65A45A
24A
MeasurementSimulation

Y. Iwasa (05/08/03) 69
YBCO Samples in a Conduction Cooling Setup
• The sample was mountedbetween a Kapton-tape-insulated Cu-block and a G-10block.
• It was affixed to the first- stagecold-head of a Cryomech GB-37cryocooler for conductioncooling to about 40 K.
• A copper shield was addedaround the G-10 block to ensurea better uniform temperature ofthe tape.
• A heater was affixed to thecopper base,and three PRTThermometers are placed onthe YBCO top surface.
Slides 69-78: Based on Winston Lue ( ASC2002, August 2002 )
Y. Iwasa (05/08/03) 70
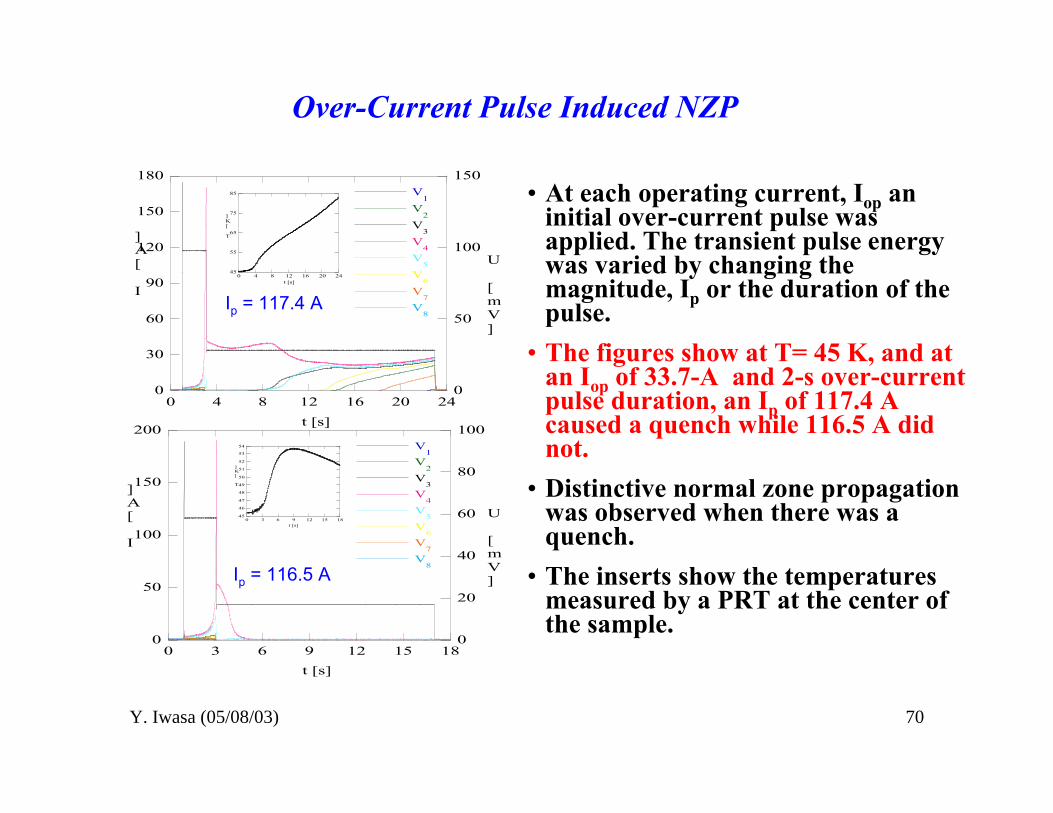
Over-Current Pulse Induced NZP
• At each operating current, Iop aninitial over-current pulse wasapplied. The transient pulse energywas varied by changing themagnitude, Ip or the duration of thepulse.
• The figures show at T= 45 K, and atan Iop of 33.7-A and 2-s over-currentpulse duration, an Ip of 117.4 Acaused a quench while 116.5 A didnot.
• Distinctive normal zone propagationwas observed when there was aquench.
• The inserts show the temperaturesmeasured by a PRT at the center ofthe sample.
0
30
60
90
120
150
180
0
50
100
150
0 4 8 12 16 20 24
V1
V2
V3
V4
V5
V6
V7
V8
I [A]
U [mV]
t [s]
45
55
65
75
85
0 4 8 12 16 20 24
T [K]
t [s]
0
50
100
150
200
0
20
40
60
80
100
0 3 6 9 12 15 18
V1
V2
V3
V4
V5
V6
V7
V8
I [A]
U [mV]
t [s]
45
46
47
48
49
50
51
52
53
54
0 3 6 9 12 15 18
T [K]
t [s]
Ip = 117.4 A
Ip = 116.5 A

Y. Iwasa (05/08/03) 71
Stability Margins in the Range 45—80 K
• To measure the stability margin, theoperating current was set near the lowestzone Ic at a particular temperature.
• At the highest recovery pulse current, theV-I product integrated over the initial pulsedivided by the zone volume is used toestimate the stability margin.
• The measured stability margins rangedfrom 16 to 120 J/cm3 as temperature lowersfrom 80 to 45 K.
• Comparison with the specific heat integralsindicated better fit to Tc than to Tcs for theHTS tapes.
• The higher margins measured at lowertemperatures are attributed to the higherconduction cooling.( )( )coptopcopcs IITTTT −−+= 1
0
20
40
60
80
100
120
45 50 55 60 65 70 75 80 85
Measured
Stability marg
3]
T [K]

Y. Iwasa (05/08/03) 72
Minimum Propagation Currents
• At 45.4 K, the sample wassubjected to an initial over-current pulse of 118 A for 2 swhile increasing the operatingpropagation in 1 A steps.
• The figures show recovery atan operating current of 27.4 Aand propagation at 28.4 A - aminimum propagation current.
• The initial heat input to zone 4was about 4.6 J or 350.4 J/cm3
- about 3 times the stabilitymargin.
0
50
100
150
200
0
50
100
150
200
-2 6 14 22 30 38 46 54 62
V1
V2
V3
V4
V5
V6
V7
V8
I [A]
U [mV]
t [s]
45
50
55
60
65
70
75
0 10 20 30 40 50 60
T [K]
t [s]
0
30
60
90
120
150
180
0
50
100
150
200
-2 6 14 22 30 38 46 54 62
V1
V2
V3
V4
V5
V6
V7
V8
I [A]
U [mV]
t [s]
40
50
60
70
80
90
100
110
0 10 20 30 40 50 60
T [K]
t [s]
Iop = 27.4 A
Iop = 28.4 A

Y. Iwasa (05/08/03) 73
Minimum Propagation Current vs. Temperature
• Minimum propagationcurrents were also determinedby extrapolating the velocityversus current plots to zerovelocity.
• Minimum propagationcurrents of 12 to 27 A wereobserved at 80.8 to 45.4 K.
• The existence of minimumpropagation current is thoughtto be the result of conductioncooling.
10
15
20
25
30
45 50 55 60 65 70 75 80 85
measured
extrapolated
fitted average
I mp
[A]
T [K]

Y. Iwasa (05/08/03) 74
NZP Velocity vs. Iop
• NPZ always starts from themiddle (zone 4) of this sample.
• NZP velocities were found to beincreasing linearly with thecurrent.
• No more than 20 mm/s of NZPvelocity was measured when Iopwas set below Ic.
• The outer zones which receivedbetter cooing resulted in lowerNZP velocity and higherminimum propagation current.
0
5
10
15
20
25
30
10 15 20 25 30 35
v2-1
v3-2
v7-8
Quench propagati
Iop
[A]
T=76.4-KIc2
=22.3-A
Ic3
=20.4-A
Ic7
=18.7-A
0
2
4
6
8
10
20 25 30 35 40 45 50
v2
v6
v7
Quench propagati
Iop
[A]
T=45.8 KIc2
=68.8 A
Ic6
=64.9 A
Ic7
=61.5 A

Y. Iwasa (05/08/03) 75
NZP Velocity vs. Temperature
• NZP velocities weremeasured at fivedifferent temperatures.
• NZP velocities at anoperating current of 30.3A were found at thedifferent temperaturesand plotted in the figure.
• NZP velocity vs.temperature shows asimilar dependence asthe ratio of operating tocritical current.
0
5
10
15
20
0.5
1
1.5
2
2.5
45 50 55 60 65 70 75 80
v2
v7
T [K]
Iop
=30.3 A
I op/
Ic7
Quench propagati

Y. Iwasa (05/08/03) 76
Modified Adiabatic Theories of NZP Velocity
1. Constant material properties (Dresner)
2. Variable material properties (Zhao and Iwasa)
3. Constant material properties with a different transition temperature(Bellis and Iwasa)
vA
I Imp
A C p
k
Tc Top
vB
I Im p
A
kn n
Cs dT Cn
1
kn
dkn
dTCs
Top
T c
dTT op
Tc
vC
I Im p
A
kn
CnCs Tt Top Tt Tcs
1
2Tc Tcs

Y. Iwasa (05/08/03) 77
NZP velocities: Experiment & Modified Adiabatic Theories
• Inclusion of a minimumpropagation current isnecessary to achieve betteragreement with the data.
• The agreement of the twoIwasa’s theories indicatedthe validity of a newtransition point for HTS,
• Fair agreement is foundbetween the data themodified theory of Iwasa.
0
5
10
15
20
45 50 55 60 65 70 75 80
vB
vC
vA
vm (Fig. 9)
Quench propagati
T [K]
Iop
=30.3 A

Y. Iwasa (05/08/03) 78
ORNL Conclusion
• Stability margins ranged from 16 to 120 J/cm3 as temperature lowersfrom 80 to 45 K. Comparison with the specific heat integrals indicatedbetter fit to Tc than to Tcs for the HTS tapes.
• Distinctive NZP in YBCO was observed at each of the measuredtemperatures.
• Minimum propagation current as a function of temperature wasmeasured. Its existence is thought to be the result of conduction cooling.
• NZP velocities of no more than 20 mm/s were measured. Velocity vs.temperature data show a similar dependence as the ratio of operating tocritical current and agrees with a modified adiabatic theory.

![Comparative study of cryogenic NbTi/Cu and MgB2/Brass ... · assess the operational cost of CLs References [1] Yukikazu Iwasa: Case Studies in Superconducting Magnets Design and Operational](https://static.fdocuments.in/doc/165x107/5ec374cc7ce18f209434375a/comparative-study-of-cryogenic-nbticu-and-mgb2brass-assess-the-operational.jpg)


![Stress Computation in the C400 Superconducting …[2] M.N. Wilson, Superconducting Magnets , pub Oxford Science Publications, Clarendon Press, Oxford (1983), reprint 2002 [3] Y. Iwasa,](https://static.fdocuments.in/doc/165x107/5f2ab6f6a96031762569e738/stress-computation-in-the-c400-superconducting-2-mn-wilson-superconducting.jpg)