Mass Transport, Momentum Transport and … Transport, Momentum Transport and Fluidization in a ......
38
Mass Transport, Momentum Transport and Fluidization in a 2D Bubbling Fluidized Bed Alexander G. Mychkovsky and Steven L. Ceccio University of Michigan Dept of Mechanical Engineering Deepak Rangarajan and Jennifer S. Curtis University of Florida Dept of Chemical Engineering 1
Transcript of Mass Transport, Momentum Transport and … Transport, Momentum Transport and Fluidization in a ......

Mass Transport, Momentum
Transport and Fluidization in a
2D Bubbling Fluidized Bed
Alexander G. Mychkovsky and Steven L. Ceccio
University of Michigan
Dept of Mechanical Engineering
Deepak Rangarajan and Jennifer S. Curtis
University of Florida
Dept of Chemical Engineering
1

2
Overview
Background
Laser Doppler Velocimetry (LDV) Measurement Technique
Single Phase Gas Jet in Empty Bed
Gas Jets in Bubbling Bed
Turbulence Measurements
Effect of Emulsion Fluidization Level on Jet Dynamics
Conclusions
Modeling Effort

3
Background
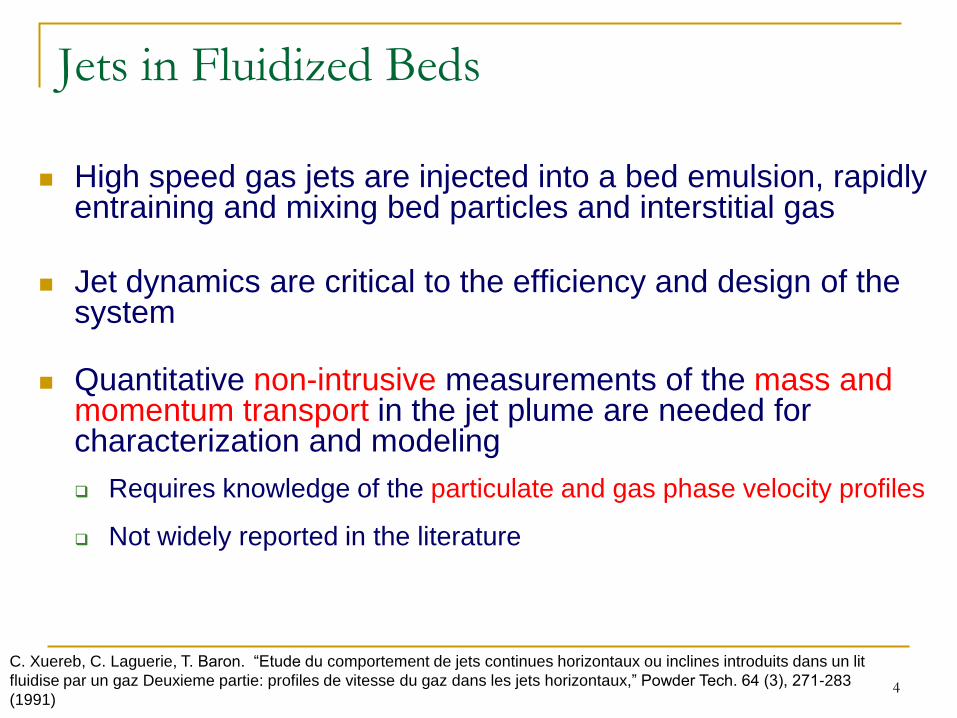
High speed gas jets are injected into a bed emulsion, rapidly entraining and mixing bed particles and interstitial gas
4
Jets in Fluidized Beds
C. Xuereb, C. Laguerie, T. Baron. “Etude du comportement de jets continues horizontaux ou inclines introduits dans un lit
fluidise par un gaz Deuxieme partie: profiles de vitesse du gaz dans les jets horizontaux,” Powder Tech. 64 (3), 271-283
(1991)
Quantitative non-intrusive measurements of the mass and momentum transport in the jet plume are needed for characterization and modeling
Requires knowledge of the particulate and gas phase velocity profiles
Not widely reported in the literature
Jet dynamics are critical to the efficiency and design of the system

5
Our 2D Fluidized Bed
Vertical Gas Jet
(orifice flush with
distributor surface)
Dj = 9.2 mm, Vj = 92 m/s
Vfl /Vmf = 1.15
838 μm SMD HDPE micropellets
Quartz viewing windows
(102 mm x 153 mm x 5mm thick)
Acrylic walls
(457 mm wide x 12.7 mm gap)
Velocity profile scans at
y = 60, 70, 100, 130 mm
LDV Measurement Technique
6

7
LDV in Two Phase Gas-Particle flow
Particle speed
~ frequency of scattered light
Simultaneously measure bed particle (~1,000 μm)and jet gas (~1 μm tracers) velocity profiles (2 component)
Jet gas is seeded by rapidly condensing moisture in the air to produce ice crystals
(Tj = -5oC, ρj = 1.32 kg/m3)
Burst intensity subranging to distinguish the two phase measurements
7

8
Intensity Subranging
Bed particles (dp>>f)
produce larger amplitude
Doppler bursts than gas
tracer ice crystals (dp~ f)
R. S. Barlow & C. Q. Morrison. “Two-phase velocity measurements in dense
particle-laden jets,” Exp. Fluids. 9 (1-2) 93-104 (1990)
0 20 40 60 80 1000
200
400
600
800
1000
v (m/s)
I (m
V)
Bed Particles and Ice Crystals (0 s Coincidence)
Ice Crystals
Bed Particles
99% of bed particle bursts
> 200 mV
99% of ice crystal bursts
< 500 mV
Coincidence
Gas tracers: 0 μs
Bed Particles: 10 μs

Velocity Histogram Separation
0 20 40 60 80 1000
500
1000
1500
2000
v (m/s)
Co
un
ts
Bed Particles and Ice Crystals (0 s Coincidence)
Bed Particles
Ice Crystals
0 20 40 60 80 1000
500
1000
1500
2000
v (m/s)
Co
un
ts
Bed Particles Subranged (I >500 mV, 10 s Coincidence)
0 50 1000
500
1000
1500
2000
v (m/s)
Co
un
ts
Ice Crystals Subranged (I < 200 mV, 0 s Coincidence)
9

10
Single Phase Gas Jet

11
Empty Bed Transverse Velocity Profiles Single phase gas jet plume velocity profiles are self-similar with a Gaussian bell-
curve shape
Centerline axial velocity decay and velocity profile width expansion are consistent
with a free 2D turbulent jet
-2 -1 0 1 2
0.2
0.4
0.6
0.8
1
= x/xg,1/2
v g/v
g,m
Empty Bed, Vj = 90 m/s, V
fl = 0 cm/s
y =70 mm
y =100 mm
y =130 mm
exp[-ln(2)2]
1.6 1.8 2 2.21.6
1.8
2
2.2
log (y-yo), y
o = 2D
j
log
(v g
,m )
Empty Bed, Vj = 90 m/s, V
fl = 0 cm/s
vg,m
~ (y-yo)-1/2
1.6 1.8 2 2.2
0.7
0.8
0.9
1
1.1
1.2
log (y-yo), y
o = 2D
j
log
(xg
,1/2
)
Empty Bed, Vj = 90 m/s, V
fl = 0 cm/s
xg,1/2
~ (y-yo)1

12
Mass and Momentum Transport Calculations
Self-similar velocity profiles enable transport values to be calculated from velocity
centerline and half-point values.
2/1,
2
,2
2
2 5.1 gmgg
b
b
ggg xvwCdxvwCJ
2/1,,11 09.2 gmgg
b
b
ggg xvwCdxvwCm
Axial mass transport
-5 0 50
0.5
1
z (mm)
v g/v
g,p
eak
Empty Bed, Vj = 90 m/s, V
fl = 0 cm/s
7.0 )(1
1,1, CvCdzzvw
v peakg
w
avgg
55.0 )(1
2
2
,2
22
, CvCdzzvw
vw
peakgavgg
Axial momentum transport
The 3D nature of flow must be accounted for

13
Gas Jets in a Bubbling Bed

Bubbling Bed Vertical Jet Velocity Profiles
Jet gas and bed particle velocities obtained simultaneously
838μm HDPE particles
Fluidization: Vfl = 33.4 cm/s (Vfl /Vmf = 1.15)
Gas Velocity Profiles
-20 -10 0 10 200
5
10
15
x (mm)
v p (
m/s
)
838 m HDPE, Vj = 92 m/s, V
fl = 33.4 cm/s
y = 60 mm
y = 70 mm
y = 100 mm
y = 130 mm
Particle Velocity Profiles
-20 -10 0 10 200
10
20
30
40
50
60
70
x (mm)
v g (
m/s
)
838 m HDPE, Vj = 92 m/s, V
fl = 33.4 cm/s
y = 60 mm
y = 70 mm
y = 100 mm
y = 130 mm
14

Transverse Velocity Profile Self-Similarity
The gas and particulate phase velocity profiles appear
self-similar, thus they can be fully characterized by
Centerline velocity: vm(y)
Velocity profile width: x1/2(y)
Particulate Velocity Profiles
-2 -1 0 1 20
0.2
0.4
0.6
0.8
1
= x/xg,1/2
v g/v
g,m
838 m HDPE, Vj = 92 m/s, V
fl = 33.4 cm/s
y =60 mm
y =70 mm
y =100 mm
y =130 mm
exp[-ln(2)2]
Gas Velocity Profiles
-2 -1 0 1 20
0.2
0.4
0.6
0.8
1
= x/xp,1/2
v p/v
p,m
838 m HDPE, Vj = 92 m/s, V
fl = 33.4 cm/s
y =60 mm
y =70 mm
y =100 mm
y =130 mm
exp[-ln(2)2]
15

Centerline Velocity and Profile Width
16
The presence of bed particles significantly reduces the gas
phase velocity
60 80 100 120
20
40
60
80
100
y (mm)
v m (
m/s
)
838 m HDPE, Vj = 92 m/s, V
fl = 33.4 cm/s
gas
particle
slip
empty
Axial Velocity Profile Velocity Profile Expansion
Velocity profile width for the gas phase in the bubbling and
empty bed is very similar
60 80 100 1204
5
6
7
8
9
10
11
12
13
14
15
y (mm)
x 1/2
(m
m)
838 m HDPE, Vj = 92 m/s, V
fl = 33.4 cm/s
gas
particle
slip
empty

Volumetric Void Fraction (ε) Indirectly determined from a momentum balance using
the measured velocity profiles
pgj JJJ
b
b
ggg dxvwCJ 2
2
b
b
ppp dxvwCJ 2
2)1(
b
b
pp
b
b
gg
b
b
ppj
dxvdxvwC
dxvwCJ
22
2
2
2
0 20 40 60 80 100 120
0.96
0.98
1
y (mm)
838 m HDPE, Vj = 92 m/s, V
fl = 33.4 cm/s
vo
id f
ract
ion
Void Fraction > 95% in the dilute jet plume
17

Mass Flow and Momentum Transfer Bed particles are entrained into the jet plume while the
gas phase mass flow remains nearly constant for this fluidization level
Mass flow in jet plume Momentum transfer in jet plume
0 50 100
0
20
40
60
80
100
y (mm)
m (
g/s
)
838 m HDPE, Vj = 92 m/s, V
fl = 33.4 cm/s
gas
particle
empty
0 50 100
0
0.2
0.4
0.6
0.8
y (mm)
J (k
g.m
/s2)
838 m HDPE, Vj = 92 m/s, V
fl = 33.4 cm/s
gas
particle
Momentum is rapidly transferred from the jet gas to the entrained particles
18

Effect of Emulsion Fluidization
State
19

20
Fluidization level varied from spouted bed to 50% beyond minimum
fluidization
838 μm HDPE micropellets
Vj = 92 m/s
Effect of Fluidization on Jet Dynamics
Vfl/Vmf = 0 Vfl/Vmf = 1 Vfl/Vmf = 1.5

21
Effect of Fluidization on Velocity Profiles Increasing the fluidization velocity decreases the maximum
centerline velocity and widens the velocity profiles for both phases Gas Phase Particulate Phase
60 80 100 1208
9
10
11
12
13
14
y (mm)
v p,m
(m
/s)
838 m HDPE, Vj = 92 m/s
Vfl/V
mf = 0
Vfl/V
mf = 0.7
Vfl/V
mf = 1
Vfl/V
mf = 1.15
Vfl/V
mf = 1.3
Vfl/V
mf = 1.5
Cente
rlin
e V
elo
city
Pro
file
Wid
th
60 80 100 120
30
40
50
60
70
y (mm)
v g,m
(m
/s)
838 m HDPE, Vj = 92 m/s
60 80 100 1208
9
10
11
12
13
y (mm)v p
,m (
m/s
)
838 m HDPE, Vj = 92 m/s
60 80 100 120
5
10
15
20
25
y (mm)
xg
,1/2
(m
m)
838 m HDPE, Vj = 92 m/s
60 80 100 1205
10
15
20
25
y (mm)
xp
,1/2
(m
m)
838 m HDPE, Vj = 92 m/s

22
Effect of Fluidization on Void Fraction
Void fraction in the jet plume increases with emulsion fluidization
Void Fraction
60 80 100 1208
9
10
11
12
13
14
y (mm)
v p,m
(m
/s)
838 m HDPE, Vj = 92 m/s
Vfl/V
mf = 0
Vfl/V
mf = 0.7
Vfl/V
mf = 1
Vfl/V
mf = 1.15
Vfl/V
mf = 1.3
Vfl/V
mf = 1.5
0 50 1000.92
0.94
0.96
0.98
1
y (mm)
838 m HDPE, Vj = 92 m/s

23
Effect of Fluidization on Mass Transport
60 80 100 1208
9
10
11
12
13
14
y (mm)
v p,m
(m
/s)
838 m HDPE, Vj = 92 m/s
Vfl/V
mf = 0
Vfl/V
mf = 0.7
Vfl/V
mf = 1
Vfl/V
mf = 1.15
Vfl/V
mf = 1.3
Vfl/V
mf = 1.5
Gas Phase Mass Flow
As the fluidization rate increases, the gas phase mass flow increases Below minimum fluidization, jet gas diffuses into the emulsion to locally fluidize
the particles
Above minimum fluidization, interstitial gas and bubbles in the emulsion are
entrained into the jet plume
0 50 100
5
10
15
20
y (mm)
mg (
g/s
)
838 m HDPE, Vj = 92 m/s

24
60 80 100 1208
9
10
11
12
13
14
y (mm)
v p,m
(m
/s)
838 m HDPE, Vj = 92 m/s
Vfl/V
mf = 0
Vfl/V
mf = 0.7
Vfl/V
mf = 1
Vfl/V
mf = 1.15
Vfl/V
mf = 1.3
Vfl/V
mf = 1.5
Particulate phase mass flow in the plume decreases with
increasing fluidization due to competition with the interstitial gas
entrainment
Effect of Fluidization on Mass Transport
Particulate Phase Mass Flow
0 50 1000
50
100
150
y (mm)
mp (
g/s
)
838 m HDPE, Vj = 92 m/s

25
Effect of Fluidization on Momentum Transport
As the fluidization rate increases, the gas phase momentum
increases due to increased interstitial gas entrainment
Particulate phase momentum decreases with increasing fluidization
60 80 100 1208
9
10
11
12
13
14
y (mm)
v p,m
(m
/s)
838 m HDPE, Vj = 92 m/s
Vfl/V
mf = 0
Vfl/V
mf = 0.7
Vfl/V
mf = 1
Vfl/V
mf = 1.15
Vfl/V
mf = 1.3
Vfl/V
mf = 1.5
Gas Phase Momentum Particulate Phase Momentum
pgj JJJ
0 50 1000
0.2
0.4
0.6
0.8
y (mm)
J g (
kg
.m/s
2)
838 m HDPE, Vj = 92 m/s
0 50 100
0
0.2
0.4
0.6
0.8
y (mm)
J p (
kg
.m/s
2)
838 m HDPE, Vj = 92 m/s

Turbulence Measurements
26

Importance
The jet plume of a bubbling bed is a region of turbulent
mixing
Experimental measurements have been restricted to
plume size, plume shape, gas mean velocity, solids
mean velocity and solids concentration
Turbulence data will help in developing fundamentally
rigorous models to describe momentum transport in
bubbling beds
Fluctuating velocity data will be valuable in validating
gas-solid turbulence equations used in Eulerian
framework
27
M. Filla, L. Massimilla, and S. Vaccaro. “Gas jets in fluidized beds and spouts: A comparison of experimental
behaviour and models,” Can. J. Chem. Eng. (61): 370, 1983.

Experimental Procedure
The same LDV technique used for mean velocities is employed to measure fluctuating velocities in each phase
To be conservative, only measurements with Doppler burst counts greater than 1000 are considered
28
v
N
vvv
2' )(
500 1000 1500 2000 2500 30008
10
12
v' g (
m/s
)
500 1000 1500 2000 2500 30002
3
4
Burst Count
v' p (
m/s
)

Single Phase Turbulence
Data lies in the non-self similar or potential core region of turbulence
Shows good agreement with literature
Negligible influence of bounding walls seen
29
D.R. Miller, and E.W. Comings, “Static pressure distribution in the free turbulent jet,” J. Fluid Mech. (3): 1, 1957.
E. Gutmark, and I. Wygnanski, “The planar turbulent jet,,” J. Fluid Mech. (73): 465, 1976.
D. Rangarajan , and J. S. Curtis, “Effect of spanwise width on rectangular jets with sidewalls,” J. Fluids. Eng. T. ASME, submitted 2011.
-2 -1.5 -1 -0.5 0 0.5 1 1.5 20
0.05
0.1
0.15
0.2
0.25
0.3
x/x1/2
v' /v
m
Self-similar region

Bubbling Bed Fluctuating Velocity Profiles
Particle fluctuations are ~50% greater than gas fluctuations
Profile shapes for both phases similar to single phase turbulence
Deviation in shape at higher fluidization state due to plume boundary
fluttering
30
-2 -1 0 1 20.1
0.15
0.2
0.25
0.3
0.35
x/xg,1/2
vg'/v
g,m
-2 -1 0 1 20.1
0.15
0.2
0.25
0.3
0.35
x/xp,1/2
vp'/v
p,m
Empty Bed
Vfl/V
mf=0
Vfl/V
mf=0.7
Vfl/V
mf=1
Vfl/V
mf=1.15
Vfl/V
mf=1.3
Vfl/V
mf=1.5
y/Dj= 7.61

Effect of Fluidization on Turbulence
There is an increase in gas turbulence in Spouted Bed compared to Empty Bed
Effect of increasing distributor velocity is to initially decrease and then increase
fluctuations in both phases
Particle and gas fluctuations complement each other
31
Empty Bed 0 0.7 1.0 1.15 1.3 1.50.22
0.24
0.26
0.28
0.3
0.32
0.34
0.36
0.38
Vfl/V
mf
vp
,cl
'/v
p,m
y/Dj= 6.52
y/Dj= 7.61
y/Dj= 10.87
y/Dj= 14.13
Empty Bed 0 0.7 1.0 1.15 1.3 1.50.12
0.14
0.16
0.18
0.2
0.22
0.24
0.26
Vfl/V
mf
vg
,cl
'/v
g,m
y/Dj= 6.52
y/Dj= 7.61
y/Dj= 10.87
y/Dj= 14.13

Relationship with mean quantities
32
Empty Bed 0 0.7 1.0 1.15 1.3 1.50.5
1
1.5
2
2.5
Vfl/V
mf
xg
,1/2
/Dj
Empty Bed 0 0.7 1.0 1.15 1.3 1.5
0.4
0.5
0.6
0.7
0.8
0.9
1
1.1
vg
,m/V
j
Vfl/V
mf
Empty Bed 0 0.7 1.0 1.15 1.3 1.50.12
0.14
0.16
0.18
0.2
0.22
0.24
0.26
Vfl/V
mf
vg
,cl
'/v
g,m
y/Dj= 6.52
y/Dj= 7.61
y/Dj= 10.87
y/Dj= 14.13
Empty Bed 0 0.7 1.0 1.15 1.3 1.5
0.8
1
1.2
1.4
1.6
1.8
2
2.2
Vfl/V
mf
xp
,1/2
/Dj
Empty Bed 0 0.7 1.0 1.15 1.3 1.50.05
0.1
0.15
0.2
vp
,m/V
j
Vfl/V
mf
Empty Bed 0 0.7 1.0 1.15 1.3 1.50.22
0.24
0.26
0.28
0.3
0.32
0.34
0.36
0.38
Vfl/V
mf
vp
,cl
'/v
p,m
y/Dj= 6.52
y/Dj= 7.61
y/Dj= 10.87
y/Dj= 14.13

Coupling via Fluctuating Velocity
High St suggests particle motion is unlikely to be affected by gas-phase turbulence
High Rep suggests gas turbulence enhancement due to vortex shedding caused by particles
33
000,21~18
2
jg
jpp
g
p
D
Vd
t
tSt
30001500~)(
Re
g
gppg
p
dvv
Hestroni, G., “Particles-turbulence interaction”, Int. J. Multiphase Flow, 15 (1989) 5

34
Modeling Effort

Modeling Framework Eulerian two-fluid modeling
Solved using MFIX code
Inclusion of friction and turbulence
interaction terms from existing
works
35
Dilute region dominated by turbulent
and collisional/kinetic stresses
Dense region dominated by
frictional stress
www.mfix.netl.doe.gov
Dgggg
g
g FgPVVt
V
ssDss
s
s gFPVVt
V

Use of Experimental Data for
Validation
36
Experimental data Compare with Validate
Minimum fluidization
velocity
Minimum fluidization velocity Frictional pressure
Plume size and shape
from photograph
Solids fraction contour Frictional viscosity
Gas and particle mean
axial velocity
Gas and solids axial velocity Overall performance of
model
Gas phase axial
fluctuating velocity
Turbulent kinetic energy
assuming same anisotropy as
planar single phase jet
Gas-particle turbulence
interaction
Particle axial fluctuating
velocity
Granular temperature
assuming isotropy
Gas-particle turbulence
interaction

x (m)
y (
m)
-0.135 -0.045 0.045 0.135 0.225
0.429
0.386
0.343
0.3
0.257
0.214
0.171
0.128
0.085
Spouted Bed: Srivastava-Sundaresan friction and no turbulence
interaction
37
0 0.002 0.004 0.006 0.008 0.013
4
5
6
7
8
9
10
y/Dj= 7.61
x (m)
T (
m2/s
2)
Experiment
Simulation
0 0.002 0.004 0.006 0.008 0.0120
40
60
80
100
120
140
y/Dj= 7.61
x (m)
k (
m2/s
2)
Experiment
Simulation
0 10 20 30 40 505
6
7
8
9
10
11
12
13
y/Dj
vp
,m (
m/s
)
Experiment
Simulation
x (m)
y (
m)
0 0.1 0.20
0.05
0.1
0.15
0.2
0.25
0.3
0.35
0.4
Srivastava, A., and Sundaresan, S., “Analysis of a frictional-kinetic model for gas-particle flow,” Powder Technol., 129 (2003) 72
Bulk FlowParticle mean velocity decay
Gas turbulence Granular temperature
Improvement in friction and turbulence interaction models required

Conclusions
A procedure has been developed to simultaneously
measure gas and particulate phase velocities based on
LDV burst intensity and coincidence subranging
Mass and momentum transport of the two phases inside
the jet plume of a bubbling bed was calculated from the
measured velocity profiles
Maintaining constant gas jet inlet conditions changes in
mean and fluctuating quantities were investigated for
varying emulsion fluidization states
The use of experimental data to validate the Eulerian
two-fluid model is presently being studied
38