Mass Spectrometry on the Cinco de Mayo - Rutgers...
47
Mass Spectrometry on the Cinco de Mayo Peter Lobel, Ph.D. Resident Member, Center for Advanced Biotechnology and Medicine Professor of Biochemistry and Molecular Biology, Rutgers-RWJMS Director, Rutgers-RWJMS Biological Mass Spectrometry Facility Member, Center for Integrative Proteomics Research [email protected] Images courtesy of David Fenyö, Nathan Yates, Wilhelm Haas, Michael McCoss, AB-SCIEX, Thermo
-
Upload
truongkhue -
Category
Documents
-
view
213 -
download
1
Transcript of Mass Spectrometry on the Cinco de Mayo - Rutgers...

Mass Spectrometry on the Cinco de Mayo
Peter Lobel, Ph.D.
Resident Member, Center for Advanced Biotechnology and Medicine
Professor of Biochemistry and Molecular Biology, Rutgers-RWJMS
Director, Rutgers-RWJMS Biological Mass Spectrometry Facility
Member, Center for Integrative Proteomics Research
Images courtesy of David Fenyö, Nathan Yates, Wilhelm Haas, Michael
McCoss, AB-SCIEX, Thermo

Outline of today’s talk
• Overview - mass spectrometry in proteomics
• How mass spectrometers work
• Looking at spectra - mass and isotopes
• Quantitative proteomics

• Measures mass/charge (m/z) of intact ions and
fragments
What does a mass spectrometer do?
Ion
Source
Mass
Analyzer Detector
m/z
inte
nsit
y
Structural
information
Quantitative
information
vacuum
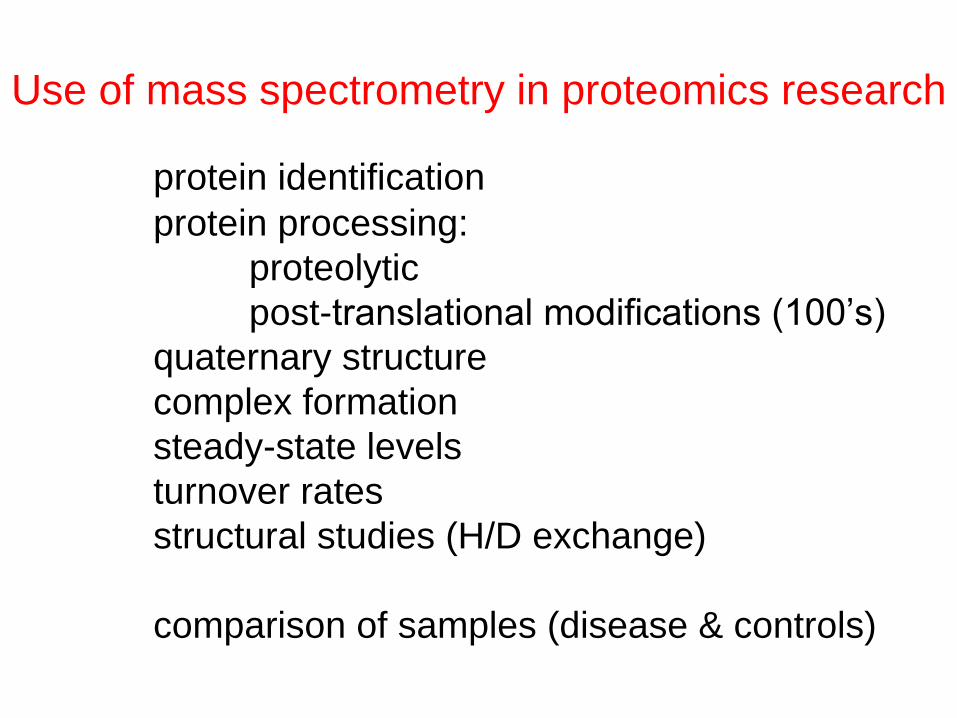
Use of mass spectrometry in proteomics research
protein identification
protein processing:
proteolytic
post-translational modifications (100’s)
quaternary structure
complex formation
steady-state levels
turnover rates
structural studies (H/D exchange)
comparison of samples (disease & controls)

Mass spectrometry is an enabling technology*
in the field of proteomics
Peptide Sequencing
Edman degradation Mass spectrometry
Material required ~pmol
(6 x 10¹¹ molecules)
fmol
6 x 10⁸ molecules
Time (data collection) ~10 hours 10 msec
Wikipedia
*An enabling technology is an invention or innovation, that can be applied to drive
radical change in the capabilities of a user or culture. Enabling technologies are
characterized by rapid development of subsequent derivative technologies, often in
diverse fields.
Equipment and/or methodology that, alone or in combination with associated
technologies, provides the means to increase performance and capabilities of the
user, product or process.

400 600 800 1000 1200 1400 1600 1800m/z
Re
lative
Ab
undan
ce
MS
1. MS1 (MS) spectra measure
intact peptide ions
500 300 700 900
507.2962 K.RLNIVQDR.F
507.3031 K.ANELLINVK.Y
507.3031 K.IIAIDINNK.K
507.3031 R.VLNLPSVGSK.S
507.3088 R.LNVLSNVVR.K
507.3088 K.SPKSNKKPK.R
507.3213 K.AIILGAQSIK.C
...
Predicted tryptic peptides in database
507.303
observed m/z, z=2 The precursor mass is not
enough information for ID
The mass of a single peptide provides sequence
constraints but is not sufficient for identification
Wilhelm Haas

Collision-Induced Dissociation (CID)
• Kinetic energy of parent ions is increased
• Parent ions undergo energy converting collisions
• Parent ions fall apart into product ions and neutrals
• Also referred to collision-activated dissociation (CAD)
+ +
Nathan Yates

Typical CID fragmentation pattern of peptides
H+

Nathan Yates
Combined residue mass for two amino acids Gly Ala Ser Pro Val Thr Cys Lxx Asn Asp Gln Lys Glu Met His Phe Arg Cmc Tyr Trp
AA 57 71 87 97 99 101 103 113 114 115 128 128 129 131 137 147 156 161 163 186
Gly 57 114
Ala 71 128 142
Ser 87 144 158 174
Pro 97 154 168 184 194
Val 99 156 170 186 196 198
Thr 101 158 172 188 198 200 202
Cys 103 160 174 190 200 202 204 206
Lxx 113 170 184 200 210 212 214 216 226
Asn 114 171 185 201 211 213 215 217 227 228
Asp 115 172 186 202 212 214 216 218 228 229 230
Gln 128 185 199 215 225 227 229 231 241 242 243 256
Lys 128 185 199 215 225 227 229 231 241 242 243 256 256
Glu 129 186 200 216 226 228 230 232 242 243 244 257 257 258
Met 131 188 202 218 228 230 232 234 244 245 246 259 259 260 262
His 137 194 208 224 234 236 238 240 250 251 252 265 265 266 268 274
Phe 147 204 218 234 244 246 248 250 260 261 262 275 275 276 278 284 294
Arg 156 213 227 243 253 255 257 259 269 270 271 284 284 285 287 293 303 312
Cmc 161 218 232 248 258 260 262 264 274 275 276 289 289 290 292 298 308 317 322
Tyr 163 220 234 250 260 262 264 266 276 277 278 291 291 292 294 300 310 319 324 326
Trp 186 243 257 273 283 285 287 289 299 300 301 314 314 315 317 323 333 342 347 349 372

400 600 800 1000 1200 1400 1600 1800m/z
Re
lative
Ab
undan
ce
400 600 800 1000 1200 1400 1600 1800m/z
Re
lative
Ab
undan
ce
507
200200 400400 600600 800800 10001000 12001200m/zm/z
Rela
tive A
bun
dance
Rela
tive A
bun
dance
1. MS MS/MS
2. Isolate one peptide
3. Collide with inert gas
(CID) to fragment
4. Fragment ions are
measured in MS/MS
MS/MS fragments
provide information
about the amino acid
sequence for manual
interpretation or
database searching
500 300 700 900
507.303
observed m/z
Sequencing a peptide ion using tandem MS
(MS/MS)
Wilhelm Haas
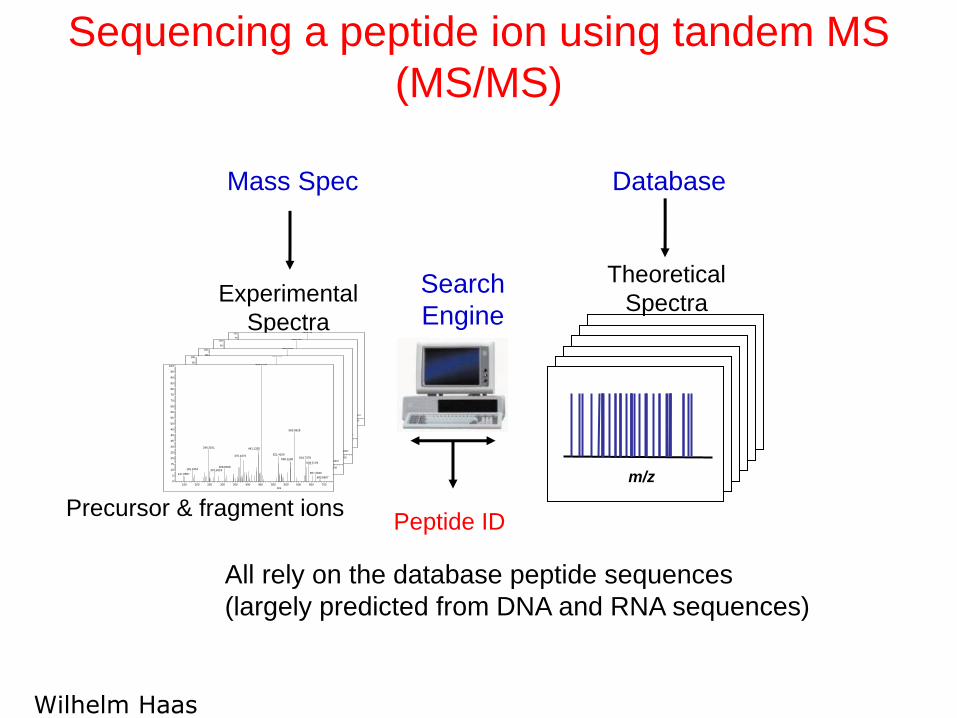
Sequencing a peptide ion using tandem MS
(MS/MS)
Wilhelm Haas
m/z
Theoretical
Spectra
Database
Experimental
Spectra
Peptide ID
Mass Spec
H:\bin\nd_1884 4/9/2007 8:34:29 PM pep lib
nd_1884 #4848 RT: 28.00 AV: 1 NL: 5.36E1T: ITMS + c NSI d Full ms2 [email protected] [115.00-930.00]
150 200 250 300 350 400 450 500 550 600 650 700 750 800 850 900
m/z
0
5
10
15
20
25
30
35
40
45
50
55
60
65
70
75
80
85
90
95
100
Re
lativ
e A
bu
nd
an
ce
453.5731
583.5828
246.3161 441.1335
521.4109370.4370624.7378
568.1208
639.3729
308.8508181.3454 755.6002267.4216
667.3040147.0887823.1918
680.5607
H:\bin\nd_1884 4/9/2007 8:34:29 PM pep lib
nd_1884 #4848 RT: 28.00 AV: 1 NL: 5.36E1T: ITMS + c NSI d Full ms2 [email protected] [115.00-930.00]
150 200 250 300 350 400 450 500 550 600 650 700 750 800 850 900
m/z
0
5
10
15
20
25
30
35
40
45
50
55
60
65
70
75
80
85
90
95
100
Re
lative
Ab
un
da
nce
453.5731
583.5828
246.3161 441.1335
521.4109370.4370624.7378
568.1208
639.3729
308.8508181.3454 755.6002267.4216
667.3040147.0887823.1918
680.5607
All rely on the database peptide sequences
(largely predicted from DNA and RNA sequences)
Search
Engine
Precursor & fragment ions

base
pea
k inte
nsity
time
organic
concentration
in mobile
phase
Separate microgram quantities of peptides on a capillary C18 column
Column I.D. = 75 μm
LC-MS/MS
We can identify 10,000 peptides in a 90 min run
HPLC
Pumps
Column Tryptic
digest
H:\bin\nd_1884 4/9/2007 8:34:29 PM pep lib
nd_1884 #4848 RT: 28.00 AV: 1 NL: 5.36E1T: ITMS + c NSI d Full ms2 [email protected] [115.00-930.00]
150 200 250 300 350 400 450 500 550 600 650 700 750 800 850 900
m/z
0
5
10
15
20
25
30
35
40
45
50
55
60
65
70
75
80
85
90
95
100
Re
lativ
e A
bu
nd
an
ce
453.5731
583.5828
246.3161 441.1335
521.4109370.4370624.7378
568.1208
639.3729
308.8508181.3454 755.6002267.4216
667.3040147.0887823.1918
680.5607
H:\bin\nd_1884 4/9/2007 8:34:29 PM pep lib
nd_1884 #4848 RT: 28.00 AV: 1 NL: 5.36E1T: ITMS + c NSI d Full ms2 [email protected] [115.00-930.00]
150 200 250 300 350 400 450 500 550 600 650 700 750 800 850 900
m/z
0
5
10
15
20
25
30
35
40
45
50
55
60
65
70
75
80
85
90
95
100
Re
lativ
e A
bu
nd
an
ce
453.5731
583.5828
246.3161 441.1335
521.4109370.4370624.7378
568.1208
639.3729
308.8508181.3454 755.6002267.4216
667.3040147.0887823.1918
680.5607
Data Analysis
Mass
Spectrometer
A typical proteomics experiment
Wilhelm Haas

How do mass spectrometers work?
Inlet Ion
source
Mass
Analyzer Detector
Data
System
High Vacuum System

Mass analyzers use forces to manipulate ions
)( BvEzdt
vdmamF
BvEdt
vd
z
m
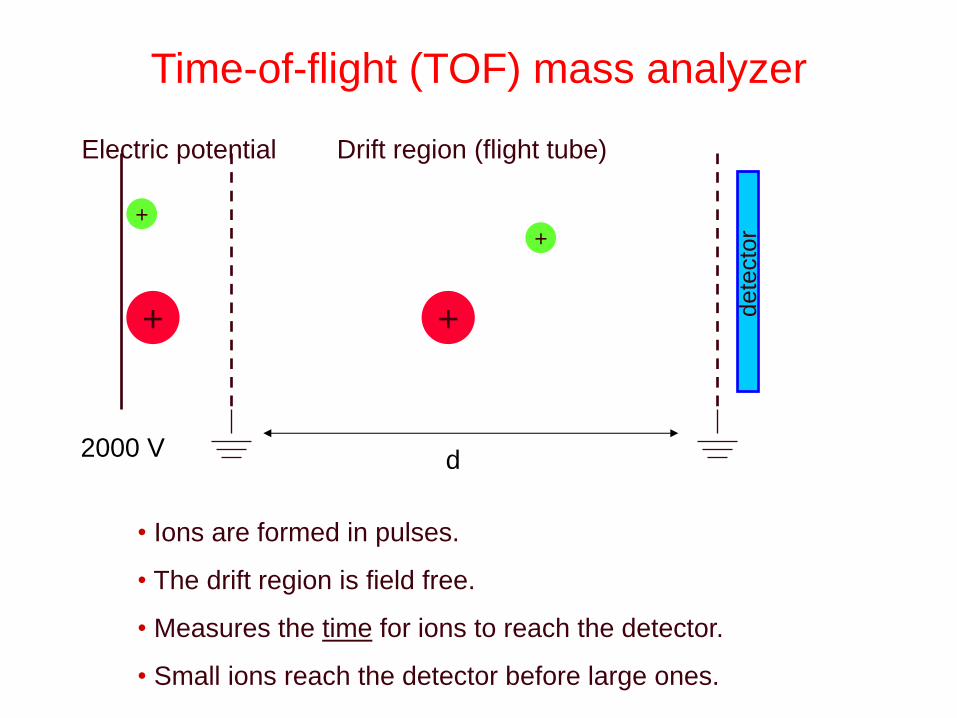
Time-of-flight (TOF) mass analyzer
+
+
+
+
Electric potential Drift region (flight tube)
dete
cto
r
2000 V
• Ions are formed in pulses.
• The drift region is field free.
• Measures the time for ions to reach the detector.
• Small ions reach the detector before large ones.
d

Time-of-flight (TOF) mass analyzer
+
+
+
+
Electric potential Drift region (flight tube)
dete
cto
r
2000 V
• Energy uptake is Eel=qV=ezV where e=charge/electron
• Conversion of potential energy to kinetic energy. ezV = ½ mv2
• The drift region is field free. Known distance, d.
• Measures the time for ions to reach the detector. v=d/t
• m/z=2eVv2=2eVd2/t2
d

Quadrupole mass analyzer
Oscillating electric fields, operates as a mass filter.
• Has four parallel metal rods.
• Lets one mass pass through at a time.
• Can scan through all masses or sit at one fixed mass.

mass scanning mode
(let different m/z through as function of time,
collect mass spectrum)
m1 m3 m4 m2
m3
m1
m4
m2
single mass transmission mode
let single m/z through, measure intensity
m2 m2 m2 m2 m3
m1
m4
m2
Quadrupoles have variable ion transmission
modes

Triple quadrupole MS (tandem in space)
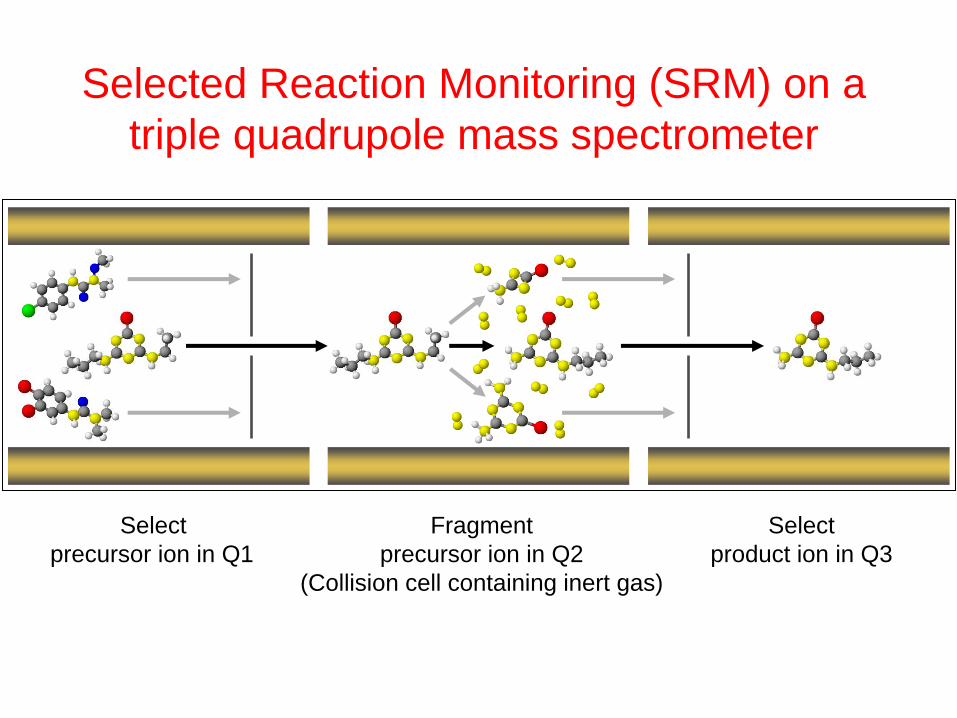
Selected Reaction Monitoring (SRM) on a
triple quadrupole mass spectrometer
Select Fragment Select
precursor ion in Q1 precursor ion in Q2 product ion in Q3
(Collision cell containing inert gas)
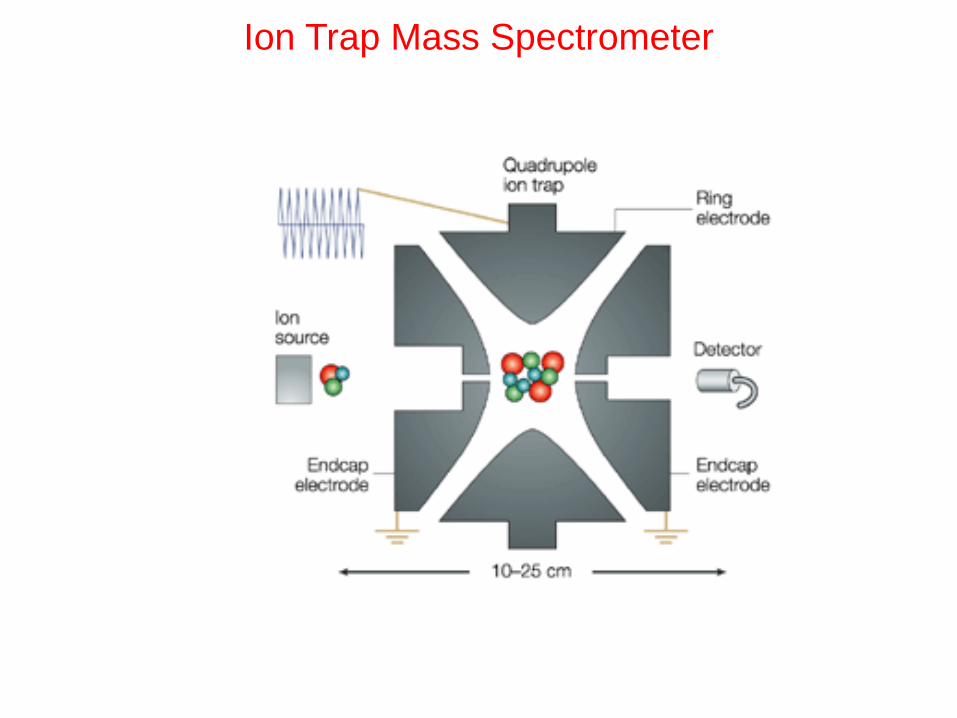
Ion Trap Mass Spectrometer

accumulate ions
compress ion cloud in center
apply resonance voltage
to eject ions selectively
transfer and focus ions
Ion Trap MS process

Ionization
Precursor Ion Isolation
Collisionally Activated Dissociation
Product Ion Scanning
MS/MS on an ion trap mass spectrometer
Tandem-in-Time (allows MSn)
Time (ms)
rf
Injection
0
Eject < M
Eject > M
CAD
Daughter
Ion Scanning

How do mass spectrometers work?
Inlet Ion
source
Mass
Analyzer Detector
Data
System
High Vacuum System
hn
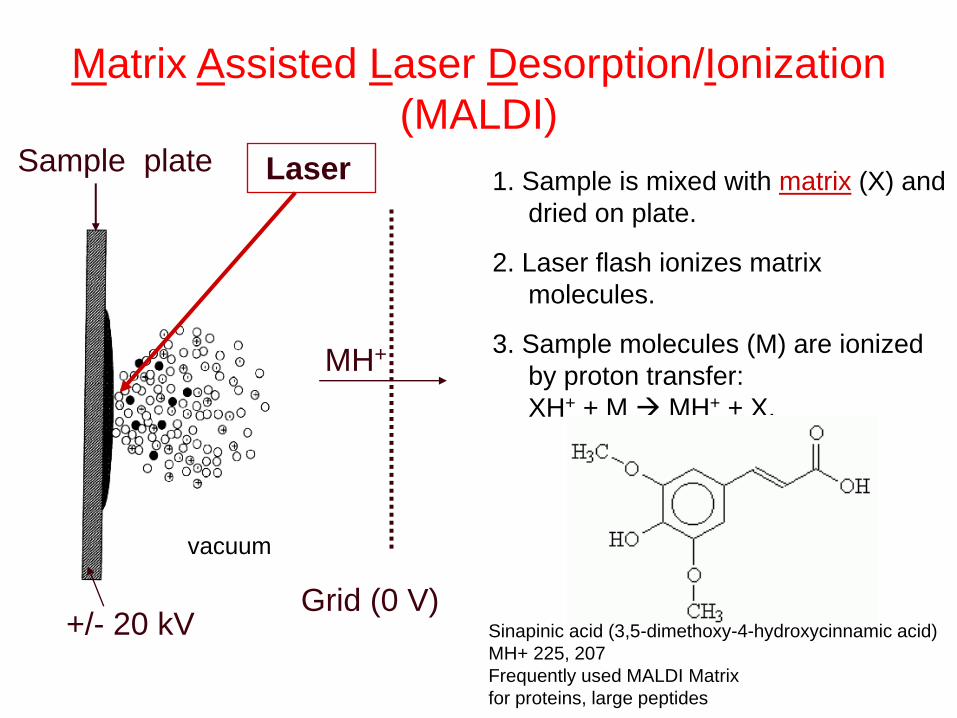
Laser 1. Sample is mixed with matrix (X) and
dried on plate.
2. Laser flash ionizes matrix
molecules.
3. Sample molecules (M) are ionized
by proton transfer:
XH+ + M MH+ + X.
MH+
Matrix Assisted Laser Desorption/Ionization
(MALDI)
+/- 20 kV Grid (0 V)
Sample plate
Sinapinic acid (3,5-dimethoxy-4-hydroxycinnamic acid)
MH+ 225, 207
Frequently used MALDI Matrix
for proteins, large peptides
vacuum
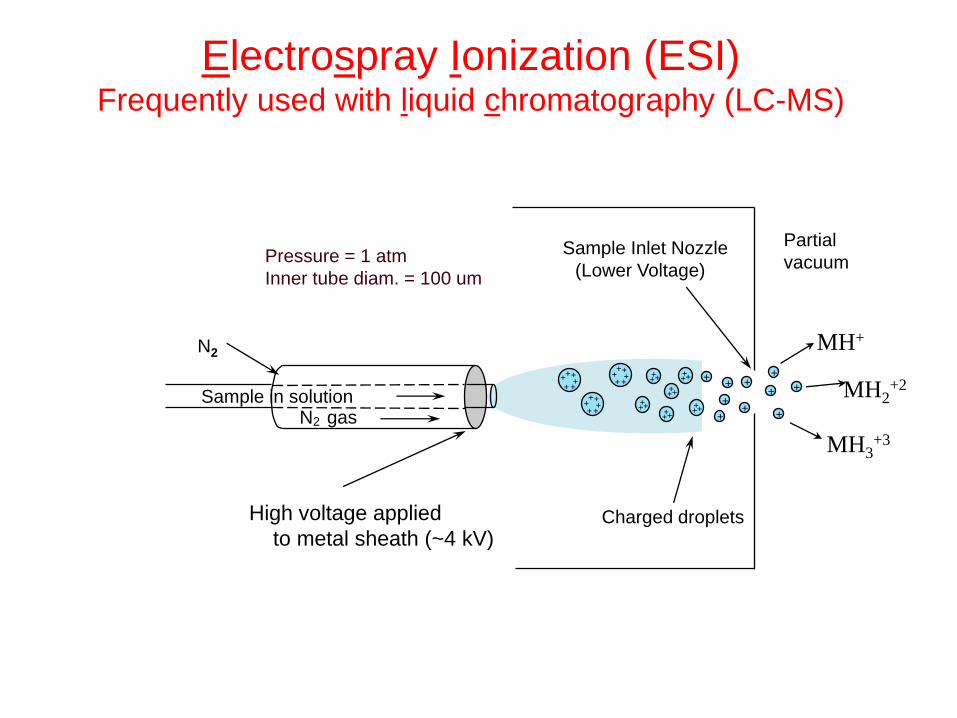
High voltage applied
to metal sheath (~4 kV)
Sample Inlet Nozzle
(Lower Voltage)
Charged droplets
+ +
+ +
+
+
+ +
+ + + +
+ +
+ + + +
+ + +
+ + +
+ + +
+ + + +
+
+ +
+
+
+
+ + +
+ + +
+ + +
MH+
MH3+3
MH2+2
Pressure = 1 atm
Inner tube diam. = 100 um
Sample in solution
N2
N2 gas
Partial
vacuum
Electrospray Ionization (ESI) Frequently used with liquid chromatography (LC-MS)
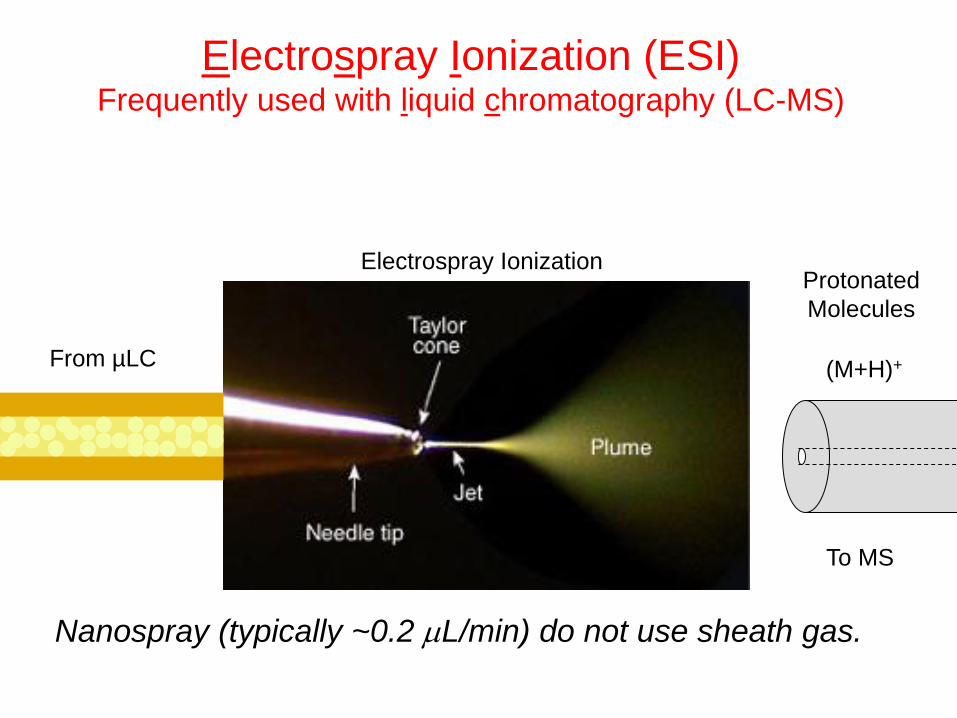
Electrospray Ionization (ESI) Frequently used with liquid chromatography (LC-MS)
Nanospray (typically ~0.2 L/min) do not use sheath gas.
Electrospray Ionization
To MS
From µLC (M+H)+
Protonated
Molecules

Mass spectrometers are frequently named
based on their ion source & mass analyzer
Inlet Ion
source
Mass
Analyzer Detector
Data
System
High Vacuum System
MALDI
Electrospray
TOF
Quadrupole (Q)
Ion trap
Orbitrap (orbi)
Hybrid: TOF-TOF
QQQ
Q-TOF
Q-Orbi
Ion trap-Orbi

Mass Spectra
• Mass units
• Isotopes
– the good, the bad & the ugly
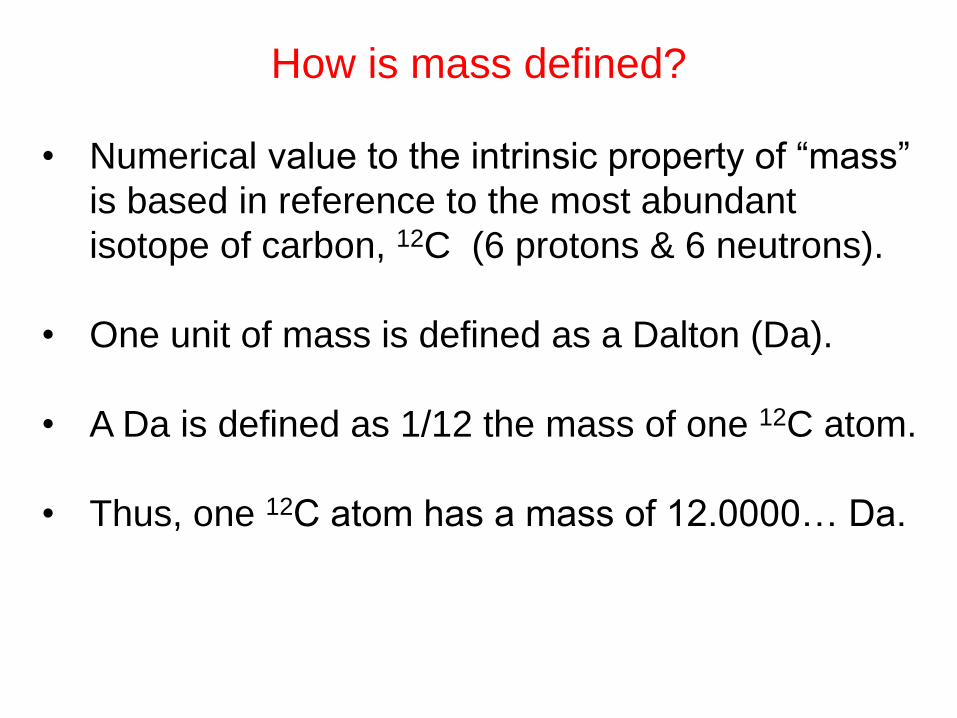
• Numerical value to the intrinsic property of “mass”
is based in reference to the most abundant
isotope of carbon, 12C (6 protons & 6 neutrons).
• One unit of mass is defined as a Dalton (Da).
• A Da is defined as 1/12 the mass of one 12C atom.
• Thus, one 12C atom has a mass of 12.0000… Da.
How is mass defined?

Most elements have >1 stable isotope
For example, most carbon atoms have a mass of 12 Da, but in nature,
1.11% of C atoms have an extra neutron, making their mass 13 Da.
Isotope composition of molecules depends on molecular formula and
isotope distribution of component atoms (binomial distribution).
Element Isotope Abundance
Hydrogen 1H 99.985
2H 0.015
Carbon 12C 98.890
13C 1.110
Nitrogen 14N 99.630
15N 0.370
Oxygen 16O 99.759
17O 0.037
18O 0.204
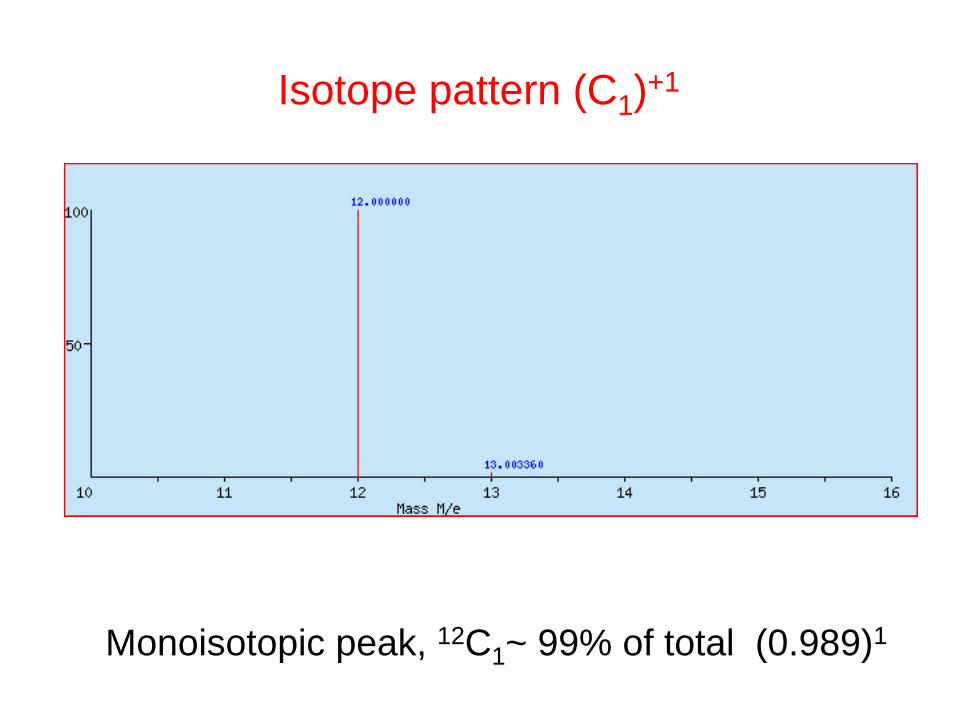
Isotope pattern (C1)+1
Monoisotopic peak, 12C1~ 99% of total (0.989)1

Isotope Pattern (C60)+1
Monoisotopic peak, 12C60~ 51% of total (0.989)60

Isotope Pattern (C300)+1
Monoisotopic peak, 12C300~ 4% of total (0.989)300

Effect of isotope abundance on mass
measurements
0 500 1000 1500 2000 2500 3000 3500 4000
mass/charge (m/z; z=1)
Inte
nsit
y
1002 1004 1006 1008
m/z
Inte
nsit
y
4014 4016 4018 4020 4022
m/z
Inte
nsit
y
2004 2006 2008 2010
m/z
Inte
nsit
y

Isotope clusters allow charge state determination
m/z
Inte
nsity 1+
1
1
1
m/z
Inte
nsity 2+
0.5
0.5
0.5
m/z
Inte
nsity 3+
0.33
0.33
0.33
David Fenyö
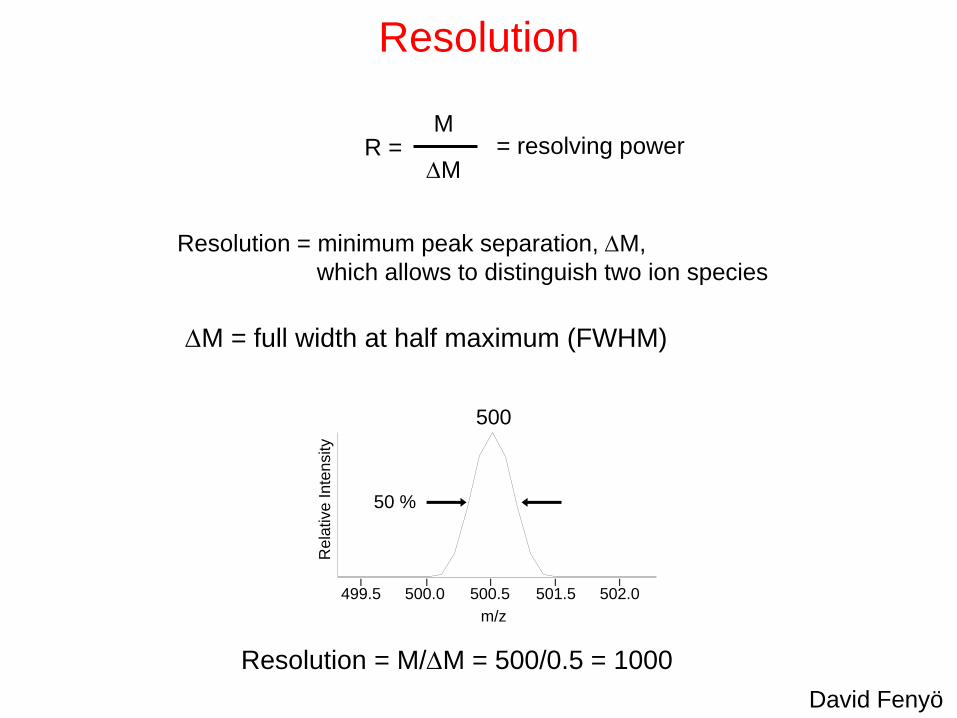
Resolution
Resolution = minimum peak separation, M,
which allows to distinguish two ion species
Rela
tive Inte
nsity
m/z
I I I I I
501.5 502.0 500.5 500.0 499.5
500
50 %
Resolution = M/M = 500/0.5 = 1000
M = full width at half maximum (FWHM)
R = M
M = resolving power
David Fenyö

Monoisotopic mass
Monoisotopic mass
corresponds tolowest mass peak
When the isotopes are clearly resolved the monoisotopic
mass is used as it is the most accurate measurement.
Spacing of adjacent isotope peaks (m/z, measured)
gives z as know m)

Average mass
Average mass
corresponds to the
centroid of the
unresolved peak cluster
When the isotopes are not resolved, the centroid of the
envelope corresponds to the weighted average of all the
isotope peaks in the cluster, which is the same as the
average or chemical mass.

Why we typically analyze peptides instead of
intact proteins
• Protein heterogeneity:
proteolytic processing
post translational modifications
• Stability in gas phase
• Natural isotope abundance
• Better resolution and accuracy at lower masses

Quantitative proteomics
• Label-free
• Stable isotope labeled (13C,15N, and/or 18O)
– Metabolic labeling
– Synthetic peptides and proteins
– Chemical modification

42
Quantification: Peptide concentrations are obtained by
multiplying the internal standard concentration by the
signal ratio of the analyte / internal standard
NH 2
COOH
Protein of Interest
QQQ
QQQ Detection: Selected Reaction Monitoring
provides the high sensitivity and amino acid selectivity
needed to detect peptides in complex mixtures
18 20 22 24 26 28 30 Time (min)
18 20 22 24 26 28 30 Time (min)
18 20 22 24 26 28 30 Time (min)
70
80
90
100
LC -
18 20 22 24 26 28 30 Time (min)
0
10
20
30
40
50
60
70
80
90
100 0
10
20
30
40
50
60
Rela
tive A
bundance
SRM
Analyte
Signal
= 200
Int. Std.
Signal
= 1000
NH 2
COOH
QconCAT Protein
Analyte
Peptide
AQTDIDSPQNLVTDR
IS
Peptide AQTDIDSPQNLVTDR*
Quantification of proteins by targeted
MS/MS using internal standards
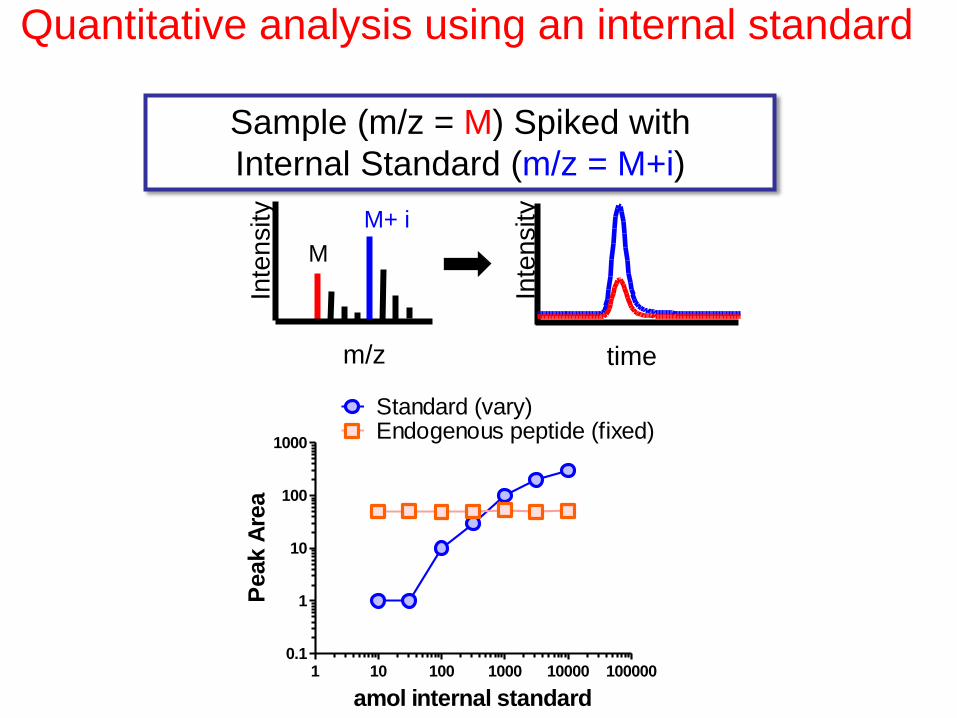
Quantitative analysis using an internal standard
Sample (m/z = M) Spiked with
Internal Standard (m/z = M+i)
Inte
nsity
M
M+ i
Inte
nsity
time m/z
amol internal standard
Peak A
rea
1 10 100 1000 10000 1000000.1
1
10
100
1000
Standard (vary)Endogenous peptide (fixed)

Quantitiatve Proteomics: isobaric labeling reagents
Mol. Cell. Proteomics 3, 1154-1169(2004)
Mol. Cell. Proteomics 3, 1154-1169(2004)

mass/charge (m/z)
% I
nte
ns
ity
MS1 : multiple precursor (peptide) ions
9. 0 208. 6 408. 2 607. 8 807. 4 1007. 0
Mass ( m/ z)
7. 9E+4
0
10
20
30
40
50
60
70
80
90
100
% Intensity
4 7 0 0 M S/M S Pre c u rs o r 9 5 2 .5 6 7 Sp e c # 1 [BP = 1 1 5 .1 , 7 8 5 4 4 ]
115. 1359
175. 1362
117. 1397
116. 1317
70. 0928
87. 1082 374. 2191 521. 2928218. 1851112. 1105432. 2634 778. 4455665. 3603120. 1099 579. 3332
707. 436071. 0950 145. 1292 346. 2271229. 1705 493. 2941417. 2315129. 1252 787. 426159. 0793
328. 2076228. 1710 590. 3156516. 2964130. 1267 905. 4017832. 4753753. 334630. 0611 414. 2555 690. 3844344. 2373253. 1553 630. 3959560. 3219477. 3035124. 1270 192. 1629
Man2b1 888 -TQFSGLR- 894
114
Expanded scale
Reporter ion
region
115
116
117

Parting message
Progress in science depends on
new techniques,
new discoveries, and
new ideas,
probably in that order
Sydney Brenner, 20 March 1980
Biology in the 1980’s, talk at the
Friedrich Miescher Institute, Basel, Switzerland