Created with MindGenius Business 2005® Mass Spectrometry Mass Spectrometry.
Upload
jaden-lodesCategory
view
220download
2
Mass SpectrometryFrequently Asked Questions
Dr Markus Wunderlin Seminar 07072004
Overview
Mass Spectrometry in a Nutshell - Facts and Basics
Mass Resolution and Mass Accuracy
Fragmentation ndash Dissozation ndash Adduct Formation
Impurities - Contamination - Artefacts
FTICR-MS The bdquoFerrari Ageldquo Of MS
Mass Spectrometry
A technique for measuring and analyzing molecules that involves introducing enough energy into a
(neutral) target molecule to cause its ionization and disintegration The resulting primary ions and their fragments are then analyzed based on their mass charge ratios to produce a molecular fingerprint
Facts and Basics
Difference Between Spectrometric Methods
Ionization implies a chemical process induced by physical methods The sample is consumed during
the measurement Their is no defined stimulation of molecular energy levels through interaction with electromagentic radiation where you can get the
sample back without modification
Facts and Basics
Structural Information by MS
MW determination nominal accurate (elemental composition)
Isotope patternHigh resolution
FragmentationFragmentation rulesLibraries (bdquofittingldquo)MSMS (or MSn)
Components Of A Mass Spectrometer
Ionisation Ion DetectionIon Separation
Ion Source Mass Analyser Detector
Electron Ionisation (EI)
Chemical Ionisation (CI)
Fast Atom Bombardment (FAB)
Electrospray Ionisation (ESI)
Matrix-Assisted LaserdesorptionIonisation (MALDI)
Quadrupole
Magnetic Sector Field
Electric Sector Field
Time-Of-Flight (TOF)
Ion Trap
Electron Multiplier
Multichannel plate
Faraday Cup
Sektion MS Mass Spectrometers
EI CI ESI APCI MALDI FAB MSMS Inlet Status
Bruker Reflex III + PSD
Finnigan SSQ7000 + + + GC SP DEP
Finnigan TSQ700 (+) (+) (+) + + GC SP DEP
Finnigan TSQ7000 + Nano-ESI
Sektion MS Info amp Data
Homepage bdquoSektion Massenspektrometrieldquo
httpwwwuni-ulmdeunifaknatwisoc2massenspektrometrieindexhtm
FTP-Server
for data collection (MALDI EI CI FAB) like the NMR-service
Server 134606396UsernameOC2PWMaldi
Sektion MS Info amp Data
MS Software
Software for MALDI data analysis
Bruker Data Analysis 16d
Software for EI CI and FAB data analysis
ACD Labs MS Processor
What type of analysis is needed
Ionization methods MALDI EI CI (FAB) (ESI)
ndash I will select the ionization method unlessbull you have previous success with a methodbull duplicating literature methods
- Analyses are low resolutionbull confirms presence of analytebull for high mass compounds (mw gt10000) I try to obtain the best
resolution possiblebull for high mass accuracy internal calibration (standard external
calibration)
What type of analysis is needed
Which MS method is best for the compound I want to analyze
Molecular weigthSolvent amp solubilityPurityReactivityWould it distill or sublime under HiVac One compound or mixtureAcidic BasicIonic
Ionization Methods
Neutral species Charged species
bull Removaladdition of electron(s)ndash M + e- (M+) + 2e-
bull electron ionization
bull Removaladdition of proton(s)ndash M + (Matrix)-H MH+ + (Matrix)-
bull chemical ionization (CI)bull atmospheric pressure CI (APCI)bull fast atom bombardment (FAB)bull electrospray ionization (ESI)bull matrix assisted laser desorptionionization (MALDI)
Matrix Assisted Laser Desorption
Matrix Assisted Laser Desorption
TOF ParametersSimple cheap (in theory) robust sensitiveA good modern TOF should give1048766 gt10k Resolving power1048766 ~1-10 fmol sensitivity (single scan)1048766 ~10 ppm mass accuracy internally calibrated (5 ppm if the peak is particularly large or clean)1048766 gt1000 scanssecond1048766Unlimited mass range
Matrices
Matrix
189-Trihydroxyanthracen(Dithranol) polymers
25-Dihydroxy benzoic acid(DHB)
proteins peptides polymers
-Cyano-4-hydroxycinnamic acid
peptides (polymers)
4-Hydroxypicolinic acid oligonucleotides
Trans-Indol-3-acrylacid(IAA)
polymers
OH OH OH
OH
OH
COOH
C CH
OH
CN COOH
N
OH
COOH
NH
COOH
Sample Preparation Dried Droplet
solved Matrix solved sample
Mixing and Drying
Sample Preparation Thin Layer
solved Matrix
solved sample
fastdrying
thin homogenuouslayer of crytslas
Drying
Guide to Sample Preparation
Reflector
Through ionisation there is an activation energy distribution (energy- position- and time uncertainty electronic repulsion energy shielding effects)
Electric field after the field free drift region that reverses the direction of travel of the ion (reflects)
Ions with same mz ratio but higher kinetic energy penetrate deeper into the reflector delaying their time of arrival at the reflector relative to the slower low-energy ions
Improved resolution increase in mass accuracy
Principle Of Reflector-TOF
acceleration region Field free drift region
sample target
1 2 1 22
1
1 21
2
reflector
m = mE lt E
12
12
mz
detector
Electrospray (ESI)
Mass Analyzer Quadrupole (Q)
Four parallel rods or poles through which the ions being separated are passedPoles have a fixed DC and alternating RF voltages applied to them
Depending on the produced electric field only ions of a particular mz will be focused on the detector all the other ions will be deflected into the rods
Scanning by varying the amplitude of the voltages (ACDC constant)
Resolution
Ability of a mass spectrometer to distinguish between ions of different mz ratios
R=mΔm Δm is the mass difference between two
adjacent peaks that are just resolved m is the mass of the first peak (or the
mean mass of two peaks) although this definition is for two
peaks it is acceptable to measure the resolution from a single peak (MALDI-TOF) In that case
Δm is the width of the peak at half maxima (FWHM) of the peak corresponding to m
Resolution
If we have 5000 resolution on a mass spectrometer we can separate mz 50000 from mz 50010 or
separate mz 100000 from mz 100020 or separate mz 1000000 from mz 1000200 (all down to a 10 valley between the two peaks)
Cyclo[12]thiophen
S
S
SS
S
S
S
SS
SS
S
1654 1656 1658 1660 1662 1664
16616
16606
16596
16586
16566
16576
1300 1400 1500 1600 1700 1800 1900 20000
500
1000
1500
2000
2500
3000
16576
Inte
nsity
mz
Mass Spectra of Cyclothiophen
Mass Spectra of Angiotensin
1040 1045 1050 1055
104620 (monoisotopic)
104756 (average)
Reflektor
DE
linear
mz
bdquoMassesldquo
Average MassThe sum of the average of the isotopic masses of the atoms in a molecule eg C = 1201115 H = 100797 O = 159994 Monoisotopic MassThe sum of the exact or accurate masses of the lightest stable isotope of the atoms in a molecule eg C = 12000000 H = 1007825 O = 15994915
Nominal Mass The integral sum of the nucleons in an atom (also called the atomic mass number) eg C = 12 H = 1 O = 16
Mass spectra of Angiotensin I
130413021300129812961294
100
90
80
70
60
50
40
30
20
10
Mass (mz)
average mass 129750248
I
130413021300129812961294
100
90
80
70
60
50
40
30
20
10
0
Mass (mz)
monoisotopic mass 129668518
12C62H90N17O14
12C6113C1H90N17O14
12C6013C2 H90N17O14
12C5913C3H90N17 O14
I
R = 1000 R = 5000
Simulated Spectra of Bovine Insulin
resolution 4000
574557405735573057255720
100
90
80
70
60
50
40
30
20
10
0
resolution 30000
574557405735573057255720
100
90
80
70
60
50
40
30
20
10
0
resolution 12000
574557405735573057255720
100
90
80
70
60
50
40
30
20
10
0
resolution 5000000
574557405735573057255720
100
90
80
70
60
50
40
30
20
10
0
Instrument Resolution and Mass Accuracy
(Theoretical MW -Measured MW)ppm = X 10 Theoretical MW
Instrument Mass Range
mz
Resolution(at mz 1000)
Accuracy (Error)(at mz 1000)
GCMS (Quadrupole)
To 2000 Low Resolution
Sector To 4000 50000-100000 00005 (5 ppm)
MALDITOF To 400000 15000 (Reflectron)
0006 (60 ppm) ext Cal
0003 (30 ppm) int Cal
FTICR To 4000 To 3000000 00001 (1 ppm)
Calibration
bullInstrument calibration performed well before sample analysis
ndash EICI GC-MSndash FABndash ESI
bull Performed immediately before sample analysisndash MALDI-TOF
Calibration
Compounds used for calibration includendash PEG PBM peptides proteins PFTBA CsI
External Calibration mz scale is calibrated with a mixture of molecules with different molecular weights after that the analyte is measured Internal Calibration Analyte and a mixture of molecules with different molecular weigths are mixed and measured together Then the spectrum is calibrated by assigning the right masses to the well known calibration standards (perfect mass of analyte is between the mass of two standards)
Fragmentation ndash Dissozation ndash Adduct Formation
Comparison of Ionization Methods
EI CI ESI MALDI FAB
Additional mass due to Positive Ionisation
No YesH Na K etc(+1 +23 +39 etc)
H Na K etc(+1 +23 +39 etc)
H Na K etc(+1 +23 +39 etc)
Loss of mass due to negative ionisation
- NoLoss of H(-1) Loss of H(-1)
Loss of H(-1)
Number of charges added 1 1
1-many (dependent upon mass)
1-2 1-2
Matrix peaks No No Yes Yes No
Singly- doubly- triply- etc charged ion Molecule or molecular moiety which has gained or lost respectively one two three or more electronsprotons
Fragmentation ndash Dissozation ndash Adduct Formation
Dimeric ionIon formed when a chemical species exists in the vapour as a dimer and can be detected as such or when a molecular ion can attach to a neutral molecule within the ion source eg [2M+H]+
Cytochrom C MALDI ESI
Adduct ions An ion formed by interaction of two species usually an ion and a molecule and often within an ion source to form an ion containing all the constituent atoms of one species as well as an additional atom
Fragmentation ndash Dissozation ndash Adduct Formation
640 660 680 700 mz
500
1000
1500
2000
2500
3000
3500
4000
ai
652
674
690
[M+Na]+
[M+H]+
[M+K]+
OH O
N
O
2
C40H46N2O6
Cluster ionAn ion formed by the combination of two or more atoms ions or molecules of a chemical species often in association with a second species
Fragmentation ndash Dissozation ndash Adduct Formation
1831
2752
3672
4592
X 10
5513
6433
82749194
[2M- H]-
[3M- H]-
[7M- H]-
Negative- ion FABof matrix glycerol
Fragment ion An electrically charged dissociation product of an ionic fragmentation Such an ion may fragmentate further to produce other electrically charged molecular or atomic moieties of successively lower formula weight
Fragmentation Break Of Covalent BondDissociation Break of Non-covalent complex
Fragmentation ndash Dissozation ndash Adduct Formation
bdquoHardldquoIonisation
bdquoSoftldquoIonisation
EI CI MALDIFAB ESI
Fragmentation ndash Dissozation ndash Adduct Formation
New SoftwareACDMS Fragmenter
predicting of possible schemes of mass spectral fragmentation for chemical structures
Selection fragmentation-rule parameters to mimic different ionization techniques that range from EI to low energy protonation techniques such as ESI or APCI
Recognition of fragments within an aquired mass spectra
Fragmentation ndash Dissozation ndash Adduct Formation
1000 1250 1500 1750 2000 2250 2500 2750 30000
20
40
60
80
100
CuL+
(Ac3T)2phen
sig
na
l in
ten
sity
mz
CuL2
+
1000 1250 1500 1750 2000 2250 2500 2750 30000
20
40
60
80
100CuL
2
+
CuL+
Sig
na
l In
ten
sity
mz
TMS-protected complex deprotected complex
N
SSS
BuBuBu
Bu
N
RN
NS S S
Bu Bu Bu Bu
R
S S S
Bu Bu BuBu
R
SSS
BuBuBu
Bu
R
Cu+
BF4-
R = TMS H
Fragmentation ndash Dissozation ndash Adduct Formation
600 700 800 mz
1000
2000
3000
4000
5000
6000
7000
8000
9000
10000
11000
ai
6546
8109
OO
N NNi
N N
Impurities - Contamination - Artefacts
Impurity eg antioxidantia in organic solvents side products not separated after synthesis additional components after insufficient isolation from biological material
ContaminationCompound which was putinto the sample subsequently eg through chromatographic column
ArtefactMS-specific bdquokey ionsldquo eg CI with CH4 as ionisation gasCH4 + e- CH4
+bull (formation of primary ion)CH4
+bull CH3+ + Hbull
CH3+ + CH4 C2H5
+ + H2 formation of adducts with mz +28
Impurities - Contamination - Artefacts
Contamination
SourceDetection
EI CI FAB MALDI ESI
Alkali salts Solvents glas etc - ++ ++++
Heavy metal salts
Sample vessels HPLC pumps
- ++ ++
Alkyl(benzol)sulfonate
Columns IE detergents
- ++ -+
Alkylammounium salts
Columns IE detergents
- ++ ++++
HC Grease + + ++
Polyphenylether
Grease pump oil + + ++
Longchain carbonic acids
Chromatographic columns
++ + (+)(+)
Siloxane Silicon grease DC plate plastic
++ + -(+)
General Sample Handling
Mass spectrometry is a sensitive technique (for impurities and contamination too)
Sample Storagendash Glass vials can leach salts (NaK) into samplendash Ideal storage vial is siliconized polypropylene tubes
Use Freshly prepared high purity reagents and water
Omit high concentrations of buffer salts ( NaCl KH2PO4) Detergents (Tween Triton SDS)Urea guanidine salts Cleaning of the sample dialysis RP-HPLC Zip-Tips ion
exchange
Use of removable buffer salts (zB NH4Ac)
Use of removable solvents like water acetonitrile methanol
General Sample Handling
Use Freshly prepared high purity reagents and water
Omit high concentrations of buffer salts ( NaCl KH2PO4) Detergents (Tween Triton SDS)Urea guanidine salts Cleaning of the sample dialysis RP-HPLC Zip-Tips ion
exchange
Use of removable buffer salts (zB NH4Ac)
Use of removable solvents like water acetonitrile methanol
Mass Spectra of Synthetic Polymers
Information monomer unit end group average masses
Mn = (NiMi) MiMw = (NiMi2) (NiMi)
polydispersity D = MwMn
ProblemsSynthetic polymers are polydisperse bad signal-noise-ratio bdquomass discriminationldquodetector saumlttigung at D gt 11Polymers without ionisationable functional groups metal ion add-onzB Polystyrol Ag+ PEG Na+ K+ etc
Mass Spectra of Synthetic PolymersMass Spectra of Synthetic Polymers
2 0 0 0 3 0 0 0 4 0 0 0 5 0 0 0 6 0 0 0 7 0 0 0 8 0 0 0 9 0 0 0 1 0 0 0 0 m z0
2 0 0 0
4 0 0 0
6 0 0 0
I n t e n s
CH -O-C-CH -CH-C-CH -CH-C-O-CH3 2 2 3
O OCH3 CH3O[ [n
Linear Mode
Reflektor Mode
CH-(CHO)-OH+Na324x+1067
11111155
1199
1023
979
935 1243
15 + 44x+17 +23
Mass Spectra of Synthetic Polymers
New aspects in mass spectrometry
Hybrid Mass Spectrometers
Perhaps hundreds of hybrids have been exploredSome of the more successfulTriple quadrupoleIT-TOFQ-TOFQuadrupole-FTMSTOFTOF
New aspects in mass spectrometry
FT-ICR-MS
FT-ICR-MS instrument general scheme
Fouriertransform-ICR New Dimensions of High Performance Mass Spectrometry
A high-frequency mass spectrometer in which the cyclotron motion of ions having different mz ratios in a constant magnetic field is excited essentially simultaneously and coherently by a pulse of a radio-frequency electric field applied perpendicularly to the magnetic field
The excited cyclotron motion of the ions is subsequently detected on receiver plates as a time domain signal that contains all the cyclotron frequencies excited
Fourier transformation of the time domain signal results in the frequency domain FT-ICR signal which on the basis of the inverse proportionality between frequency and mz ratio can be converted to a mass spectrum
The ions are to be detected with a selected mz ratio absorb maximum energy through the effect of a high-frequency field and a constant magnetic field perpendicular to it Maximum energy is gained by ions that satisfy the cyclotron resonance condition and as a result these are separated from ions of different masscharge
FTICR New Dimensions of High Performance Mass Spectrometry
High mass resolution gt 3 000 000
Accuracy of mass determination lt 01 ppm Sensitivity (ESI Octapeptide) ca 50 attomol
Structure-specific fragmentation MSMS MSn
FTICR New Dimensions of High Performance Mass Spectrometry
Ions are trapped and oscillate with low incoherent thermal amplitude
Excitation sweeps resonant ions into a large coherent cyclotron orbit
Preamplifier and digitizer pick up the induced potentials on the cell
FTICR New Dimensions of High Performance Mass Spectrometry
The frequency of the cyclotron gyration of an ion is inversely proportional to its mass-to-charge ratio (mq) and directly proportional to the strength of the applied magnetic field B
FTICR New Dimensions of High Performance Mass Spectrometry
FTICR New Dimensions of High Performance Mass Spectrometry
In the presence of a magnetic field sample ions orbit according to cyclotron frequency fcbull Cyclotron frequency related to charge of ion (z) magnetic field strength (B) and mass of ion (m)
All ions of same mz will have same cyclotron frequency at a fixed B and will move in a coherent ion packet
FTICR New Dimensions of High Performance Mass Spectrometry
Ion packets produce a detectable image current on the detector cell plates
As the ion(s) in a circular orbit approach the top plate electrons are attracted to this plate from ground Then as the ion(s) circulate towards the bottom plate the electrons travel back down to the bottom plate This motion of electrons moving back and forth between the two plates produces a detectable current
FTICR New Dimensions of High Performance Mass Spectrometry
Image is Fourier transformed to obtain the component frequencies and amplitudes (intensity) of the various ionsCyclotron frequency value is converted into a mz value to produce mass spectrum with the appropriate intensities
FTICR New Dimensions of High Performance Mass Spectrometry
The End

Sektion MS Info amp Data
Homepage bdquoSektion Massenspektrometrieldquo
httpwwwuni-ulmdeunifaknatwisoc2massenspektrometrieindexhtm
FTP-Server
for data collection (MALDI EI CI FAB) like the NMR-service
Server 134606396UsernameOC2PWMaldi
Sektion MS Info amp Data
MS Software
Software for MALDI data analysis
Bruker Data Analysis 16d
Software for EI CI and FAB data analysis
ACD Labs MS Processor
What type of analysis is needed
Ionization methods MALDI EI CI (FAB) (ESI)
ndash I will select the ionization method unlessbull you have previous success with a methodbull duplicating literature methods
- Analyses are low resolutionbull confirms presence of analytebull for high mass compounds (mw gt10000) I try to obtain the best
resolution possiblebull for high mass accuracy internal calibration (standard external
calibration)
What type of analysis is needed
Which MS method is best for the compound I want to analyze
Molecular weigthSolvent amp solubilityPurityReactivityWould it distill or sublime under HiVac One compound or mixtureAcidic BasicIonic
Ionization Methods
Neutral species Charged species
bull Removaladdition of electron(s)ndash M + e- (M+) + 2e-
bull electron ionization
bull Removaladdition of proton(s)ndash M + (Matrix)-H MH+ + (Matrix)-
bull chemical ionization (CI)bull atmospheric pressure CI (APCI)bull fast atom bombardment (FAB)bull electrospray ionization (ESI)bull matrix assisted laser desorptionionization (MALDI)
Matrix Assisted Laser Desorption
Matrix Assisted Laser Desorption
TOF ParametersSimple cheap (in theory) robust sensitiveA good modern TOF should give1048766 gt10k Resolving power1048766 ~1-10 fmol sensitivity (single scan)1048766 ~10 ppm mass accuracy internally calibrated (5 ppm if the peak is particularly large or clean)1048766 gt1000 scanssecond1048766Unlimited mass range
Matrices
Matrix
189-Trihydroxyanthracen(Dithranol) polymers
25-Dihydroxy benzoic acid(DHB)
proteins peptides polymers
-Cyano-4-hydroxycinnamic acid
peptides (polymers)
4-Hydroxypicolinic acid oligonucleotides
Trans-Indol-3-acrylacid(IAA)
polymers
OH OH OH
OH
OH
COOH
C CH
OH
CN COOH
N
OH
COOH
NH
COOH
Sample Preparation Dried Droplet
solved Matrix solved sample
Mixing and Drying
Sample Preparation Thin Layer
solved Matrix
solved sample
fastdrying
thin homogenuouslayer of crytslas
Drying
Guide to Sample Preparation
Reflector
Through ionisation there is an activation energy distribution (energy- position- and time uncertainty electronic repulsion energy shielding effects)
Electric field after the field free drift region that reverses the direction of travel of the ion (reflects)
Ions with same mz ratio but higher kinetic energy penetrate deeper into the reflector delaying their time of arrival at the reflector relative to the slower low-energy ions
Improved resolution increase in mass accuracy
Principle Of Reflector-TOF
acceleration region Field free drift region
sample target
1 2 1 22
1
1 21
2
reflector
m = mE lt E
12
12
mz
detector
Electrospray (ESI)
Mass Analyzer Quadrupole (Q)
Four parallel rods or poles through which the ions being separated are passedPoles have a fixed DC and alternating RF voltages applied to them
Depending on the produced electric field only ions of a particular mz will be focused on the detector all the other ions will be deflected into the rods
Scanning by varying the amplitude of the voltages (ACDC constant)
Resolution
Ability of a mass spectrometer to distinguish between ions of different mz ratios
R=mΔm Δm is the mass difference between two
adjacent peaks that are just resolved m is the mass of the first peak (or the
mean mass of two peaks) although this definition is for two
peaks it is acceptable to measure the resolution from a single peak (MALDI-TOF) In that case
Δm is the width of the peak at half maxima (FWHM) of the peak corresponding to m
Resolution
If we have 5000 resolution on a mass spectrometer we can separate mz 50000 from mz 50010 or
separate mz 100000 from mz 100020 or separate mz 1000000 from mz 1000200 (all down to a 10 valley between the two peaks)
Cyclo[12]thiophen
S
S
SS
S
S
S
SS
SS
S
1654 1656 1658 1660 1662 1664
16616
16606
16596
16586
16566
16576
1300 1400 1500 1600 1700 1800 1900 20000
500
1000
1500
2000
2500
3000
16576
Inte
nsity
mz
Mass Spectra of Cyclothiophen
Mass Spectra of Angiotensin
1040 1045 1050 1055
104620 (monoisotopic)
104756 (average)
Reflektor
DE
linear
mz
bdquoMassesldquo
Average MassThe sum of the average of the isotopic masses of the atoms in a molecule eg C = 1201115 H = 100797 O = 159994 Monoisotopic MassThe sum of the exact or accurate masses of the lightest stable isotope of the atoms in a molecule eg C = 12000000 H = 1007825 O = 15994915
Nominal Mass The integral sum of the nucleons in an atom (also called the atomic mass number) eg C = 12 H = 1 O = 16
Mass spectra of Angiotensin I
130413021300129812961294
100
90
80
70
60
50
40
30
20
10
Mass (mz)
average mass 129750248
I
130413021300129812961294
100
90
80
70
60
50
40
30
20
10
0
Mass (mz)
monoisotopic mass 129668518
12C62H90N17O14
12C6113C1H90N17O14
12C6013C2 H90N17O14
12C5913C3H90N17 O14
I
R = 1000 R = 5000
Simulated Spectra of Bovine Insulin
resolution 4000
574557405735573057255720
100
90
80
70
60
50
40
30
20
10
0
resolution 30000
574557405735573057255720
100
90
80
70
60
50
40
30
20
10
0
resolution 12000
574557405735573057255720
100
90
80
70
60
50
40
30
20
10
0
resolution 5000000
574557405735573057255720
100
90
80
70
60
50
40
30
20
10
0
Instrument Resolution and Mass Accuracy
(Theoretical MW -Measured MW)ppm = X 10 Theoretical MW
Instrument Mass Range
mz
Resolution(at mz 1000)
Accuracy (Error)(at mz 1000)
GCMS (Quadrupole)
To 2000 Low Resolution
Sector To 4000 50000-100000 00005 (5 ppm)
MALDITOF To 400000 15000 (Reflectron)
0006 (60 ppm) ext Cal
0003 (30 ppm) int Cal
FTICR To 4000 To 3000000 00001 (1 ppm)
Calibration
bullInstrument calibration performed well before sample analysis
ndash EICI GC-MSndash FABndash ESI
bull Performed immediately before sample analysisndash MALDI-TOF
Calibration
Compounds used for calibration includendash PEG PBM peptides proteins PFTBA CsI
External Calibration mz scale is calibrated with a mixture of molecules with different molecular weights after that the analyte is measured Internal Calibration Analyte and a mixture of molecules with different molecular weigths are mixed and measured together Then the spectrum is calibrated by assigning the right masses to the well known calibration standards (perfect mass of analyte is between the mass of two standards)
Fragmentation ndash Dissozation ndash Adduct Formation
Comparison of Ionization Methods
EI CI ESI MALDI FAB
Additional mass due to Positive Ionisation
No YesH Na K etc(+1 +23 +39 etc)
H Na K etc(+1 +23 +39 etc)
H Na K etc(+1 +23 +39 etc)
Loss of mass due to negative ionisation
- NoLoss of H(-1) Loss of H(-1)
Loss of H(-1)
Number of charges added 1 1
1-many (dependent upon mass)
1-2 1-2
Matrix peaks No No Yes Yes No
Singly- doubly- triply- etc charged ion Molecule or molecular moiety which has gained or lost respectively one two three or more electronsprotons
Fragmentation ndash Dissozation ndash Adduct Formation
Dimeric ionIon formed when a chemical species exists in the vapour as a dimer and can be detected as such or when a molecular ion can attach to a neutral molecule within the ion source eg [2M+H]+
Cytochrom C MALDI ESI
Adduct ions An ion formed by interaction of two species usually an ion and a molecule and often within an ion source to form an ion containing all the constituent atoms of one species as well as an additional atom
Fragmentation ndash Dissozation ndash Adduct Formation
640 660 680 700 mz
500
1000
1500
2000
2500
3000
3500
4000
ai
652
674
690
[M+Na]+
[M+H]+
[M+K]+
OH O
N
O
2
C40H46N2O6
Cluster ionAn ion formed by the combination of two or more atoms ions or molecules of a chemical species often in association with a second species
Fragmentation ndash Dissozation ndash Adduct Formation
1831
2752
3672
4592
X 10
5513
6433
82749194
[2M- H]-
[3M- H]-
[7M- H]-
Negative- ion FABof matrix glycerol
Fragment ion An electrically charged dissociation product of an ionic fragmentation Such an ion may fragmentate further to produce other electrically charged molecular or atomic moieties of successively lower formula weight
Fragmentation Break Of Covalent BondDissociation Break of Non-covalent complex
Fragmentation ndash Dissozation ndash Adduct Formation
bdquoHardldquoIonisation
bdquoSoftldquoIonisation
EI CI MALDIFAB ESI
Fragment ion An electrically charged dissociation product of an ionic fragmentation Such an ion may fragmentate further to produce other electrically charged molecular or atomic moieties of successively lower formula weight
Fragmentation Break Of Covalent BondDissociation Break of Non-covalent complex
Fragmentation ndash Dissozation ndash Adduct Formation
bdquoHardldquoIonisation
bdquoSoftldquoIonisation
EI CI MALDIFAB ESI
Fragmentation ndash Dissozation ndash Adduct Formation
New SoftwareACDMS Fragmenter
predicting of possible schemes of mass spectral fragmentation for chemical structures
Selection fragmentation-rule parameters to mimic different ionization techniques that range from EI to low energy protonation techniques such as ESI or APCI
Recognition of fragments within an aquired mass spectra
Fragmentation ndash Dissozation ndash Adduct Formation
1000 1250 1500 1750 2000 2250 2500 2750 30000
20
40
60
80
100
CuL+
(Ac3T)2phen
sig
na
l in
ten
sity
mz
CuL2
+
1000 1250 1500 1750 2000 2250 2500 2750 30000
20
40
60
80
100CuL
2
+
CuL+
Sig
na
l In
ten
sity
mz
TMS-protected complex deprotected complex
N
SSS
BuBuBu
Bu
N
RN
NS S S
Bu Bu Bu Bu
R
S S S
Bu Bu BuBu
R
SSS
BuBuBu
Bu
R
Cu+
BF4-
R = TMS H
Fragmentation ndash Dissozation ndash Adduct Formation
600 700 800 mz
1000
2000
3000
4000
5000
6000
7000
8000
9000
10000
11000
ai
6546
8109
OO
N NNi
N N
Impurities - Contamination - Artefacts
Impurity eg antioxidantia in organic solvents side products not separated after synthesis additional components after insufficient isolation from biological material
ContaminationCompound which was putinto the sample subsequently eg through chromatographic column
ArtefactMS-specific bdquokey ionsldquo eg CI with CH4 as ionisation gasCH4 + e- CH4
+bull (formation of primary ion)CH4
+bull CH3+ + Hbull
CH3+ + CH4 C2H5
+ + H2 formation of adducts with mz +28
Impurities - Contamination - Artefacts
Contamination
SourceDetection
EI CI FAB MALDI ESI
Alkali salts Solvents glas etc - ++ ++++
Heavy metal salts
Sample vessels HPLC pumps
- ++ ++
Alkyl(benzol)sulfonate
Columns IE detergents
- ++ -+
Alkylammounium salts
Columns IE detergents
- ++ ++++
HC Grease + + ++
Polyphenylether
Grease pump oil + + ++
Longchain carbonic acids
Chromatographic columns
++ + (+)(+)
Siloxane Silicon grease DC plate plastic
++ + -(+)
General Sample Handling
Mass spectrometry is a sensitive technique (for impurities and contamination too)
Sample Storagendash Glass vials can leach salts (NaK) into samplendash Ideal storage vial is siliconized polypropylene tubes
Use Freshly prepared high purity reagents and water
Omit high concentrations of buffer salts ( NaCl KH2PO4) Detergents (Tween Triton SDS)Urea guanidine salts Cleaning of the sample dialysis RP-HPLC Zip-Tips ion
exchange
Use of removable buffer salts (zB NH4Ac)
Use of removable solvents like water acetonitrile methanol
General Sample Handling
Use Freshly prepared high purity reagents and water
Omit high concentrations of buffer salts ( NaCl KH2PO4) Detergents (Tween Triton SDS)Urea guanidine salts Cleaning of the sample dialysis RP-HPLC Zip-Tips ion
exchange
Use of removable buffer salts (zB NH4Ac)
Use of removable solvents like water acetonitrile methanol
Mass Spectra of Synthetic Polymers
Information monomer unit end group average masses
Mn = (NiMi) MiMw = (NiMi2) (NiMi)
polydispersity D = MwMn
ProblemsSynthetic polymers are polydisperse bad signal-noise-ratio bdquomass discriminationldquodetector saumlttigung at D gt 11Polymers without ionisationable functional groups metal ion add-onzB Polystyrol Ag+ PEG Na+ K+ etc
Mass Spectra of Synthetic PolymersMass Spectra of Synthetic Polymers
2 0 0 0 3 0 0 0 4 0 0 0 5 0 0 0 6 0 0 0 7 0 0 0 8 0 0 0 9 0 0 0 1 0 0 0 0 m z0
2 0 0 0
4 0 0 0
6 0 0 0
I n t e n s
CH -O-C-CH -CH-C-CH -CH-C-O-CH3 2 2 3
O OCH3 CH3O[ [n
Linear Mode
Reflektor Mode
CH-(CHO)-OH+Na324x+1067
11111155
1199
1023
979
935 1243
15 + 44x+17 +23
Mass Spectra of Synthetic Polymers
New aspects in mass spectrometry
Hybrid Mass Spectrometers
Perhaps hundreds of hybrids have been exploredSome of the more successfulTriple quadrupoleIT-TOFQ-TOFQuadrupole-FTMSTOFTOF
New aspects in mass spectrometry
FT-ICR-MS
FT-ICR-MS instrument general scheme
Fouriertransform-ICR New Dimensions of High Performance Mass Spectrometry
A high-frequency mass spectrometer in which the cyclotron motion of ions having different mz ratios in a constant magnetic field is excited essentially simultaneously and coherently by a pulse of a radio-frequency electric field applied perpendicularly to the magnetic field
The excited cyclotron motion of the ions is subsequently detected on receiver plates as a time domain signal that contains all the cyclotron frequencies excited
Fourier transformation of the time domain signal results in the frequency domain FT-ICR signal which on the basis of the inverse proportionality between frequency and mz ratio can be converted to a mass spectrum
The ions are to be detected with a selected mz ratio absorb maximum energy through the effect of a high-frequency field and a constant magnetic field perpendicular to it Maximum energy is gained by ions that satisfy the cyclotron resonance condition and as a result these are separated from ions of different masscharge
FTICR New Dimensions of High Performance Mass Spectrometry
High mass resolution gt 3 000 000
Accuracy of mass determination lt 01 ppm Sensitivity (ESI Octapeptide) ca 50 attomol
Structure-specific fragmentation MSMS MSn
FTICR New Dimensions of High Performance Mass Spectrometry
Ions are trapped and oscillate with low incoherent thermal amplitude
Excitation sweeps resonant ions into a large coherent cyclotron orbit
Preamplifier and digitizer pick up the induced potentials on the cell
FTICR New Dimensions of High Performance Mass Spectrometry
The frequency of the cyclotron gyration of an ion is inversely proportional to its mass-to-charge ratio (mq) and directly proportional to the strength of the applied magnetic field B
FTICR New Dimensions of High Performance Mass Spectrometry
FTICR New Dimensions of High Performance Mass Spectrometry
In the presence of a magnetic field sample ions orbit according to cyclotron frequency fcbull Cyclotron frequency related to charge of ion (z) magnetic field strength (B) and mass of ion (m)
All ions of same mz will have same cyclotron frequency at a fixed B and will move in a coherent ion packet
FTICR New Dimensions of High Performance Mass Spectrometry
Ion packets produce a detectable image current on the detector cell plates
As the ion(s) in a circular orbit approach the top plate electrons are attracted to this plate from ground Then as the ion(s) circulate towards the bottom plate the electrons travel back down to the bottom plate This motion of electrons moving back and forth between the two plates produces a detectable current
FTICR New Dimensions of High Performance Mass Spectrometry
Image is Fourier transformed to obtain the component frequencies and amplitudes (intensity) of the various ionsCyclotron frequency value is converted into a mz value to produce mass spectrum with the appropriate intensities
FTICR New Dimensions of High Performance Mass Spectrometry
The End

What type of analysis is needed
Which MS method is best for the compound I want to analyze
Molecular weigthSolvent amp solubilityPurityReactivityWould it distill or sublime under HiVac One compound or mixtureAcidic BasicIonic
Ionization Methods
Neutral species Charged species
bull Removaladdition of electron(s)ndash M + e- (M+) + 2e-
bull electron ionization
bull Removaladdition of proton(s)ndash M + (Matrix)-H MH+ + (Matrix)-
bull chemical ionization (CI)bull atmospheric pressure CI (APCI)bull fast atom bombardment (FAB)bull electrospray ionization (ESI)bull matrix assisted laser desorptionionization (MALDI)
Matrix Assisted Laser Desorption
Matrix Assisted Laser Desorption
TOF ParametersSimple cheap (in theory) robust sensitiveA good modern TOF should give1048766 gt10k Resolving power1048766 ~1-10 fmol sensitivity (single scan)1048766 ~10 ppm mass accuracy internally calibrated (5 ppm if the peak is particularly large or clean)1048766 gt1000 scanssecond1048766Unlimited mass range
Matrices
Matrix
189-Trihydroxyanthracen(Dithranol) polymers
25-Dihydroxy benzoic acid(DHB)
proteins peptides polymers
-Cyano-4-hydroxycinnamic acid
peptides (polymers)
4-Hydroxypicolinic acid oligonucleotides
Trans-Indol-3-acrylacid(IAA)
polymers
OH OH OH
OH
OH
COOH
C CH
OH
CN COOH
N
OH
COOH
NH
COOH
Sample Preparation Dried Droplet
solved Matrix solved sample
Mixing and Drying
Sample Preparation Thin Layer
solved Matrix
solved sample
fastdrying
thin homogenuouslayer of crytslas
Drying
Guide to Sample Preparation
Reflector
Through ionisation there is an activation energy distribution (energy- position- and time uncertainty electronic repulsion energy shielding effects)
Electric field after the field free drift region that reverses the direction of travel of the ion (reflects)
Ions with same mz ratio but higher kinetic energy penetrate deeper into the reflector delaying their time of arrival at the reflector relative to the slower low-energy ions
Improved resolution increase in mass accuracy
Principle Of Reflector-TOF
acceleration region Field free drift region
sample target
1 2 1 22
1
1 21
2
reflector
m = mE lt E
12
12
mz
detector
Electrospray (ESI)
Mass Analyzer Quadrupole (Q)
Four parallel rods or poles through which the ions being separated are passedPoles have a fixed DC and alternating RF voltages applied to them
Depending on the produced electric field only ions of a particular mz will be focused on the detector all the other ions will be deflected into the rods
Scanning by varying the amplitude of the voltages (ACDC constant)
Resolution
Ability of a mass spectrometer to distinguish between ions of different mz ratios
R=mΔm Δm is the mass difference between two
adjacent peaks that are just resolved m is the mass of the first peak (or the
mean mass of two peaks) although this definition is for two
peaks it is acceptable to measure the resolution from a single peak (MALDI-TOF) In that case
Δm is the width of the peak at half maxima (FWHM) of the peak corresponding to m
Resolution
If we have 5000 resolution on a mass spectrometer we can separate mz 50000 from mz 50010 or
separate mz 100000 from mz 100020 or separate mz 1000000 from mz 1000200 (all down to a 10 valley between the two peaks)
Cyclo[12]thiophen
S
S
SS
S
S
S
SS
SS
S
1654 1656 1658 1660 1662 1664
16616
16606
16596
16586
16566
16576
1300 1400 1500 1600 1700 1800 1900 20000
500
1000
1500
2000
2500
3000
16576
Inte
nsity
mz
Mass Spectra of Cyclothiophen
Mass Spectra of Angiotensin
1040 1045 1050 1055
104620 (monoisotopic)
104756 (average)
Reflektor
DE
linear
mz
bdquoMassesldquo
Average MassThe sum of the average of the isotopic masses of the atoms in a molecule eg C = 1201115 H = 100797 O = 159994 Monoisotopic MassThe sum of the exact or accurate masses of the lightest stable isotope of the atoms in a molecule eg C = 12000000 H = 1007825 O = 15994915
Nominal Mass The integral sum of the nucleons in an atom (also called the atomic mass number) eg C = 12 H = 1 O = 16
Mass spectra of Angiotensin I
130413021300129812961294
100
90
80
70
60
50
40
30
20
10
Mass (mz)
average mass 129750248
I
130413021300129812961294
100
90
80
70
60
50
40
30
20
10
0
Mass (mz)
monoisotopic mass 129668518
12C62H90N17O14
12C6113C1H90N17O14
12C6013C2 H90N17O14
12C5913C3H90N17 O14
I
R = 1000 R = 5000
Simulated Spectra of Bovine Insulin
resolution 4000
574557405735573057255720
100
90
80
70
60
50
40
30
20
10
0
resolution 30000
574557405735573057255720
100
90
80
70
60
50
40
30
20
10
0
resolution 12000
574557405735573057255720
100
90
80
70
60
50
40
30
20
10
0
resolution 5000000
574557405735573057255720
100
90
80
70
60
50
40
30
20
10
0
Instrument Resolution and Mass Accuracy
(Theoretical MW -Measured MW)ppm = X 10 Theoretical MW
Instrument Mass Range
mz
Resolution(at mz 1000)
Accuracy (Error)(at mz 1000)
GCMS (Quadrupole)
To 2000 Low Resolution
Sector To 4000 50000-100000 00005 (5 ppm)
MALDITOF To 400000 15000 (Reflectron)
0006 (60 ppm) ext Cal
0003 (30 ppm) int Cal
FTICR To 4000 To 3000000 00001 (1 ppm)
Calibration
bullInstrument calibration performed well before sample analysis
ndash EICI GC-MSndash FABndash ESI
bull Performed immediately before sample analysisndash MALDI-TOF
Calibration
Compounds used for calibration includendash PEG PBM peptides proteins PFTBA CsI
External Calibration mz scale is calibrated with a mixture of molecules with different molecular weights after that the analyte is measured Internal Calibration Analyte and a mixture of molecules with different molecular weigths are mixed and measured together Then the spectrum is calibrated by assigning the right masses to the well known calibration standards (perfect mass of analyte is between the mass of two standards)
Fragmentation ndash Dissozation ndash Adduct Formation
Comparison of Ionization Methods
EI CI ESI MALDI FAB
Additional mass due to Positive Ionisation
No YesH Na K etc(+1 +23 +39 etc)
H Na K etc(+1 +23 +39 etc)
H Na K etc(+1 +23 +39 etc)
Loss of mass due to negative ionisation
- NoLoss of H(-1) Loss of H(-1)
Loss of H(-1)
Number of charges added 1 1
1-many (dependent upon mass)
1-2 1-2
Matrix peaks No No Yes Yes No
Singly- doubly- triply- etc charged ion Molecule or molecular moiety which has gained or lost respectively one two three or more electronsprotons
Fragmentation ndash Dissozation ndash Adduct Formation
Dimeric ionIon formed when a chemical species exists in the vapour as a dimer and can be detected as such or when a molecular ion can attach to a neutral molecule within the ion source eg [2M+H]+
Cytochrom C MALDI ESI
Adduct ions An ion formed by interaction of two species usually an ion and a molecule and often within an ion source to form an ion containing all the constituent atoms of one species as well as an additional atom
Fragmentation ndash Dissozation ndash Adduct Formation
640 660 680 700 mz
500
1000
1500
2000
2500
3000
3500
4000
ai
652
674
690
[M+Na]+
[M+H]+
[M+K]+
OH O
N
O
2
C40H46N2O6
Cluster ionAn ion formed by the combination of two or more atoms ions or molecules of a chemical species often in association with a second species
Fragmentation ndash Dissozation ndash Adduct Formation
1831
2752
3672
4592
X 10
5513
6433
82749194
[2M- H]-
[3M- H]-
[7M- H]-
Negative- ion FABof matrix glycerol
Fragment ion An electrically charged dissociation product of an ionic fragmentation Such an ion may fragmentate further to produce other electrically charged molecular or atomic moieties of successively lower formula weight
Fragmentation Break Of Covalent BondDissociation Break of Non-covalent complex
Fragmentation ndash Dissozation ndash Adduct Formation
bdquoHardldquoIonisation
bdquoSoftldquoIonisation
EI CI MALDIFAB ESI
Fragment ion An electrically charged dissociation product of an ionic fragmentation Such an ion may fragmentate further to produce other electrically charged molecular or atomic moieties of successively lower formula weight
Fragmentation Break Of Covalent BondDissociation Break of Non-covalent complex
Fragmentation ndash Dissozation ndash Adduct Formation
bdquoHardldquoIonisation
bdquoSoftldquoIonisation
EI CI MALDIFAB ESI
Fragmentation ndash Dissozation ndash Adduct Formation
New SoftwareACDMS Fragmenter
predicting of possible schemes of mass spectral fragmentation for chemical structures
Selection fragmentation-rule parameters to mimic different ionization techniques that range from EI to low energy protonation techniques such as ESI or APCI
Recognition of fragments within an aquired mass spectra
Fragmentation ndash Dissozation ndash Adduct Formation
1000 1250 1500 1750 2000 2250 2500 2750 30000
20
40
60
80
100
CuL+
(Ac3T)2phen
sig
na
l in
ten
sity
mz
CuL2
+
1000 1250 1500 1750 2000 2250 2500 2750 30000
20
40
60
80
100CuL
2
+
CuL+
Sig
na
l In
ten
sity
mz
TMS-protected complex deprotected complex
N
SSS
BuBuBu
Bu
N
RN
NS S S
Bu Bu Bu Bu
R
S S S
Bu Bu BuBu
R
SSS
BuBuBu
Bu
R
Cu+
BF4-
R = TMS H
Fragmentation ndash Dissozation ndash Adduct Formation
600 700 800 mz
1000
2000
3000
4000
5000
6000
7000
8000
9000
10000
11000
ai
6546
8109
OO
N NNi
N N
Impurities - Contamination - Artefacts
Impurity eg antioxidantia in organic solvents side products not separated after synthesis additional components after insufficient isolation from biological material
ContaminationCompound which was putinto the sample subsequently eg through chromatographic column
ArtefactMS-specific bdquokey ionsldquo eg CI with CH4 as ionisation gasCH4 + e- CH4
+bull (formation of primary ion)CH4
+bull CH3+ + Hbull
CH3+ + CH4 C2H5
+ + H2 formation of adducts with mz +28
Impurities - Contamination - Artefacts
Contamination
SourceDetection
EI CI FAB MALDI ESI
Alkali salts Solvents glas etc - ++ ++++
Heavy metal salts
Sample vessels HPLC pumps
- ++ ++
Alkyl(benzol)sulfonate
Columns IE detergents
- ++ -+
Alkylammounium salts
Columns IE detergents
- ++ ++++
HC Grease + + ++
Polyphenylether
Grease pump oil + + ++
Longchain carbonic acids
Chromatographic columns
++ + (+)(+)
Siloxane Silicon grease DC plate plastic
++ + -(+)
General Sample Handling
Mass spectrometry is a sensitive technique (for impurities and contamination too)
Sample Storagendash Glass vials can leach salts (NaK) into samplendash Ideal storage vial is siliconized polypropylene tubes
Use Freshly prepared high purity reagents and water
Omit high concentrations of buffer salts ( NaCl KH2PO4) Detergents (Tween Triton SDS)Urea guanidine salts Cleaning of the sample dialysis RP-HPLC Zip-Tips ion
exchange
Use of removable buffer salts (zB NH4Ac)
Use of removable solvents like water acetonitrile methanol
General Sample Handling
Use Freshly prepared high purity reagents and water
Omit high concentrations of buffer salts ( NaCl KH2PO4) Detergents (Tween Triton SDS)Urea guanidine salts Cleaning of the sample dialysis RP-HPLC Zip-Tips ion
exchange
Use of removable buffer salts (zB NH4Ac)
Use of removable solvents like water acetonitrile methanol
Mass Spectra of Synthetic Polymers
Information monomer unit end group average masses
Mn = (NiMi) MiMw = (NiMi2) (NiMi)
polydispersity D = MwMn
ProblemsSynthetic polymers are polydisperse bad signal-noise-ratio bdquomass discriminationldquodetector saumlttigung at D gt 11Polymers without ionisationable functional groups metal ion add-onzB Polystyrol Ag+ PEG Na+ K+ etc
Mass Spectra of Synthetic PolymersMass Spectra of Synthetic Polymers
2 0 0 0 3 0 0 0 4 0 0 0 5 0 0 0 6 0 0 0 7 0 0 0 8 0 0 0 9 0 0 0 1 0 0 0 0 m z0
2 0 0 0
4 0 0 0
6 0 0 0
I n t e n s
CH -O-C-CH -CH-C-CH -CH-C-O-CH3 2 2 3
O OCH3 CH3O[ [n
Linear Mode
Reflektor Mode
CH-(CHO)-OH+Na324x+1067
11111155
1199
1023
979
935 1243
15 + 44x+17 +23
Mass Spectra of Synthetic Polymers
New aspects in mass spectrometry
Hybrid Mass Spectrometers
Perhaps hundreds of hybrids have been exploredSome of the more successfulTriple quadrupoleIT-TOFQ-TOFQuadrupole-FTMSTOFTOF
New aspects in mass spectrometry
FT-ICR-MS
FT-ICR-MS instrument general scheme
Fouriertransform-ICR New Dimensions of High Performance Mass Spectrometry
A high-frequency mass spectrometer in which the cyclotron motion of ions having different mz ratios in a constant magnetic field is excited essentially simultaneously and coherently by a pulse of a radio-frequency electric field applied perpendicularly to the magnetic field
The excited cyclotron motion of the ions is subsequently detected on receiver plates as a time domain signal that contains all the cyclotron frequencies excited
Fourier transformation of the time domain signal results in the frequency domain FT-ICR signal which on the basis of the inverse proportionality between frequency and mz ratio can be converted to a mass spectrum
The ions are to be detected with a selected mz ratio absorb maximum energy through the effect of a high-frequency field and a constant magnetic field perpendicular to it Maximum energy is gained by ions that satisfy the cyclotron resonance condition and as a result these are separated from ions of different masscharge
FTICR New Dimensions of High Performance Mass Spectrometry
High mass resolution gt 3 000 000
Accuracy of mass determination lt 01 ppm Sensitivity (ESI Octapeptide) ca 50 attomol
Structure-specific fragmentation MSMS MSn
FTICR New Dimensions of High Performance Mass Spectrometry
Ions are trapped and oscillate with low incoherent thermal amplitude
Excitation sweeps resonant ions into a large coherent cyclotron orbit
Preamplifier and digitizer pick up the induced potentials on the cell
FTICR New Dimensions of High Performance Mass Spectrometry
The frequency of the cyclotron gyration of an ion is inversely proportional to its mass-to-charge ratio (mq) and directly proportional to the strength of the applied magnetic field B
FTICR New Dimensions of High Performance Mass Spectrometry
FTICR New Dimensions of High Performance Mass Spectrometry
In the presence of a magnetic field sample ions orbit according to cyclotron frequency fcbull Cyclotron frequency related to charge of ion (z) magnetic field strength (B) and mass of ion (m)
All ions of same mz will have same cyclotron frequency at a fixed B and will move in a coherent ion packet
FTICR New Dimensions of High Performance Mass Spectrometry
Ion packets produce a detectable image current on the detector cell plates
As the ion(s) in a circular orbit approach the top plate electrons are attracted to this plate from ground Then as the ion(s) circulate towards the bottom plate the electrons travel back down to the bottom plate This motion of electrons moving back and forth between the two plates produces a detectable current
FTICR New Dimensions of High Performance Mass Spectrometry
Image is Fourier transformed to obtain the component frequencies and amplitudes (intensity) of the various ionsCyclotron frequency value is converted into a mz value to produce mass spectrum with the appropriate intensities
FTICR New Dimensions of High Performance Mass Spectrometry
The End

Matrix Assisted Laser Desorption
Matrix Assisted Laser Desorption
TOF ParametersSimple cheap (in theory) robust sensitiveA good modern TOF should give1048766 gt10k Resolving power1048766 ~1-10 fmol sensitivity (single scan)1048766 ~10 ppm mass accuracy internally calibrated (5 ppm if the peak is particularly large or clean)1048766 gt1000 scanssecond1048766Unlimited mass range
Matrices
Matrix
189-Trihydroxyanthracen(Dithranol) polymers
25-Dihydroxy benzoic acid(DHB)
proteins peptides polymers
-Cyano-4-hydroxycinnamic acid
peptides (polymers)
4-Hydroxypicolinic acid oligonucleotides
Trans-Indol-3-acrylacid(IAA)
polymers
OH OH OH
OH
OH
COOH
C CH
OH
CN COOH
N
OH
COOH
NH
COOH
Sample Preparation Dried Droplet
solved Matrix solved sample
Mixing and Drying
Sample Preparation Thin Layer
solved Matrix
solved sample
fastdrying
thin homogenuouslayer of crytslas
Drying
Guide to Sample Preparation
Reflector
Through ionisation there is an activation energy distribution (energy- position- and time uncertainty electronic repulsion energy shielding effects)
Electric field after the field free drift region that reverses the direction of travel of the ion (reflects)
Ions with same mz ratio but higher kinetic energy penetrate deeper into the reflector delaying their time of arrival at the reflector relative to the slower low-energy ions
Improved resolution increase in mass accuracy
Principle Of Reflector-TOF
acceleration region Field free drift region
sample target
1 2 1 22
1
1 21
2
reflector
m = mE lt E
12
12
mz
detector
Electrospray (ESI)
Mass Analyzer Quadrupole (Q)
Four parallel rods or poles through which the ions being separated are passedPoles have a fixed DC and alternating RF voltages applied to them
Depending on the produced electric field only ions of a particular mz will be focused on the detector all the other ions will be deflected into the rods
Scanning by varying the amplitude of the voltages (ACDC constant)
Resolution
Ability of a mass spectrometer to distinguish between ions of different mz ratios
R=mΔm Δm is the mass difference between two
adjacent peaks that are just resolved m is the mass of the first peak (or the
mean mass of two peaks) although this definition is for two
peaks it is acceptable to measure the resolution from a single peak (MALDI-TOF) In that case
Δm is the width of the peak at half maxima (FWHM) of the peak corresponding to m
Resolution
If we have 5000 resolution on a mass spectrometer we can separate mz 50000 from mz 50010 or
separate mz 100000 from mz 100020 or separate mz 1000000 from mz 1000200 (all down to a 10 valley between the two peaks)
Cyclo[12]thiophen
S
S
SS
S
S
S
SS
SS
S
1654 1656 1658 1660 1662 1664
16616
16606
16596
16586
16566
16576
1300 1400 1500 1600 1700 1800 1900 20000
500
1000
1500
2000
2500
3000
16576
Inte
nsity
mz
Mass Spectra of Cyclothiophen
Mass Spectra of Angiotensin
1040 1045 1050 1055
104620 (monoisotopic)
104756 (average)
Reflektor
DE
linear
mz
bdquoMassesldquo
Average MassThe sum of the average of the isotopic masses of the atoms in a molecule eg C = 1201115 H = 100797 O = 159994 Monoisotopic MassThe sum of the exact or accurate masses of the lightest stable isotope of the atoms in a molecule eg C = 12000000 H = 1007825 O = 15994915
Nominal Mass The integral sum of the nucleons in an atom (also called the atomic mass number) eg C = 12 H = 1 O = 16
Mass spectra of Angiotensin I
130413021300129812961294
100
90
80
70
60
50
40
30
20
10
Mass (mz)
average mass 129750248
I
130413021300129812961294
100
90
80
70
60
50
40
30
20
10
0
Mass (mz)
monoisotopic mass 129668518
12C62H90N17O14
12C6113C1H90N17O14
12C6013C2 H90N17O14
12C5913C3H90N17 O14
I
R = 1000 R = 5000
Simulated Spectra of Bovine Insulin
resolution 4000
574557405735573057255720
100
90
80
70
60
50
40
30
20
10
0
resolution 30000
574557405735573057255720
100
90
80
70
60
50
40
30
20
10
0
resolution 12000
574557405735573057255720
100
90
80
70
60
50
40
30
20
10
0
resolution 5000000
574557405735573057255720
100
90
80
70
60
50
40
30
20
10
0
Instrument Resolution and Mass Accuracy
(Theoretical MW -Measured MW)ppm = X 10 Theoretical MW
Instrument Mass Range
mz
Resolution(at mz 1000)
Accuracy (Error)(at mz 1000)
GCMS (Quadrupole)
To 2000 Low Resolution
Sector To 4000 50000-100000 00005 (5 ppm)
MALDITOF To 400000 15000 (Reflectron)
0006 (60 ppm) ext Cal
0003 (30 ppm) int Cal
FTICR To 4000 To 3000000 00001 (1 ppm)
Calibration
bullInstrument calibration performed well before sample analysis
ndash EICI GC-MSndash FABndash ESI
bull Performed immediately before sample analysisndash MALDI-TOF
Calibration
Compounds used for calibration includendash PEG PBM peptides proteins PFTBA CsI
External Calibration mz scale is calibrated with a mixture of molecules with different molecular weights after that the analyte is measured Internal Calibration Analyte and a mixture of molecules with different molecular weigths are mixed and measured together Then the spectrum is calibrated by assigning the right masses to the well known calibration standards (perfect mass of analyte is between the mass of two standards)
Fragmentation ndash Dissozation ndash Adduct Formation
Comparison of Ionization Methods
EI CI ESI MALDI FAB
Additional mass due to Positive Ionisation
No YesH Na K etc(+1 +23 +39 etc)
H Na K etc(+1 +23 +39 etc)
H Na K etc(+1 +23 +39 etc)
Loss of mass due to negative ionisation
- NoLoss of H(-1) Loss of H(-1)
Loss of H(-1)
Number of charges added 1 1
1-many (dependent upon mass)
1-2 1-2
Matrix peaks No No Yes Yes No
Singly- doubly- triply- etc charged ion Molecule or molecular moiety which has gained or lost respectively one two three or more electronsprotons
Fragmentation ndash Dissozation ndash Adduct Formation
Dimeric ionIon formed when a chemical species exists in the vapour as a dimer and can be detected as such or when a molecular ion can attach to a neutral molecule within the ion source eg [2M+H]+
Cytochrom C MALDI ESI
Adduct ions An ion formed by interaction of two species usually an ion and a molecule and often within an ion source to form an ion containing all the constituent atoms of one species as well as an additional atom
Fragmentation ndash Dissozation ndash Adduct Formation
640 660 680 700 mz
500
1000
1500
2000
2500
3000
3500
4000
ai
652
674
690
[M+Na]+
[M+H]+
[M+K]+
OH O
N
O
2
C40H46N2O6
Cluster ionAn ion formed by the combination of two or more atoms ions or molecules of a chemical species often in association with a second species
Fragmentation ndash Dissozation ndash Adduct Formation
1831
2752
3672
4592
X 10
5513
6433
82749194
[2M- H]-
[3M- H]-
[7M- H]-
Negative- ion FABof matrix glycerol
Fragment ion An electrically charged dissociation product of an ionic fragmentation Such an ion may fragmentate further to produce other electrically charged molecular or atomic moieties of successively lower formula weight
Fragmentation Break Of Covalent BondDissociation Break of Non-covalent complex
Fragmentation ndash Dissozation ndash Adduct Formation
bdquoHardldquoIonisation
bdquoSoftldquoIonisation
EI CI MALDIFAB ESI
Fragment ion An electrically charged dissociation product of an ionic fragmentation Such an ion may fragmentate further to produce other electrically charged molecular or atomic moieties of successively lower formula weight
Fragmentation Break Of Covalent BondDissociation Break of Non-covalent complex
Fragmentation ndash Dissozation ndash Adduct Formation
bdquoHardldquoIonisation
bdquoSoftldquoIonisation
EI CI MALDIFAB ESI
Fragmentation ndash Dissozation ndash Adduct Formation
New SoftwareACDMS Fragmenter
predicting of possible schemes of mass spectral fragmentation for chemical structures
Selection fragmentation-rule parameters to mimic different ionization techniques that range from EI to low energy protonation techniques such as ESI or APCI
Recognition of fragments within an aquired mass spectra
Fragmentation ndash Dissozation ndash Adduct Formation
1000 1250 1500 1750 2000 2250 2500 2750 30000
20
40
60
80
100
CuL+
(Ac3T)2phen
sig
na
l in
ten
sity
mz
CuL2
+
1000 1250 1500 1750 2000 2250 2500 2750 30000
20
40
60
80
100CuL
2
+
CuL+
Sig
na
l In
ten
sity
mz
TMS-protected complex deprotected complex
N
SSS
BuBuBu
Bu
N
RN
NS S S
Bu Bu Bu Bu
R
S S S
Bu Bu BuBu
R
SSS
BuBuBu
Bu
R
Cu+
BF4-
R = TMS H
Fragmentation ndash Dissozation ndash Adduct Formation
600 700 800 mz
1000
2000
3000
4000
5000
6000
7000
8000
9000
10000
11000
ai
6546
8109
OO
N NNi
N N
Impurities - Contamination - Artefacts
Impurity eg antioxidantia in organic solvents side products not separated after synthesis additional components after insufficient isolation from biological material
ContaminationCompound which was putinto the sample subsequently eg through chromatographic column
ArtefactMS-specific bdquokey ionsldquo eg CI with CH4 as ionisation gasCH4 + e- CH4
+bull (formation of primary ion)CH4
+bull CH3+ + Hbull
CH3+ + CH4 C2H5
+ + H2 formation of adducts with mz +28
Impurities - Contamination - Artefacts
Contamination
SourceDetection
EI CI FAB MALDI ESI
Alkali salts Solvents glas etc - ++ ++++
Heavy metal salts
Sample vessels HPLC pumps
- ++ ++
Alkyl(benzol)sulfonate
Columns IE detergents
- ++ -+
Alkylammounium salts
Columns IE detergents
- ++ ++++
HC Grease + + ++
Polyphenylether
Grease pump oil + + ++
Longchain carbonic acids
Chromatographic columns
++ + (+)(+)
Siloxane Silicon grease DC plate plastic
++ + -(+)
General Sample Handling
Mass spectrometry is a sensitive technique (for impurities and contamination too)
Sample Storagendash Glass vials can leach salts (NaK) into samplendash Ideal storage vial is siliconized polypropylene tubes
Use Freshly prepared high purity reagents and water
Omit high concentrations of buffer salts ( NaCl KH2PO4) Detergents (Tween Triton SDS)Urea guanidine salts Cleaning of the sample dialysis RP-HPLC Zip-Tips ion
exchange
Use of removable buffer salts (zB NH4Ac)
Use of removable solvents like water acetonitrile methanol
General Sample Handling
Use Freshly prepared high purity reagents and water
Omit high concentrations of buffer salts ( NaCl KH2PO4) Detergents (Tween Triton SDS)Urea guanidine salts Cleaning of the sample dialysis RP-HPLC Zip-Tips ion
exchange
Use of removable buffer salts (zB NH4Ac)
Use of removable solvents like water acetonitrile methanol
Mass Spectra of Synthetic Polymers
Information monomer unit end group average masses
Mn = (NiMi) MiMw = (NiMi2) (NiMi)
polydispersity D = MwMn
ProblemsSynthetic polymers are polydisperse bad signal-noise-ratio bdquomass discriminationldquodetector saumlttigung at D gt 11Polymers without ionisationable functional groups metal ion add-onzB Polystyrol Ag+ PEG Na+ K+ etc
Mass Spectra of Synthetic PolymersMass Spectra of Synthetic Polymers
2 0 0 0 3 0 0 0 4 0 0 0 5 0 0 0 6 0 0 0 7 0 0 0 8 0 0 0 9 0 0 0 1 0 0 0 0 m z0
2 0 0 0
4 0 0 0
6 0 0 0
I n t e n s
CH -O-C-CH -CH-C-CH -CH-C-O-CH3 2 2 3
O OCH3 CH3O[ [n
Linear Mode
Reflektor Mode
CH-(CHO)-OH+Na324x+1067
11111155
1199
1023
979
935 1243
15 + 44x+17 +23
Mass Spectra of Synthetic Polymers
New aspects in mass spectrometry
Hybrid Mass Spectrometers
Perhaps hundreds of hybrids have been exploredSome of the more successfulTriple quadrupoleIT-TOFQ-TOFQuadrupole-FTMSTOFTOF
New aspects in mass spectrometry
FT-ICR-MS
FT-ICR-MS instrument general scheme
Fouriertransform-ICR New Dimensions of High Performance Mass Spectrometry
A high-frequency mass spectrometer in which the cyclotron motion of ions having different mz ratios in a constant magnetic field is excited essentially simultaneously and coherently by a pulse of a radio-frequency electric field applied perpendicularly to the magnetic field
The excited cyclotron motion of the ions is subsequently detected on receiver plates as a time domain signal that contains all the cyclotron frequencies excited
Fourier transformation of the time domain signal results in the frequency domain FT-ICR signal which on the basis of the inverse proportionality between frequency and mz ratio can be converted to a mass spectrum
The ions are to be detected with a selected mz ratio absorb maximum energy through the effect of a high-frequency field and a constant magnetic field perpendicular to it Maximum energy is gained by ions that satisfy the cyclotron resonance condition and as a result these are separated from ions of different masscharge
FTICR New Dimensions of High Performance Mass Spectrometry
High mass resolution gt 3 000 000
Accuracy of mass determination lt 01 ppm Sensitivity (ESI Octapeptide) ca 50 attomol
Structure-specific fragmentation MSMS MSn
FTICR New Dimensions of High Performance Mass Spectrometry
Ions are trapped and oscillate with low incoherent thermal amplitude
Excitation sweeps resonant ions into a large coherent cyclotron orbit
Preamplifier and digitizer pick up the induced potentials on the cell
FTICR New Dimensions of High Performance Mass Spectrometry
The frequency of the cyclotron gyration of an ion is inversely proportional to its mass-to-charge ratio (mq) and directly proportional to the strength of the applied magnetic field B
FTICR New Dimensions of High Performance Mass Spectrometry
FTICR New Dimensions of High Performance Mass Spectrometry
In the presence of a magnetic field sample ions orbit according to cyclotron frequency fcbull Cyclotron frequency related to charge of ion (z) magnetic field strength (B) and mass of ion (m)
All ions of same mz will have same cyclotron frequency at a fixed B and will move in a coherent ion packet
FTICR New Dimensions of High Performance Mass Spectrometry
Ion packets produce a detectable image current on the detector cell plates
As the ion(s) in a circular orbit approach the top plate electrons are attracted to this plate from ground Then as the ion(s) circulate towards the bottom plate the electrons travel back down to the bottom plate This motion of electrons moving back and forth between the two plates produces a detectable current
FTICR New Dimensions of High Performance Mass Spectrometry
Image is Fourier transformed to obtain the component frequencies and amplitudes (intensity) of the various ionsCyclotron frequency value is converted into a mz value to produce mass spectrum with the appropriate intensities
FTICR New Dimensions of High Performance Mass Spectrometry
The End

Matrix Assisted Laser Desorption
TOF ParametersSimple cheap (in theory) robust sensitiveA good modern TOF should give1048766 gt10k Resolving power1048766 ~1-10 fmol sensitivity (single scan)1048766 ~10 ppm mass accuracy internally calibrated (5 ppm if the peak is particularly large or clean)1048766 gt1000 scanssecond1048766Unlimited mass range
Matrices
Matrix
189-Trihydroxyanthracen(Dithranol) polymers
25-Dihydroxy benzoic acid(DHB)
proteins peptides polymers
-Cyano-4-hydroxycinnamic acid
peptides (polymers)
4-Hydroxypicolinic acid oligonucleotides
Trans-Indol-3-acrylacid(IAA)
polymers
OH OH OH
OH
OH
COOH
C CH
OH
CN COOH
N
OH
COOH
NH
COOH
Sample Preparation Dried Droplet
solved Matrix solved sample
Mixing and Drying
Sample Preparation Thin Layer
solved Matrix
solved sample
fastdrying
thin homogenuouslayer of crytslas
Drying
Guide to Sample Preparation
Reflector
Through ionisation there is an activation energy distribution (energy- position- and time uncertainty electronic repulsion energy shielding effects)
Electric field after the field free drift region that reverses the direction of travel of the ion (reflects)
Ions with same mz ratio but higher kinetic energy penetrate deeper into the reflector delaying their time of arrival at the reflector relative to the slower low-energy ions
Improved resolution increase in mass accuracy
Principle Of Reflector-TOF
acceleration region Field free drift region
sample target
1 2 1 22
1
1 21
2
reflector
m = mE lt E
12
12
mz
detector
Electrospray (ESI)
Mass Analyzer Quadrupole (Q)
Four parallel rods or poles through which the ions being separated are passedPoles have a fixed DC and alternating RF voltages applied to them
Depending on the produced electric field only ions of a particular mz will be focused on the detector all the other ions will be deflected into the rods
Scanning by varying the amplitude of the voltages (ACDC constant)
Resolution
Ability of a mass spectrometer to distinguish between ions of different mz ratios
R=mΔm Δm is the mass difference between two
adjacent peaks that are just resolved m is the mass of the first peak (or the
mean mass of two peaks) although this definition is for two
peaks it is acceptable to measure the resolution from a single peak (MALDI-TOF) In that case
Δm is the width of the peak at half maxima (FWHM) of the peak corresponding to m
Resolution
If we have 5000 resolution on a mass spectrometer we can separate mz 50000 from mz 50010 or
separate mz 100000 from mz 100020 or separate mz 1000000 from mz 1000200 (all down to a 10 valley between the two peaks)
Cyclo[12]thiophen
S
S
SS
S
S
S
SS
SS
S
1654 1656 1658 1660 1662 1664
16616
16606
16596
16586
16566
16576
1300 1400 1500 1600 1700 1800 1900 20000
500
1000
1500
2000
2500
3000
16576
Inte
nsity
mz
Mass Spectra of Cyclothiophen
Mass Spectra of Angiotensin
1040 1045 1050 1055
104620 (monoisotopic)
104756 (average)
Reflektor
DE
linear
mz
bdquoMassesldquo
Average MassThe sum of the average of the isotopic masses of the atoms in a molecule eg C = 1201115 H = 100797 O = 159994 Monoisotopic MassThe sum of the exact or accurate masses of the lightest stable isotope of the atoms in a molecule eg C = 12000000 H = 1007825 O = 15994915
Nominal Mass The integral sum of the nucleons in an atom (also called the atomic mass number) eg C = 12 H = 1 O = 16
Mass spectra of Angiotensin I
130413021300129812961294
100
90
80
70
60
50
40
30
20
10
Mass (mz)
average mass 129750248
I
130413021300129812961294
100
90
80
70
60
50
40
30
20
10
0
Mass (mz)
monoisotopic mass 129668518
12C62H90N17O14
12C6113C1H90N17O14
12C6013C2 H90N17O14
12C5913C3H90N17 O14
I
R = 1000 R = 5000
Simulated Spectra of Bovine Insulin
resolution 4000
574557405735573057255720
100
90
80
70
60
50
40
30
20
10
0
resolution 30000
574557405735573057255720
100
90
80
70
60
50
40
30
20
10
0
resolution 12000
574557405735573057255720
100
90
80
70
60
50
40
30
20
10
0
resolution 5000000
574557405735573057255720
100
90
80
70
60
50
40
30
20
10
0
Instrument Resolution and Mass Accuracy
(Theoretical MW -Measured MW)ppm = X 10 Theoretical MW
Instrument Mass Range
mz
Resolution(at mz 1000)
Accuracy (Error)(at mz 1000)
GCMS (Quadrupole)
To 2000 Low Resolution
Sector To 4000 50000-100000 00005 (5 ppm)
MALDITOF To 400000 15000 (Reflectron)
0006 (60 ppm) ext Cal
0003 (30 ppm) int Cal
FTICR To 4000 To 3000000 00001 (1 ppm)
Calibration
bullInstrument calibration performed well before sample analysis
ndash EICI GC-MSndash FABndash ESI
bull Performed immediately before sample analysisndash MALDI-TOF
Calibration
Compounds used for calibration includendash PEG PBM peptides proteins PFTBA CsI
External Calibration mz scale is calibrated with a mixture of molecules with different molecular weights after that the analyte is measured Internal Calibration Analyte and a mixture of molecules with different molecular weigths are mixed and measured together Then the spectrum is calibrated by assigning the right masses to the well known calibration standards (perfect mass of analyte is between the mass of two standards)
Fragmentation ndash Dissozation ndash Adduct Formation
Comparison of Ionization Methods
EI CI ESI MALDI FAB
Additional mass due to Positive Ionisation
No YesH Na K etc(+1 +23 +39 etc)
H Na K etc(+1 +23 +39 etc)
H Na K etc(+1 +23 +39 etc)
Loss of mass due to negative ionisation
- NoLoss of H(-1) Loss of H(-1)
Loss of H(-1)
Number of charges added 1 1
1-many (dependent upon mass)
1-2 1-2
Matrix peaks No No Yes Yes No
Singly- doubly- triply- etc charged ion Molecule or molecular moiety which has gained or lost respectively one two three or more electronsprotons
Fragmentation ndash Dissozation ndash Adduct Formation
Dimeric ionIon formed when a chemical species exists in the vapour as a dimer and can be detected as such or when a molecular ion can attach to a neutral molecule within the ion source eg [2M+H]+
Cytochrom C MALDI ESI
Adduct ions An ion formed by interaction of two species usually an ion and a molecule and often within an ion source to form an ion containing all the constituent atoms of one species as well as an additional atom
Fragmentation ndash Dissozation ndash Adduct Formation
640 660 680 700 mz
500
1000
1500
2000
2500
3000
3500
4000
ai
652
674
690
[M+Na]+
[M+H]+
[M+K]+
OH O
N
O
2
C40H46N2O6
Cluster ionAn ion formed by the combination of two or more atoms ions or molecules of a chemical species often in association with a second species
Fragmentation ndash Dissozation ndash Adduct Formation
1831
2752
3672
4592
X 10
5513
6433
82749194
[2M- H]-
[3M- H]-
[7M- H]-
Negative- ion FABof matrix glycerol
Fragment ion An electrically charged dissociation product of an ionic fragmentation Such an ion may fragmentate further to produce other electrically charged molecular or atomic moieties of successively lower formula weight
Fragmentation Break Of Covalent BondDissociation Break of Non-covalent complex
Fragmentation ndash Dissozation ndash Adduct Formation
bdquoHardldquoIonisation
bdquoSoftldquoIonisation
EI CI MALDIFAB ESI
Fragment ion An electrically charged dissociation product of an ionic fragmentation Such an ion may fragmentate further to produce other electrically charged molecular or atomic moieties of successively lower formula weight
Fragmentation Break Of Covalent BondDissociation Break of Non-covalent complex
Fragmentation ndash Dissozation ndash Adduct Formation
bdquoHardldquoIonisation
bdquoSoftldquoIonisation
EI CI MALDIFAB ESI
Fragmentation ndash Dissozation ndash Adduct Formation
New SoftwareACDMS Fragmenter
predicting of possible schemes of mass spectral fragmentation for chemical structures
Selection fragmentation-rule parameters to mimic different ionization techniques that range from EI to low energy protonation techniques such as ESI or APCI
Recognition of fragments within an aquired mass spectra
Fragmentation ndash Dissozation ndash Adduct Formation
1000 1250 1500 1750 2000 2250 2500 2750 30000
20
40
60
80
100
CuL+
(Ac3T)2phen
sig
na
l in
ten
sity
mz
CuL2
+
1000 1250 1500 1750 2000 2250 2500 2750 30000
20
40
60
80
100CuL
2
+
CuL+
Sig
na
l In
ten
sity
mz
TMS-protected complex deprotected complex
N
SSS
BuBuBu
Bu
N
RN
NS S S
Bu Bu Bu Bu
R
S S S
Bu Bu BuBu
R
SSS
BuBuBu
Bu
R
Cu+
BF4-
R = TMS H
Fragmentation ndash Dissozation ndash Adduct Formation
600 700 800 mz
1000
2000
3000
4000
5000
6000
7000
8000
9000
10000
11000
ai
6546
8109
OO
N NNi
N N
Impurities - Contamination - Artefacts
Impurity eg antioxidantia in organic solvents side products not separated after synthesis additional components after insufficient isolation from biological material
ContaminationCompound which was putinto the sample subsequently eg through chromatographic column
ArtefactMS-specific bdquokey ionsldquo eg CI with CH4 as ionisation gasCH4 + e- CH4
+bull (formation of primary ion)CH4
+bull CH3+ + Hbull
CH3+ + CH4 C2H5
+ + H2 formation of adducts with mz +28
Impurities - Contamination - Artefacts
Contamination
SourceDetection
EI CI FAB MALDI ESI
Alkali salts Solvents glas etc - ++ ++++
Heavy metal salts
Sample vessels HPLC pumps
- ++ ++
Alkyl(benzol)sulfonate
Columns IE detergents
- ++ -+
Alkylammounium salts
Columns IE detergents
- ++ ++++
HC Grease + + ++
Polyphenylether
Grease pump oil + + ++
Longchain carbonic acids
Chromatographic columns
++ + (+)(+)
Siloxane Silicon grease DC plate plastic
++ + -(+)
General Sample Handling
Mass spectrometry is a sensitive technique (for impurities and contamination too)
Sample Storagendash Glass vials can leach salts (NaK) into samplendash Ideal storage vial is siliconized polypropylene tubes
Use Freshly prepared high purity reagents and water
Omit high concentrations of buffer salts ( NaCl KH2PO4) Detergents (Tween Triton SDS)Urea guanidine salts Cleaning of the sample dialysis RP-HPLC Zip-Tips ion
exchange
Use of removable buffer salts (zB NH4Ac)
Use of removable solvents like water acetonitrile methanol
General Sample Handling
Use Freshly prepared high purity reagents and water
Omit high concentrations of buffer salts ( NaCl KH2PO4) Detergents (Tween Triton SDS)Urea guanidine salts Cleaning of the sample dialysis RP-HPLC Zip-Tips ion
exchange
Use of removable buffer salts (zB NH4Ac)
Use of removable solvents like water acetonitrile methanol
Mass Spectra of Synthetic Polymers
Information monomer unit end group average masses
Mn = (NiMi) MiMw = (NiMi2) (NiMi)
polydispersity D = MwMn
ProblemsSynthetic polymers are polydisperse bad signal-noise-ratio bdquomass discriminationldquodetector saumlttigung at D gt 11Polymers without ionisationable functional groups metal ion add-onzB Polystyrol Ag+ PEG Na+ K+ etc
Mass Spectra of Synthetic PolymersMass Spectra of Synthetic Polymers
2 0 0 0 3 0 0 0 4 0 0 0 5 0 0 0 6 0 0 0 7 0 0 0 8 0 0 0 9 0 0 0 1 0 0 0 0 m z0
2 0 0 0
4 0 0 0
6 0 0 0
I n t e n s
CH -O-C-CH -CH-C-CH -CH-C-O-CH3 2 2 3
O OCH3 CH3O[ [n
Linear Mode
Reflektor Mode
CH-(CHO)-OH+Na324x+1067
11111155
1199
1023
979
935 1243
15 + 44x+17 +23
Mass Spectra of Synthetic Polymers
New aspects in mass spectrometry
Hybrid Mass Spectrometers
Perhaps hundreds of hybrids have been exploredSome of the more successfulTriple quadrupoleIT-TOFQ-TOFQuadrupole-FTMSTOFTOF
New aspects in mass spectrometry
FT-ICR-MS
FT-ICR-MS instrument general scheme
Fouriertransform-ICR New Dimensions of High Performance Mass Spectrometry
A high-frequency mass spectrometer in which the cyclotron motion of ions having different mz ratios in a constant magnetic field is excited essentially simultaneously and coherently by a pulse of a radio-frequency electric field applied perpendicularly to the magnetic field
The excited cyclotron motion of the ions is subsequently detected on receiver plates as a time domain signal that contains all the cyclotron frequencies excited
Fourier transformation of the time domain signal results in the frequency domain FT-ICR signal which on the basis of the inverse proportionality between frequency and mz ratio can be converted to a mass spectrum
The ions are to be detected with a selected mz ratio absorb maximum energy through the effect of a high-frequency field and a constant magnetic field perpendicular to it Maximum energy is gained by ions that satisfy the cyclotron resonance condition and as a result these are separated from ions of different masscharge
FTICR New Dimensions of High Performance Mass Spectrometry
High mass resolution gt 3 000 000
Accuracy of mass determination lt 01 ppm Sensitivity (ESI Octapeptide) ca 50 attomol
Structure-specific fragmentation MSMS MSn
FTICR New Dimensions of High Performance Mass Spectrometry
Ions are trapped and oscillate with low incoherent thermal amplitude
Excitation sweeps resonant ions into a large coherent cyclotron orbit
Preamplifier and digitizer pick up the induced potentials on the cell
FTICR New Dimensions of High Performance Mass Spectrometry
The frequency of the cyclotron gyration of an ion is inversely proportional to its mass-to-charge ratio (mq) and directly proportional to the strength of the applied magnetic field B
FTICR New Dimensions of High Performance Mass Spectrometry
FTICR New Dimensions of High Performance Mass Spectrometry
In the presence of a magnetic field sample ions orbit according to cyclotron frequency fcbull Cyclotron frequency related to charge of ion (z) magnetic field strength (B) and mass of ion (m)
All ions of same mz will have same cyclotron frequency at a fixed B and will move in a coherent ion packet
FTICR New Dimensions of High Performance Mass Spectrometry
Ion packets produce a detectable image current on the detector cell plates
As the ion(s) in a circular orbit approach the top plate electrons are attracted to this plate from ground Then as the ion(s) circulate towards the bottom plate the electrons travel back down to the bottom plate This motion of electrons moving back and forth between the two plates produces a detectable current
FTICR New Dimensions of High Performance Mass Spectrometry
Image is Fourier transformed to obtain the component frequencies and amplitudes (intensity) of the various ionsCyclotron frequency value is converted into a mz value to produce mass spectrum with the appropriate intensities
FTICR New Dimensions of High Performance Mass Spectrometry
The End
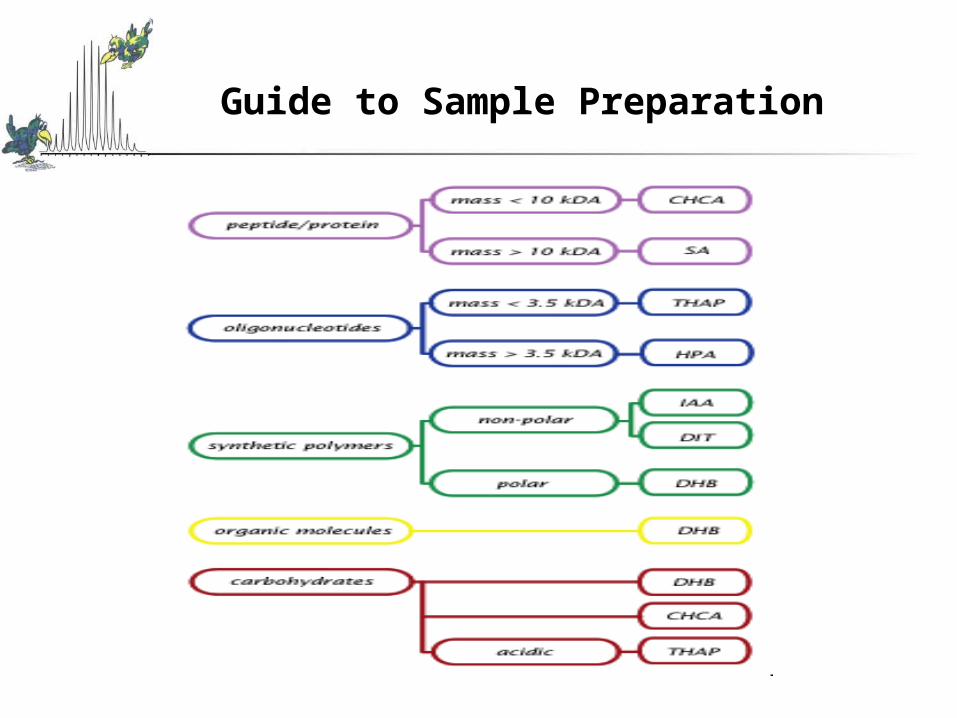

Resolution
If we have 5000 resolution on a mass spectrometer we can separate mz 50000 from mz 50010 or
separate mz 100000 from mz 100020 or separate mz 1000000 from mz 1000200 (all down to a 10 valley between the two peaks)
Cyclo[12]thiophen
S
S
SS
S
S
S
SS
SS
S
1654 1656 1658 1660 1662 1664
16616
16606
16596
16586
16566
16576
1300 1400 1500 1600 1700 1800 1900 20000
500
1000
1500
2000
2500
3000
16576
Inte
nsity
mz
Mass Spectra of Cyclothiophen
Mass Spectra of Angiotensin
1040 1045 1050 1055
104620 (monoisotopic)
104756 (average)
Reflektor
DE
linear
mz
bdquoMassesldquo
Average MassThe sum of the average of the isotopic masses of the atoms in a molecule eg C = 1201115 H = 100797 O = 159994 Monoisotopic MassThe sum of the exact or accurate masses of the lightest stable isotope of the atoms in a molecule eg C = 12000000 H = 1007825 O = 15994915
Nominal Mass The integral sum of the nucleons in an atom (also called the atomic mass number) eg C = 12 H = 1 O = 16
Mass spectra of Angiotensin I
130413021300129812961294
100
90
80
70
60
50
40
30
20
10
Mass (mz)
average mass 129750248
I
130413021300129812961294
100
90
80
70
60
50
40
30
20
10
0
Mass (mz)
monoisotopic mass 129668518
12C62H90N17O14
12C6113C1H90N17O14
12C6013C2 H90N17O14
12C5913C3H90N17 O14
I
R = 1000 R = 5000
Simulated Spectra of Bovine Insulin
resolution 4000
574557405735573057255720
100
90
80
70
60
50
40
30
20
10
0
resolution 30000
574557405735573057255720
100
90
80
70
60
50
40
30
20
10
0
resolution 12000
574557405735573057255720
100
90
80
70
60
50
40
30
20
10
0
resolution 5000000
574557405735573057255720
100
90
80
70
60
50
40
30
20
10
0
Instrument Resolution and Mass Accuracy
(Theoretical MW -Measured MW)ppm = X 10 Theoretical MW
Instrument Mass Range
mz
Resolution(at mz 1000)
Accuracy (Error)(at mz 1000)
GCMS (Quadrupole)
To 2000 Low Resolution
Sector To 4000 50000-100000 00005 (5 ppm)
MALDITOF To 400000 15000 (Reflectron)
0006 (60 ppm) ext Cal
0003 (30 ppm) int Cal
FTICR To 4000 To 3000000 00001 (1 ppm)
Calibration
bullInstrument calibration performed well before sample analysis
ndash EICI GC-MSndash FABndash ESI
bull Performed immediately before sample analysisndash MALDI-TOF
Calibration
Compounds used for calibration includendash PEG PBM peptides proteins PFTBA CsI
External Calibration mz scale is calibrated with a mixture of molecules with different molecular weights after that the analyte is measured Internal Calibration Analyte and a mixture of molecules with different molecular weigths are mixed and measured together Then the spectrum is calibrated by assigning the right masses to the well known calibration standards (perfect mass of analyte is between the mass of two standards)
Fragmentation ndash Dissozation ndash Adduct Formation
Comparison of Ionization Methods
EI CI ESI MALDI FAB
Additional mass due to Positive Ionisation
No YesH Na K etc(+1 +23 +39 etc)
H Na K etc(+1 +23 +39 etc)
H Na K etc(+1 +23 +39 etc)
Loss of mass due to negative ionisation
- NoLoss of H(-1) Loss of H(-1)
Loss of H(-1)
Number of charges added 1 1
1-many (dependent upon mass)
1-2 1-2
Matrix peaks No No Yes Yes No
Singly- doubly- triply- etc charged ion Molecule or molecular moiety which has gained or lost respectively one two three or more electronsprotons
Fragmentation ndash Dissozation ndash Adduct Formation
Dimeric ionIon formed when a chemical species exists in the vapour as a dimer and can be detected as such or when a molecular ion can attach to a neutral molecule within the ion source eg [2M+H]+
Cytochrom C MALDI ESI
Adduct ions An ion formed by interaction of two species usually an ion and a molecule and often within an ion source to form an ion containing all the constituent atoms of one species as well as an additional atom
Fragmentation ndash Dissozation ndash Adduct Formation
640 660 680 700 mz
500
1000
1500
2000
2500
3000
3500
4000
ai
652
674
690
[M+Na]+
[M+H]+
[M+K]+
OH O
N
O
2
C40H46N2O6
Cluster ionAn ion formed by the combination of two or more atoms ions or molecules of a chemical species often in association with a second species
Fragmentation ndash Dissozation ndash Adduct Formation
1831
2752
3672
4592
X 10
5513
6433
82749194
[2M- H]-
[3M- H]-
[7M- H]-
Negative- ion FABof matrix glycerol
Fragment ion An electrically charged dissociation product of an ionic fragmentation Such an ion may fragmentate further to produce other electrically charged molecular or atomic moieties of successively lower formula weight
Fragmentation Break Of Covalent BondDissociation Break of Non-covalent complex
Fragmentation ndash Dissozation ndash Adduct Formation
bdquoHardldquoIonisation
bdquoSoftldquoIonisation
EI CI MALDIFAB ESI
Fragment ion An electrically charged dissociation product of an ionic fragmentation Such an ion may fragmentate further to produce other electrically charged molecular or atomic moieties of successively lower formula weight
Fragmentation Break Of Covalent BondDissociation Break of Non-covalent complex
Fragmentation ndash Dissozation ndash Adduct Formation
bdquoHardldquoIonisation
bdquoSoftldquoIonisation
EI CI MALDIFAB ESI
Fragmentation ndash Dissozation ndash Adduct Formation
New SoftwareACDMS Fragmenter
predicting of possible schemes of mass spectral fragmentation for chemical structures
Selection fragmentation-rule parameters to mimic different ionization techniques that range from EI to low energy protonation techniques such as ESI or APCI
Recognition of fragments within an aquired mass spectra
Fragmentation ndash Dissozation ndash Adduct Formation
1000 1250 1500 1750 2000 2250 2500 2750 30000
20
40
60
80
100
CuL+
(Ac3T)2phen
sig
na
l in
ten
sity
mz
CuL2
+
1000 1250 1500 1750 2000 2250 2500 2750 30000
20
40
60
80
100CuL
2
+
CuL+
Sig
na
l In
ten
sity
mz
TMS-protected complex deprotected complex
N
SSS
BuBuBu
Bu
N
RN
NS S S
Bu Bu Bu Bu
R
S S S
Bu Bu BuBu
R
SSS
BuBuBu
Bu
R
Cu+
BF4-
R = TMS H
Fragmentation ndash Dissozation ndash Adduct Formation
600 700 800 mz
1000
2000
3000
4000
5000
6000
7000
8000
9000
10000
11000
ai
6546
8109
OO
N NNi
N N
Impurities - Contamination - Artefacts
Impurity eg antioxidantia in organic solvents side products not separated after synthesis additional components after insufficient isolation from biological material
ContaminationCompound which was putinto the sample subsequently eg through chromatographic column
ArtefactMS-specific bdquokey ionsldquo eg CI with CH4 as ionisation gasCH4 + e- CH4
+bull (formation of primary ion)CH4
+bull CH3+ + Hbull
CH3+ + CH4 C2H5
+ + H2 formation of adducts with mz +28
Impurities - Contamination - Artefacts
Contamination
SourceDetection
EI CI FAB MALDI ESI
Alkali salts Solvents glas etc - ++ ++++
Heavy metal salts
Sample vessels HPLC pumps
- ++ ++
Alkyl(benzol)sulfonate
Columns IE detergents
- ++ -+
Alkylammounium salts
Columns IE detergents
- ++ ++++
HC Grease + + ++
Polyphenylether
Grease pump oil + + ++
Longchain carbonic acids
Chromatographic columns
++ + (+)(+)
Siloxane Silicon grease DC plate plastic
++ + -(+)
General Sample Handling
Mass spectrometry is a sensitive technique (for impurities and contamination too)
Sample Storagendash Glass vials can leach salts (NaK) into samplendash Ideal storage vial is siliconized polypropylene tubes
Use Freshly prepared high purity reagents and water
Omit high concentrations of buffer salts ( NaCl KH2PO4) Detergents (Tween Triton SDS)Urea guanidine salts Cleaning of the sample dialysis RP-HPLC Zip-Tips ion
exchange
Use of removable buffer salts (zB NH4Ac)
Use of removable solvents like water acetonitrile methanol
General Sample Handling
Use Freshly prepared high purity reagents and water
Omit high concentrations of buffer salts ( NaCl KH2PO4) Detergents (Tween Triton SDS)Urea guanidine salts Cleaning of the sample dialysis RP-HPLC Zip-Tips ion
exchange
Use of removable buffer salts (zB NH4Ac)
Use of removable solvents like water acetonitrile methanol
Mass Spectra of Synthetic Polymers
Information monomer unit end group average masses
Mn = (NiMi) MiMw = (NiMi2) (NiMi)
polydispersity D = MwMn
ProblemsSynthetic polymers are polydisperse bad signal-noise-ratio bdquomass discriminationldquodetector saumlttigung at D gt 11Polymers without ionisationable functional groups metal ion add-onzB Polystyrol Ag+ PEG Na+ K+ etc
Mass Spectra of Synthetic PolymersMass Spectra of Synthetic Polymers
2 0 0 0 3 0 0 0 4 0 0 0 5 0 0 0 6 0 0 0 7 0 0 0 8 0 0 0 9 0 0 0 1 0 0 0 0 m z0
2 0 0 0
4 0 0 0
6 0 0 0
I n t e n s
CH -O-C-CH -CH-C-CH -CH-C-O-CH3 2 2 3
O OCH3 CH3O[ [n
Linear Mode
Reflektor Mode
CH-(CHO)-OH+Na324x+1067
11111155
1199
1023
979
935 1243
15 + 44x+17 +23
Mass Spectra of Synthetic Polymers
New aspects in mass spectrometry
Hybrid Mass Spectrometers
Perhaps hundreds of hybrids have been exploredSome of the more successfulTriple quadrupoleIT-TOFQ-TOFQuadrupole-FTMSTOFTOF
New aspects in mass spectrometry
FT-ICR-MS
FT-ICR-MS instrument general scheme
Fouriertransform-ICR New Dimensions of High Performance Mass Spectrometry
A high-frequency mass spectrometer in which the cyclotron motion of ions having different mz ratios in a constant magnetic field is excited essentially simultaneously and coherently by a pulse of a radio-frequency electric field applied perpendicularly to the magnetic field
The excited cyclotron motion of the ions is subsequently detected on receiver plates as a time domain signal that contains all the cyclotron frequencies excited
Fourier transformation of the time domain signal results in the frequency domain FT-ICR signal which on the basis of the inverse proportionality between frequency and mz ratio can be converted to a mass spectrum
The ions are to be detected with a selected mz ratio absorb maximum energy through the effect of a high-frequency field and a constant magnetic field perpendicular to it Maximum energy is gained by ions that satisfy the cyclotron resonance condition and as a result these are separated from ions of different masscharge
FTICR New Dimensions of High Performance Mass Spectrometry
High mass resolution gt 3 000 000
Accuracy of mass determination lt 01 ppm Sensitivity (ESI Octapeptide) ca 50 attomol
Structure-specific fragmentation MSMS MSn
FTICR New Dimensions of High Performance Mass Spectrometry
Ions are trapped and oscillate with low incoherent thermal amplitude
Excitation sweeps resonant ions into a large coherent cyclotron orbit
Preamplifier and digitizer pick up the induced potentials on the cell
FTICR New Dimensions of High Performance Mass Spectrometry
The frequency of the cyclotron gyration of an ion is inversely proportional to its mass-to-charge ratio (mq) and directly proportional to the strength of the applied magnetic field B
FTICR New Dimensions of High Performance Mass Spectrometry
FTICR New Dimensions of High Performance Mass Spectrometry
In the presence of a magnetic field sample ions orbit according to cyclotron frequency fcbull Cyclotron frequency related to charge of ion (z) magnetic field strength (B) and mass of ion (m)
All ions of same mz will have same cyclotron frequency at a fixed B and will move in a coherent ion packet
FTICR New Dimensions of High Performance Mass Spectrometry
Ion packets produce a detectable image current on the detector cell plates
As the ion(s) in a circular orbit approach the top plate electrons are attracted to this plate from ground Then as the ion(s) circulate towards the bottom plate the electrons travel back down to the bottom plate This motion of electrons moving back and forth between the two plates produces a detectable current
FTICR New Dimensions of High Performance Mass Spectrometry
Image is Fourier transformed to obtain the component frequencies and amplitudes (intensity) of the various ionsCyclotron frequency value is converted into a mz value to produce mass spectrum with the appropriate intensities
FTICR New Dimensions of High Performance Mass Spectrometry
The End
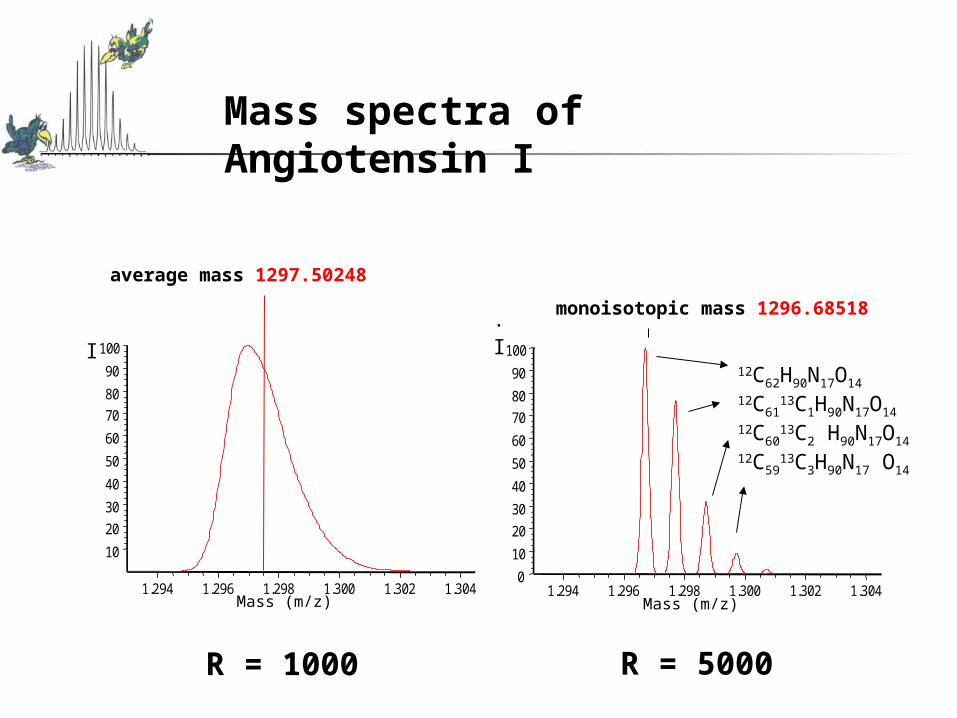
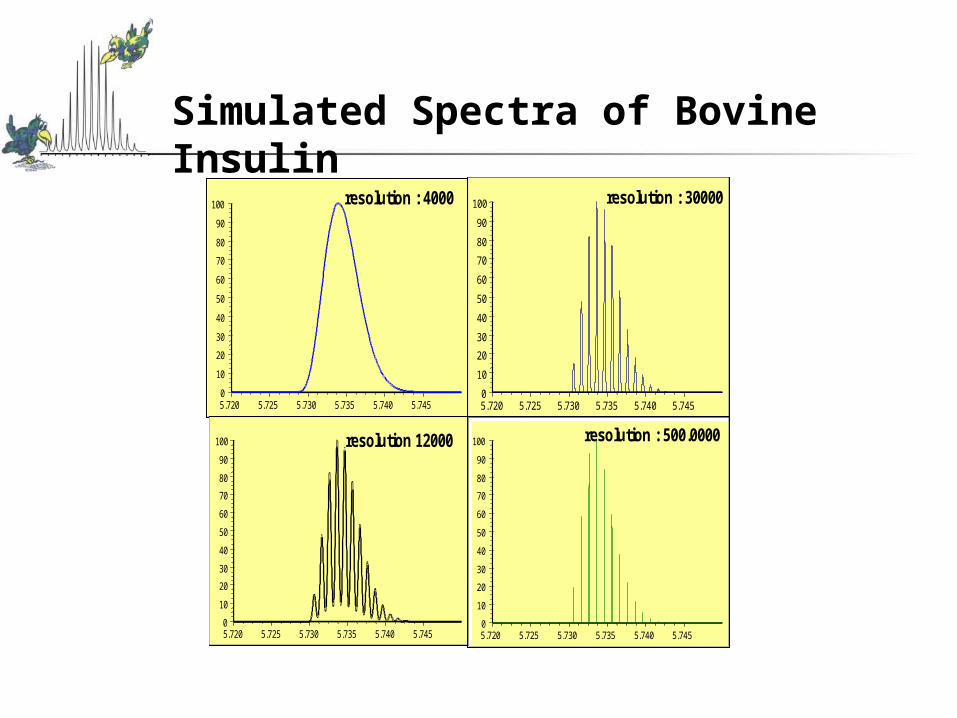

Calibration
Compounds used for calibration includendash PEG PBM peptides proteins PFTBA CsI
External Calibration mz scale is calibrated with a mixture of molecules with different molecular weights after that the analyte is measured Internal Calibration Analyte and a mixture of molecules with different molecular weigths are mixed and measured together Then the spectrum is calibrated by assigning the right masses to the well known calibration standards (perfect mass of analyte is between the mass of two standards)
Fragmentation ndash Dissozation ndash Adduct Formation
Comparison of Ionization Methods
EI CI ESI MALDI FAB
Additional mass due to Positive Ionisation
No YesH Na K etc(+1 +23 +39 etc)
H Na K etc(+1 +23 +39 etc)
H Na K etc(+1 +23 +39 etc)
Loss of mass due to negative ionisation
- NoLoss of H(-1) Loss of H(-1)
Loss of H(-1)
Number of charges added 1 1
1-many (dependent upon mass)
1-2 1-2
Matrix peaks No No Yes Yes No
Singly- doubly- triply- etc charged ion Molecule or molecular moiety which has gained or lost respectively one two three or more electronsprotons
Fragmentation ndash Dissozation ndash Adduct Formation
Dimeric ionIon formed when a chemical species exists in the vapour as a dimer and can be detected as such or when a molecular ion can attach to a neutral molecule within the ion source eg [2M+H]+
Cytochrom C MALDI ESI
Adduct ions An ion formed by interaction of two species usually an ion and a molecule and often within an ion source to form an ion containing all the constituent atoms of one species as well as an additional atom
Fragmentation ndash Dissozation ndash Adduct Formation
640 660 680 700 mz
500
1000
1500
2000
2500
3000
3500
4000
ai
652
674
690
[M+Na]+
[M+H]+
[M+K]+
OH O
N
O
2
C40H46N2O6
Cluster ionAn ion formed by the combination of two or more atoms ions or molecules of a chemical species often in association with a second species
Fragmentation ndash Dissozation ndash Adduct Formation
1831
2752
3672
4592
X 10
5513
6433
82749194
[2M- H]-
[3M- H]-
[7M- H]-
Negative- ion FABof matrix glycerol
Fragment ion An electrically charged dissociation product of an ionic fragmentation Such an ion may fragmentate further to produce other electrically charged molecular or atomic moieties of successively lower formula weight
Fragmentation Break Of Covalent BondDissociation Break of Non-covalent complex
Fragmentation ndash Dissozation ndash Adduct Formation
bdquoHardldquoIonisation
bdquoSoftldquoIonisation
EI CI MALDIFAB ESI
Fragment ion An electrically charged dissociation product of an ionic fragmentation Such an ion may fragmentate further to produce other electrically charged molecular or atomic moieties of successively lower formula weight
Fragmentation Break Of Covalent BondDissociation Break of Non-covalent complex
Fragmentation ndash Dissozation ndash Adduct Formation
bdquoHardldquoIonisation
bdquoSoftldquoIonisation
EI CI MALDIFAB ESI
Fragmentation ndash Dissozation ndash Adduct Formation
New SoftwareACDMS Fragmenter
predicting of possible schemes of mass spectral fragmentation for chemical structures
Selection fragmentation-rule parameters to mimic different ionization techniques that range from EI to low energy protonation techniques such as ESI or APCI
Recognition of fragments within an aquired mass spectra
Fragmentation ndash Dissozation ndash Adduct Formation
1000 1250 1500 1750 2000 2250 2500 2750 30000
20
40
60
80
100
CuL+
(Ac3T)2phen
sig
na
l in
ten
sity
mz
CuL2
+
1000 1250 1500 1750 2000 2250 2500 2750 30000
20
40
60
80
100CuL
2
+
CuL+
Sig
na
l In
ten
sity
mz
TMS-protected complex deprotected complex
N
SSS
BuBuBu
Bu
N
RN
NS S S
Bu Bu Bu Bu
R
S S S
Bu Bu BuBu
R
SSS
BuBuBu
Bu
R
Cu+
BF4-
R = TMS H
Fragmentation ndash Dissozation ndash Adduct Formation
600 700 800 mz
1000
2000
3000
4000
5000
6000
7000
8000
9000
10000
11000
ai
6546
8109
OO
N NNi
N N
Impurities - Contamination - Artefacts
Impurity eg antioxidantia in organic solvents side products not separated after synthesis additional components after insufficient isolation from biological material
ContaminationCompound which was putinto the sample subsequently eg through chromatographic column
ArtefactMS-specific bdquokey ionsldquo eg CI with CH4 as ionisation gasCH4 + e- CH4
+bull (formation of primary ion)CH4
+bull CH3+ + Hbull
CH3+ + CH4 C2H5
+ + H2 formation of adducts with mz +28
Impurities - Contamination - Artefacts
Contamination
SourceDetection
EI CI FAB MALDI ESI
Alkali salts Solvents glas etc - ++ ++++
Heavy metal salts
Sample vessels HPLC pumps
- ++ ++
Alkyl(benzol)sulfonate
Columns IE detergents
- ++ -+
Alkylammounium salts
Columns IE detergents
- ++ ++++
HC Grease + + ++
Polyphenylether
Grease pump oil + + ++
Longchain carbonic acids
Chromatographic columns
++ + (+)(+)
Siloxane Silicon grease DC plate plastic
++ + -(+)
General Sample Handling
Mass spectrometry is a sensitive technique (for impurities and contamination too)
Sample Storagendash Glass vials can leach salts (NaK) into samplendash Ideal storage vial is siliconized polypropylene tubes
Use Freshly prepared high purity reagents and water
Omit high concentrations of buffer salts ( NaCl KH2PO4) Detergents (Tween Triton SDS)Urea guanidine salts Cleaning of the sample dialysis RP-HPLC Zip-Tips ion
exchange
Use of removable buffer salts (zB NH4Ac)
Use of removable solvents like water acetonitrile methanol
General Sample Handling
Use Freshly prepared high purity reagents and water
Omit high concentrations of buffer salts ( NaCl KH2PO4) Detergents (Tween Triton SDS)Urea guanidine salts Cleaning of the sample dialysis RP-HPLC Zip-Tips ion
exchange
Use of removable buffer salts (zB NH4Ac)
Use of removable solvents like water acetonitrile methanol
Mass Spectra of Synthetic Polymers
Information monomer unit end group average masses
Mn = (NiMi) MiMw = (NiMi2) (NiMi)
polydispersity D = MwMn
ProblemsSynthetic polymers are polydisperse bad signal-noise-ratio bdquomass discriminationldquodetector saumlttigung at D gt 11Polymers without ionisationable functional groups metal ion add-onzB Polystyrol Ag+ PEG Na+ K+ etc
Mass Spectra of Synthetic PolymersMass Spectra of Synthetic Polymers
2 0 0 0 3 0 0 0 4 0 0 0 5 0 0 0 6 0 0 0 7 0 0 0 8 0 0 0 9 0 0 0 1 0 0 0 0 m z0
2 0 0 0
4 0 0 0
6 0 0 0
I n t e n s
CH -O-C-CH -CH-C-CH -CH-C-O-CH3 2 2 3
O OCH3 CH3O[ [n
Linear Mode
Reflektor Mode
CH-(CHO)-OH+Na324x+1067
11111155
1199
1023
979
935 1243
15 + 44x+17 +23
Mass Spectra of Synthetic Polymers
New aspects in mass spectrometry
Hybrid Mass Spectrometers
Perhaps hundreds of hybrids have been exploredSome of the more successfulTriple quadrupoleIT-TOFQ-TOFQuadrupole-FTMSTOFTOF
New aspects in mass spectrometry
FT-ICR-MS
FT-ICR-MS instrument general scheme
Fouriertransform-ICR New Dimensions of High Performance Mass Spectrometry
A high-frequency mass spectrometer in which the cyclotron motion of ions having different mz ratios in a constant magnetic field is excited essentially simultaneously and coherently by a pulse of a radio-frequency electric field applied perpendicularly to the magnetic field
The excited cyclotron motion of the ions is subsequently detected on receiver plates as a time domain signal that contains all the cyclotron frequencies excited
Fourier transformation of the time domain signal results in the frequency domain FT-ICR signal which on the basis of the inverse proportionality between frequency and mz ratio can be converted to a mass spectrum
The ions are to be detected with a selected mz ratio absorb maximum energy through the effect of a high-frequency field and a constant magnetic field perpendicular to it Maximum energy is gained by ions that satisfy the cyclotron resonance condition and as a result these are separated from ions of different masscharge
FTICR New Dimensions of High Performance Mass Spectrometry
High mass resolution gt 3 000 000
Accuracy of mass determination lt 01 ppm Sensitivity (ESI Octapeptide) ca 50 attomol
Structure-specific fragmentation MSMS MSn
FTICR New Dimensions of High Performance Mass Spectrometry
Ions are trapped and oscillate with low incoherent thermal amplitude
Excitation sweeps resonant ions into a large coherent cyclotron orbit
Preamplifier and digitizer pick up the induced potentials on the cell
FTICR New Dimensions of High Performance Mass Spectrometry
The frequency of the cyclotron gyration of an ion is inversely proportional to its mass-to-charge ratio (mq) and directly proportional to the strength of the applied magnetic field B
FTICR New Dimensions of High Performance Mass Spectrometry
FTICR New Dimensions of High Performance Mass Spectrometry
In the presence of a magnetic field sample ions orbit according to cyclotron frequency fcbull Cyclotron frequency related to charge of ion (z) magnetic field strength (B) and mass of ion (m)
All ions of same mz will have same cyclotron frequency at a fixed B and will move in a coherent ion packet
FTICR New Dimensions of High Performance Mass Spectrometry
Ion packets produce a detectable image current on the detector cell plates
As the ion(s) in a circular orbit approach the top plate electrons are attracted to this plate from ground Then as the ion(s) circulate towards the bottom plate the electrons travel back down to the bottom plate This motion of electrons moving back and forth between the two plates produces a detectable current
FTICR New Dimensions of High Performance Mass Spectrometry
Image is Fourier transformed to obtain the component frequencies and amplitudes (intensity) of the various ionsCyclotron frequency value is converted into a mz value to produce mass spectrum with the appropriate intensities
FTICR New Dimensions of High Performance Mass Spectrometry
The End
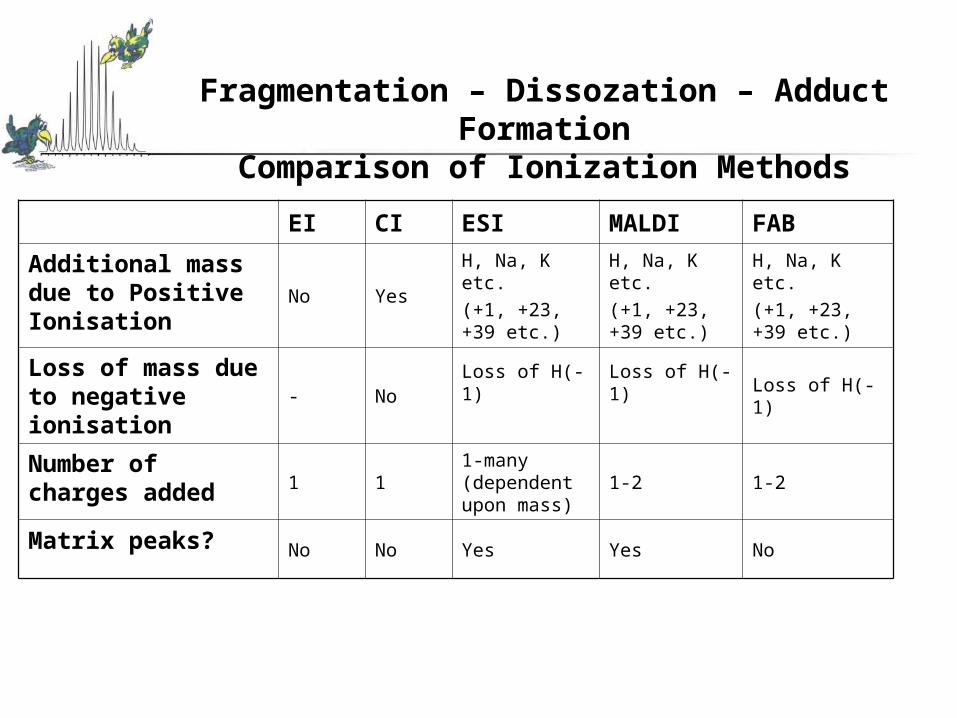
Fragmentation ndash Dissozation ndash Adduct Formation
Comparison of Ionization Methods
EI CI ESI MALDI FAB
Additional mass due to Positive Ionisation
No YesH Na K etc(+1 +23 +39 etc)
H Na K etc(+1 +23 +39 etc)
H Na K etc(+1 +23 +39 etc)
Loss of mass due to negative ionisation
- NoLoss of H(-1) Loss of H(-1)
Loss of H(-1)
Number of charges added 1 1
1-many (dependent upon mass)
1-2 1-2
Matrix peaks No No Yes Yes No
Singly- doubly- triply- etc charged ion Molecule or molecular moiety which has gained or lost respectively one two three or more electronsprotons
Fragmentation ndash Dissozation ndash Adduct Formation
Dimeric ionIon formed when a chemical species exists in the vapour as a dimer and can be detected as such or when a molecular ion can attach to a neutral molecule within the ion source eg [2M+H]+
Cytochrom C MALDI ESI
Adduct ions An ion formed by interaction of two species usually an ion and a molecule and often within an ion source to form an ion containing all the constituent atoms of one species as well as an additional atom
Fragmentation ndash Dissozation ndash Adduct Formation
640 660 680 700 mz
500
1000
1500
2000
2500
3000
3500
4000
ai
652
674
690
[M+Na]+
[M+H]+
[M+K]+
OH O
N
O
2
C40H46N2O6
Cluster ionAn ion formed by the combination of two or more atoms ions or molecules of a chemical species often in association with a second species
Fragmentation ndash Dissozation ndash Adduct Formation
1831
2752
3672
4592
X 10
5513
6433
82749194
[2M- H]-
[3M- H]-
[7M- H]-
Negative- ion FABof matrix glycerol
Fragment ion An electrically charged dissociation product of an ionic fragmentation Such an ion may fragmentate further to produce other electrically charged molecular or atomic moieties of successively lower formula weight
Fragmentation Break Of Covalent BondDissociation Break of Non-covalent complex
Fragmentation ndash Dissozation ndash Adduct Formation
bdquoHardldquoIonisation
bdquoSoftldquoIonisation
EI CI MALDIFAB ESI
Fragment ion An electrically charged dissociation product of an ionic fragmentation Such an ion may fragmentate further to produce other electrically charged molecular or atomic moieties of successively lower formula weight
Fragmentation Break Of Covalent BondDissociation Break of Non-covalent complex
Fragmentation ndash Dissozation ndash Adduct Formation
bdquoHardldquoIonisation
bdquoSoftldquoIonisation
EI CI MALDIFAB ESI
Fragmentation ndash Dissozation ndash Adduct Formation
New SoftwareACDMS Fragmenter
predicting of possible schemes of mass spectral fragmentation for chemical structures
Selection fragmentation-rule parameters to mimic different ionization techniques that range from EI to low energy protonation techniques such as ESI or APCI
Recognition of fragments within an aquired mass spectra
Fragmentation ndash Dissozation ndash Adduct Formation
1000 1250 1500 1750 2000 2250 2500 2750 30000
20
40
60
80
100
CuL+
(Ac3T)2phen
sig
na
l in
ten
sity
mz
CuL2
+
1000 1250 1500 1750 2000 2250 2500 2750 30000
20
40
60
80
100CuL
2
+
CuL+
Sig
na
l In
ten
sity
mz
TMS-protected complex deprotected complex
N
SSS
BuBuBu
Bu
N
RN
NS S S
Bu Bu Bu Bu
R
S S S
Bu Bu BuBu
R
SSS
BuBuBu
Bu
R
Cu+
BF4-
R = TMS H
Fragmentation ndash Dissozation ndash Adduct Formation
600 700 800 mz
1000
2000
3000
4000
5000
6000
7000
8000
9000
10000
11000
ai
6546
8109
OO
N NNi
N N
Impurities - Contamination - Artefacts
Impurity eg antioxidantia in organic solvents side products not separated after synthesis additional components after insufficient isolation from biological material
ContaminationCompound which was putinto the sample subsequently eg through chromatographic column
ArtefactMS-specific bdquokey ionsldquo eg CI with CH4 as ionisation gasCH4 + e- CH4
+bull (formation of primary ion)CH4
+bull CH3+ + Hbull
CH3+ + CH4 C2H5
+ + H2 formation of adducts with mz +28
Impurities - Contamination - Artefacts
Contamination
SourceDetection
EI CI FAB MALDI ESI
Alkali salts Solvents glas etc - ++ ++++
Heavy metal salts
Sample vessels HPLC pumps
- ++ ++
Alkyl(benzol)sulfonate
Columns IE detergents
- ++ -+
Alkylammounium salts
Columns IE detergents
- ++ ++++
HC Grease + + ++
Polyphenylether
Grease pump oil + + ++
Longchain carbonic acids
Chromatographic columns
++ + (+)(+)
Siloxane Silicon grease DC plate plastic
++ + -(+)
General Sample Handling
Mass spectrometry is a sensitive technique (for impurities and contamination too)
Sample Storagendash Glass vials can leach salts (NaK) into samplendash Ideal storage vial is siliconized polypropylene tubes
Use Freshly prepared high purity reagents and water
Omit high concentrations of buffer salts ( NaCl KH2PO4) Detergents (Tween Triton SDS)Urea guanidine salts Cleaning of the sample dialysis RP-HPLC Zip-Tips ion
exchange
Use of removable buffer salts (zB NH4Ac)
Use of removable solvents like water acetonitrile methanol
General Sample Handling
Use Freshly prepared high purity reagents and water
Omit high concentrations of buffer salts ( NaCl KH2PO4) Detergents (Tween Triton SDS)Urea guanidine salts Cleaning of the sample dialysis RP-HPLC Zip-Tips ion
exchange
Use of removable buffer salts (zB NH4Ac)
Use of removable solvents like water acetonitrile methanol
Mass Spectra of Synthetic Polymers
Information monomer unit end group average masses
Mn = (NiMi) MiMw = (NiMi2) (NiMi)
polydispersity D = MwMn
ProblemsSynthetic polymers are polydisperse bad signal-noise-ratio bdquomass discriminationldquodetector saumlttigung at D gt 11Polymers without ionisationable functional groups metal ion add-onzB Polystyrol Ag+ PEG Na+ K+ etc
Mass Spectra of Synthetic PolymersMass Spectra of Synthetic Polymers
2 0 0 0 3 0 0 0 4 0 0 0 5 0 0 0 6 0 0 0 7 0 0 0 8 0 0 0 9 0 0 0 1 0 0 0 0 m z0
2 0 0 0
4 0 0 0
6 0 0 0
I n t e n s
CH -O-C-CH -CH-C-CH -CH-C-O-CH3 2 2 3
O OCH3 CH3O[ [n
Linear Mode
Reflektor Mode
CH-(CHO)-OH+Na324x+1067
11111155
1199
1023
979
935 1243
15 + 44x+17 +23
Mass Spectra of Synthetic Polymers
New aspects in mass spectrometry
Hybrid Mass Spectrometers
Perhaps hundreds of hybrids have been exploredSome of the more successfulTriple quadrupoleIT-TOFQ-TOFQuadrupole-FTMSTOFTOF
New aspects in mass spectrometry
FT-ICR-MS
FT-ICR-MS instrument general scheme
Fouriertransform-ICR New Dimensions of High Performance Mass Spectrometry
A high-frequency mass spectrometer in which the cyclotron motion of ions having different mz ratios in a constant magnetic field is excited essentially simultaneously and coherently by a pulse of a radio-frequency electric field applied perpendicularly to the magnetic field
The excited cyclotron motion of the ions is subsequently detected on receiver plates as a time domain signal that contains all the cyclotron frequencies excited
Fourier transformation of the time domain signal results in the frequency domain FT-ICR signal which on the basis of the inverse proportionality between frequency and mz ratio can be converted to a mass spectrum
The ions are to be detected with a selected mz ratio absorb maximum energy through the effect of a high-frequency field and a constant magnetic field perpendicular to it Maximum energy is gained by ions that satisfy the cyclotron resonance condition and as a result these are separated from ions of different masscharge
FTICR New Dimensions of High Performance Mass Spectrometry
High mass resolution gt 3 000 000
Accuracy of mass determination lt 01 ppm Sensitivity (ESI Octapeptide) ca 50 attomol
Structure-specific fragmentation MSMS MSn
FTICR New Dimensions of High Performance Mass Spectrometry
Ions are trapped and oscillate with low incoherent thermal amplitude
Excitation sweeps resonant ions into a large coherent cyclotron orbit
Preamplifier and digitizer pick up the induced potentials on the cell
FTICR New Dimensions of High Performance Mass Spectrometry
The frequency of the cyclotron gyration of an ion is inversely proportional to its mass-to-charge ratio (mq) and directly proportional to the strength of the applied magnetic field B
FTICR New Dimensions of High Performance Mass Spectrometry
FTICR New Dimensions of High Performance Mass Spectrometry
In the presence of a magnetic field sample ions orbit according to cyclotron frequency fcbull Cyclotron frequency related to charge of ion (z) magnetic field strength (B) and mass of ion (m)
All ions of same mz will have same cyclotron frequency at a fixed B and will move in a coherent ion packet
FTICR New Dimensions of High Performance Mass Spectrometry
Ion packets produce a detectable image current on the detector cell plates
As the ion(s) in a circular orbit approach the top plate electrons are attracted to this plate from ground Then as the ion(s) circulate towards the bottom plate the electrons travel back down to the bottom plate This motion of electrons moving back and forth between the two plates produces a detectable current
FTICR New Dimensions of High Performance Mass Spectrometry
Image is Fourier transformed to obtain the component frequencies and amplitudes (intensity) of the various ionsCyclotron frequency value is converted into a mz value to produce mass spectrum with the appropriate intensities
FTICR New Dimensions of High Performance Mass Spectrometry
The End
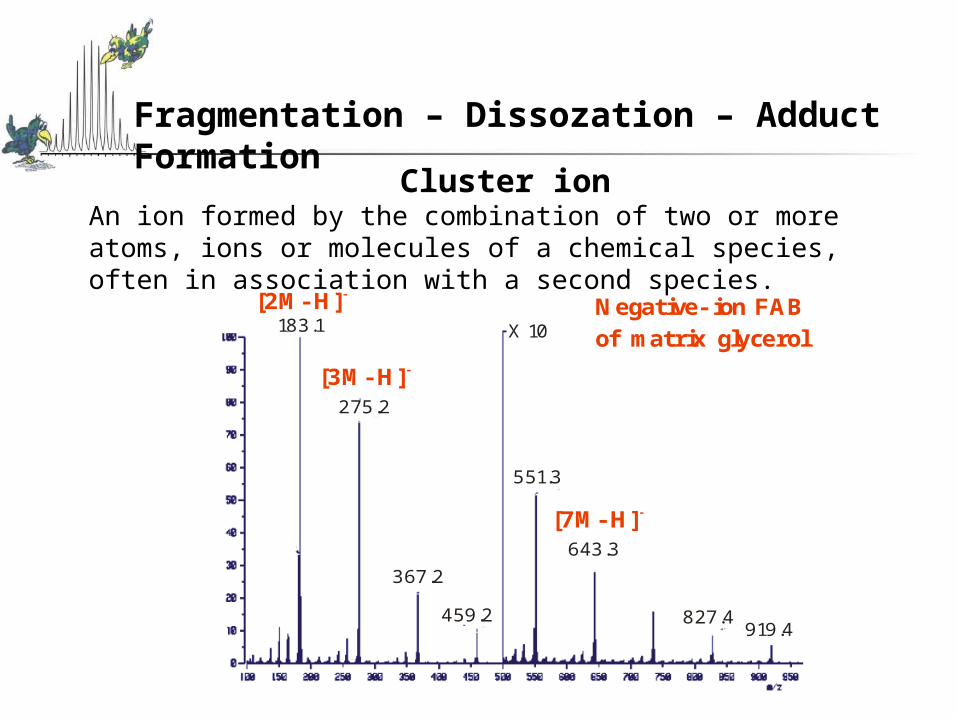

Fragment ion An electrically charged dissociation product of an ionic fragmentation Such an ion may fragmentate further to produce other electrically charged molecular or atomic moieties of successively lower formula weight
Fragmentation Break Of Covalent BondDissociation Break of Non-covalent complex
Fragmentation ndash Dissozation ndash Adduct Formation
bdquoHardldquoIonisation
bdquoSoftldquoIonisation
EI CI MALDIFAB ESI
Fragmentation ndash Dissozation ndash Adduct Formation
New SoftwareACDMS Fragmenter
predicting of possible schemes of mass spectral fragmentation for chemical structures
Selection fragmentation-rule parameters to mimic different ionization techniques that range from EI to low energy protonation techniques such as ESI or APCI
Recognition of fragments within an aquired mass spectra
Fragmentation ndash Dissozation ndash Adduct Formation
1000 1250 1500 1750 2000 2250 2500 2750 30000
20
40
60
80
100
CuL+
(Ac3T)2phen
sig
na
l in
ten
sity
mz
CuL2
+
1000 1250 1500 1750 2000 2250 2500 2750 30000
20
40
60
80
100CuL
2
+
CuL+
Sig
na
l In
ten
sity
mz
TMS-protected complex deprotected complex
N
SSS
BuBuBu
Bu
N
RN
NS S S
Bu Bu Bu Bu
R
S S S
Bu Bu BuBu
R
SSS
BuBuBu
Bu
R
Cu+
BF4-
R = TMS H
Fragmentation ndash Dissozation ndash Adduct Formation
600 700 800 mz
1000
2000
3000
4000
5000
6000
7000
8000
9000
10000
11000
ai
6546
8109
OO
N NNi
N N
Impurities - Contamination - Artefacts
Impurity eg antioxidantia in organic solvents side products not separated after synthesis additional components after insufficient isolation from biological material
ContaminationCompound which was putinto the sample subsequently eg through chromatographic column
ArtefactMS-specific bdquokey ionsldquo eg CI with CH4 as ionisation gasCH4 + e- CH4
+bull (formation of primary ion)CH4
+bull CH3+ + Hbull
CH3+ + CH4 C2H5
+ + H2 formation of adducts with mz +28
Impurities - Contamination - Artefacts
Contamination
SourceDetection
EI CI FAB MALDI ESI
Alkali salts Solvents glas etc - ++ ++++
Heavy metal salts
Sample vessels HPLC pumps
- ++ ++
Alkyl(benzol)sulfonate
Columns IE detergents
- ++ -+
Alkylammounium salts
Columns IE detergents
- ++ ++++
HC Grease + + ++
Polyphenylether
Grease pump oil + + ++
Longchain carbonic acids
Chromatographic columns
++ + (+)(+)
Siloxane Silicon grease DC plate plastic
++ + -(+)
General Sample Handling
Mass spectrometry is a sensitive technique (for impurities and contamination too)
Sample Storagendash Glass vials can leach salts (NaK) into samplendash Ideal storage vial is siliconized polypropylene tubes
Use Freshly prepared high purity reagents and water
Omit high concentrations of buffer salts ( NaCl KH2PO4) Detergents (Tween Triton SDS)Urea guanidine salts Cleaning of the sample dialysis RP-HPLC Zip-Tips ion
exchange
Use of removable buffer salts (zB NH4Ac)
Use of removable solvents like water acetonitrile methanol
General Sample Handling
Use Freshly prepared high purity reagents and water
Omit high concentrations of buffer salts ( NaCl KH2PO4) Detergents (Tween Triton SDS)Urea guanidine salts Cleaning of the sample dialysis RP-HPLC Zip-Tips ion
exchange
Use of removable buffer salts (zB NH4Ac)
Use of removable solvents like water acetonitrile methanol
Mass Spectra of Synthetic Polymers
Information monomer unit end group average masses
Mn = (NiMi) MiMw = (NiMi2) (NiMi)
polydispersity D = MwMn
ProblemsSynthetic polymers are polydisperse bad signal-noise-ratio bdquomass discriminationldquodetector saumlttigung at D gt 11Polymers without ionisationable functional groups metal ion add-onzB Polystyrol Ag+ PEG Na+ K+ etc
Mass Spectra of Synthetic PolymersMass Spectra of Synthetic Polymers
2 0 0 0 3 0 0 0 4 0 0 0 5 0 0 0 6 0 0 0 7 0 0 0 8 0 0 0 9 0 0 0 1 0 0 0 0 m z0
2 0 0 0
4 0 0 0
6 0 0 0
I n t e n s
CH -O-C-CH -CH-C-CH -CH-C-O-CH3 2 2 3
O OCH3 CH3O[ [n
Linear Mode
Reflektor Mode
CH-(CHO)-OH+Na324x+1067
11111155
1199
1023
979
935 1243
15 + 44x+17 +23
Mass Spectra of Synthetic Polymers
New aspects in mass spectrometry
Hybrid Mass Spectrometers
Perhaps hundreds of hybrids have been exploredSome of the more successfulTriple quadrupoleIT-TOFQ-TOFQuadrupole-FTMSTOFTOF
New aspects in mass spectrometry
FT-ICR-MS
FT-ICR-MS instrument general scheme
Fouriertransform-ICR New Dimensions of High Performance Mass Spectrometry
A high-frequency mass spectrometer in which the cyclotron motion of ions having different mz ratios in a constant magnetic field is excited essentially simultaneously and coherently by a pulse of a radio-frequency electric field applied perpendicularly to the magnetic field
The excited cyclotron motion of the ions is subsequently detected on receiver plates as a time domain signal that contains all the cyclotron frequencies excited
Fourier transformation of the time domain signal results in the frequency domain FT-ICR signal which on the basis of the inverse proportionality between frequency and mz ratio can be converted to a mass spectrum
The ions are to be detected with a selected mz ratio absorb maximum energy through the effect of a high-frequency field and a constant magnetic field perpendicular to it Maximum energy is gained by ions that satisfy the cyclotron resonance condition and as a result these are separated from ions of different masscharge
FTICR New Dimensions of High Performance Mass Spectrometry
High mass resolution gt 3 000 000
Accuracy of mass determination lt 01 ppm Sensitivity (ESI Octapeptide) ca 50 attomol
Structure-specific fragmentation MSMS MSn
FTICR New Dimensions of High Performance Mass Spectrometry
Ions are trapped and oscillate with low incoherent thermal amplitude
Excitation sweeps resonant ions into a large coherent cyclotron orbit
Preamplifier and digitizer pick up the induced potentials on the cell
FTICR New Dimensions of High Performance Mass Spectrometry
The frequency of the cyclotron gyration of an ion is inversely proportional to its mass-to-charge ratio (mq) and directly proportional to the strength of the applied magnetic field B
FTICR New Dimensions of High Performance Mass Spectrometry
FTICR New Dimensions of High Performance Mass Spectrometry
In the presence of a magnetic field sample ions orbit according to cyclotron frequency fcbull Cyclotron frequency related to charge of ion (z) magnetic field strength (B) and mass of ion (m)
All ions of same mz will have same cyclotron frequency at a fixed B and will move in a coherent ion packet
FTICR New Dimensions of High Performance Mass Spectrometry
Ion packets produce a detectable image current on the detector cell plates
As the ion(s) in a circular orbit approach the top plate electrons are attracted to this plate from ground Then as the ion(s) circulate towards the bottom plate the electrons travel back down to the bottom plate This motion of electrons moving back and forth between the two plates produces a detectable current
FTICR New Dimensions of High Performance Mass Spectrometry
Image is Fourier transformed to obtain the component frequencies and amplitudes (intensity) of the various ionsCyclotron frequency value is converted into a mz value to produce mass spectrum with the appropriate intensities
FTICR New Dimensions of High Performance Mass Spectrometry
The End
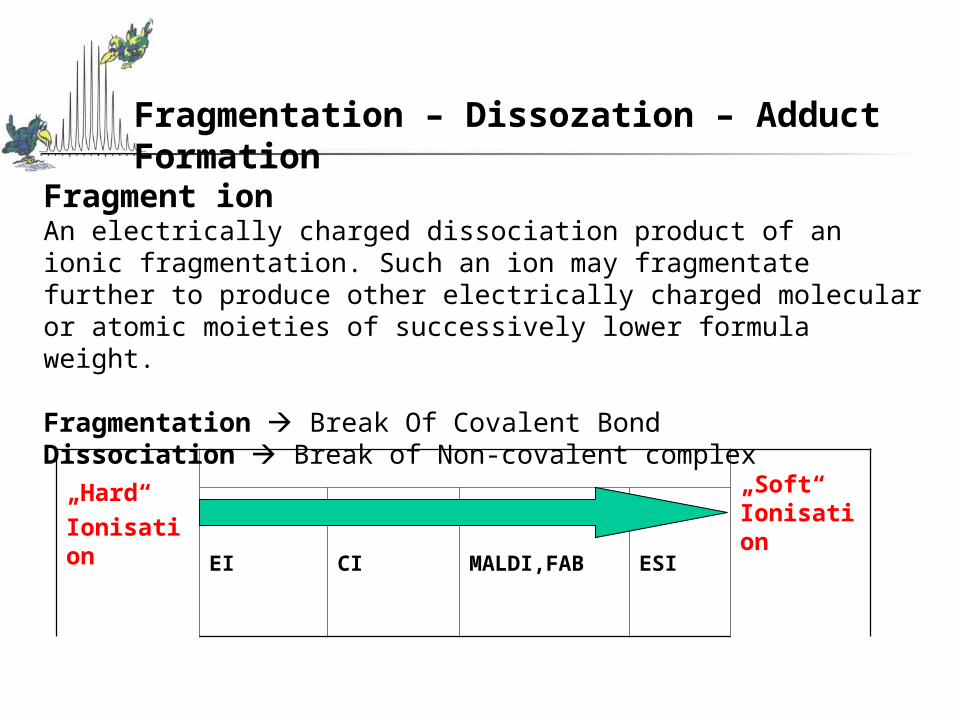
Fragment ion An electrically charged dissociation product of an ionic fragmentation Such an ion may fragmentate further to produce other electrically charged molecular or atomic moieties of successively lower formula weight
Fragmentation Break Of Covalent BondDissociation Break of Non-covalent complex
Fragmentation ndash Dissozation ndash Adduct Formation
bdquoHardldquoIonisation
bdquoSoftldquoIonisation
EI CI MALDIFAB ESI
Fragmentation ndash Dissozation ndash Adduct Formation
New SoftwareACDMS Fragmenter
predicting of possible schemes of mass spectral fragmentation for chemical structures
Selection fragmentation-rule parameters to mimic different ionization techniques that range from EI to low energy protonation techniques such as ESI or APCI
Recognition of fragments within an aquired mass spectra
Fragmentation ndash Dissozation ndash Adduct Formation
1000 1250 1500 1750 2000 2250 2500 2750 30000
20
40
60
80
100
CuL+
(Ac3T)2phen
sig
na
l in
ten
sity
mz
CuL2
+
1000 1250 1500 1750 2000 2250 2500 2750 30000
20
40
60
80
100CuL
2
+
CuL+
Sig
na
l In
ten
sity
mz
TMS-protected complex deprotected complex
N
SSS
BuBuBu
Bu
N
RN
NS S S
Bu Bu Bu Bu
R
S S S
Bu Bu BuBu
R
SSS
BuBuBu
Bu
R
Cu+
BF4-
R = TMS H
Fragmentation ndash Dissozation ndash Adduct Formation
600 700 800 mz
1000
2000
3000
4000
5000
6000
7000
8000
9000
10000
11000
ai
6546
8109
OO
N NNi
N N
Impurities - Contamination - Artefacts
Impurity eg antioxidantia in organic solvents side products not separated after synthesis additional components after insufficient isolation from biological material
ContaminationCompound which was putinto the sample subsequently eg through chromatographic column
ArtefactMS-specific bdquokey ionsldquo eg CI with CH4 as ionisation gasCH4 + e- CH4
+bull (formation of primary ion)CH4
+bull CH3+ + Hbull
CH3+ + CH4 C2H5
+ + H2 formation of adducts with mz +28
Impurities - Contamination - Artefacts
Contamination
SourceDetection
EI CI FAB MALDI ESI
Alkali salts Solvents glas etc - ++ ++++
Heavy metal salts
Sample vessels HPLC pumps
- ++ ++
Alkyl(benzol)sulfonate
Columns IE detergents
- ++ -+
Alkylammounium salts
Columns IE detergents
- ++ ++++
HC Grease + + ++
Polyphenylether
Grease pump oil + + ++
Longchain carbonic acids
Chromatographic columns
++ + (+)(+)
Siloxane Silicon grease DC plate plastic
++ + -(+)
General Sample Handling
Mass spectrometry is a sensitive technique (for impurities and contamination too)
Sample Storagendash Glass vials can leach salts (NaK) into samplendash Ideal storage vial is siliconized polypropylene tubes
Use Freshly prepared high purity reagents and water
Omit high concentrations of buffer salts ( NaCl KH2PO4) Detergents (Tween Triton SDS)Urea guanidine salts Cleaning of the sample dialysis RP-HPLC Zip-Tips ion
exchange
Use of removable buffer salts (zB NH4Ac)
Use of removable solvents like water acetonitrile methanol
General Sample Handling
Use Freshly prepared high purity reagents and water
Omit high concentrations of buffer salts ( NaCl KH2PO4) Detergents (Tween Triton SDS)Urea guanidine salts Cleaning of the sample dialysis RP-HPLC Zip-Tips ion
exchange
Use of removable buffer salts (zB NH4Ac)
Use of removable solvents like water acetonitrile methanol
Mass Spectra of Synthetic Polymers
Information monomer unit end group average masses
Mn = (NiMi) MiMw = (NiMi2) (NiMi)
polydispersity D = MwMn
ProblemsSynthetic polymers are polydisperse bad signal-noise-ratio bdquomass discriminationldquodetector saumlttigung at D gt 11Polymers without ionisationable functional groups metal ion add-onzB Polystyrol Ag+ PEG Na+ K+ etc
Mass Spectra of Synthetic PolymersMass Spectra of Synthetic Polymers
2 0 0 0 3 0 0 0 4 0 0 0 5 0 0 0 6 0 0 0 7 0 0 0 8 0 0 0 9 0 0 0 1 0 0 0 0 m z0
2 0 0 0
4 0 0 0
6 0 0 0
I n t e n s
CH -O-C-CH -CH-C-CH -CH-C-O-CH3 2 2 3
O OCH3 CH3O[ [n
Linear Mode
Reflektor Mode
CH-(CHO)-OH+Na324x+1067
11111155
1199
1023
979
935 1243
15 + 44x+17 +23
Mass Spectra of Synthetic Polymers
New aspects in mass spectrometry
Hybrid Mass Spectrometers
Perhaps hundreds of hybrids have been exploredSome of the more successfulTriple quadrupoleIT-TOFQ-TOFQuadrupole-FTMSTOFTOF
New aspects in mass spectrometry
FT-ICR-MS
FT-ICR-MS instrument general scheme
Fouriertransform-ICR New Dimensions of High Performance Mass Spectrometry
A high-frequency mass spectrometer in which the cyclotron motion of ions having different mz ratios in a constant magnetic field is excited essentially simultaneously and coherently by a pulse of a radio-frequency electric field applied perpendicularly to the magnetic field
The excited cyclotron motion of the ions is subsequently detected on receiver plates as a time domain signal that contains all the cyclotron frequencies excited
Fourier transformation of the time domain signal results in the frequency domain FT-ICR signal which on the basis of the inverse proportionality between frequency and mz ratio can be converted to a mass spectrum
The ions are to be detected with a selected mz ratio absorb maximum energy through the effect of a high-frequency field and a constant magnetic field perpendicular to it Maximum energy is gained by ions that satisfy the cyclotron resonance condition and as a result these are separated from ions of different masscharge
FTICR New Dimensions of High Performance Mass Spectrometry
High mass resolution gt 3 000 000
Accuracy of mass determination lt 01 ppm Sensitivity (ESI Octapeptide) ca 50 attomol
Structure-specific fragmentation MSMS MSn
FTICR New Dimensions of High Performance Mass Spectrometry
Ions are trapped and oscillate with low incoherent thermal amplitude
Excitation sweeps resonant ions into a large coherent cyclotron orbit
Preamplifier and digitizer pick up the induced potentials on the cell
FTICR New Dimensions of High Performance Mass Spectrometry
The frequency of the cyclotron gyration of an ion is inversely proportional to its mass-to-charge ratio (mq) and directly proportional to the strength of the applied magnetic field B
FTICR New Dimensions of High Performance Mass Spectrometry
FTICR New Dimensions of High Performance Mass Spectrometry
In the presence of a magnetic field sample ions orbit according to cyclotron frequency fcbull Cyclotron frequency related to charge of ion (z) magnetic field strength (B) and mass of ion (m)
All ions of same mz will have same cyclotron frequency at a fixed B and will move in a coherent ion packet
FTICR New Dimensions of High Performance Mass Spectrometry
Ion packets produce a detectable image current on the detector cell plates
As the ion(s) in a circular orbit approach the top plate electrons are attracted to this plate from ground Then as the ion(s) circulate towards the bottom plate the electrons travel back down to the bottom plate This motion of electrons moving back and forth between the two plates produces a detectable current
FTICR New Dimensions of High Performance Mass Spectrometry
Image is Fourier transformed to obtain the component frequencies and amplitudes (intensity) of the various ionsCyclotron frequency value is converted into a mz value to produce mass spectrum with the appropriate intensities
FTICR New Dimensions of High Performance Mass Spectrometry
The End

Fragmentation ndash Dissozation ndash Adduct Formation
1000 1250 1500 1750 2000 2250 2500 2750 30000
20
40
60
80
100
CuL+
(Ac3T)2phen
sig
na
l in
ten
sity
mz
CuL2
+
1000 1250 1500 1750 2000 2250 2500 2750 30000
20
40
60
80
100CuL
2
+
CuL+
Sig
na
l In
ten
sity
mz
TMS-protected complex deprotected complex
N
SSS
BuBuBu
Bu
N
RN
NS S S
Bu Bu Bu Bu
R
S S S
Bu Bu BuBu
R
SSS
BuBuBu
Bu
R
Cu+
BF4-
R = TMS H
Fragmentation ndash Dissozation ndash Adduct Formation
600 700 800 mz
1000
2000
3000
4000
5000
6000
7000
8000
9000
10000
11000
ai
6546
8109
OO
N NNi
N N
Impurities - Contamination - Artefacts
Impurity eg antioxidantia in organic solvents side products not separated after synthesis additional components after insufficient isolation from biological material
ContaminationCompound which was putinto the sample subsequently eg through chromatographic column
ArtefactMS-specific bdquokey ionsldquo eg CI with CH4 as ionisation gasCH4 + e- CH4
+bull (formation of primary ion)CH4
+bull CH3+ + Hbull
CH3+ + CH4 C2H5
+ + H2 formation of adducts with mz +28
Impurities - Contamination - Artefacts
Contamination
SourceDetection
EI CI FAB MALDI ESI
Alkali salts Solvents glas etc - ++ ++++
Heavy metal salts
Sample vessels HPLC pumps
- ++ ++
Alkyl(benzol)sulfonate
Columns IE detergents
- ++ -+
Alkylammounium salts
Columns IE detergents
- ++ ++++
HC Grease + + ++
Polyphenylether
Grease pump oil + + ++
Longchain carbonic acids
Chromatographic columns
++ + (+)(+)
Siloxane Silicon grease DC plate plastic
++ + -(+)
General Sample Handling
Mass spectrometry is a sensitive technique (for impurities and contamination too)
Sample Storagendash Glass vials can leach salts (NaK) into samplendash Ideal storage vial is siliconized polypropylene tubes
Use Freshly prepared high purity reagents and water
Omit high concentrations of buffer salts ( NaCl KH2PO4) Detergents (Tween Triton SDS)Urea guanidine salts Cleaning of the sample dialysis RP-HPLC Zip-Tips ion
exchange
Use of removable buffer salts (zB NH4Ac)
Use of removable solvents like water acetonitrile methanol
General Sample Handling
Use Freshly prepared high purity reagents and water
Omit high concentrations of buffer salts ( NaCl KH2PO4) Detergents (Tween Triton SDS)Urea guanidine salts Cleaning of the sample dialysis RP-HPLC Zip-Tips ion
exchange
Use of removable buffer salts (zB NH4Ac)
Use of removable solvents like water acetonitrile methanol
Mass Spectra of Synthetic Polymers
Information monomer unit end group average masses
Mn = (NiMi) MiMw = (NiMi2) (NiMi)
polydispersity D = MwMn
ProblemsSynthetic polymers are polydisperse bad signal-noise-ratio bdquomass discriminationldquodetector saumlttigung at D gt 11Polymers without ionisationable functional groups metal ion add-onzB Polystyrol Ag+ PEG Na+ K+ etc
Mass Spectra of Synthetic PolymersMass Spectra of Synthetic Polymers
2 0 0 0 3 0 0 0 4 0 0 0 5 0 0 0 6 0 0 0 7 0 0 0 8 0 0 0 9 0 0 0 1 0 0 0 0 m z0
2 0 0 0
4 0 0 0
6 0 0 0
I n t e n s
CH -O-C-CH -CH-C-CH -CH-C-O-CH3 2 2 3
O OCH3 CH3O[ [n
Linear Mode
Reflektor Mode
CH-(CHO)-OH+Na324x+1067
11111155
1199
1023
979
935 1243
15 + 44x+17 +23
Mass Spectra of Synthetic Polymers
New aspects in mass spectrometry
Hybrid Mass Spectrometers
Perhaps hundreds of hybrids have been exploredSome of the more successfulTriple quadrupoleIT-TOFQ-TOFQuadrupole-FTMSTOFTOF
New aspects in mass spectrometry
FT-ICR-MS
FT-ICR-MS instrument general scheme
Fouriertransform-ICR New Dimensions of High Performance Mass Spectrometry
A high-frequency mass spectrometer in which the cyclotron motion of ions having different mz ratios in a constant magnetic field is excited essentially simultaneously and coherently by a pulse of a radio-frequency electric field applied perpendicularly to the magnetic field
The excited cyclotron motion of the ions is subsequently detected on receiver plates as a time domain signal that contains all the cyclotron frequencies excited
Fourier transformation of the time domain signal results in the frequency domain FT-ICR signal which on the basis of the inverse proportionality between frequency and mz ratio can be converted to a mass spectrum
The ions are to be detected with a selected mz ratio absorb maximum energy through the effect of a high-frequency field and a constant magnetic field perpendicular to it Maximum energy is gained by ions that satisfy the cyclotron resonance condition and as a result these are separated from ions of different masscharge
FTICR New Dimensions of High Performance Mass Spectrometry
High mass resolution gt 3 000 000
Accuracy of mass determination lt 01 ppm Sensitivity (ESI Octapeptide) ca 50 attomol
Structure-specific fragmentation MSMS MSn
FTICR New Dimensions of High Performance Mass Spectrometry
Ions are trapped and oscillate with low incoherent thermal amplitude
Excitation sweeps resonant ions into a large coherent cyclotron orbit
Preamplifier and digitizer pick up the induced potentials on the cell
FTICR New Dimensions of High Performance Mass Spectrometry
The frequency of the cyclotron gyration of an ion is inversely proportional to its mass-to-charge ratio (mq) and directly proportional to the strength of the applied magnetic field B
FTICR New Dimensions of High Performance Mass Spectrometry
FTICR New Dimensions of High Performance Mass Spectrometry
In the presence of a magnetic field sample ions orbit according to cyclotron frequency fcbull Cyclotron frequency related to charge of ion (z) magnetic field strength (B) and mass of ion (m)
All ions of same mz will have same cyclotron frequency at a fixed B and will move in a coherent ion packet
FTICR New Dimensions of High Performance Mass Spectrometry
Ion packets produce a detectable image current on the detector cell plates
As the ion(s) in a circular orbit approach the top plate electrons are attracted to this plate from ground Then as the ion(s) circulate towards the bottom plate the electrons travel back down to the bottom plate This motion of electrons moving back and forth between the two plates produces a detectable current
FTICR New Dimensions of High Performance Mass Spectrometry
Image is Fourier transformed to obtain the component frequencies and amplitudes (intensity) of the various ionsCyclotron frequency value is converted into a mz value to produce mass spectrum with the appropriate intensities
FTICR New Dimensions of High Performance Mass Spectrometry
The End

Fragmentation ndash Dissozation ndash Adduct Formation
600 700 800 mz
1000
2000
3000
4000
5000
6000
7000
8000
9000
10000
11000
ai
6546
8109
OO
N NNi
N N
Impurities - Contamination - Artefacts
Impurity eg antioxidantia in organic solvents side products not separated after synthesis additional components after insufficient isolation from biological material
ContaminationCompound which was putinto the sample subsequently eg through chromatographic column
ArtefactMS-specific bdquokey ionsldquo eg CI with CH4 as ionisation gasCH4 + e- CH4
+bull (formation of primary ion)CH4
+bull CH3+ + Hbull
CH3+ + CH4 C2H5
+ + H2 formation of adducts with mz +28
Impurities - Contamination - Artefacts
Contamination
SourceDetection
EI CI FAB MALDI ESI
Alkali salts Solvents glas etc - ++ ++++
Heavy metal salts
Sample vessels HPLC pumps
- ++ ++
Alkyl(benzol)sulfonate
Columns IE detergents
- ++ -+
Alkylammounium salts
Columns IE detergents
- ++ ++++
HC Grease + + ++
Polyphenylether
Grease pump oil + + ++
Longchain carbonic acids
Chromatographic columns
++ + (+)(+)
Siloxane Silicon grease DC plate plastic
++ + -(+)
General Sample Handling
Mass spectrometry is a sensitive technique (for impurities and contamination too)
Sample Storagendash Glass vials can leach salts (NaK) into samplendash Ideal storage vial is siliconized polypropylene tubes
Use Freshly prepared high purity reagents and water
Omit high concentrations of buffer salts ( NaCl KH2PO4) Detergents (Tween Triton SDS)Urea guanidine salts Cleaning of the sample dialysis RP-HPLC Zip-Tips ion
exchange
Use of removable buffer salts (zB NH4Ac)
Use of removable solvents like water acetonitrile methanol
General Sample Handling
Use Freshly prepared high purity reagents and water
Omit high concentrations of buffer salts ( NaCl KH2PO4) Detergents (Tween Triton SDS)Urea guanidine salts Cleaning of the sample dialysis RP-HPLC Zip-Tips ion
exchange
Use of removable buffer salts (zB NH4Ac)
Use of removable solvents like water acetonitrile methanol
Mass Spectra of Synthetic Polymers
Information monomer unit end group average masses
Mn = (NiMi) MiMw = (NiMi2) (NiMi)
polydispersity D = MwMn
ProblemsSynthetic polymers are polydisperse bad signal-noise-ratio bdquomass discriminationldquodetector saumlttigung at D gt 11Polymers without ionisationable functional groups metal ion add-onzB Polystyrol Ag+ PEG Na+ K+ etc
Mass Spectra of Synthetic PolymersMass Spectra of Synthetic Polymers
2 0 0 0 3 0 0 0 4 0 0 0 5 0 0 0 6 0 0 0 7 0 0 0 8 0 0 0 9 0 0 0 1 0 0 0 0 m z0
2 0 0 0
4 0 0 0
6 0 0 0
I n t e n s
CH -O-C-CH -CH-C-CH -CH-C-O-CH3 2 2 3
O OCH3 CH3O[ [n
Linear Mode
Reflektor Mode
CH-(CHO)-OH+Na324x+1067
11111155
1199
1023
979
935 1243
15 + 44x+17 +23
Mass Spectra of Synthetic Polymers
New aspects in mass spectrometry
Hybrid Mass Spectrometers
Perhaps hundreds of hybrids have been exploredSome of the more successfulTriple quadrupoleIT-TOFQ-TOFQuadrupole-FTMSTOFTOF
New aspects in mass spectrometry
FT-ICR-MS
FT-ICR-MS instrument general scheme
Fouriertransform-ICR New Dimensions of High Performance Mass Spectrometry
A high-frequency mass spectrometer in which the cyclotron motion of ions having different mz ratios in a constant magnetic field is excited essentially simultaneously and coherently by a pulse of a radio-frequency electric field applied perpendicularly to the magnetic field
The excited cyclotron motion of the ions is subsequently detected on receiver plates as a time domain signal that contains all the cyclotron frequencies excited
Fourier transformation of the time domain signal results in the frequency domain FT-ICR signal which on the basis of the inverse proportionality between frequency and mz ratio can be converted to a mass spectrum
The ions are to be detected with a selected mz ratio absorb maximum energy through the effect of a high-frequency field and a constant magnetic field perpendicular to it Maximum energy is gained by ions that satisfy the cyclotron resonance condition and as a result these are separated from ions of different masscharge
FTICR New Dimensions of High Performance Mass Spectrometry
High mass resolution gt 3 000 000
Accuracy of mass determination lt 01 ppm Sensitivity (ESI Octapeptide) ca 50 attomol
Structure-specific fragmentation MSMS MSn
FTICR New Dimensions of High Performance Mass Spectrometry
Ions are trapped and oscillate with low incoherent thermal amplitude
Excitation sweeps resonant ions into a large coherent cyclotron orbit
Preamplifier and digitizer pick up the induced potentials on the cell
FTICR New Dimensions of High Performance Mass Spectrometry
The frequency of the cyclotron gyration of an ion is inversely proportional to its mass-to-charge ratio (mq) and directly proportional to the strength of the applied magnetic field B
FTICR New Dimensions of High Performance Mass Spectrometry
FTICR New Dimensions of High Performance Mass Spectrometry
In the presence of a magnetic field sample ions orbit according to cyclotron frequency fcbull Cyclotron frequency related to charge of ion (z) magnetic field strength (B) and mass of ion (m)
All ions of same mz will have same cyclotron frequency at a fixed B and will move in a coherent ion packet
FTICR New Dimensions of High Performance Mass Spectrometry
Ion packets produce a detectable image current on the detector cell plates
As the ion(s) in a circular orbit approach the top plate electrons are attracted to this plate from ground Then as the ion(s) circulate towards the bottom plate the electrons travel back down to the bottom plate This motion of electrons moving back and forth between the two plates produces a detectable current
FTICR New Dimensions of High Performance Mass Spectrometry
Image is Fourier transformed to obtain the component frequencies and amplitudes (intensity) of the various ionsCyclotron frequency value is converted into a mz value to produce mass spectrum with the appropriate intensities
FTICR New Dimensions of High Performance Mass Spectrometry
The End

Impurities - Contamination - Artefacts
Impurity eg antioxidantia in organic solvents side products not separated after synthesis additional components after insufficient isolation from biological material
ContaminationCompound which was putinto the sample subsequently eg through chromatographic column
ArtefactMS-specific bdquokey ionsldquo eg CI with CH4 as ionisation gasCH4 + e- CH4
+bull (formation of primary ion)CH4
+bull CH3+ + Hbull
CH3+ + CH4 C2H5
+ + H2 formation of adducts with mz +28
Impurities - Contamination - Artefacts
Contamination
SourceDetection
EI CI FAB MALDI ESI
Alkali salts Solvents glas etc - ++ ++++
Heavy metal salts
Sample vessels HPLC pumps
- ++ ++
Alkyl(benzol)sulfonate
Columns IE detergents
- ++ -+
Alkylammounium salts
Columns IE detergents
- ++ ++++
HC Grease + + ++
Polyphenylether
Grease pump oil + + ++
Longchain carbonic acids
Chromatographic columns
++ + (+)(+)
Siloxane Silicon grease DC plate plastic
++ + -(+)
General Sample Handling
Mass spectrometry is a sensitive technique (for impurities and contamination too)
Sample Storagendash Glass vials can leach salts (NaK) into samplendash Ideal storage vial is siliconized polypropylene tubes
Use Freshly prepared high purity reagents and water
Omit high concentrations of buffer salts ( NaCl KH2PO4) Detergents (Tween Triton SDS)Urea guanidine salts Cleaning of the sample dialysis RP-HPLC Zip-Tips ion
exchange
Use of removable buffer salts (zB NH4Ac)
Use of removable solvents like water acetonitrile methanol
General Sample Handling
Use Freshly prepared high purity reagents and water
Omit high concentrations of buffer salts ( NaCl KH2PO4) Detergents (Tween Triton SDS)Urea guanidine salts Cleaning of the sample dialysis RP-HPLC Zip-Tips ion
exchange
Use of removable buffer salts (zB NH4Ac)
Use of removable solvents like water acetonitrile methanol
Mass Spectra of Synthetic Polymers
Information monomer unit end group average masses
Mn = (NiMi) MiMw = (NiMi2) (NiMi)
polydispersity D = MwMn
ProblemsSynthetic polymers are polydisperse bad signal-noise-ratio bdquomass discriminationldquodetector saumlttigung at D gt 11Polymers without ionisationable functional groups metal ion add-onzB Polystyrol Ag+ PEG Na+ K+ etc
Mass Spectra of Synthetic PolymersMass Spectra of Synthetic Polymers
2 0 0 0 3 0 0 0 4 0 0 0 5 0 0 0 6 0 0 0 7 0 0 0 8 0 0 0 9 0 0 0 1 0 0 0 0 m z0
2 0 0 0
4 0 0 0
6 0 0 0
I n t e n s
CH -O-C-CH -CH-C-CH -CH-C-O-CH3 2 2 3
O OCH3 CH3O[ [n
Linear Mode
Reflektor Mode
CH-(CHO)-OH+Na324x+1067
11111155
1199
1023
979
935 1243
15 + 44x+17 +23
Mass Spectra of Synthetic Polymers
New aspects in mass spectrometry
Hybrid Mass Spectrometers
Perhaps hundreds of hybrids have been exploredSome of the more successfulTriple quadrupoleIT-TOFQ-TOFQuadrupole-FTMSTOFTOF
New aspects in mass spectrometry
FT-ICR-MS
FT-ICR-MS instrument general scheme
Fouriertransform-ICR New Dimensions of High Performance Mass Spectrometry
A high-frequency mass spectrometer in which the cyclotron motion of ions having different mz ratios in a constant magnetic field is excited essentially simultaneously and coherently by a pulse of a radio-frequency electric field applied perpendicularly to the magnetic field
The excited cyclotron motion of the ions is subsequently detected on receiver plates as a time domain signal that contains all the cyclotron frequencies excited
Fourier transformation of the time domain signal results in the frequency domain FT-ICR signal which on the basis of the inverse proportionality between frequency and mz ratio can be converted to a mass spectrum
The ions are to be detected with a selected mz ratio absorb maximum energy through the effect of a high-frequency field and a constant magnetic field perpendicular to it Maximum energy is gained by ions that satisfy the cyclotron resonance condition and as a result these are separated from ions of different masscharge
FTICR New Dimensions of High Performance Mass Spectrometry
High mass resolution gt 3 000 000
Accuracy of mass determination lt 01 ppm Sensitivity (ESI Octapeptide) ca 50 attomol
Structure-specific fragmentation MSMS MSn
FTICR New Dimensions of High Performance Mass Spectrometry
Ions are trapped and oscillate with low incoherent thermal amplitude
Excitation sweeps resonant ions into a large coherent cyclotron orbit
Preamplifier and digitizer pick up the induced potentials on the cell
FTICR New Dimensions of High Performance Mass Spectrometry
The frequency of the cyclotron gyration of an ion is inversely proportional to its mass-to-charge ratio (mq) and directly proportional to the strength of the applied magnetic field B
FTICR New Dimensions of High Performance Mass Spectrometry
FTICR New Dimensions of High Performance Mass Spectrometry
In the presence of a magnetic field sample ions orbit according to cyclotron frequency fcbull Cyclotron frequency related to charge of ion (z) magnetic field strength (B) and mass of ion (m)
All ions of same mz will have same cyclotron frequency at a fixed B and will move in a coherent ion packet
FTICR New Dimensions of High Performance Mass Spectrometry
Ion packets produce a detectable image current on the detector cell plates
As the ion(s) in a circular orbit approach the top plate electrons are attracted to this plate from ground Then as the ion(s) circulate towards the bottom plate the electrons travel back down to the bottom plate This motion of electrons moving back and forth between the two plates produces a detectable current
FTICR New Dimensions of High Performance Mass Spectrometry
Image is Fourier transformed to obtain the component frequencies and amplitudes (intensity) of the various ionsCyclotron frequency value is converted into a mz value to produce mass spectrum with the appropriate intensities
FTICR New Dimensions of High Performance Mass Spectrometry
The End
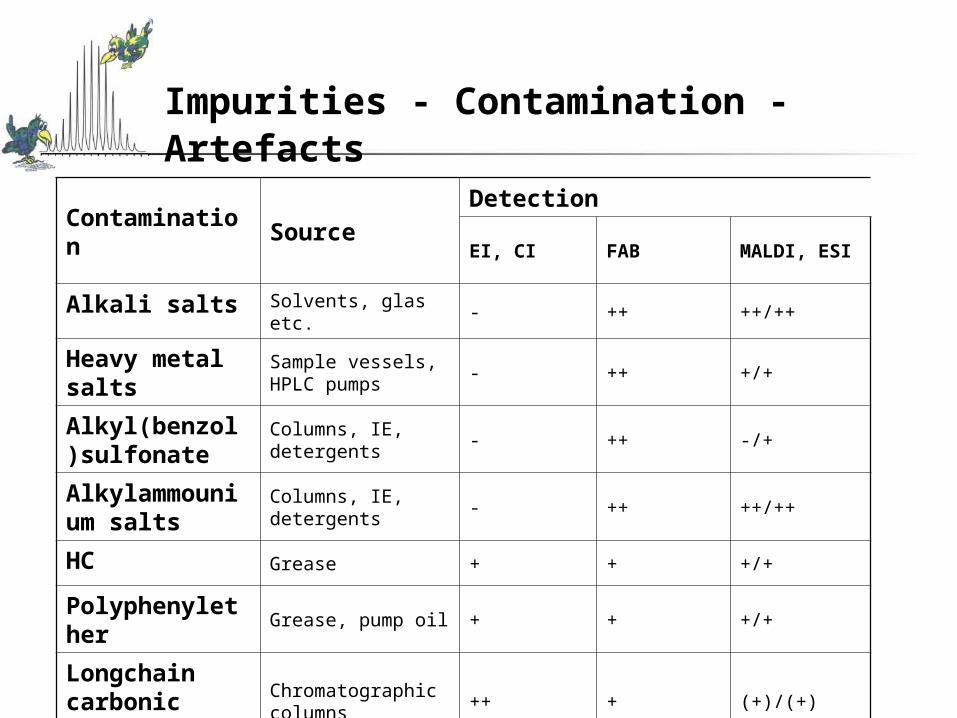
Impurities - Contamination - Artefacts
Contamination
SourceDetection
EI CI FAB MALDI ESI
Alkali salts Solvents glas etc - ++ ++++
Heavy metal salts
Sample vessels HPLC pumps
- ++ ++
Alkyl(benzol)sulfonate
Columns IE detergents
- ++ -+
Alkylammounium salts
Columns IE detergents
- ++ ++++
HC Grease + + ++
Polyphenylether
Grease pump oil + + ++
Longchain carbonic acids
Chromatographic columns
++ + (+)(+)
Siloxane Silicon grease DC plate plastic
++ + -(+)
General Sample Handling
Mass spectrometry is a sensitive technique (for impurities and contamination too)
Sample Storagendash Glass vials can leach salts (NaK) into samplendash Ideal storage vial is siliconized polypropylene tubes
Use Freshly prepared high purity reagents and water
Omit high concentrations of buffer salts ( NaCl KH2PO4) Detergents (Tween Triton SDS)Urea guanidine salts Cleaning of the sample dialysis RP-HPLC Zip-Tips ion
exchange
Use of removable buffer salts (zB NH4Ac)
Use of removable solvents like water acetonitrile methanol
General Sample Handling
Use Freshly prepared high purity reagents and water
Omit high concentrations of buffer salts ( NaCl KH2PO4) Detergents (Tween Triton SDS)Urea guanidine salts Cleaning of the sample dialysis RP-HPLC Zip-Tips ion
exchange
Use of removable buffer salts (zB NH4Ac)
Use of removable solvents like water acetonitrile methanol
Mass Spectra of Synthetic Polymers
Information monomer unit end group average masses
Mn = (NiMi) MiMw = (NiMi2) (NiMi)
polydispersity D = MwMn
ProblemsSynthetic polymers are polydisperse bad signal-noise-ratio bdquomass discriminationldquodetector saumlttigung at D gt 11Polymers without ionisationable functional groups metal ion add-onzB Polystyrol Ag+ PEG Na+ K+ etc
Mass Spectra of Synthetic PolymersMass Spectra of Synthetic Polymers
2 0 0 0 3 0 0 0 4 0 0 0 5 0 0 0 6 0 0 0 7 0 0 0 8 0 0 0 9 0 0 0 1 0 0 0 0 m z0
2 0 0 0
4 0 0 0
6 0 0 0
I n t e n s
CH -O-C-CH -CH-C-CH -CH-C-O-CH3 2 2 3
O OCH3 CH3O[ [n
Linear Mode
Reflektor Mode
CH-(CHO)-OH+Na324x+1067
11111155
1199
1023
979
935 1243
15 + 44x+17 +23
Mass Spectra of Synthetic Polymers
New aspects in mass spectrometry
Hybrid Mass Spectrometers
Perhaps hundreds of hybrids have been exploredSome of the more successfulTriple quadrupoleIT-TOFQ-TOFQuadrupole-FTMSTOFTOF
New aspects in mass spectrometry
FT-ICR-MS
FT-ICR-MS instrument general scheme
Fouriertransform-ICR New Dimensions of High Performance Mass Spectrometry
A high-frequency mass spectrometer in which the cyclotron motion of ions having different mz ratios in a constant magnetic field is excited essentially simultaneously and coherently by a pulse of a radio-frequency electric field applied perpendicularly to the magnetic field
The excited cyclotron motion of the ions is subsequently detected on receiver plates as a time domain signal that contains all the cyclotron frequencies excited
Fourier transformation of the time domain signal results in the frequency domain FT-ICR signal which on the basis of the inverse proportionality between frequency and mz ratio can be converted to a mass spectrum
The ions are to be detected with a selected mz ratio absorb maximum energy through the effect of a high-frequency field and a constant magnetic field perpendicular to it Maximum energy is gained by ions that satisfy the cyclotron resonance condition and as a result these are separated from ions of different masscharge
FTICR New Dimensions of High Performance Mass Spectrometry
High mass resolution gt 3 000 000
Accuracy of mass determination lt 01 ppm Sensitivity (ESI Octapeptide) ca 50 attomol
Structure-specific fragmentation MSMS MSn
FTICR New Dimensions of High Performance Mass Spectrometry
Ions are trapped and oscillate with low incoherent thermal amplitude
Excitation sweeps resonant ions into a large coherent cyclotron orbit
Preamplifier and digitizer pick up the induced potentials on the cell
FTICR New Dimensions of High Performance Mass Spectrometry
The frequency of the cyclotron gyration of an ion is inversely proportional to its mass-to-charge ratio (mq) and directly proportional to the strength of the applied magnetic field B
FTICR New Dimensions of High Performance Mass Spectrometry
FTICR New Dimensions of High Performance Mass Spectrometry
In the presence of a magnetic field sample ions orbit according to cyclotron frequency fcbull Cyclotron frequency related to charge of ion (z) magnetic field strength (B) and mass of ion (m)
All ions of same mz will have same cyclotron frequency at a fixed B and will move in a coherent ion packet
FTICR New Dimensions of High Performance Mass Spectrometry
Ion packets produce a detectable image current on the detector cell plates
As the ion(s) in a circular orbit approach the top plate electrons are attracted to this plate from ground Then as the ion(s) circulate towards the bottom plate the electrons travel back down to the bottom plate This motion of electrons moving back and forth between the two plates produces a detectable current
FTICR New Dimensions of High Performance Mass Spectrometry
Image is Fourier transformed to obtain the component frequencies and amplitudes (intensity) of the various ionsCyclotron frequency value is converted into a mz value to produce mass spectrum with the appropriate intensities
FTICR New Dimensions of High Performance Mass Spectrometry
The End

General Sample Handling
Use Freshly prepared high purity reagents and water
Omit high concentrations of buffer salts ( NaCl KH2PO4) Detergents (Tween Triton SDS)Urea guanidine salts Cleaning of the sample dialysis RP-HPLC Zip-Tips ion
exchange
Use of removable buffer salts (zB NH4Ac)
Use of removable solvents like water acetonitrile methanol
Mass Spectra of Synthetic Polymers
Information monomer unit end group average masses
Mn = (NiMi) MiMw = (NiMi2) (NiMi)
polydispersity D = MwMn
ProblemsSynthetic polymers are polydisperse bad signal-noise-ratio bdquomass discriminationldquodetector saumlttigung at D gt 11Polymers without ionisationable functional groups metal ion add-onzB Polystyrol Ag+ PEG Na+ K+ etc
Mass Spectra of Synthetic PolymersMass Spectra of Synthetic Polymers
2 0 0 0 3 0 0 0 4 0 0 0 5 0 0 0 6 0 0 0 7 0 0 0 8 0 0 0 9 0 0 0 1 0 0 0 0 m z0
2 0 0 0
4 0 0 0
6 0 0 0
I n t e n s
CH -O-C-CH -CH-C-CH -CH-C-O-CH3 2 2 3
O OCH3 CH3O[ [n
Linear Mode
Reflektor Mode
CH-(CHO)-OH+Na324x+1067
11111155
1199
1023
979
935 1243
15 + 44x+17 +23
Mass Spectra of Synthetic Polymers
New aspects in mass spectrometry
Hybrid Mass Spectrometers
Perhaps hundreds of hybrids have been exploredSome of the more successfulTriple quadrupoleIT-TOFQ-TOFQuadrupole-FTMSTOFTOF
New aspects in mass spectrometry
FT-ICR-MS
FT-ICR-MS instrument general scheme
Fouriertransform-ICR New Dimensions of High Performance Mass Spectrometry
A high-frequency mass spectrometer in which the cyclotron motion of ions having different mz ratios in a constant magnetic field is excited essentially simultaneously and coherently by a pulse of a radio-frequency electric field applied perpendicularly to the magnetic field
The excited cyclotron motion of the ions is subsequently detected on receiver plates as a time domain signal that contains all the cyclotron frequencies excited
Fourier transformation of the time domain signal results in the frequency domain FT-ICR signal which on the basis of the inverse proportionality between frequency and mz ratio can be converted to a mass spectrum
The ions are to be detected with a selected mz ratio absorb maximum energy through the effect of a high-frequency field and a constant magnetic field perpendicular to it Maximum energy is gained by ions that satisfy the cyclotron resonance condition and as a result these are separated from ions of different masscharge
FTICR New Dimensions of High Performance Mass Spectrometry
High mass resolution gt 3 000 000
Accuracy of mass determination lt 01 ppm Sensitivity (ESI Octapeptide) ca 50 attomol
Structure-specific fragmentation MSMS MSn
FTICR New Dimensions of High Performance Mass Spectrometry
Ions are trapped and oscillate with low incoherent thermal amplitude
Excitation sweeps resonant ions into a large coherent cyclotron orbit
Preamplifier and digitizer pick up the induced potentials on the cell
FTICR New Dimensions of High Performance Mass Spectrometry
The frequency of the cyclotron gyration of an ion is inversely proportional to its mass-to-charge ratio (mq) and directly proportional to the strength of the applied magnetic field B
FTICR New Dimensions of High Performance Mass Spectrometry
FTICR New Dimensions of High Performance Mass Spectrometry
In the presence of a magnetic field sample ions orbit according to cyclotron frequency fcbull Cyclotron frequency related to charge of ion (z) magnetic field strength (B) and mass of ion (m)
All ions of same mz will have same cyclotron frequency at a fixed B and will move in a coherent ion packet
FTICR New Dimensions of High Performance Mass Spectrometry
Ion packets produce a detectable image current on the detector cell plates
As the ion(s) in a circular orbit approach the top plate electrons are attracted to this plate from ground Then as the ion(s) circulate towards the bottom plate the electrons travel back down to the bottom plate This motion of electrons moving back and forth between the two plates produces a detectable current
FTICR New Dimensions of High Performance Mass Spectrometry
Image is Fourier transformed to obtain the component frequencies and amplitudes (intensity) of the various ionsCyclotron frequency value is converted into a mz value to produce mass spectrum with the appropriate intensities
FTICR New Dimensions of High Performance Mass Spectrometry
The End

Mass Spectra of Synthetic Polymers
Information monomer unit end group average masses
Mn = (NiMi) MiMw = (NiMi2) (NiMi)
polydispersity D = MwMn
ProblemsSynthetic polymers are polydisperse bad signal-noise-ratio bdquomass discriminationldquodetector saumlttigung at D gt 11Polymers without ionisationable functional groups metal ion add-onzB Polystyrol Ag+ PEG Na+ K+ etc
Mass Spectra of Synthetic PolymersMass Spectra of Synthetic Polymers
2 0 0 0 3 0 0 0 4 0 0 0 5 0 0 0 6 0 0 0 7 0 0 0 8 0 0 0 9 0 0 0 1 0 0 0 0 m z0
2 0 0 0
4 0 0 0
6 0 0 0
I n t e n s
CH -O-C-CH -CH-C-CH -CH-C-O-CH3 2 2 3
O OCH3 CH3O[ [n
Linear Mode
Reflektor Mode
CH-(CHO)-OH+Na324x+1067
11111155
1199
1023
979
935 1243
15 + 44x+17 +23
Mass Spectra of Synthetic Polymers
New aspects in mass spectrometry
Hybrid Mass Spectrometers
Perhaps hundreds of hybrids have been exploredSome of the more successfulTriple quadrupoleIT-TOFQ-TOFQuadrupole-FTMSTOFTOF
New aspects in mass spectrometry
FT-ICR-MS
FT-ICR-MS instrument general scheme
Fouriertransform-ICR New Dimensions of High Performance Mass Spectrometry
A high-frequency mass spectrometer in which the cyclotron motion of ions having different mz ratios in a constant magnetic field is excited essentially simultaneously and coherently by a pulse of a radio-frequency electric field applied perpendicularly to the magnetic field
The excited cyclotron motion of the ions is subsequently detected on receiver plates as a time domain signal that contains all the cyclotron frequencies excited
Fourier transformation of the time domain signal results in the frequency domain FT-ICR signal which on the basis of the inverse proportionality between frequency and mz ratio can be converted to a mass spectrum
The ions are to be detected with a selected mz ratio absorb maximum energy through the effect of a high-frequency field and a constant magnetic field perpendicular to it Maximum energy is gained by ions that satisfy the cyclotron resonance condition and as a result these are separated from ions of different masscharge
FTICR New Dimensions of High Performance Mass Spectrometry
High mass resolution gt 3 000 000
Accuracy of mass determination lt 01 ppm Sensitivity (ESI Octapeptide) ca 50 attomol
Structure-specific fragmentation MSMS MSn
FTICR New Dimensions of High Performance Mass Spectrometry
Ions are trapped and oscillate with low incoherent thermal amplitude
Excitation sweeps resonant ions into a large coherent cyclotron orbit
Preamplifier and digitizer pick up the induced potentials on the cell
FTICR New Dimensions of High Performance Mass Spectrometry
The frequency of the cyclotron gyration of an ion is inversely proportional to its mass-to-charge ratio (mq) and directly proportional to the strength of the applied magnetic field B
FTICR New Dimensions of High Performance Mass Spectrometry
FTICR New Dimensions of High Performance Mass Spectrometry
In the presence of a magnetic field sample ions orbit according to cyclotron frequency fcbull Cyclotron frequency related to charge of ion (z) magnetic field strength (B) and mass of ion (m)
All ions of same mz will have same cyclotron frequency at a fixed B and will move in a coherent ion packet
FTICR New Dimensions of High Performance Mass Spectrometry
Ion packets produce a detectable image current on the detector cell plates
As the ion(s) in a circular orbit approach the top plate electrons are attracted to this plate from ground Then as the ion(s) circulate towards the bottom plate the electrons travel back down to the bottom plate This motion of electrons moving back and forth between the two plates produces a detectable current
FTICR New Dimensions of High Performance Mass Spectrometry
Image is Fourier transformed to obtain the component frequencies and amplitudes (intensity) of the various ionsCyclotron frequency value is converted into a mz value to produce mass spectrum with the appropriate intensities
FTICR New Dimensions of High Performance Mass Spectrometry
The End

New aspects in mass spectrometry
FT-ICR-MS
FT-ICR-MS instrument general scheme
Fouriertransform-ICR New Dimensions of High Performance Mass Spectrometry
A high-frequency mass spectrometer in which the cyclotron motion of ions having different mz ratios in a constant magnetic field is excited essentially simultaneously and coherently by a pulse of a radio-frequency electric field applied perpendicularly to the magnetic field
The excited cyclotron motion of the ions is subsequently detected on receiver plates as a time domain signal that contains all the cyclotron frequencies excited
Fourier transformation of the time domain signal results in the frequency domain FT-ICR signal which on the basis of the inverse proportionality between frequency and mz ratio can be converted to a mass spectrum
The ions are to be detected with a selected mz ratio absorb maximum energy through the effect of a high-frequency field and a constant magnetic field perpendicular to it Maximum energy is gained by ions that satisfy the cyclotron resonance condition and as a result these are separated from ions of different masscharge
FTICR New Dimensions of High Performance Mass Spectrometry
High mass resolution gt 3 000 000
Accuracy of mass determination lt 01 ppm Sensitivity (ESI Octapeptide) ca 50 attomol
Structure-specific fragmentation MSMS MSn
FTICR New Dimensions of High Performance Mass Spectrometry
Ions are trapped and oscillate with low incoherent thermal amplitude
Excitation sweeps resonant ions into a large coherent cyclotron orbit
Preamplifier and digitizer pick up the induced potentials on the cell
FTICR New Dimensions of High Performance Mass Spectrometry
The frequency of the cyclotron gyration of an ion is inversely proportional to its mass-to-charge ratio (mq) and directly proportional to the strength of the applied magnetic field B
FTICR New Dimensions of High Performance Mass Spectrometry
FTICR New Dimensions of High Performance Mass Spectrometry
In the presence of a magnetic field sample ions orbit according to cyclotron frequency fcbull Cyclotron frequency related to charge of ion (z) magnetic field strength (B) and mass of ion (m)
All ions of same mz will have same cyclotron frequency at a fixed B and will move in a coherent ion packet
FTICR New Dimensions of High Performance Mass Spectrometry
Ion packets produce a detectable image current on the detector cell plates
As the ion(s) in a circular orbit approach the top plate electrons are attracted to this plate from ground Then as the ion(s) circulate towards the bottom plate the electrons travel back down to the bottom plate This motion of electrons moving back and forth between the two plates produces a detectable current
FTICR New Dimensions of High Performance Mass Spectrometry
Image is Fourier transformed to obtain the component frequencies and amplitudes (intensity) of the various ionsCyclotron frequency value is converted into a mz value to produce mass spectrum with the appropriate intensities
FTICR New Dimensions of High Performance Mass Spectrometry
The End

FTICR New Dimensions of High Performance Mass Spectrometry
FTICR New Dimensions of High Performance Mass Spectrometry
In the presence of a magnetic field sample ions orbit according to cyclotron frequency fcbull Cyclotron frequency related to charge of ion (z) magnetic field strength (B) and mass of ion (m)
All ions of same mz will have same cyclotron frequency at a fixed B and will move in a coherent ion packet
FTICR New Dimensions of High Performance Mass Spectrometry
Ion packets produce a detectable image current on the detector cell plates
As the ion(s) in a circular orbit approach the top plate electrons are attracted to this plate from ground Then as the ion(s) circulate towards the bottom plate the electrons travel back down to the bottom plate This motion of electrons moving back and forth between the two plates produces a detectable current
FTICR New Dimensions of High Performance Mass Spectrometry
Image is Fourier transformed to obtain the component frequencies and amplitudes (intensity) of the various ionsCyclotron frequency value is converted into a mz value to produce mass spectrum with the appropriate intensities
FTICR New Dimensions of High Performance Mass Spectrometry
The End
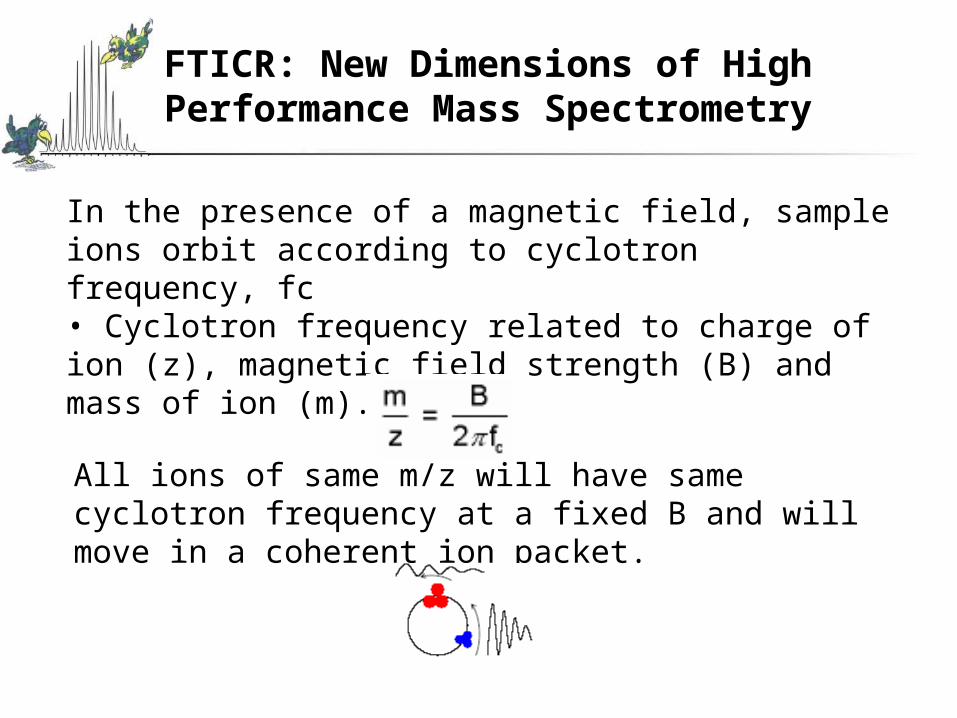
FTICR New Dimensions of High Performance Mass Spectrometry
The End

The End