Mass spectrometric study of the photoionization of some ... of formation of HF in aqueous solution...
7
JOURNAL OF RESEARCH of the National Bureau of Standards-A. Physics and Chemistry Vol. 72A, No.5 , Se p tember- Octaber 1968 Mass Spectrometric Study of the Photoionization of Some Fluorocarbons and Trifluoromethyl Halides* Clemente Juan Noutary** (June 16, 1968) Th e photoionization curv es and the thr es hold energies for the molecule and several abundant fragme nt ions of CF." C, F, ;, C,F. , c.. F, o, CF,H, CF"Cl, CF,Br, and CF"I have been measured. The thr eshold energies are co rre la le d a nd th e ioni c heals of [ormation and s ome bond dissociation energies a re c a lc ul ated. It is appar ent thai the values oblained for the CF;j ions are not the adiabatic one s,- but in clude large amounts of excess energy. This excess is the lowest for the CF:t from CF,T for which an explanation is suggested. Ass uming thai the excess is not ze ro for the last compound we obta in th e following upp e r limil s : kJ mo l- ' =+ 87.3 kcal mol- '; I(CF,,) +";;; 8. 62 e V; I (C,F,,) +,,;;; 8. 72 e V; I (G.F,) +,,;;; 8.70 eV; 1(c.. F,, ) +,,;;; 8.68 eV. From the mea n va lu e O(C,; - C,,) = 402 ±2 kJ mol-' = 96.0 ± 0.5 kca l 11101 - ' the bond di ssociation energi es o (C,; -C.,) = 363 ± 3 kJ 11101 -' = 86.8 ± 0.8 kca ll11 ol-' and 0 (C. ,- C,)=337 ± 4 kJ 111 01- ' = 80.6 ± 1.0 kca ll11 ol- ' and 0 (C,, - F)= 525 kJ mol - ' = 125.7 kca l mol - ' ar e ca lculated. Key Words: CF.,; C, F,,; C,F.; C,F,o ; CF, H; CF,CI; CF,Br ; CF,l; hea ts of fo rm a l ion ; ioni zalion energies ; ma ss spec trometric; photoionization; vacuum ultraviole t. 1. Introduction Th e spec tra , ionization and di ssoc iation energi es of various ions from fluoro ca rbon s and trifluoromethyl halid es have been meas ur ed by el ec tron impa ct [1 - 11] I or s pe ctroscopically [12] by se ve ral authors. Th e hea t of for mation and the bond dissociation ener- gies have al so bee n meas ur ed or calculated by various meth ods [13-26]. Many of tho se values are not in good agreement. However, r ece nt measurement s have given improved values for so me fundamental data- from which most bond energies are derived-such as the heat of formation of HF in aqueous solution by Johnson et a1. [30] and the heat of formation of CF4 by Domalski and Armstrong [31]. General and critical reviews have bee n mad e by Benson [27], Ke rr [28], and Lacher and Skinner [29]. The photoionization of the (CFI) fr ee radi cal has also bee n m eas ured r ece ntly by Lifshitz and Chupka [32]. Thus it ha s see med worthwhile to remeas ur e by pho- ton impa ct th e ionization energies of se lec ted positive ions from seve ral flu orocarb ons. To assist in the inte r- pretation of the results we includ e me asurements of · Work perfo rm ed und er the auspi ces of th e Inte rnational At om ic En ergy Agency (V i- e nna , Austria) th rough the Na ti onal Acad emy of Sc ie nces D.C.) a nd s up- purled in part by the U.S. Atomi c Energy Commi ss io n. **Gues t wurke r. Inst it ute fo r Materials Hesea rcb, National Burea u of Sta ndard s, Wa sh- ingtun. D. C. 20234. Pe rmane nt a ddr ess: Co misi t'. n Nac ional de Energia At."ln ica, Bu e no s Air es. Argentina. 1 Figures in bra ckets indicate th e lit e rature refere nces al th e e nd--;;r thi s pap er. 479 trifluorome th yl halid es and Auoroform. All of th ese re sults ar e repo rt ed and di sc ussed in this paper. 2. Experimental Procedure Measurements were mad e by means of an ins trum ent pre viously des cribed [33]. It co nsis ts of a single focus- ing, 15 cm radius, 60 degre e deflection mass spectrom- eter with a Seya-Namioka va c uum ultraviolet mono- chromator of a focal length of 1 m and a resolution of 1 A with both slits of the monochromator fixed at 0.1 mm. The gold-coated 1200 groove/mm gratirig could be 0 manually rotated with a resetability better than 0.5 A. The were meas ur ed with an accuracy better than 1 A. Th e ph oton so ur ces use d were as follows: 1. From 1400 to 1050 A the co ntinuum di sc harge in argon at a pre ss ur e of 400 mm excited by means of a 800 W 2450 MHz microwave generator. 2. From approximately 1100 to 900 A the many-lined spec trum produced by microwave discharge 111 hydrogen. 3. From 950 to 600 A the Hopfield continuum ex- cited by a d-c discharge in helium at a pressure of 250 mm. The relative photon intensity was measured by the photoelectric effect on a piece of chemically clean tungsten intercepting the beam of light when it leaves
-
Upload
truonghuong -
Category
Documents
-
view
214 -
download
0
Transcript of Mass spectrometric study of the photoionization of some ... of formation of HF in aqueous solution...

JOURNAL OF RESEARCH of the National Bureau of Standards-A. Physics and Chemistry Vol. 72A, No.5, September- Octaber 1968
Mass Spectrometric Study of the Photoionization of Some
Fluorocarbons and Trifluoromethyl Halides*
Clemente Juan Noutary**
(June 16, 1968)
The photoionization c urves a nd the thres hold ene rgies for the molecule and several abundant fragme nt ions of CF." C, F,;, C,F. , c.. F, o, CF,H, CF"Cl, CF ,Br, and CF"I have been measured. The thres hold e nergies are co rre la led a nd th e ionic hea ls of [ormation and some bond dissociation energies a re ca lculated. It is appare nt thai th e valu es oblained for th e CF;j ions are not the adiabatic ones, -but inc lude la rge a mount s of excess ene rgy. Thi s excess is th e lowest for the CF:t from CF,T for which an explanation is sugges ted. Assuming thai the excess is not ze ro for the last compound we obta in th e following upper limil s : ~H.Io(CF,,) +";;; + 365.3 kJ mo l- ' =+ 87.3 kcal mol- '; I(CF,,) +";;; 8.62 e V; I (C,F,,) +,,;;; 8.72 eV; I (G.F,) +,,;;; 8.70 eV; 1(c.. F,, ) +,,;;; 8.68 eV. From the mean va lue O(C,; - C,,) = 402 ±2 kJ mol- ' = 96.0 ± 0.5 kcal 11101- ' the bond di ssociation energies o (C,; - C.,) = 363 ± 3 kJ 11101- ' = 86.8 ± 0 .8 kcall11ol- ' and 0 (C.,- C,)=337 ± 4 kJ 111 01- ' = 80.6 ± 1.0 kcall11ol- ' and 0 (C,, - F)= 525 kJ mol - ' = 125.7 kcal mol - ' are calculated .
Key Words: CF.,; C, F,,; C,F.; C,F,o ; CF, H; CF ,C I; CF,Br; CF,l; hea ts of forma l ion ; ioni za lion e ne rgies ; mass spec trometric; photoionization; vacuum ultraviole t.
1. Introduction
The spectra , ionization and di ssociation e nergies of various ions from fluorocarbons and trifluorom e thyl halides have been measured by elec tron impact [1- 11] I or spectrosco pically [12] by seve ral authors. The heat of formation and the bond dissociation e nergies have also been measured or calculated by various methods [13-26] . Many of those values are not in good agreement. However , recent measurements have given improved values for some fundamental data- from which most bond energies are derived-such as the heat of formation of HF in aqueous solution by Johnson et a1. [30] and the heat of formation of CF4 by Domalski and Armstrong [31]. Ge neral and critical reviews have bee n made by Benson [27], Kerr [28], and Lacher and Skinner [29].
The photoionization of the (CFI) free radical has also bee n meas ured rece ntly by Lifshitz and Chupka [32]. Thus it has see med worthwhile to re measure by photon impact the ionization e nergies of selected positive ions from several fluorocarbons. To assist in the inte rpretation of the results we include measurements of
· Work perfo rm ed unde r the a uspices of the Inte rnational Atom ic Ene rgy Age ncy (V ie nna , Aus tria) th rough the Na tiona l Acade m y of Scie nces (\~l a s hington . D.C.) a nd suppurled in part by the U.S. Atomic Ene rgy Commiss io n.
**Gues t wur ke r. In s t it u te fo r Mate ria ls Hesearc b, Na tional Burea u of S ta ndards, Washing tun. D. C. 20234. P e rmane nt address: Co misit'. n Nac ional de Ene rgia At."ln ica, Bu e nos Aires. Arge ntina .
1 Figures in brac kets ind icate the lit e rature refere nces a l the e nd--;;r this paper.
479
trifluorome th yl halides a nd Auoroform. All of these results are reported a nd discussed in thi s paper.
2. Experimental Procedure
Measurements were made by means of an instrum ent pre viously described [33]. It consists of a single focusing, 15 cm radius, 60 degree deflection mass spectrometer with a Seya-Namioka vacuum ultraviolet monochromator of a focal length of 1 m and a resolution of 1 A with both slits of the monochromator fixed at 0.1 mm. The gold-coated 1200 groove/mm gratirig could be 0 manually rotated with a resetability be tter than 0.5 A.
The wavelen~ths were meas ured with an accuracy better than 1 A. Th e photon sources used were as follows:
1. From 1400 to 1050 A the continuum discharge in argon at a press ure of 400 mm e xcited by means of a 800 W 2450 MHz microwave generator.
2. From approximately 1100 to 900 A the many-lined spectrum produced by microwave discharge 111
hydrogen. 3. From 950 to 600 A the Hopfield continuum ex
cited by a d-c discharge in helium at a pressure of 250 mm.
The relative photon intensity was measured by the photoelectric effect on a piece of chemically clean tungsten intercepting the beam of light when it leaves
L
the ion source. A correction for the sensitivity of photon detection as a function of the wavelength was introduced according to Wheaton [34]. The ion current was measured with a 20 s tage elec tron multiplier, a preamplifier, an amplifier , and scaler.
An e mpirical formula was es tablished to correct for the decrease in the sample reservoir pressure, the molecular weight and th e viscous flow of the gas through th e leak. A program to permit all the above processing of the data by computer was written and used in most of thi s work.
A smoothing computational procedure using Chebyshev polynomials was also applied to some curves using a program developed at the NBS by R. B. Parlin, but all the ionization thresholds were determined before introducing any smoothing.
The gases used were obtained from commercial sources and purities, as stated by the suppliers, were generally better than 99.5 mole percent. Mass spectra indicated no interfering impurities significant to these measure me nts.
3. Results
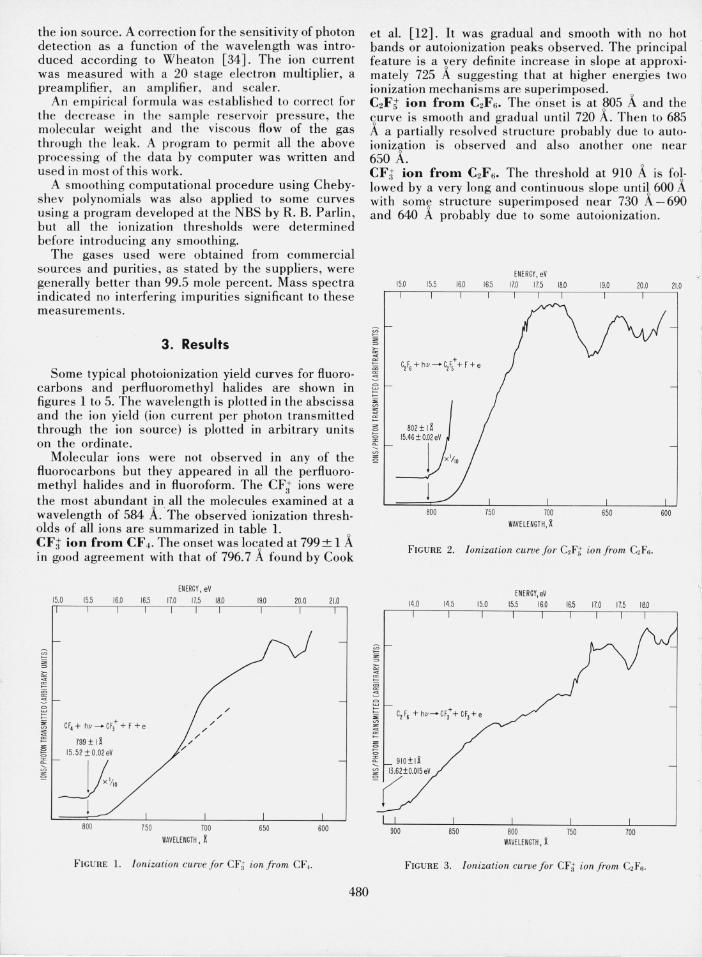
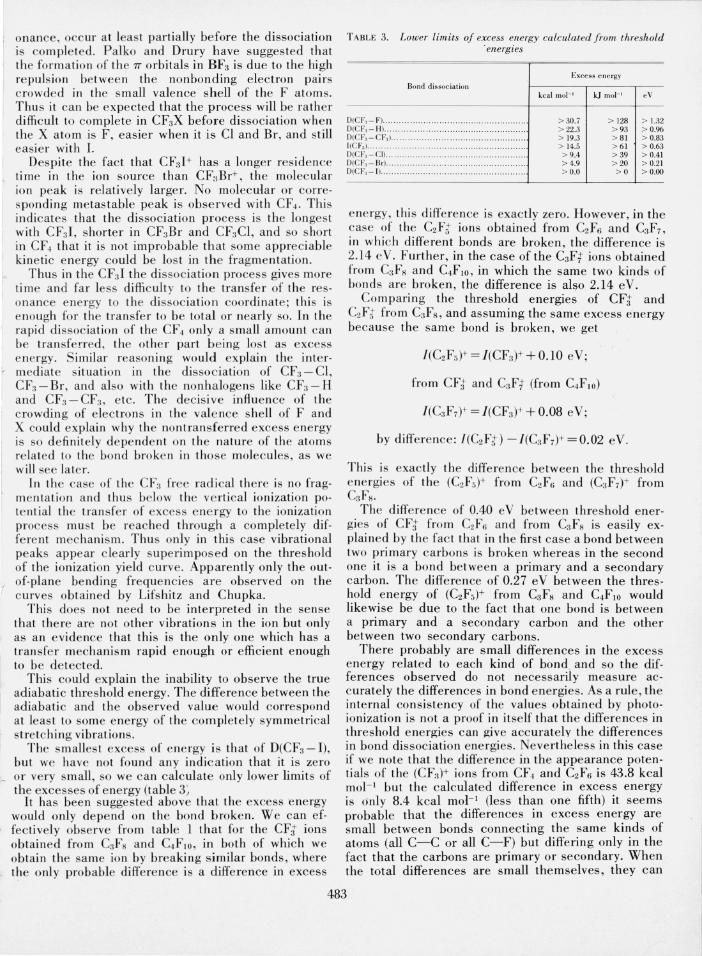
Some typical photoionization yield curves for fluorocarbons and perfluoromethyl halides are shown in figures 1 to 5. The wavelength is plotted in the abscissa and the ion yield (ion current per photon transmitted through the ion source) is plotted in arbitrary units on the ordinate.
Molecular ions were not observed in any of the fluorocarbons but they appeared in all the perfluoromethyl halides and in fluoroform. The CF; ions were the most abundant in all the molecules examined at a wavelength of 584 A. · The observed -ionization thresholds of all ions are summarized in table 1. CFt ion from CF4 • The onset was locfted at 799± 1 A in good agreement with that of 796.7 A found by Cook
ENERGY , eV 15.0 15.5 16.0 16.5 17.0 17.5 18.0
~ ~
=
i eF4+ h" ~ eF,+ +F + e ~ 799 ±l a i IS.52±O.02eV
~ y~o J
/ /
/
/
/ /
/
BOO 750 700
WAVELENGTH, X
19.0 20.0
650
FIGURE 1. Ionizat ion curoe for CFt ion /rom CF,.
21.0
600
480
et al. [12]. It was gradual and smooth with no hot bands or autoionization peaks observed. The principal feature is a very definite increase in slope at approximately 725 A suggesting that at higher energies two ionization mechanisms are superimposed. 0
C2Ft ion from C2F 6 . The o·nset is at ~05 A and the curve is smooth and gradual until 720 A. Then to 685 A a partially resolved structure probably due to autoionization is observed and also another one near 650 A. CFt ion from C2Fs. The threshold at 910 A is fo!lowed by a very long and continuous slope until 600 A with some structure superimposed near 730 A-690 and 640 A probably due to some autoionization.
15.0 15.5
800
EN ERGY, eV 16.0 16.5 17.0 17.5 18.0
700 WAVELENGTH , a
19.0
650
FIGURE 2. Ionization curoe for C,F,r ion from C2F6 •
14.0 14.5 15.0
~ e, F, + h"~ eF,++ e F,+e
z =
~ 91 0±IX ;;; ~ r.±0.015ev
ENERGY,eV 15.5 16.0
FIGURE 3. Ionization curoe for CFt ion from C2 F 6 .
21.0

21.0
800 750 700
WAVELE NGTH, ~
FIGURE: 4. Ionization curve for G,Ft ion from G, F •.
TABLE: 1. Summary of experimental ionization thresholds
Substance lun A eV kJ 11101 - 1 kcal 11101- 1 Observa tions
CF, { C F, ), .. ........... .. ............. . ......... ....... .................. No ions. C F,,)' 799 15.52 1498 357.9
{ (C, F, )+ ... .. ... .. . .... .. .. ... ... No ibns.
C2 Ft; (C, F.-,)+ 802 15.<Ui 1492 356.5 (C F,,) ' 9 10 13.62 1314 3 14.1 (C F)+ 740 16.75 1616 386.3
{ (C'F')+ .... ............ . No ions .
GIFI! IC,F,)+ 803 15.44 1490 356. 1 (C, F,)' 93 1 13.32 1285 307.2 (CL )' 938 13.22 1276 304.9
("" ., . . . . . . . . . . . . . . . ................ ...... .. .......... No ions . (C, F,)+ 804 15.42 1488 355.6 (C, F,)' 932 13.30 1283 306.7
C,F IO (C, F.,)' 792 15.65 15 10 360.9 (C, F.,)' 950 13.05 1259 300.9 (C, F,, )' 79 2 15.65 15 10 360.9 (C f',,) ' 938 13.22 1276 304.9
O \CI { (CF,C I)' 1001 12.43 11 99 286.8 \CF:d' 982 12.57 12 13 290.0
CF, Br {,Cr"Br)' De tec ted but not measured. Small peak. (C F,,)' 1059
I 11B41
11 42 273.0
C'"I t (C F.-oI)+ 1212 10.23 987 236.0
(CF,,)' 1138 10.89 1051 251.0
c r , 1-I { (C'"H)' Detected but not measured. Small peak. (C F,, )' 877 I 14.14 1 1364 326.1 ,
In this and subsequ e nt tables a nd text, the following equi va le nces are used: 1 e V molecule- 1 =96.4870 kJ mol- I; I kcal mol- ' = 4 .1840 kJ mol- I ; I cm- 1 = 12398. 1 X 10⁻⁸ c v.
C3F t ion froJll C:IF s. The curve begins at 803 A and increases gradually until nearly 745 A (the onse t of the CF+ ion) where it reaches a flat top. CFt from CF:lI. The onse t is very gradual and dif· fi cult to locate exac tly, but de finitely at an energy not higher than 10.89 e V. Some s tructure in the c urve (probably due to vibrations in th e ion) could be clearly seen when a correc tion for th e scattered light was in troduced.
The curves of the re maining ions also exhibit smooth threshold s followed by more or less gradual increases .
~ ~ Z 4
10.8 10.9
CF,I +hv~CFt+ I +e
1138± I~
1-----
1150 1140
ENERGY, eV 11.0
1130 1110 WAVELENGTH, ~
11.1 112
1110
FIGURE: 5. Ionization curve for CFt ion from CF,T.
1100
Occasionally a rapid increase is obse rved which is interpreted as the beginning of a new dissociation process. No other special c harac teris ti cs were ob· served of conseque nce for thi s work. It is noteworth y that in these molecules as in the case of hydrocarbon ions [35] little e vide nce i obtained for autoionization except as noted above .
4. Discussion
The values at room te mperature of the heat of for· mation tJ.Hfl9S(CF3X) and the heat of di ssociation D29S(CF;j -X) for X=F, Cl, Br, I , Hand CFa are known. Thus it is possible to derive in each case a value for the heat of formation tJ.Hfl9S(CF3 ) of the free radical by the relation
tJ.Hfl9S(CF3 ) = tl.Hfl9S(CF3 - X)
+ D29S(CF3 - X) - tl.Hfl9S(X),
The values of tJ.H,ro(CF3X) were calculated using the values of H298 - Ho given in NBS Technical Note 270-3 [14]. Calling (CFi)+ the ions, excited or not, in the state and with all th e excess e nergy with which they are obtained by photoionization at the threshold, we have calculated :
In the case of the free radical CF3 the value 2
tJ.Hfl9S(CF:l) = - 112.5 kcal mol- 1 has been obtained by averaging the other six numbers in that column in table 2; it coincides with the value -112.5 ± 1.2 kcal mol- I measured by Coomber and Whittle [211. The
2 The use of units of kcal mo) - I in portions of this paper is for the purpose of com paring presen t results with previously publis hed data.
481

TABLE 2a. Thermodynamic values (in kcal mol- ' ) of several fluorocarbons a
t;.flJ:;" (CF"X) Hef.b
CF,-F - 222.87 ± 0.38 [31] CF,- H - 165. 1 ±0.5 [24] CF, - Cr" - 321.0 ±0. 1 [22] Cr" CF,,-CI - 165.8 ± 0.5 [23] CF,-Br - 155.5 ± 0.2 [ 19- 20] CF,,- I - 139.4 [24]
<I Es timated uncert a inties. h Refers to numbers in the bibliography. C Calculated from tlH~8 . d Average o f the other six values in this column. ~. Calculated from CF;I Br and Crd. r Calculated from E.E. + IlHt:(CFj)+ from Crd.
t:.Hr.(CF"X) , D",(CF,- X)
- 221.5±0.4 129.3 ±2 - 163.4± 0.5 106.2 ±0.5 -319.0 ± 0.1 93 ±4 - 111.5 - 164.6 ± 0.5 82.9 - 152.6 ± 0.2 69.4±0.8 - 138.0 53.7
J( Obtained by Lifsehil z and Chupka [32 ] by photoionization of CF:l free radical.
Ref.!' A(CF~) t:.HJ:;,,(C F,, ) t;.Hr.(CF~) ' E.I':. I(CF;)+'
21 357.9 - 11 2.45 118.0 > 30.7 229.5 25 326.1 - 1l1.0 109.6 > 21.8 220.6 18 314.1 - 114.0 106.6 > 19.3 218.1
' - 112.5 101.8 > 14.5 '213.3 (') 290.0 - 112.0 96.7 > 9.4 208.2 20 273.0 - 112.8 92.2 > 4.9 203.7 24 251.0 - 111.3 87.3 > 0.0 198.8
TABLE 2b. Thermodynamical values in kJ mol- ' for the same compounds
tJ.lIh'l~ (C F, X) t;.Hfo(CF"X) D",(CF, - X) A(CF,~ ) MIJ:;" (CF,,J t;.Hr,(CFi ) E.E. I(CF~ )-
Cf",.- F - 956.9 -926.8 541.0 Cf,- H - 697.0 -683 .7 444.0 CF,-C F" - 1343.0 -1334.0 389.0 CF" -466.5 . . CF,,- CI - 693.7 -688.7 346.8 CF,,- Br - 650.6 -638.5 290.4 CF,,-I -583. 7 -577.8 224.7
corresponding t:..Hfl(CFj)+ was obtained by correcting to 0 K and adding the threshold photoionization energy of 9.5 e V = 213.3 kcal mol- I measured by Lifschitz and Chupka [32].
From the comparison of the t:..Hfl9S(CF3 ) values so obtained it is easy to see that the thermochemical values agree quite well; their differences are not larger than ± 1.5 kcal mol- I. On the contrary the dif· ferences in t:..Hfl(CFj)+ are much larger, some 30 kcal mol- I from CF4 to CF31. The disagreement is too large to be attributed to the errors in either the photoionization or the thermochemical measurements. It is apparent that for some reason we have not measured the adiabatic potential and some excess energy is included (perhaps very small for CF31).
The substances in table 2 have been listed according to their decreasing values of t:..Hfl(CFj)+. We observe that the order is one of increasing atomic weight of X and of increasing C -X distances [36] for the halides. This suggests the following explanation. In all the listed CF3X molecules the orbitals of the valence electrons of the carbon are Sp3 . It has been demonstrated [26] that the CF:l free radical is not planar. That suggests that the orbitals retain at least some spa character. However, the CFt ion is planar, and the three valence electrons are in Sp2 orbitals lying in a plane with the vacant p orbital perpendicular to it [37]. It seems reasonable then to assume that, like the isoelectronic BF3 molecule, an electron from one of the nonbonding pairs of an F jumps to the p - C orbital forming a 7T
bonding. There are three similar possible configurations in resonance with the empty p orbital structure
1497.5 -470 .5 493.7 > 128.4 960.2 1364.4 -464.4 458.6 > 91.2 923.0 1314.2 -477.0 446.0 > 80.8 912.5
-470.7 425.9 > 60.7 892.5 1213.4 -468.6 404.6 > 39 .3 871.1 1142.2 -472.0 385.8 > 20.5 852.3 1050.2 - 465.7 365.3 > 0.0 831.8
and with some partially ionic structures [38]. In the case of BF3 a resonance energy of 48 kcal mol- 1 has been calculated [39]. It is likely that in the CFt ion due to more favorable charge distribution conditions that value will be still higher.
The following consequences can be deduced: If we accept the approximate value of 10.8 e V sug
gest~a' by Lifschitz and Chupka as the vertical ionization potential of the CFa free radical, an adiabatic threshold energy lower than 8.62 eV (as our measure ments from CFal suggest) does not seem unreasonable but very probable. This would require that both the FCF angles and the FC distances in the free radical be approximately the same as those in the CF3X molecules; in other words that the C orbitals be still nearly pure Sp3.
If the B - F distances change from 1.43 A in the BFi to 1.295 A in BF3 because of the resonance of the 7T bonding and especially be cause of that of the partially ionic forms [38, 41], similar and perhaps larger changes can be expected from CF3 radical to CFt ion. Thus some appreciable amount of energy must be associated with the symmetrical stretching vibrations. Of course large out-of-plane bending vibrations are also expected.
It is likely that in the case of the CF3X molecules , at least part of the resonance energy is not lost as excess energy but transferred by radiationless mechanisms to the dissociation coordinate in accordance with the fundamental postulate of the quasiequilibrium theory of mass spectra [40] . In that case the changes in orbital configurations, the 7T bonding and the res-
482
l
I onance, occ ur at least partially before the dissociation is comple ted. P alko and Drury have suggested that the formation of th e 1T orbitals in BF3 is due to the high repuls ion between the nonbonding electron pairs crowded in the small valence shell of the F atoms. Thus it can be expected that the process will be rath er difficult to complete in CF3X before dissociation whe n the X atom is F, easier when it is Cl and Br, and still easier with I.
Despite the fact that CF3I+ has a longer reside nce time in the ion source than CF3Br+, the molecular ion peak is relatively larger. No molec ular or corresponding metastable peak is observed with CF4 • Thi s indicates that the dissociation process is the lon ges t with CF3I, shorter in CFIBr and CFICI, and so s hort in CF4 that it is not improbable that some appreciable kin e ti c e nergy could be los t in the fragme ntation.
Thus in the CFaI the di ssociation process gives more time and far less diffic ulty to the transfer of the resonance energy to th e di ssociation coordinate; thi s is e nough for the tran sfe r to be total or nearly so. In the rapid di ssoc iation of the CF4 only a small amount can be tran sferred , the othe r part be ing los t as excess e nergy. Similar reasoning would explain the inte rmediate situation in the di ssociation of CF3 - CI, CFa-Br, and also with the nonhaloge ns like CFa-H and CF3 - CF l, e tc . The decis ive inAue nce of the crowding of elec tron s in the vale nce s hell of F and X could explain why th e nontransferred excess e nergy is so de finitely depe nde nt on th e nature of the atom s related to the bond broke n in those molecules, as we will see later.
In the case of the CF3 free radical the re is no fragmentation a nd thus below the ve rti cal ionization pote ntial the transfer of excess e ner gy to the ionizati on process must be reached through a completely diffe rent mechani s m. Thus only in thi s case vibrational peaks appear clearly superimposed on the thres hold of the ionization yield curve. Apparently only the outof-plane be nding freque ncies are observed on the curves obtained by Lifshitz and Chupka.
This does not need to be interpreted in the sense that there are not other vibrations in the ion but only as an e vidence that this is the only one which has a tran sfer mechanism rapid enough or efficient enough to be de tected.
This could explain the inability to observe the true adiabatic threshold energy. The difference between the adiabati c and the observed value would correspond at least to some e nergy of the completely symmetrical stretc hing vibrations.
The smalles t excess of energy is that of D(CF3 - I), but we have not found any indication that it is zero
\... or very small, so we can calculate only lower limits of the excesses of e nergy (table 3~
It has been suggested above that the excess energy would only depend on the bond broken. We can ef
i fectively observe from table 1 that for the CF:t ions obtained from CIFs and CF,O , in both of which we
I obtain the same ion by breaking similar bonds , where the only probable diffe re nce is a difference in excess
TABLE 3. Lower limits of excess energy calculated from threshold energtes
Exce ss ene rgy
Bond dissociation kcal 11101- 1 kJ mol- I e V
D(C F,,- F) ................. .. .. ........ ... .... .. >30.7 > 128 > 1.32 D(CF,,- I-I) ......... -.... .. .. ... .. ............ .. > 22.3 > 93 > 0.96 D(C F, -CF,, ) > 19.3 > 81 > 0.83 I(C F, ) . . . . . . . . . . . . . . . . . > 14.5 > 61 > 0.63 D(CF,-CI) .............. ... . ... .............. > 9.4 > 39 > 0.41 D(C F,, - Br) ... .............. .. > 4.9 > 20 > 0.21 D(C F,,- I). . . . . . . . . . . . . . . . . . . . > 0.0 > 0 > 0.00
e nergy, thi s differen ce is exac tly zero. However, in the case of the C2Ft ions obtained from C2Ff; and C3F7 ,
in whic h different bonds are broken, the diffe rence is 2.14 eV. Further, in the case of the C3Ft ions obtained from C3Fs and C4F lO , in which the same two kinds of bonds are broken, the difference is also 2.14 eV.
Comparing the threshold energie~ of CFt and C2Ft from C;lF8 , and assuming the same excess energy because the same bond is broken, we get
I (C3F7)+ = J(CF3)+ + 0.08 e V;
by differe nce : {(C 2Ft ) -J(C3F7)+=0.02 e V.
Thi s is exac tly the diffe rence be tween the threshold e nergies of the (C2F5)+ from Ct F6 and (CIF7)+ from CaFs.
The differe nce of 0.40 e V be twee n threshold e nergies of CFt from C2F6 and from C3Fs is easily explained by the fac t that in the first case a bond between two primary carbons is broke n whereas in the second one it is a bond between a primary and a secondary carbon. The difference of 0.27 e V between the threshold energy of (C2F5)+ from C3Fs and C4F10 would likewise be due to the fact that one bond is between a primary and a secondary carbon and the other between two secondary carbons.
There probably are small differences in the excess energy related to each kind of bond and so the differences observed do not necessariiy measure accurately the differences in bond e nergies. As a rule , th e internal consistency of the values obtain ed by photoionization is not a proof in itself that th e differences in threshold e nergies can give accurately the differences in bond di ssociation energies. Nevertheless in this case if we note that the differe nce in the appearance potentials of the (CF:1)+ ions from CF4 and C2 F6 is 43.8 kcal mol- I but the calculated difference in excess energy is only 8.4 kcal mol- 1 (less than one fifth) it seems probable that the differences in excess energy are small between bonds connecting the same kinds of atoms (all C-C or all C-F) but differing only in the fact that the carbons are primary or secondary. When the total differences are small themselves, they can
483

be taken to good approximation as differences in bond dissociation energies, perhaps with not less accuracy than direct thermochemical measurements.
In our case we can write approximately D(Ct -Ct)-0.4 eV = D(C I-C2) = D(C2-CZ)+0.3 eV and consider that to a good approximation all the m-19 ions measured had the same excess energy A and all the others an excess B = A - 8.4 kcal mol - I, despite the fact that the values obtained from CF:lI indicate that B ~ 19.3 kcal mol- I which is a rather large value. If we accept the values
I(CF3)+ ~ 8_62 e V = 198_8 kcal mol- I and 6.Hf'(CF:l)+ ~ + 87.3 kcal mol- I we get I(C2 F5)+ = I(CF3 )+ + 0.10 e V ~ 8.72 e V I(GlF7)+ = I(CF3 )+ + 0.08 e V ~ 8.70 e V I(C4F9 )+ = I(GlF7)+ - 0.02 e V ~ 8.68 e V.
Accepting the mean value
6.Hfl,Ys(CFa) = - 112.5 ± 0.4 kcal mol- I we get D29S (CF3 -CF;J)=96.0±0.5 kcal mol- I a,nd D29S(CF:l- F) - D298(CF3 - CF3)
= 33.3 kcal mol- I = 1.44 e V.
Thus this CF bond is approximately 1.44 e V stronger than the C - C bonds between primary carbons.
Less accurately we can write:
D298(Ct - C2)= D298(C I-Ct) - 0.40 e V = 86.8 kcal mol- I
D298 (CZ - C2 ) = D298(C I - Ct) -0.67 eV=80.6 kcal mol- I.
It is thus possible to predict the following values for the appearance potentials from C5F 12 •
A(C5F, d + = 15.4 e V A(C4 F9)+ = 13.3 e V A(GIF7)+ = 13.0 e V
A(C2F5)+ = 13.0 eV A(CF3)+ = 13.2 e V I(C5F,I )+ ~ 8.68 eV.
Assuming for all the CI - F dissociations the same excess energy of 30.7 kcal mol- I found for D(CF:I- F) we can obtain
D(C2F5 -F)= 125.8 kcal mol- I
D(G1F7 - F) = 125.6 kcal mol- I.
This coincidence suggests that in the second case the lost F was also bonded to a primary carbon and we can accept a mean value
D(Ct - F)= 125.7 kcal mol- I,
slightly lowe r than D(F:lC - F). This result can be com pared with
D(CF:l -Br)=69.4±0.8 kcal mol- I D(C2F5 - Br)= D(GIF7 -Br)
= 67.0±2.5 kcal mol- I
obtained by Coomber and Whittle [2]. If in the second case F were bonded to the secondary carbon, that would have meant D(Ct -F)=D(C2 - F). This does not seem likely. The value obtained for 6.H,hJ8(CFa) from C2F f; appears to be too high, and that from CFal too I
low. It is likely that: "
D(CF:l-CFa)=96.0±0.5 kcal mol- I D(CF:I- Br) = 69.7 ± 1 kcal mol- I D(CF:l-I) =52.S±1 kcal mol- I.
Table 4 has been obtained using these values. We can also mention that except for CF:I- F, the
C,-F bonds are D298(Ct-F)-Dz98(CI-Cd=29.7 kcal mol- I = 1.28 e V stronger than the CI - Ct bonds.
5. Conclusion
Very precise values of the threshold energies for the molecular and fragment ions can be obtained by photoionization, but there is no reason to assume a priori that those values correspond to the adiabatic transition.
It is shown in this paper that in some cases the total excess energy with which the ions are obtained at threshold can be different from zero by amounts that cannot be neglected. Nevertheless, in the present I state of the art, when this excess energy can be determined, photoionization can give dissociation energy '\ values as good or better than direct thermochemical methods.
I am indebted to H. M. Rosenstock, V. H. Dibeler, C. T. Armstrong, and W. H. Evans for very helpful suggestions and discussions and to the International
TABLE 4.
Di ssociation
F"C- F C,- F F"C- H C.-C ... C,-C, .. C,-C, .. F,C-CI F,C-8r ... F,C-I
Adiabatic dissociation
kcal mol- '
129.3 125.7 106.2 96.0 86.S 80.6 81.7 69.7 52.5
kJ 0101 - 1
541 525 444 402 363 337 342 292 220
eV
5.61 5.45 4.61 4.16 3.76 3.49 3.54 3.02 2.28
Excess energ)'
kcal mol- I kJ moi- '
> 30.7 > 128 >30.7 > 128 > 22.3 >93 > 19.3 > 81 > 19.3 > 81 > 19.3 >81 >9.4 > 39 >4.9 > 20 >0 >0
484
Pholoionizalion di ssuciation
eV kcal mol- 1 kJ mol- 1 eV
-, > 1.32 > 160.0 >669 >6.93 > 1.32 > 156.4 >653 >6.77 > 0.96 > 128.5 > 537 >5.57 > 0.83 > 115.3 >482 >4.99 > 0.83 > 106.1 >444 > 4.59 > 0.83 > 99.9 >418 >4.32 > 0.41 > 91.1 >381 >3.95 > 0.21 > 74.6 >312. >3.23 >0 > 52.5 >0 > 2.28

Atomic Energy Agency (Vienna, Austria), The National Acade my of Sc ie nces (Washington, D_C.), a nd the Co mi io n Nacional de Energia Atomica (Buenos Aires, Argentina) for the ir financial support.
It 's a pleasUJ'e for me to acknowledge the valuable assistance of Miss Susan Kay Liston and Miss Rosemary Suckow, who obtained some of the photoionization yield curves, and of J _ A_ Walker for mainte nance of th e in s trum en t.
6. References
[1] Mohler, F. L., Dibeler, V. H. , and Reese, R. M.,J. Res. NBS 49, 343 (1952) RP2370.
[2] Dibeler, V. H. , Reese, R. M., and Mohler, F. L., J. Re s. NBS 57 , 113 (1956) RP2700.
[3] Marriott , J ., and Craggs, J. D., J. Electron ics I, 405 (1956). [4J Bibby, M. M., and Ca rter, G., Trans. Faraday Soc. 59, 2455
(1963). [5] Dorman , F. H. , ]. Chem. Phys. 41,2857 (1954). [6] Pottie, R. F., J- Chem. Phys. 42, 2607 (1965). . [7] Bibby , M. M., Toubelis , 8. J., and Carter, F., Electronic Le t
ters I, 51 (1965). [8] Lifschitz, c., a nd Long, F. A. , J. Phys. Chem. 69, 3746 (1965). [9] Fisher, 1. P., Homer, J. B., and Lossing, F. P., J. Am. Chem.
, Soc, 87,957 (1965). [10] Kise r, R. W., and Hobrock, D. L., J. Am. Chem. Soc. 87,922
(1965). [IlJ Forman, F. H. , ]. Chem. Phys. 44, 35 (1966). . [12] Cook, G. R., a nd Ching, 8. K., J. Che m. Ph ys. 43,1794 (1963). [13] NBS Circular 500. . [14] NBS Technical Note 270-3 , Wagman, D. D. , Evans, W. H.,
Halow, 1. , Parker , V. 8. , Bailey, S. M. , and Schumm , R. H. (January i968).
[15] J ANAF TABLES- The Dow Chemical Co. [16] Sinke, G. c., J. Chem. Eng. Data 10, 295 (1965).
. [17] Tschuikow-Rou x, E., J . Phys. Chem. 69, 1075-1077 (1965). [18] Tschuikow·Ro ux, E., J. Chem. Phys. 43, 2251 (1965).
[19] Coo mber, J. W., and Whittle, E., Trans. Faraday Soc. 62, 2183 (1966).
[20] Coomber, J . W., and Whittle, E., Trans. Faraday Soc. 63, 608 (1967).
[21J Coomber, J. W., and Whittle, E., Trans. Faraday Soc. 63 , 1394 (1967).
[22] Sinke , G. A., J. Phys. Chem. 70, 1326 (1966). [231 Lord , A., Goy, C. A., and Pritchard , H. D., mentioned by Lacher
and Skinner [29] to be publi shed. [24] Goy, C. A., Lord, A., and Pritcha rd, H. D., J . Phys. Chem. 71,
1086- 9 (1967). [25J Am pheett, J. c., Coomber, J. W ., and Whittle, E., J. Phys.
Chem. 70, 593-4 (1966). [26] Fessenden, R. W. , and Schuler, R. H., J. Chem. Phys. 43,2704
(1965). [27] Benson, S. W., Chem. Ed uc. 42, 502 (1965). [28] Kerr, J. A., Chem. Rev ie ws 66, 4·65 (1966). [29] Lacher, J. R., and Skinn er, 1-1 . A. , (p riva te com munica tion). [30] John son, G. K. , Feder, H. M. , a nd Hubba rd , W. N., J. Phys.
Chem. 70, 1 (1966). [31] Domalski , E. S., and Arms trong, G. T. , J . Res. NBS 71A Whys.
and Chem.), No. 2, 105 (1967). [32] Lifshitz, c., and Chupka, W. A., J. Che m. Phys. 47, 3439
(1967). [33] Dibeler, V. H., and Reese, R. M. , ]. Res. NBS A68 (phys. and
Chem.), No.4, 409 (1964). [34] Wheaton , J. E. G., J. Opt. Soc. Am. 54, 1287 (1964). [35] Chupka, W. A., and Berkowitz, J., J. Chem. Phys. 4 7 , 2921
(1967), Steiner, 8., Giese, C. F., and Inghram , M. G., J. Chem. Phys. 34, 189 (1961), Dibeler, V. H. , Krauss, M., Reese, R. M., and Harlee, F. N., J. Chem. Phys. 42, 3791 (1965).
[36] Interatomic Distances, Special Pub!. No. 18 and Supp\. , The Chemical Society (London, 1965).
[37aJ Walsh, A. D., J. Chem. Soc., p. 2260-2330 (1953). [37b] Jahn , H. A. , and Teller, E., Proc. Roy. Soc. (Londo n) A161,
220 (1937). [38] Pauling, L., The Nature of the Chemical Bond, p. 237 (Cornell
University Press, Ithaca, N.Y. , 1945). [39] Cotton, F. A., and Letto , J. R. , J. Chem. P hys. 30, 993 (1959). [40] Rosenstock, H. M., Doctoral Thes is, Un iversity of Utah (1954). [41] Palko, A. A., and Drury, S., J . Che m. P hys. 47,2561 (l967) .
(Paper 72A5-515)
3 12-248 0 - 68- 3 485