Mass Production Cost Estimation for Direct H2 PEM Fuel Cell Systems for Automotive Applications
125
Mass Production Cost Estimation for Direct H 2 PEM Fuel Cell Systems for Automotive Applications: 2010 Update September 30, 2010 Prepared by: Brian D. James, Jeffrey A. Kalinoski & Kevin N. Baum One Virginia Square 3601 Wilson Boulevard, Suite 650 Arlington, Virginia 22201 703‐243‐3383 Prepared under: Subcontract No. AGB‐0‐40628‐01 to the National Renewable Energy Laboratory (NREL) under Prime Contract No. DE‐AC36‐08GO28308 to the U.S. Department of Energy
Transcript of Mass Production Cost Estimation for Direct H2 PEM Fuel Cell Systems for Automotive Applications

Mass Production Cost Estimation for Direct H2 PEM Fuel Cell Systems for Automotive Applications 2010 Update
September 30 2010
Prepared by
Brian D James Jeffrey A Kalinoski amp Kevin N Baum
One Virginia Square 3601 Wilson Boulevard Suite 650 Arlington Virginia 22201 703‐243‐3383
Prepared under
Subcontract No AGB‐0‐40628‐01 to the National Renewable Energy Laboratory (NREL) under Prime Contract No DE‐AC36‐08GO28308 to the US Department of Energy
Foreword Energy security is fundamental to the mission of the US Department of Energy (DOE) and hydrogen fuel cell
vehicles have the potential to eliminate the need for oil in the transportation sector Fuel cell vehicles can operate on hydrogen which can be produced domestically emitting less greenhouse gasses and pollutants than conventional internal combustion engine (ICE) advanced ICE hybrid or plug‐in hybrid vehicles that are tethered to petroleum fuels A diverse portfolio of energy sources can be used to produce hydrogen including nuclear coal natural gas geothermal wind hydroelectric solar and biomass Thus fuel cell vehicles offer an environmentally clean and energy‐secure transportation pathway for transportation
Fuel cell systems will have to be cost‐competitive with conventional and advanced vehicle technologies to gain the market‐share required to influence the environment and reduce petroleum use Since the light duty vehicle sector consumes the most oil primarily due to the vast number of vehicles it represents the DOE has established detailed cost targets for automotive fuel cell systems and components To help achieve these cost targets the DOE has devoted research funding to analyze and track the cost of automotive fuel cell systems as progress is made in fuel cell technology The purpose of these cost analyses is to identify significant cost drivers so that RampD resources can be most effectively allocated toward their reduction The analyses are annually updated to track technical progress in terms of cost and to indicate how much a typical automotive fuel cell system would cost if produced in large quantities (up to 500000 vehicles per year)
The capacity to produce fuel cell systems at high manufacturing rates does not yet exist and significant investments will have to be made in manufacturing development and facilities in order to enable it Once the investment decisions are made it will take several years to develop and fabricate the necessary manufacturing facilities Furthermore the supply chain will need to develop which requires negotiation between suppliers and system developer with details rarely made public For these reasons the DOE has consciously decided not to analyze supply chain scenarios at this point instead opting to concentrate its resources on solidifying the tangible core of the analysis ie the manufacturing and materials costs
The DOE uses these analyses as tools for RampD management and tracking technological progress in terms of cost Consequently non‐technical variables are held constant to elucidate the effects of the technical variables For example the cost of platinum is held at $1100 per troy ounce to insulate the study from unpredictable and erratic platinum price fluctuations Sensitivity analyses are conducted to explore the effects of non‐technical parameters
To maximize the benefit of our work to the fuel cell community DTI strives to make each analysis as transparent as possible The transparency of the assumptions and methodology serve to strengthen the validity of the analysis We hope that these analyses have been and will continue to be valuable tools to the hydrogen and fuel cell RampD community
Directed Technologies Inc ii
Table of Contents 1 Overview 1 2 Project Approach 2 3 Summary of Results4
31 Changes since the 2009 Update Report 4 32 System Schematics 7
321 2008 System Schematic 7 322 2009 System Schematic 9 323 2010 System Schematic 10 324 2015 System Schematic 11
33 System Cost Summaries 12 331 Cost Summary of the 2010 Technology System 12 332 Cost Summary of the 2015 Technology System 13
34 Cost Comparison of the Two Systems 14 4 Detailed Assumptions 16
41 System Performance and Operation 16 42 Manufacturing Cost 18
421 Machine Rate Validation 20 422 Material and Part Yields 22
43 Markup Rates 23 44 Fuel Cell Stack Materials Manufacturing and Assembly 24
441 Bipolar Plates 26 4411 Injection‐Molded Bipolar Plates 27 4412 Stamped Bipolar Plates29
44121 Alloy Selection and Corrosion Concerns33 44122 Bipolar Plate Surface Treatments and Coatings 34
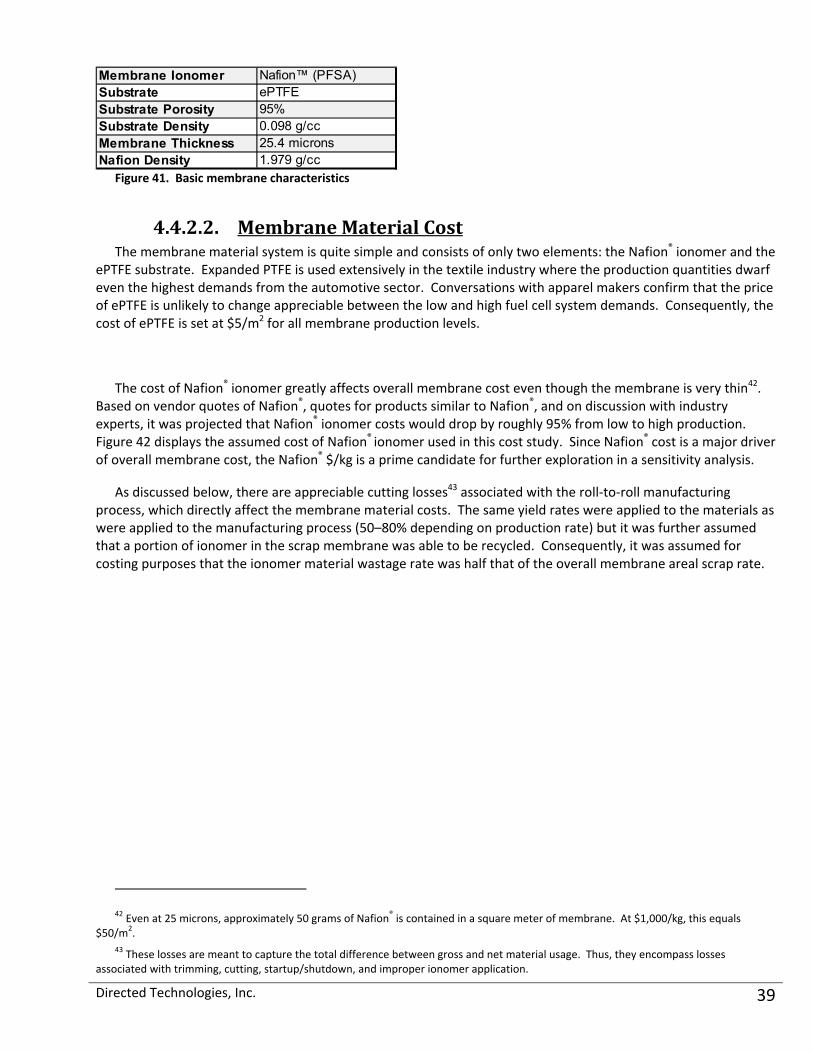
442 Membrane 38 4421 Membrane Material amp Structure (Nafionreg on ePTFE)38 4422 Membrane Material Cost39 4423 Membrane Manufacturing Cost 40 4424 Total Membrane Cost and Comparison to Other Estimates 45
443 Nanostructured Thin Film (NSTF) Catalyst Application 46 4431 Application Process47 4432 Cost and Performance Assumptions48 4433 Results49
444 Catalyst Cost 51 445 Gas Diffusion Layer 52 446 MEA Gaskets and MEA Assembly 55
4461 Hot‐Pressing the Membrane and GDLs 55 4462 Cutting amp Slitting57 4463 Insertion‐Molding the FrameGasket 59
447 End Plates 61 448 Current Collectors 65
Directed Technologies Inc iii
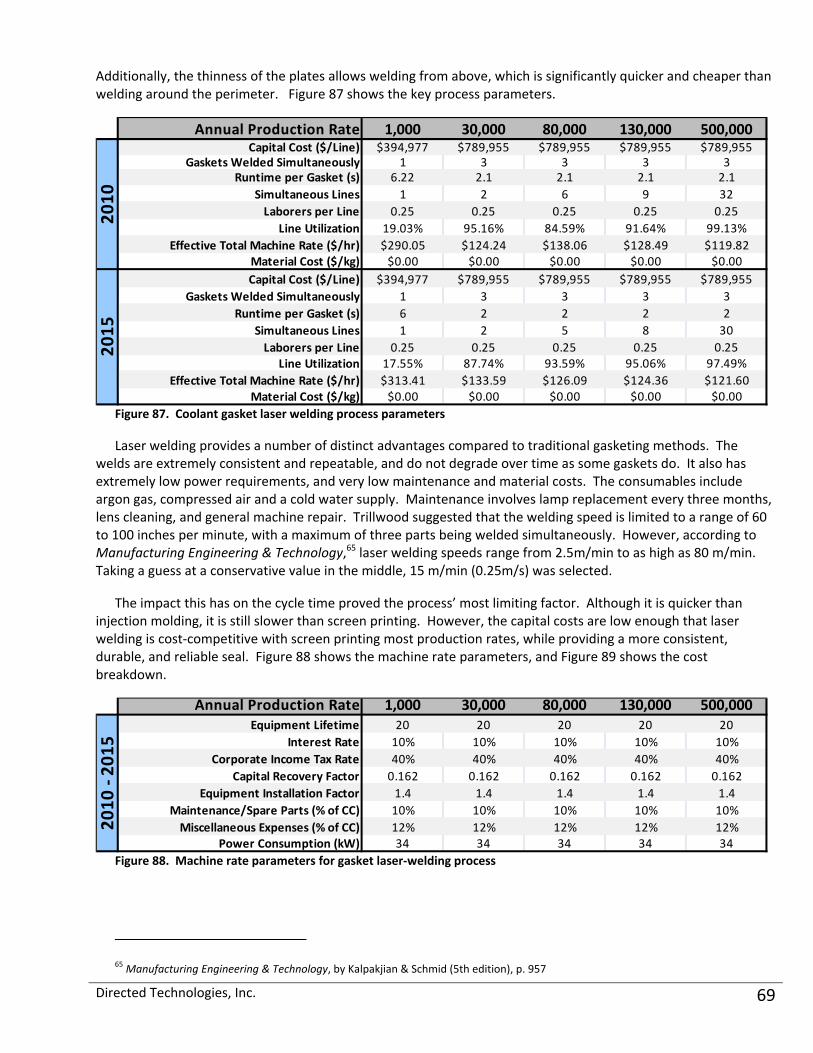
449 Coolant Gaskets 66 4491 Insertion‐Molded Coolant Gaskets 67 4492 Laser‐Welded Coolant Gaskets 68 4493 Screen‐Printed Coolant Gaskets 70
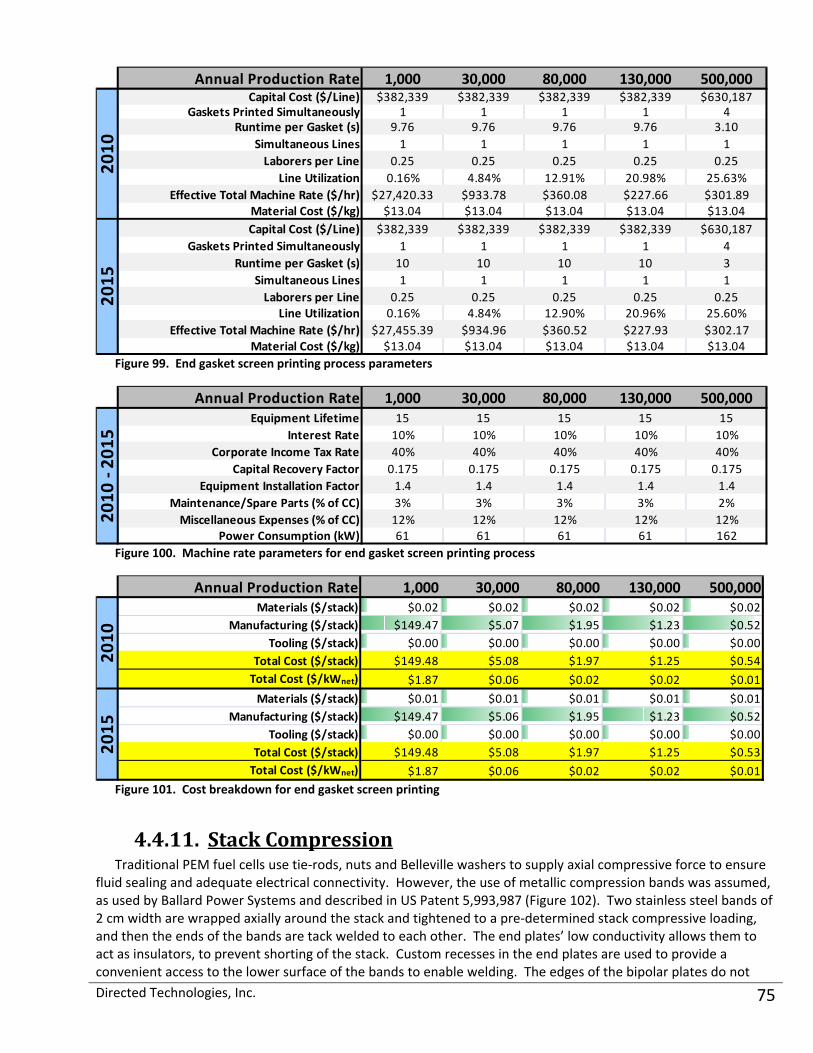
4410 End Gaskets 73 44101 Insertion‐Molded End Gaskets 73 44102 Screen‐Printed End Gaskets 74
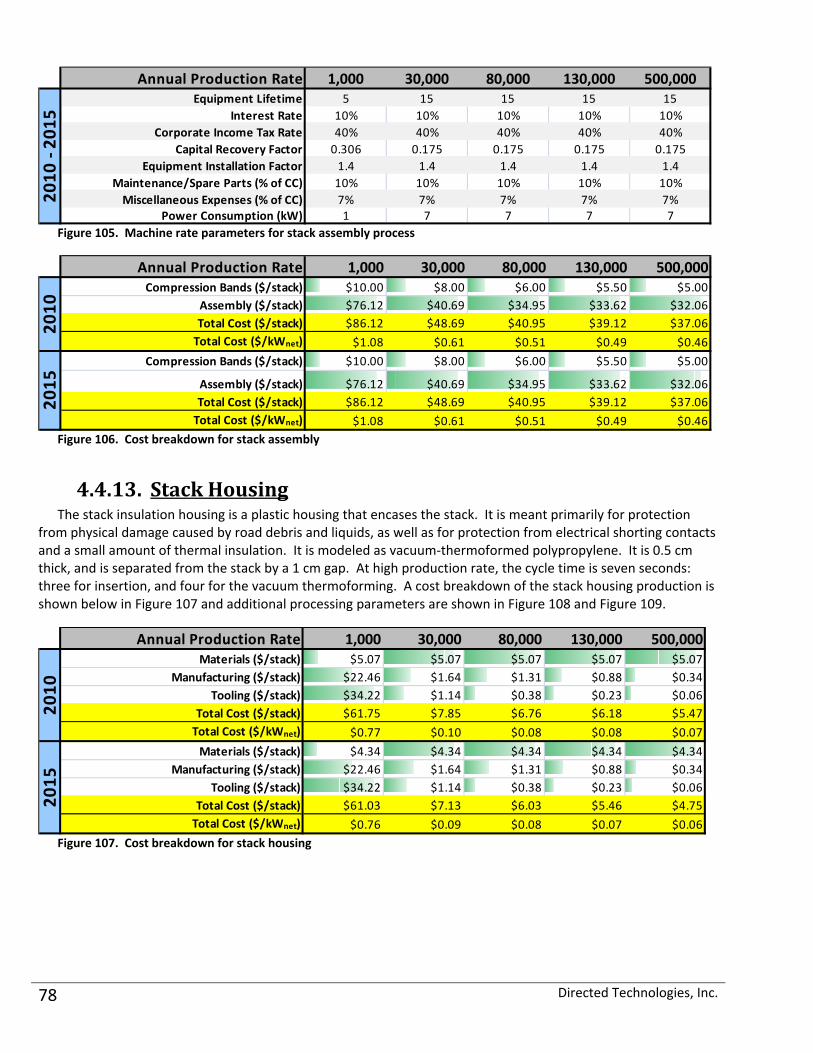
4411 Stack Compression 75 4412 Stack Assembly 76 4413 Stack Housing 78 4414 Stack Conditioning and Testing 79
45 Balance of Plant (BOP) 81 451 Air Loop 81
4511 Compressor‐Expander‐Motor Unit amp Motor Controller 82 4512 Air Mass Flow Sensor 86 4513 Air Ducting 86 4514 Air Filter and Housing 87
452 Humidifier amp Water Recovery Loop 87 4521 Air Precooler 87 4522 Demister 88 4523 Membrane Humidifier 89
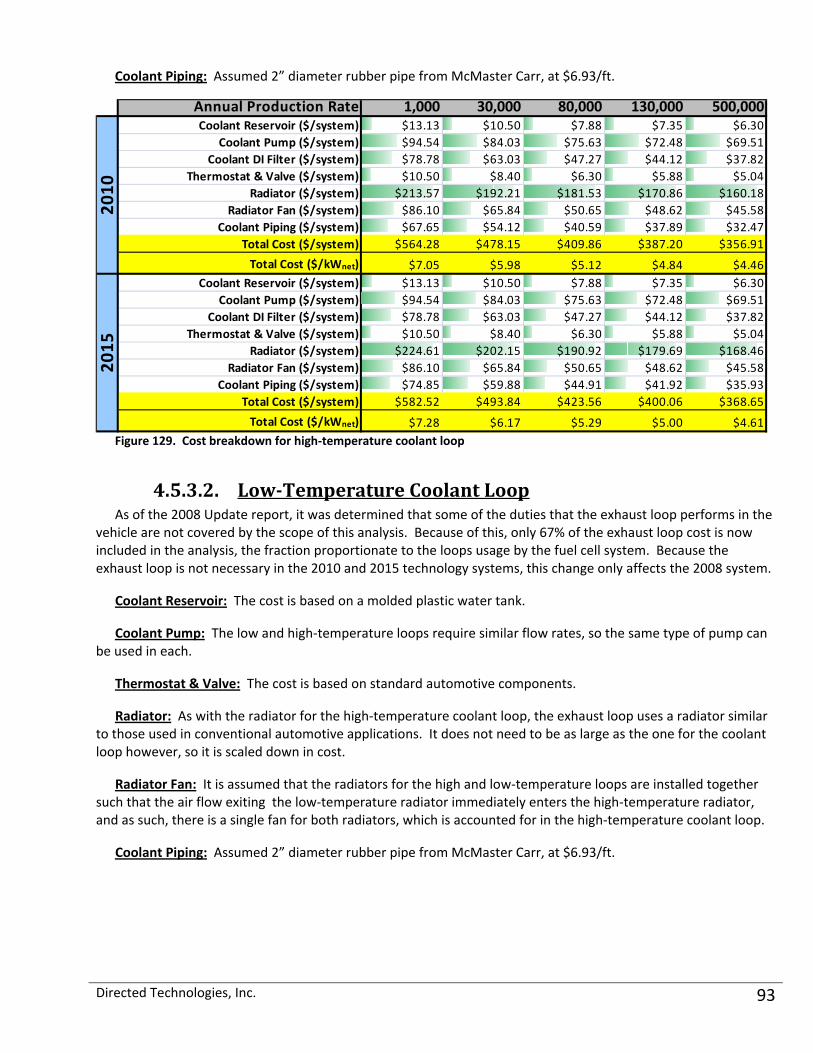
453 Coolant Loops 92 4531 High‐Temperature Coolant Loop 92 4532 Low‐Temperature Coolant Loop 93
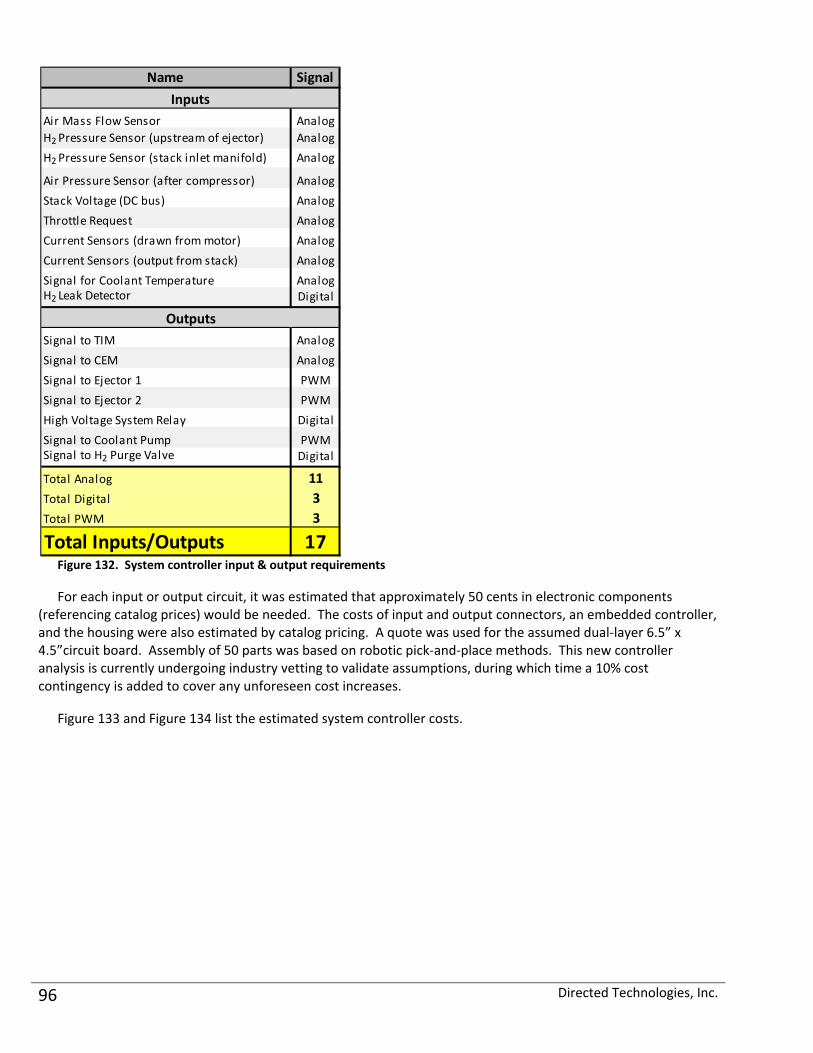
454 Fuel Loop 94 455 System Controller 95 456 Sensors 97
4561 Current Sensors 98 4562 Voltage Sensors 98 4563 Hydrogen Sensors 98
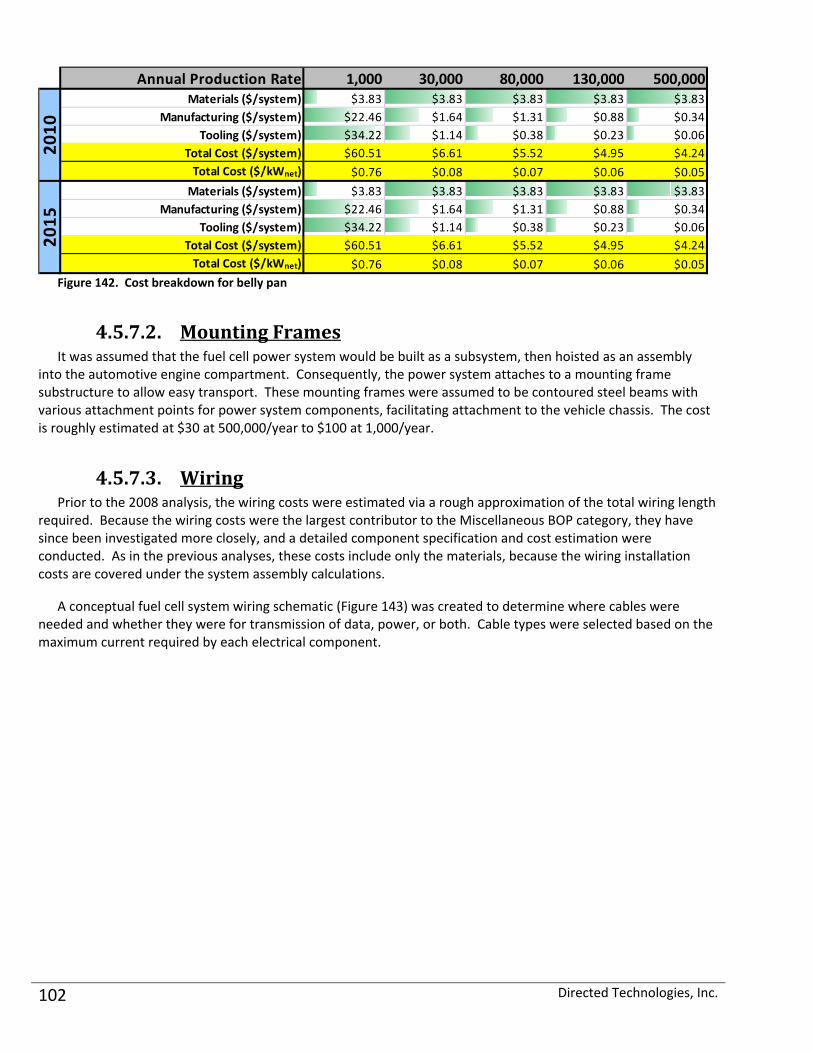
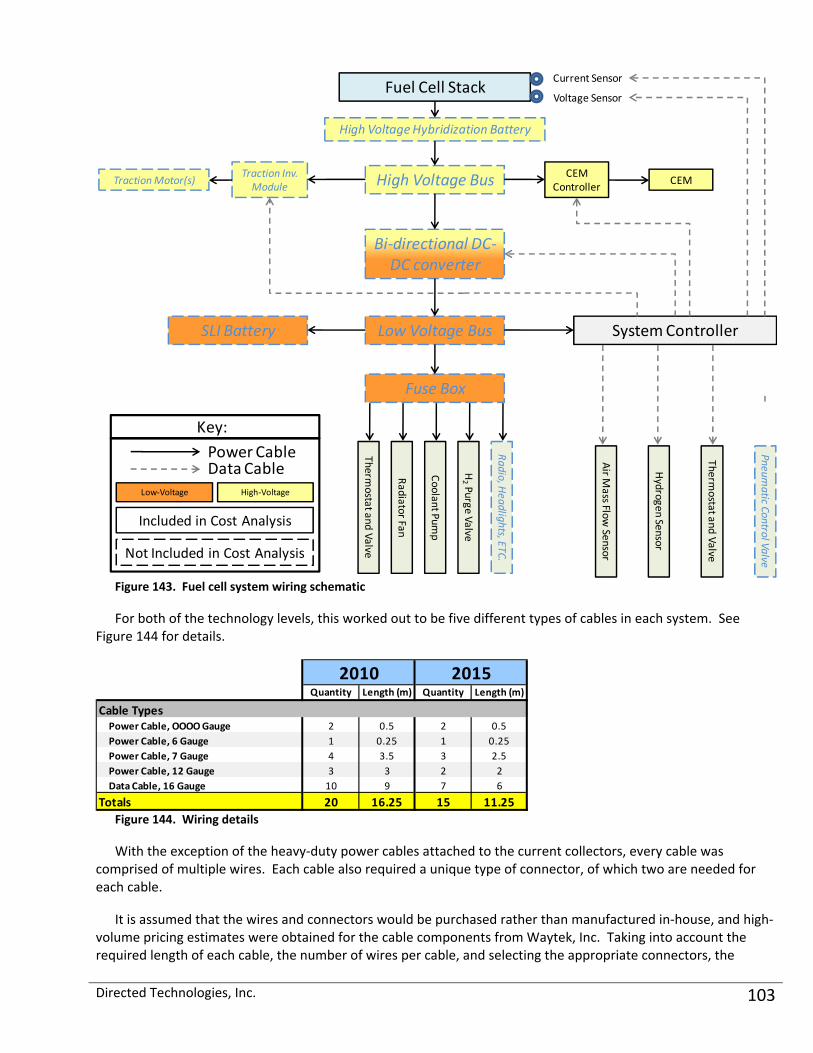
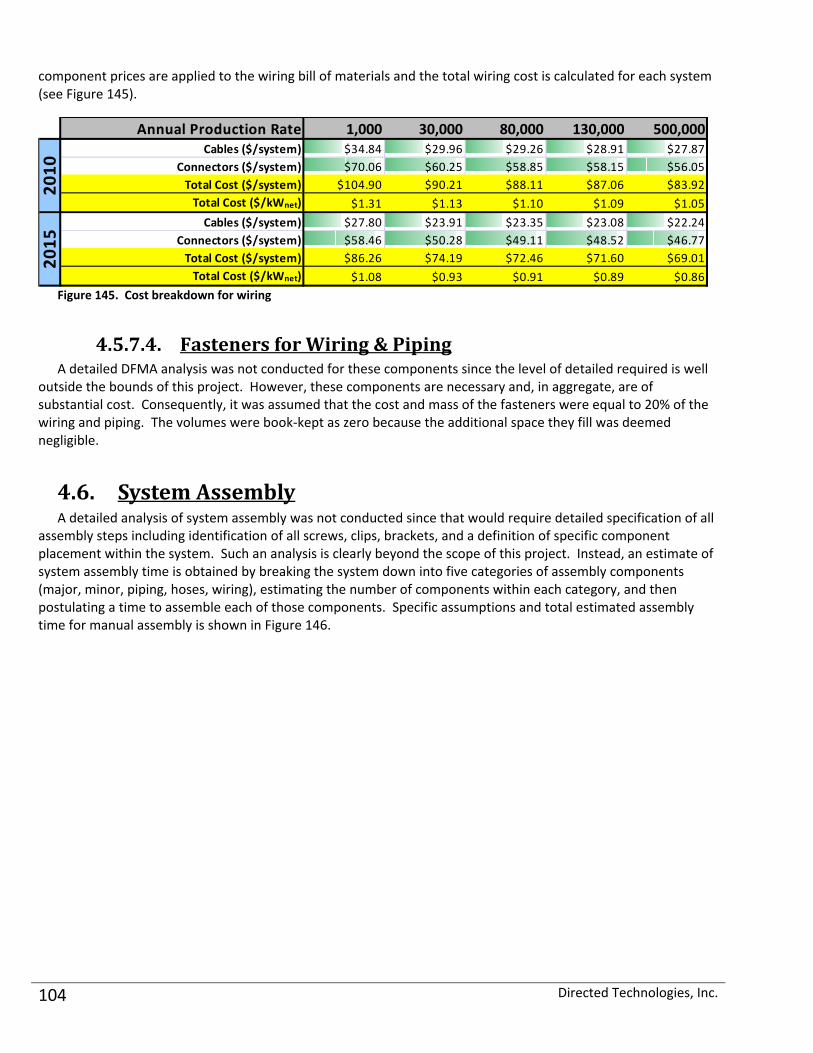
457 Miscellaneous BOP 99 4571 Belly Pan 100 4572 Mounting Frames 102 4573 Wiring 102 4574 Fasteners for Wiring amp Piping 104
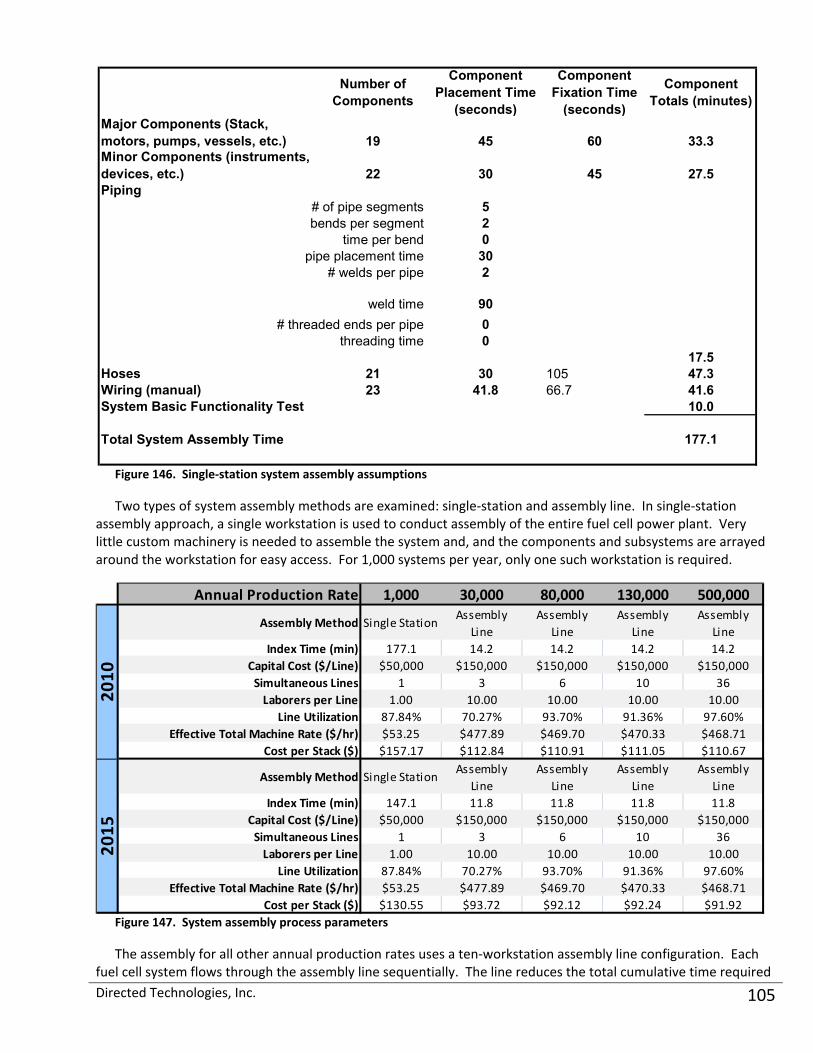
46 System Assembly 104 47 System Testing 106 48 Cost Contingency 106
5 Sensitivity Analysis 107 51 Monte Carlo Parameters 107 52 Monte Carlo Results 108 53 Single‐Variable Sensitivity 110 54 Peak Power Operating Point 113
6 Conclusions 114 Directed Technologies Inc iv
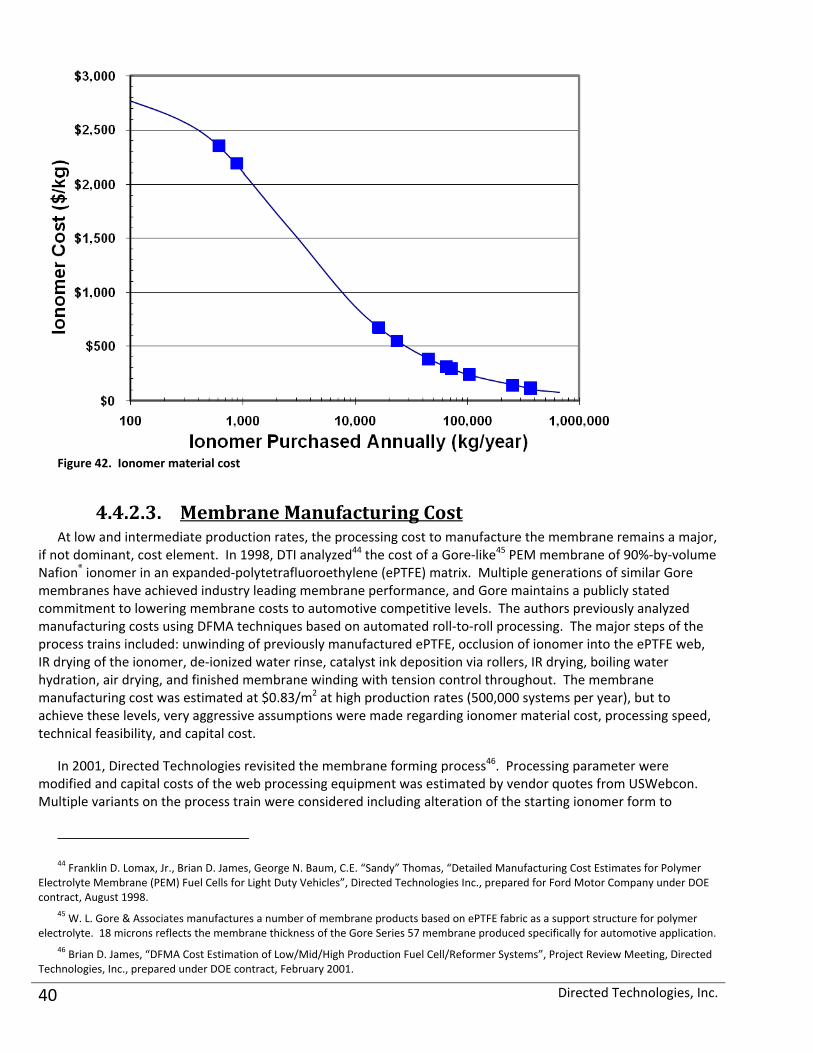
Table of Figures Figure 1 Changes in system costs since 2009 update 6 Figure 2 Summary chart of the two different systems analyzed 7 Figure 3 Flow schematic for the ldquocurrent technologyrdquo fuel cell system from 2008 8 Figure 4 Flow schematic for the ldquocurrent technologyrdquo fuel cell system from 2009 9 Figure 5 Flow schematic for the ldquocurrent technologyrdquo (2010) fuel cell system 10 Figure 6 Flow schematic for the 2015 fuel cell system11 Figure 7 Detailed stack cost for the 2010 technology system 12 Figure 8 Detailed balance of plant cost for the 2010 technology system 12 Figure 9 Detailed system cost for the 2010 technology system 13 Figure 10 Detailed stack cost for the 2015 technology system 13 Figure 11 Detailed balance of plant cost for the 2015 technology system 14 Figure 12 Detailed system cost for the 2015 technology system14 Figure 13 Gross stack cost vs annual production rate 15 Figure 14 Net system cost vs annual production rate 15 Figure 15 Basis of air compressor and expander power16 Figure 16 Power production amp loads at max power under peak ambient temp operating conditions16 Figure 17 Stack design parameters 17 Figure 18 Stack operation parameters17 Figure 19 Cell geometry 18 Figure 20 Cell dimensions 18 Figure 21 Injection‐molding machine rate vs machine clamping force21 Figure 22 Machine rate vs machine utilization 22 Figure 23 Material and part yield percentages applied23 Figure 24 Representative markup rates (but not applied to cost estimates)24 Figure 25 Exploded stack view (abridged to 2 cells for clarity)25 Figure 26 Stack cross‐section 26 Figure 27 Injection‐molding machine cost vs clamp force 27 Figure 28 Bipolar plate injection‐molding process parameters28 Figure 29 Machine rate parameters for bipolar plate injection‐molding process28 Figure 30 Cost breakdown for injection‐molded bipolar plates 29 Figure 31 Bipolar plate stamping process diagram29 Figure 32 Capital costs breakdown for a typical bipolar plate stamping production line 30 Figure 33 Press speed vs press force 31 Figure 34 Cost breakdown for stamped bipolar plates32 Figure 35 Machine rate parameters for bipolar plate stamping process 32 Figure 36 Bipolar plate stamping process parameters 33 Figure 37 Magnified chromium nitride surface conversion36 Figure 38 Impact of plate spacing on nitriding cost37 Figure 39 Conductive vias shown in US patent 730954037 Figure 40 Cost breakdown for TreadStone LiteCell bipolar plate coating process38 Figure 41 Basic membrane characteristics 39 Figure 42 Ionomer material cost40 Figure 43 Membrane fabrication process diagram42 Figure 44 Simplified membrane manufacturing cost analysis assumptions44 Figure 45 Membrane manufacturing cost vs annual membrane manufacturing volume45 Figure 46 Membrane (material + manufacturing) cost compared to previous analysis and vendor quotes 46 Figure 47 Cost breakdown for un‐catalyzed membrane 46 Figure 48 NSTF production process diagram 48 Figure 49 Capital costs of NSTF manufacturing line 48
Directed Technologies Inc v
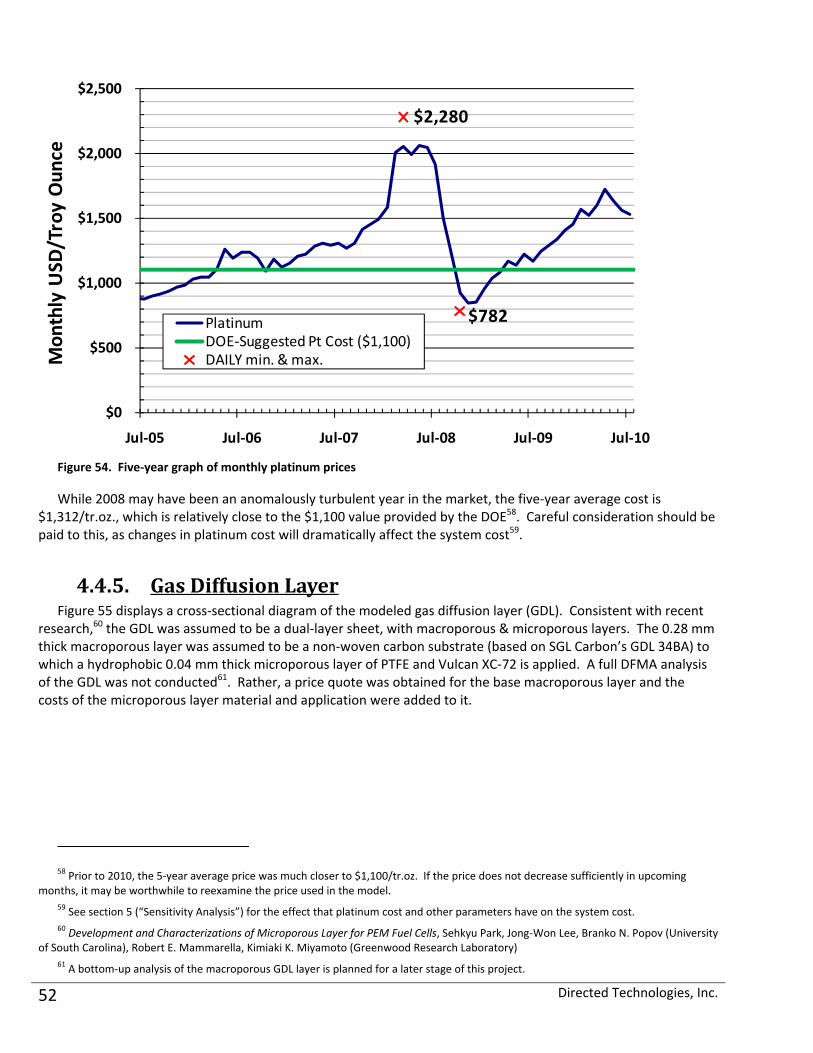
Figure 50 Cost comparison between NSTF and VertiCoater methods 50 Figure 51 NSTF application process parameters 50 Figure 52 Machine rate parameters for NSTF application process 50 Figure 53 Cost breakdown for NSTF application process 51 Figure 54 Five‐year graph of monthly platinum prices 52 Figure 55 Cross‐section of gas diffusion layer in stack 53 Figure 56 Dual‐layer GDL process diagram 54 Figure 57 Capital cost breakdown for a typical microporous layer application line 54 Figure 58 GDL manufacturing process parameters (microporous layer addition only) 55 Figure 59 Machine rate parameters for GDL manufacturing process 55 Figure 60 Cost breakdown for gas diffusion layers 55 Figure 61 Hot‐pressing process diagram 56 Figure 62 Hot‐pressing process parameters 57 Figure 63 Machine rate parameters for hot‐pressing process 57 Figure 64 Cost breakdown for hot‐pressing process 57 Figure 65 Cutting amp slitting process diagram 58 Figure 66 Capital cost breakdown for the cutting and slitting process 58 Figure 67 Cutting amp slitting process parameters 58 Figure 68 Machine rate parameters for cutting amp slitting process 59 Figure 69 Cost breakdown for cutting amp slitting process 59 Figure 70 Insertion‐molded framegasket concept US patent 7070876 59 Figure 71 MEA framegasket materials comparison 60 Figure 72 MEA framegasket insertion‐molding process parameters 61 Figure 73 Machine rate parameters for MEA framegasket insertion‐molding process 61 Figure 74 Cost breakdown for MEA framegasket insertion molding 61 Figure 75 End plate concept US patent 6764786 62 Figure 76 End plate amp current collector 63 Figure 77 End plate compression molding process parameters 64 Figure 78 Machine rate parameters for compression molding process 64 Figure 79 Cost breakdown for end plates 64 Figure 80 Current collector manufacturing process parameters 65 Figure 81 Machine rate parameters for current collector manufacturing process 66 Figure 82 Cost breakdown for current collector manufacturing process 66 Figure 83 Coolant gasket manufacturing method cost comparison (for 2010 technology) 67 Figure 84 Gasket insertion‐molding process parameters 68 Figure 85 Machine rate parameters for gasket insertion‐molding process 68 Figure 86 Cost breakdown for gasket insertion‐molding 68 Figure 87 Coolant gasket laser welding process parameters 69 Figure 88 Machine rate parameters for gasket laser‐welding process 69 Figure 89 Cost breakdown for coolant gasket laser welding 70 Figure 90 Screen printer comparison 71 Figure 91 Screen printer cost vs annual production rate 71 Figure 92 Coolant gasket screen‐printing process parameters 72 Figure 93 Machine rate parameters for coolant gasket screen printing process 72 Figure 94 Cost breakdown for coolant gasket screen printing 73 Figure 95 End gasket manufacturing method cost comparison (for 2008 technology) 73 Figure 96 End gasket insertion‐molding process parameters 74 Figure 97 Machine rate parameters for end gasket insertion‐molding process 74 Figure 98 Cost breakdown for end gasket insertion molding 74 Figure 99 End gasket screen printing process parameters 75 Figure 100 Machine rate parameters for end gasket screen printing process 75
Directed Technologies Inc vi
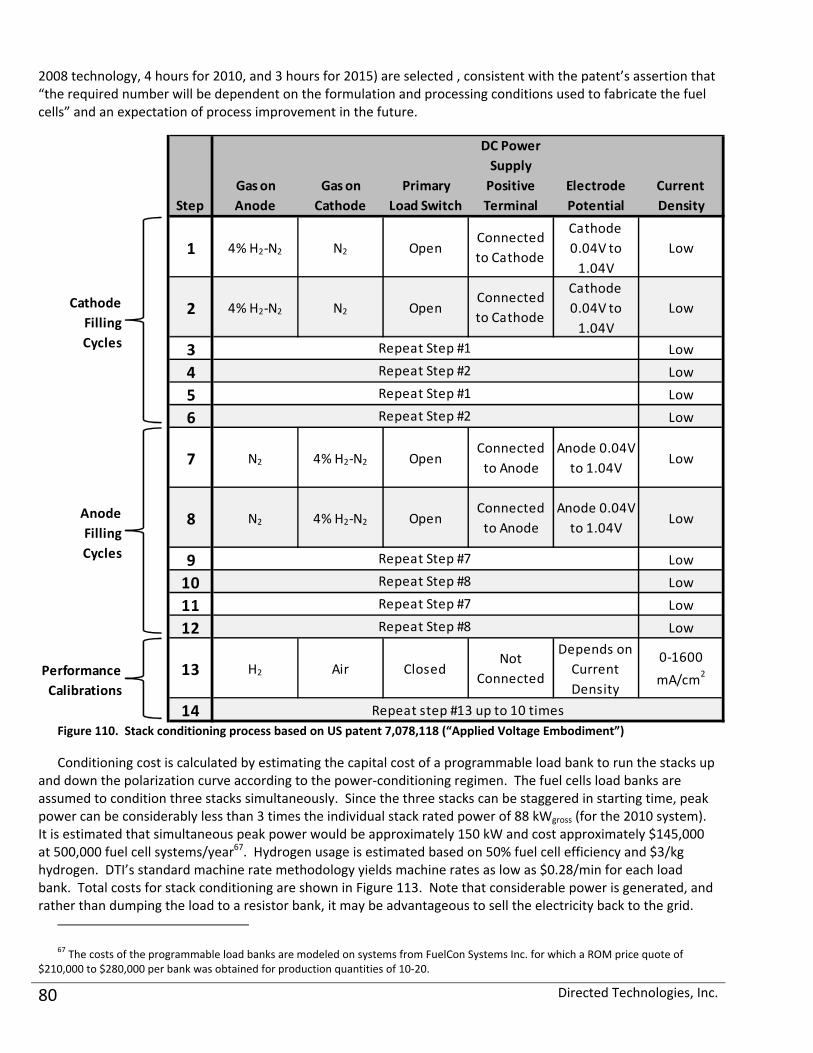
Figure 101 Cost breakdown for end gasket screen printing 75 Figure 102 Stack compression bands concept US patent 599398776 Figure 103 Semi‐automated stack assembly work flow diagram 77 Figure 104 Stack assembly process parameters 77 Figure 105 Machine rate parameters for stack assembly process 78 Figure 106 Cost breakdown for stack assembly78 Figure 107 Cost breakdown for stack housing78 Figure 108 Stack housing vacuum thermoforming process parameters 79 Figure 109 Machine rate parameters for stack housing vacuum thermoforming process 79 Figure 110 Stack conditioning process based on US patent 7078118 (ldquoApplied Voltage Embodimentrdquo)80 Figure 111 Stack conditioning process parameters 81 Figure 112 Machine rate parameters for stack conditioning process 81 Figure 113 Cost breakdown for stack conditioning 81 Figure 114 Cost breakdown for air loop 82 Figure 115 Matrix of CEM design configurations83 Figure 116 List of Improvements for the 6 Compressor Configurations 84 Figure 117 CEM cost results86 Figure 118 Cost breakdown for humidifier amp water recovery loop87 Figure 119 Cost breakdown for air precooler 87 Figure 120 Cost breakdown for demister 88 Figure 121 Demister injection molding process parameters88 Figure 122 Machine rate parameters for demister injection molding process 89 Figure 123 Perma Pure FC200‐780‐7PP humidifier 89 Figure 124 Membrane humidifier manufacturing process diagram90 Figure 125 Capital cost breakdown for a typical membrane humidifier manufacturing process 91 Figure 126 Membrane humidifier production process parameters 91 Figure 127 Machine rate parameters for membrane humidifier production process 92 Figure 128 Cost breakdown for membrane air humidifier 92 Figure 129 Cost breakdown for high‐temperature coolant loop93 Figure 130 Cost breakdown for low‐temperature coolant loop94 Figure 131 Cost breakdown for fuel loop 95 Figure 132 System controller input amp output requirements 96 Figure 133 System controller component costs 97 Figure 134 Cost breakdown for system controller 97 Figure 135 Sensor details 97 Figure 136 Cost breakdown for sensors 98 Figure 137 Hydrogen sensors amp associated control electronics 99 Figure 138 Cost breakdown for hydrogen sensors 99 Figure 139 Cost breakdown for miscellaneous BOP components 100 Figure 140 Belly pan thermoforming process parameters 101 Figure 141 Machine rate parameters for belly pan thermoforming process 101 Figure 142 Cost breakdown for belly pan 102 Figure 143 Fuel cell system wiring schematic103 Figure 144 Wiring details 103 Figure 145 Cost breakdown for wiring104 Figure 146 Single‐station system assembly assumptions 105 Figure 147 System assembly process parameters 105 Figure 148 Cost breakdown for system assembly amp testing106 Figure 149 Monte Carlo parameters for 2010 technology 500k sysyr107 Figure 150 Monte Carlo parameters for 2015 technology 500k sysyr107 Figure 151 Monte Carlo results for fuel cell stack cost (2010 technology 500k sysyr) 109
Directed Technologies Inc vii
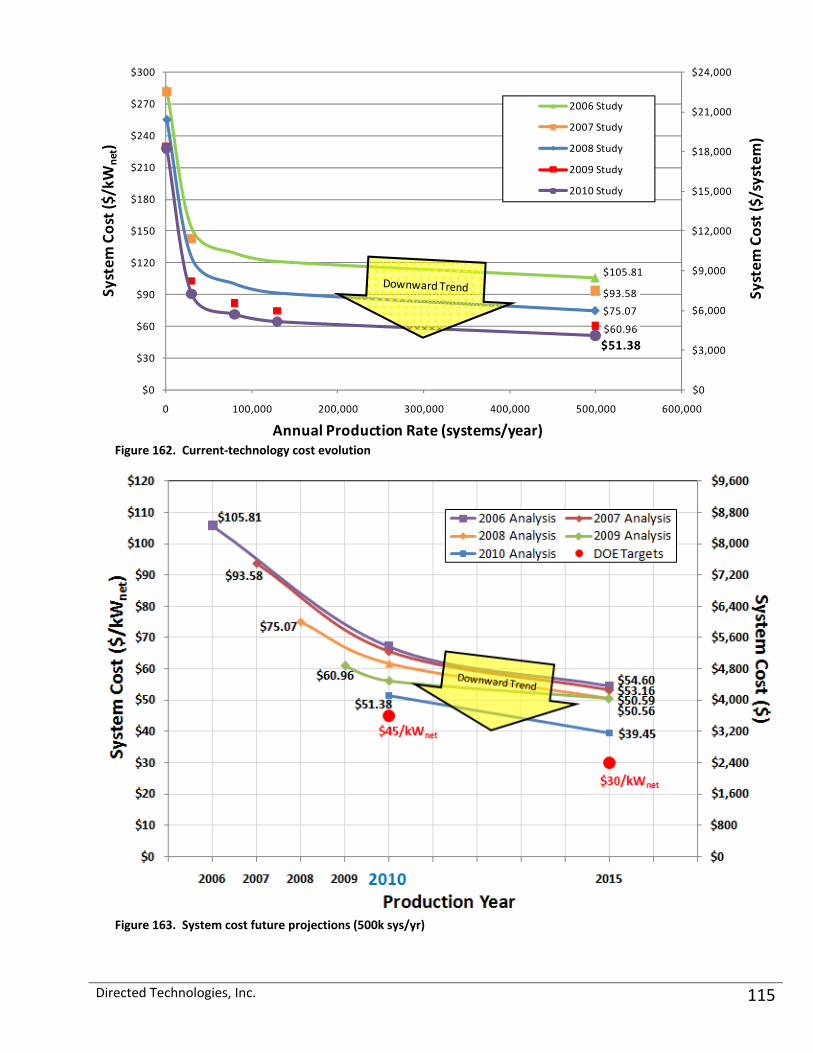
Figure 152 Monte Carlo results for fuel cell stack cost (2015 technology 500k sysyr) 109 Figure 153 Monte Carlo results for fuel cell system cost (2010 technology 500k sysyr) 110 Figure 154 Monte Carlo results for fuel cell system cost (2015 technology 500k sysyr) 110 Figure 155 Inputs amp cost results for tornado chart (2010 technology 500k sysyr) 111 Figure 156 Tornado chart cost results for single‐variable sensitivity analysis (2010 technology 500k sysyr)111 Figure 157 Inputs and cost results for tornado chart (2015 technology 500k sysyr) 112 Figure 158 Tornado chart of cost results for single‐variable sensitivity analysis (2015 technology 500k sysyr) 112 Figure 159 Results of shifted power operating point 113 Figure 160 Gross stack cost vs annual production rate 114 Figure 161 Net system cost vs annual production rate 114 Figure 162 Current‐technology cost evolution 115 Figure 163 System cost future projections (500k sysyr) 115 Figure 164 DOE targets vs DTI estimates for the stack amp system 116
Directed Technologies Inc viii
1 Overview This report is the fourth annual update of a comprehensive automotive fuel cell cost analysis1 conducted by
Directed Technologies Inc (DTI) under contract to the US Department of Energy (DOE) The first report (hereafter called the ldquo2006 cost reportrdquo) estimated fuel cell system cost for three different technology levels a ldquocurrentrdquo system that reflected 2006 technology a system based on projected 2010 technology and another system based on projections for 2015 The 2007 Update report incorporated technology advances made in 2007 and re‐appraised the projections for 2010 and 2015 Based on the earlier report it consequently repeated the structure and much of the approach and explanatory text The 2008 and 2009 Update reports followed suit and this 2010 Update report2 is another annual reappraisal of the state of technology and the corresponding costs However because the current year is now 2010 the ldquocurrentrdquo technology and the 2010 projected technology have merged leaving only two technology levels to be examined the current status (2010) and the 2015 projection The reader is directed to section 31 for a high‐level summary of the changes since the 2009 report
In this multi‐year project DTI estimates the material and manufacturing costs of complete 80 kWnet direct‐hydrogen Proton Exchange Membrane (PEM) fuel cell systems suitable for powering light‐duty automobiles To assess the cost benefits of mass manufacturing five annual production rates are examined for each technology level 1000 30000 80000 130000 and 500000 systems per year
A Design for Manufacturing and Assembly (DFMA) methodology is used to prepare the cost estimates However departing from DFMA standard practice a markup rate to account for the business expenses of general and administrative (GampA) RampD scrap and profit is not currently included in the cost estimates In other DTI cost estimate projects an additional 10 cost contingency has often been included though it has not for this study
In general the system designs do not change with production rate but material costs manufacturing methods and business‐operational assumptions vary Cost estimation at very low manufacturing rates (1000 systems per year) presents particular challenges Traditional low‐cost mass‐manufacturing methods are not cost‐effective due to high per‐unit setup and tooling costs and less defined less automated operations are typically employed For some repeat parts within the fuel cell stack (eg the membrane electrode assemblies (MEAs) and bipolar plates) such a large number of pieces are needed for each system that even at low system production rates (1000year) hundreds of thousands of individual parts are needed annually Thus for these parts mass‐manufacturing cost reductions are achieved even at low system production rates However other stack components (eg end plates and current collectors) and all balance of plant (BOP) equipment (eg compressors hoses and valves) do not benefit from this manufacturing multiplier effect
The 2010 system reflects the authorsrsquo best estimate of current technology and (with a few exceptions3) is not based on proprietary information Public presentations by fuel cell companies and other researchers along with extensive review of the patent literature are used as the basis for much of the design and fabrication technologies Consequently the presented information may lag behind what is being done ldquobehind the curtainrdquo in fuel cell companies Nonetheless the current‐technology system provides a benchmark against which the impact of future technologies may be compared Taken together the analysis of these two systems (2010 and 2015) provides a good sense of the likely range of costs for mass‐produced automotive fuel cell systems and of the dependence of cost on system performance manufacturing and business‐operational assumptions
1 ldquoMass Production Cost Estimation for Direct H2 PEM Fuel Cell Systems for Automotive Applicationsrdquo Brian D James amp Jeff Kalinoski Directed Technologies Inc October 2007
2 For previous analyses DTI was funded directly by the Department of Energyrsquos Energy Efficiency and Renewable Energy Office For the 2010 Annual Update report DTI is funded by the National Renewable Energy Laboratory
3 The following components were modeled based on proprietary information that cannot be fully disclosed Bipolar plate coatings ‐ TreadStone Technologies Inc Turbocompressor ‐ Honeywell
Directed Technologies Inc 1
2 Project Approach The two systems examined (2010 and 2015 technologies) do not reflect the design of any one manufacturer
but are composites of the best elements from a number of designs Both systems were normalized to a system output power of 80 kWnet although their gross powers were derived independently based on the parasitic load from the BOP components using an oxidant stoichiometry4 of 20ndash25 The stack efficiency at rated power for all three systems is pegged at 55 to match the DOE target value Multiplying this by the theoretical open circuit cell voltage (1229 V) yields a cell voltage of 0676 V at peak power Stack pressure levels (at peak power) are projected to decrease with time and were set at 169 and 15 atm56 for the 2010 and 2015 systems respectively
The main fuel cell subsystems included in this analysis are
Fuel cell stacks
Air loop
Humidifier and water recovery loop
High‐temperature coolant loop
Low‐temperature coolant loop
Fuel loop (but not fuel storage)
Fuel cell system controller
Sensors
Some vehicle electrical system components explicitly excluded from the analysis include
Main vehicle battery or ultra capacitor7
Electric traction motor (that drives the vehicle wheels)
Traction inverter module (TIM) (for control of the traction motor)
Vehicle frame body interior or comfort related features (eg driverrsquos instruments seats and windows)
Many of the components not included in this study are significant contributors to the total fuel cell vehicle cost but their design and cost are not necessarily dependent on the fuel cell configuration or operating
4 Air stoichiometry is 25 for 2010 and drops to 20 for 2015 5 The systems operate at these pressures (for both the air and hydrogen streams) at peak power Because a centrifugal air compressor
is used to achieve air pressurization operating pressure is highest at full power and is at a lower level for part‐power operation 6 In earlier years of the analysis (2006‐2008) there was a wider spread of projected stack operating pressures for each of the
technology levels typically 15‐23 atm However as will be discussed within the report polarization curve improvements during the 2009 analysis caused stack pressure to be re‐optimized resulting in a lowering of stack pressure
7 Fuel cell automobiles may be either ldquopure‐bredsrdquo or ldquohybridsrdquo depending on whether they have battery (or ultracapacitor) electrical energy storage or not This analysis only addresses the cost of an 80 kW fuel cell power system and does not include the cost of any peak‐power augmentation or hybridizing battery
Directed Technologies Inc 2
conditions The fuel cell system is the power plant that could be used in a variety of vehicle body types and drive configurations all of which could have a different cost structure
As mentioned above the costing methodology employed in this study is the Design for Manufacture and Assembly technique (DFMA) The Ford Motor Company has formally adopted the DFMA process as a systematic means for the design and evaluation of cost optimized components and systems These techniques are powerful and are flexible enough to incorporate historical cost data and manufacturing acumen that have been accumulated by Ford since the earliest days of the company Since fuel cell system production requires some manufacturing processes not normally found in automotive production the formal DFMA process and DTIrsquos manufacturing database are buttressed with budgetary and price quotations from experts and vendors in other fields It is possible to choose cost‐optimized manufacturing processes and component designs and accurately estimate the cost of the resulting products by combining historical knowledge with the technical understanding of the functionality of the fuel cell system and its component parts
The cost for any component analyzed via DFMA techniques includes direct material cost manufacturing cost assembly costs and markup Direct material costs are determined from the exact type and mass of material employed in the component This cost is usually based upon either historical volume prices for the material or vendor price quotations In the case of materials not widely used at present the manufacturing process must be analyzed to determine the probable high‐volume price for the material The manufacturing cost is based upon the required features of the part and the time it takes to generate those features in a typical machine of the appropriate type The cycle time can be combined with the ldquomachine raterdquo the hourly cost of the machine based upon amortization of capital and operating costs and the number of parts made per cycle to yield an accurate manufacturing cost per part The assembly costs are based upon the amount of time to complete the given operation and the cost of either manual labor or of the automatic assembly process train The piece cost derived in this fashion is quite accurate as it is based upon an exact physical manifestation of the part and the technically feasible means of producing it as well as the historically proven cost of operating the appropriate equipment and amortizing its capital cost Normally (though not in this report) a percentage markup is applied to the material manufacturing and assembly cost to account for profit general and administrative (GampA) costs research and development (RampD) costs and scrap costs This percentage typically varies with production rate to reflect the efficiencies of mass production It also changes based on the business type and on the amount of value that the manufacturer or assembler adds to the product (Markup rate is discussed in more detail in section 43)
Cost analyses were performed for mass‐manufactured systems at five production rates 1000 30000 80000 130000 and 500000 systems per year System designs did not change with production rate but material costs manufacturing methods and business‐operational assumptions (such as markup rates) often varied Fuel cell stack component costs were derived by combining manufacturersrsquo quotes for materials and manufacturing with detailed DFMA‐style analysis
For some components (eg the bipolar plates and the coolant and end gaskets) multiple designs or manufacturing approaches were analyzed The options were carefully compared and contrasted then examined within the context of the rest of the system The best choice for each component was included in one or more of the two baseline configurations (the 2010 and 2015 technology systems) Because of the interdependency of the various components the selection or configuration of one component sometimes affects the selection or configuration of another In order to handle these combinations the model was designed with switches for each option and logic was built in that automatically adjusts variables as needed As such the reader should not assume that accurate system costs could be calculated by merely substituting the cost of one component for another using only the data provided in this report Instead data provided on various component options should be used primarily to understand the decision process used to select the approach selected for the baseline configurations
Directed Technologies Inc 3
3 Summary of Results Complete fuel cell power systems are configured to allow assembly of comprehensive system Bills of Materials
A system configuration summary for both technology levels is shown in Figure 2 below System flow schematics for each of the systems are shown in Figure 3 through Figure 6 Note that for clarity only the main system components are identified in the flow schematics The reader is directed to the full bill of materials (BOM) in Section 45 for a comprehensive listing of system elements
31 Changes since the 2009 Update Report This report represents the fourth annual update of the 2006 DTI fuel cell cost estimate report8 under contract
to the DOE The 2006 report (dated October 2007) documented cost estimates for fuel cell systems based on projected 2006 2010 and 2015 technologies Like the other three updates before it this annual report updates the previous work to incorporate advances made over the course of 2010 These advances include new technologies improvements and corrections made in the cost analysis and alterations of how the systems are likely to develop Since the year is now 2010 the ldquocurrentrdquo technology and the 2010 projected technology have now merged leaving only two technology levels to examine the current status (2010) and the 2015 projection
As was the case with the 2009 Update the majority of changes this year revolve around the BOP components While most of these components are based on modifications of proven existing technology the stack designs are comparatively immature The impact of this is twofold the stack has the most room for technological improvement and the component production methods are less refined Therefore most of the analysis from previous years of the project has been focused on the stack since it provided the most potential for cost savings Since the 2008 status update however the focus has shifted towards the BOP and changes to the stack analysis have primarily been adjustments of operating parameters rather than the additions of new components or changes in design
Almost all of the BOP components were re‐examined in greater detail with extra emphasis on those with the largest contribution to cost The system schematics (see Figure 3 through Figure 6) were refined and components were added and subtracted Detailed analyses were conducted of the wiring and pipingtubing requirements with consideration for flow rates cooling and power requirements and the physical distances between components
A central theme of the past yearrsquos work has been the integration of performance‐parameter‐based scaling into the cost model Although the previous cost model included performance parameters we have enhanced the level of detail and interaction to better reflect actual performance Integration between all of the components (in both the stack and the BOP) has been greatly increased such that geometries and costs now scale dynamically based on a variety of parameters (eg operating pressure air mass flow and cooling and power requirements)
Noteworthy changes since the 2009 Update report are listed below
Changed Temperature at Peak Power from 80degC to 90degC Improved durability allows a higher peak temperature which allows for a smaller radiator
8 ldquoMass Production Cost Estimation for Direct H2 PEM Fuel Cell Systems for Automotive Applicationsrdquo Brian D James Jeff Kalinoski Directed Technologies Inc October 2007
Directed Technologies Inc 4
Lowered Channel Depth of Stamped Bipolar Plates from 092 to 05 mm The flow channel depth of the bipolar plates was reduced from 092 to 05 mm based on industry input This results in a more‐compact stack and the resulting reduction in gasket material lowered the cost by $103kWnet
Areal Power Density Tied Directly to Actual 3M NSTF Performance Curves Previously the stack power density on which the stack was sized was determined by the Fuel Cell Tech Team and represented general stack status and improvements from a range of stack manufacturers For 2010 stack power density is tied to a specific system (3M NSTF catalyst and membranes) and a specific set of operating conditions This enables the entire cost model to more‐realistically reflect changes in operating assumptions
Low‐Temperature Coolant Loop Added A separate lower‐temperature coolant loop is added to support the newly added air precooler However only 39 of the low temperature loop (LTL) cost is included in the fuel cell system cost estimate due to the assumption that part of its thermal duty serves components not included in this cost analysis (eg the traction inverter module)
Reconfigured Fuel Loop Based on industry input the proportional valve and pressure transducer have been removed and an over‐pressure cut‐off valve and check valves were added as well as an inline filter for gas purity excursions It is further assumed that the hydrogen storage system (which is not included in the cost analysis) can handle some of the pressure regulation requirements
Improved System Controller DFMA Analysis A more‐detailed cost analysis was conducted on the system controller (ie the electronic system controller analogous to the Electronic Engine Controller (EEC) in an internal combustion engine vehicle) The new cost projection extends the analysis down to the controller subcomponent level
CEM costs scaled to better reflect operating parameters Based on additional data from Honeywell the compressor‐expander‐motor (CEM) cost analysis was improved to scale dynamically with operating parameters such as power mass flow and pressure ratio
Enlarged Membrane Humidifier The membrane air humidifier was modified to scale based on the actual mass flow rates and to correct a previous membrane area sizing error
Air Precooler and Demister Added Based on interaction with Argonne National Laboratory an air precooler and a demister have been added to the analysis The air precooler lowers the temperature of the compressed air stream to an optimal temperature of 55degC prior to entry into the membrane humidifier The demister removes liquid water droplets from the exhaust gas stream prior to entry into the expander to prevent expander blade erosion
Stack Housing Added A vacuum‐thermoformed polypropylene stack housing has been added as a new component The housing primarily provides physical protection of the stack from liquids road debris and possible electrical shorting contacts but also provides a small amount of thermal insulation
Material and Part Yields Applied Across All Components Material and part yields were applied across every component in the cost model with a newly uniform methodology replacing the previous inconsistent treatment
Improved Wiring Analysis The wiring analysis was examined in greater detail cable lengths were updated by means of examining a more‐detailed system configuration layout and the power and amperage requirements were reassessed for each component Furthermore each cablersquos inclusion in the model is now tied dynamically to the inclusion of the corresponding components
Directed Technologies Inc 5
Assorted BOP Changes Improved cost analysis of many components (hydrogen piping air tubing mass air flow sensor etc)
Miscellaneous Numerous other small changes were made to the fuel cell system cost model the result of which yields a small cumulative net savings Although their net effect is comparatively small the improvements enhance the analysis appreciably and lead to greater confidence in the cost estimates
Figure 1 summarizes the major changes since the 2009 update and the corresponding effects on system cost Figure 2 summarizes the main manufacturing aspects of the two systems analyzed
2010 2015 Change Reason +‐ System Cost +‐ System Cost
Final Values for 2009 Update $6096 $5056 Reconfigured Ejector System Industry input ‐gt removed prop valve amp press
transducer added OPCO amp check valves relies on H2
storage system for some pressure regulation
($483) $5613 ($463) $4593
Improved System Controller DFMA Analysis Improved Cost Analysis by adding greater detail ($170) $5443 ($170) $4423 Lowered channel depth of stamped plates from 092 to 05 mm
Industry input allows gasket material reduction ($103) $5339 ($084) $4339
Changed Temperature at Peak Power from 80degC to 90degC (for 2010) and from 120degC to 99deg (for 2015)
Improved durability allows higher peak temperature ($050) $5289 $085 $4424
Changed Membrane Humidifier to larger model Previous model not large enough to handle mass flow $040 $5329 NA $4424 Added Demister and Air Precooler Added requirement after ANL review $073 $5402 NA $4424 Added Part and Material Yields across all components
Added part yields at component level homogenized methodology
$008 $5410 $007 $4431
Low‐Temperature Coolant Loop reconfigured amp reinserted
Needed for Air Precooler amp CEM but only 39 of LTL cost is included
$077 $5487 NA $4431
Improved Wiring Analysis Improved and updated wire lengths and specifications ($084) $5403 ($063) $4368 CEM costs scaled to better reflect operating parameters
New data from Honeywell improved cost analysis ($065) $5338 ($067) $4301
Assorted BOP Changes Improved Cost Analysis (H2 piping air tubing mass air flow sensor etc)
($209) $5129 ($330) $3971
Miscellaneous Costs Improved Cost Analysis (improved calculations error fixes etc)
$007 $5137 ($025) $3946
Final Values for 2010 Update $5137 $3946
Figure 1 Changes in system costs since 2009 update
Directed Technologies Inc 6
2010 Technology System 2015 Technology System
Power Density (mWcm2) 833 1000
Total Pt loading (mgPtcm2) 015 015
Gross Power (kWgross) 8791 8727
Operating Pressure (atm) 169 15
Peak Stack Temp (degC) 90 99
Active Cells 369 369
Membrane Material Nafion on 25‐micron ePTFE Advanced High‐Temperature Membrane
Radiator Cooling System Aluminum Radiator
WaterGlycol Coolant DI Filter Air Precooler
Smaller Aluminum Radiator WaterGlycol Coolant
DI Filter No Air Precooler
Bipolar Plates Stamped SS 316L with TreadStone Coating Stamped SS 316L with TreadStone Coating
Air Compression Centrifugal Compressor Radial‐Inflow Expander
Centrifugal Compressor No Expander
Gas Diffusion Layers Carbon Paper Macroporous Layer with
Microporous Layer Carbon Paper Macroporous Layer with
Microporous Layer
Catalyst Application Nanostructured Thin Film (NSTF) Nanostructured Thin Film (NSTF)
Air Humidification Tubular Membrane Humidifier None
Hydrogen Humidification None None
Exhaust Water Recovery None None
MEA Containment Injection‐Molded LIM Hydrocarbon MEA FrameGasket around Hot‐Pressed MampE
Injection‐Molded LIM Hydrocarbon MEA FrameGasket around Hot‐Pressed MampE
Coolant amp End Gaskets Laser Welding
Screen‐Printed Adhesive Resin Laser Welding
Screen‐Printed Adhesive Resin
Freeze Protection Drain Water at Shutdown Drain Water at Shutdown
Hydrogen Sensors 2 for FC System
1 for Passenger Cabin (not in cost estimate) 1 for Fuel System (not in cost estimate)
None
End Plates Compression System
Composite Molded End Plates with Compression Bands
Composite Molded End Plates with Compression Bands
Stack Conditioning (hrs) 5 3
Figure 2 Summary chart of the two different systems analyzed
32 System Schematics As the analysis has evolved throughout the course of the annual updates there has been a general trend
toward system simplification This reflects improvements in technology so as not to need as many parasitic supporting systems and facilitates reduced cost Although there has been a small step back in this trend for the 2010 system it is not indicative of a change in trend and merely reflects adjustments in the analysis The path to system simplification is likely to continue and remains necessary for achieving or surpassing the cost parity with internal combustion engines
321 2008 System Schematic The ldquocurrent technologyrdquo system from two years ago (2008) is a fairly standard direct hydrogen pressurized air
fuel cell system configuration It is shown here in order to illustrate the evolution of the system design The 2006 and 2007 configurations are omitted from this report because their schematics are very similar to the 2008 system
Directed Technologies Inc 7
Figure 3 Flow schematic for the ldquocurrent technologyrdquo fuel cell system from 2008
The main features of the 2008 system include
2 separate liquid‐cooled fuel cell stacks plumbed in parallel but connected electrically in series
A twin‐lobe air compressor
A twin‐lobe exhaust air expander
A water spray humidifier to both humidify and cool the inlet cathode air after compression
A liquidgas heat exchanger to condense water in the exhaust stream for recycle to the air humidifier
A high‐temperature coolant loop of waterethylene glycol to maintain a stack temperature of ~80degC
An exhaust loop of waterethylene‐glycol mixture to provide cooling for the exhaust air condenser
o Only 67 of this loop is included in the system cost because the remainder of its duty is for components outside of the scope of this analysis
Twin hydrogen ejectors(high‐flow and low‐flow) to utilize the high pressure (gt 300 psi) in the hydrogen storage tanks to re‐circulate anode hydrogen
Directed Technologies Inc 8
322 2009 System Schematic
Figure 4 Flow schematic for the ldquocurrent technologyrdquo fuel cell system from 2009
The 2009 system is much simpler than that of 2008 and differs in the following key ways
The number of stacks is reduced from 2 to 1
A centrifugal compressor replaces the twin‐lobe compressor
A centrifugal expander replaces the twin‐lobe expander
A membrane humidifier replaces the water spray humidifier
The exhaust gas condenser is eliminated (because there is no need to capture liquid water for the water spray humidifier)
The low‐temperature cooling loop is eliminated (because the condenser has been eliminated)
The high‐temperature radiator is slightly smaller (because the peak operating temperature of the stack has been increased and thus there is a larger temperature difference between the coolant and the ambient temperature)
Directed Technologies Inc 9
323 2010 System Schematic For 2010 the current‐technology system reflects both additions and subtractions to the BOP though there is a
net increase in complexity This increase can be primarily attributed to feedback received from Rajesh Ahuwalia at Argonne National Laboratory suggesting the need for both a demister and an air precooler the latter of which requires the re‐addition of a low‐temperature loop
Figure 5 Flow schematic for the ldquocurrent technologyrdquo (2010) fuel cell system
The 2010 system configuration differs from the 2009 version in the following key ways
The ejector system has been reconfigured with the assumption that the fuel storage system (not included in the cost analysis) handles some of the pressure regulation duties
o The proportional valve has been removed
o The pressure transducer has been removed
o An over‐pressure cut‐off (OPCO) valve has been added
o Check valves have been added
o An inline filter for gas purity excursions has been added
A demister has been added in order to ensure that no ice may form in the expander
Directed Technologies Inc 10
A new low‐temperature cooling loop (different from the one in the 2008 system) has been inserted into the system to cool the previously air‐cooled CEM and the new air precooler It also cools the traction inverter module (TIM) but as this is outside the boundary of this cost analysis the fraction of the LTL cost proportionate to the TIMrsquos cooling duty (61) is excluded from the model
The high‐temperature radiator is once again smaller than the previous year (because the peak operating temperature of the stack has been increased and thus there is a larger temperature difference between the coolant and the ambient temperature)
324 2015 System Schematic In keeping with the general trend of system simplification the 2015 system is the simplest one of all
Figure 6 Flow schematic for the 2015 fuel cell system
It is marked by the following further key configuration changes
The centrifugal compressor shrinks (because the peak cathode air pressure has been further lowered)
The exhaust air expander is eliminated (because the overall cathode air pressure has been reduced and therefore the benefits of an expander are diminished)
The membrane humidifier is eliminated (because an advanced PEM membrane that doesnrsquot require humidification was assumed to be used)
The radiator is further reduced in size (because the stack peak operating temperature is even higher)
Directed Technologies Inc 11
33 System Cost Summaries
331 Cost Summary of the 2010 Technology System Results of the cost analysis of the 2010 technology system at each of the five annual production rates are
shown below Figure 7 details the cost of the stacks Figure 8 details the cost of the balance of plant components and Figure 9 details the cost summation for the system
2010 Annual Production Rate 1000 30000 80000 130000 500000
System Net Electric Power (Output) System Gross Electric Power (Output)
80 8791
80 8791
80 8791
80 8791
80 8791
Bipolar Plates (Stamped) MEAs
$168428 $43415 $43995 $43303 $42907
Membranes $518451 $90884 $56223 $43823 $23078 Catalyst Ink amp Application (NSTF) $125228 $70037 $69557 $69862 $69483 GDLs $214033 $111135 $69153 $53704 $24257 M amp E Hot Pressing $7209 $998 $823 $836 $816 M amp E Cutting amp Slitting $5694 $442 $329 $302 $282 MEA FrameGaskets $46980 $31959 $31195 $30829 $30142
Coolant Gaskets (Laser Welding) $18548 $2648 $2943 $2739 $2554 End Gaskets (Screen Printing) $14948 $508 $197 $125 $054 End Plates $8743 $3355 $2891 $2621 $1986 Current Collectors $1679 $718 $599 $554 $507 Compression Bands $1000 $800 $600 $550 $500 Stack Housing $6144 $754 $644 $587 $516 Stack Assembly $7612 $4069 $3495 $3362 $3206 Stack Conditioning $17088 $5387 $4718 $4138 $2806 Total Stack Cost $1161787 $367108 $287361 $257336 $203092 Total Stack Cost ($kWnet) $14522 $4589 $3592 $3217 $2539 Total Stack Cost ($kWgross) $13216 $4176 $3269 $2927 $2310
Figure 7 Detailed stack cost for the 2010 technology system
Annual Production Rate 1000 30000 80000 130000 500000 System Net Electric Power (Output) 80 80 80 80 80
System Gross Electric Power (Output) 8791 8791 8791 8791 8791 Air Loop $169529 $99072 $83017 $80246 $77035 Humidifier and Water Recovery Loop $165602 $48107 $30035 $24286 $15326 High‐Temperature Coolant Loop $56428 $47815 $40986 $38720 $35691 Low‐Temperature Coolant Loop $10375 $9066 $8101 $7636 $7074 Fuel Loop $25194 $19865 $17049 $16340 $15296 System Controllers $17107 $13685 $10264 $9580 $8211 Sensors $170665 $89300 $65996 $54345 $22549 Miscellaneous $33171 $19412 $17144 $16480 $15669 Total BOP Cost $648071 $346322 $272593 $247633 $196852
Total BOP Cost ($kWnet) $8101 $4329 $3407 $3095 $2461 Total BOP Cost ($kWgross) $7372 $3940 $3101 $2817 $2239
2010
Figure 8 Detailed balance of plant cost for the 2010 technology system
Directed Technologies Inc 12
2010
Annual ProductionRate 1000 30000 80000 130000 500000 System NetElectric Power (Output) 80 80 80 80 80
System Gross Electric Power (Output) 8791 8791 8791 8791 8791 Fuel Cell Stacks $1161787 $367108 $287361 $257336 $203092 Balanceof Plant $648071 $346322 $272593 $247633 $196852 System Assembly ampTesting $15717 $11284 $11091 $11105 $11067 Total SystemCost ($) $1825575 $724714 $571044 $516075 $411011
Total SystemCost ($kWnet) $22820 $9059 $7138 $6451 $5138 Total SystemCost ($kWgross) $20767 $8244 $6496 $5871 $4675
Figure 9 Detailed system cost for the 2010 technology system
332 Cost Summary of the 2015 Technology System Results of the cost analysis of the 2015 technology system at each of the five annual production rates are
shown below Figure 10 details the cost of the stacks Figure 11 details the remaining balance of plant components and Figure 12 details the cost summation for the system
2015Annual ProductionRate 1000 30000 80000 130000 500000
System NetElectric Power (Output) 80 80 80 80 80 System Gross Electric Power (Output) 8727 8727 8727 8727 8727
Bipolar Plates (Stamped) $163429 $38630 $39211 $38517 $38072 MEAs
Membranes $465735 $82711 $50781 $39404 $20421$57371 $57251 $56963 Catalyst InkampApplication (NSTF) $113471 $57848
GDLs $185385 $91689 $56527 $44078 $19686
Mamp EHot Pressing $7129 $683 $654 $594 $595 Mamp ECuttingampSlitting $5655 $390 $276 $250 $219
MEAFrameGaskets $40376 $26306 $25685 $25361 $24804 Coolant Gaskets (LaserWelding) $18480 $2626 $2478 $2444 $2390 End Gaskets (ScreenPrinting) $14948 $508 $197 $125 $053 End Plates $7796 $2702 $2358 $2151 $1646 CurrentCollectors $1508 $624 $516 $477 $436 Compression Bands $1000 $800 $600 $550 $500 Stack Housing $6103 $713 $603 $546 $475 Stack Assembly $7612 $4069 $3495 $3362 $3206 Stack Conditioning $16606 $3511 $2772 $2498 $1684 Total Stack Cost $1055233 $313809 $243524 $217609 $171148 Total Stack Cost ($kWnet) $13190 $3923 $3044 $2720 $2139 Total Stack Cost ($kWgross) $12091 $3596 $2790 $2493 $1961
Figure 10 Detailed stack cost for the 2015 technology system
Directed Technologies Inc
13
Annual Production Rate 1000 30000 80000 130000 500000 System Net Electric Power (Output) 80 80 80 80 80
System Gross Electric Power (Output) 8727 8727 8727 8727 8727 Air Loop $131859 $78605 $65131 $62859 $60472 Humidifier and Water Recovery Loop $000 $000 $000 $000 $000 High‐Temperature Coolant Loop $58252 $49384 $42356 $40006 $36865 Low‐Temperature Coolant Loop $000 $000 $000 $000 $000 Fuel Loop $23374 $18046 $15229 $14520 $13476 System Controllers $17107 $13685 $10264 $9580 $8211 Sensors $2800 $2800 $2800 $2800 $2800 Miscellaneous $30042 $16775 $14731 $14125 $13452 Total BOP Cost $263434 $179296 $150511 $143890 $135276
Total BOP Cost ($kWnet) $3293 $2241 $1881 $1799 $1691 Total BOP Cost ($kWgross) $3018 $2054 $1725 $1649 $1550
2015
Figure 11 Detailed balance of plant cost for the 2015 technology system
2015 Annual Production Rate 1000 30000 80000 130000 500000
System Net Electric Power (Output) 80 80 80 80 80 System Gross Electric Power (Output) 8727 8727 8727 8727 8727
Fuel Cell Stacks $1055233 $313809 $243524 $217609 $171148 Balance of Plant $263434 $179296 $150511 $143890 $135276 System Assembly amp Testing $13055 $9372 $9212 $9224 $9192 Total System Cost ($) $1331722 $502477 $403247 $370723 $315616
Total System Cost ($kWnet) $16647 $6281 $5041 $4634 $3945 Total System Cost ($kWgross) $15259 $5757 $4620 $4248 $3616
Figure 12 Detailed system cost for the 2015 technology system
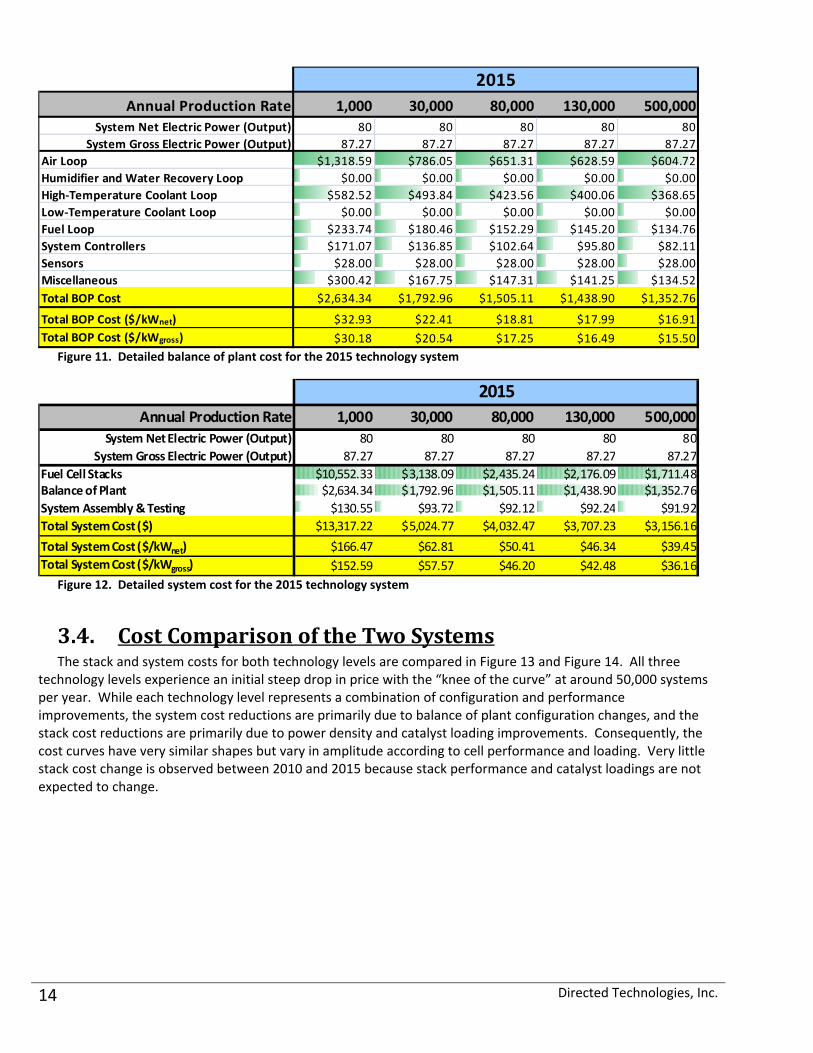
34 Cost Comparison of the Two Systems The stack and system costs for both technology levels are compared in Figure 13 and Figure 14 All three
technology levels experience an initial steep drop in price with the ldquoknee of the curverdquo at around 50000 systems per year While each technology level represents a combination of configuration and performance improvements the system cost reductions are primarily due to balance of plant configuration changes and the stack cost reductions are primarily due to power density and catalyst loading improvements Consequently the cost curves have very similar shapes but vary in amplitude according to cell performance and loading Very little stack cost change is observed between 2010 and 2015 because stack performance and catalyst loadings are not expected to change
Directed Technologies Inc 14
Figure 13 Gross stack cost vs annual production rate
Figure 14 Net system cost vs annual production rate
Directed Technologies Inc 15
4 Detailed Assumptions
41 System Performance and Operation The fuel cell stacks contained within each of the three technology level systems are identical in most design
and operational parameters differing only in active area per cell and stack gross power However the stack gross power is nearly constant 8791 kW and 8727 kW for 2010 and 2015 respectively The slight differences are primarily the result of differences in the air compression load which in turn results from different air compression approaches and levels of pressurization Figure 15 details the efficiency pressure and mass flow assumptions that were used to calculate expected air compressor motor power Note that the fuel cell system needs to supply 80 kWnet under all conditions and thus air compression for peak system power must be evaluated at the most adverse temperature (40degC ambient) Figure 16 summarizes total system parasitic loads
2010 2015
Gross Power kW 8791 8727 Air Mass Flow kgh 411 327
Peak Stack Operating Pressure atm 169 150 Compression Ratio atm 178 150
Compression Efficiency 75 80 Ambient Temperature degC 40 40
Compressor Shaft Power Req kW 861 440
Mass Flow kgh 417 Compression Ratio atm 148
Compression Efficiency 80 Starting Temperature degC 80
Expander Shaft Power Out kW 377
MotorController Efficiency 85 85 CEM Input Power kW 569 517
No expander in 2015 System
Compressor‐Expander Unit
Compressor
Expander
Figure 15 Basis of air compressor and expander power
(All values in kW) 2010 2015 Fuel Cell Gross Electric Power (Output) System Net Electrical Power (Output)
8791 80
8727 80
Air Compressor Motor Coolant Pump Coolant Radiator Fan Exhaust Radiator Fan Other (Controller Instruments etc)
569 11 090 000 01
517 11 090 000 01
Total Parasitic Loads 791 727 Figure 16 Power production amp loads at max power under peak ambient temp operating conditions
Stack design parameters and operating conditions are summarized in Figure 17 and Figure 18 All systems operate with low single‐pass hydrogen utilization but high total utilization due to a hydrogen recirculation loop
Directed Technologies Inc 16
2010 2015 Number of Stacks per System 1
Number of Active Cells per Stack 369
Number of Cooling Cells per Stack 371
Cell Voltage at Max Power 0676
Membrane Power Density at Max Power (mWcm2) 833 1000
This is perhaps misleading because every plate is half active half cooling (except for the ones that bookend the stack which have coolant on one face and nothing on the other)
Figure 17 Stack design parameters
2010 2015 Peak Operating Pressure (atm) 17 15 Cell Temperature (degC) 90 99 Oxygen Stoichiometry Anode Gas Stream
25 20
Hydrogen Purity 99999 (molar basis) Inlet Temperature (degC) Ambient + ~10degC Relative Humidity 0
790 878 Max (single pass) H2 flowrate (kghr) Cathode Gas Stream Oxygen Purity 21 (molar basis) Inlet Temperature (degC) 75degC Relative Humidity 67 3 Max (single pass) Air flowrate (kghr) 49870 44337 Figure 18 Stack operation parameters
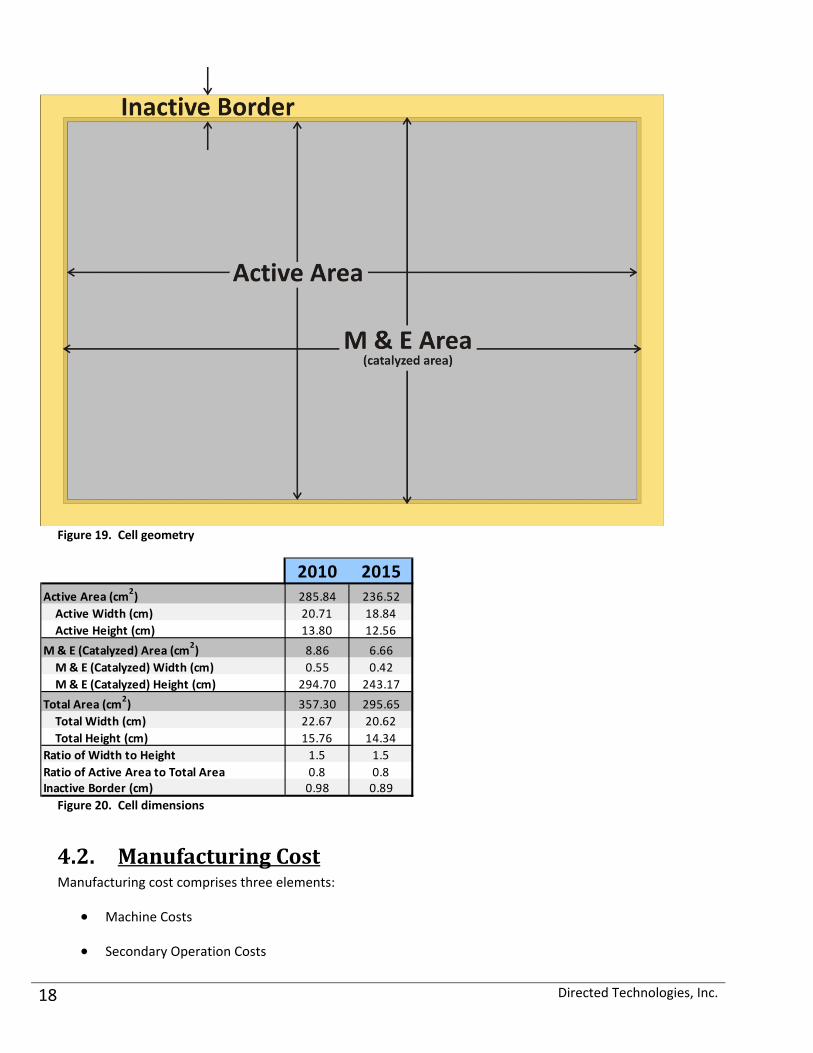
The power density (listed in Figure 17) drives the active area used in the stack geometry so it directly affects the material quantities thereby having a major effect on the system cost This geometry (Figure 19) describes everything between the end plates The table in Figure 20 lists the numerical values of these dimensions
Directed Technologies Inc 17
Figure 19 Cell geometry
2010 2015 Active Area (cm2
) 28584 23652 Active Width (cm) Active Height (cm)
2071 1380
1884 1256
M amp E (Catalyzed) Area (cm2) 886 666
M amp E (Catalyzed) Width (cm) M amp E (Catalyzed) Height (cm)
055 29470
042 24317
Total Area (cm2) 35730 29565
Total Width (cm) Total Height (cm)
2267 1576
2062 1434
Ratio of Width to Height Ratio of Active Area to Total Area Inactive Border (cm)
15 08 098
15 08 089
Figure 20 Cell dimensions
42 Manufacturing Cost Manufacturing cost comprises three elements
Machine Costs
Secondary Operation Costs
Directed Technologies Inc 18
Tooling Costs
It is defined as the total cost of performing a manufacturing process on a material or component Machine cost is the total cost of operating a manufacturing machine (eg stamping press injection‐molding machine lathe etc) and includes amortization of the machine capital cost machine maintenance labor and utilities to operate the machine Secondary Operation costs are minor process costs incurred in association with a major machine operation (eg anodizing after metal stamping) Expendable tooling (dies molds etc) costs are historically calculated separately from machine costs since manufactures often supply tooling to outside vendors9 but pay them only for use of the processing machinery
Machine cost is determined by multiplying machine rate (dollars per minute of machine time) times minutes of machine use Machine rates typically range from $100 to $300 per minute depending on the complexity of the machine maintenance costs and intensity of utilities Typical DFMA methodology uses historical or actual data to determine machine rates for a given class and size of machine For example a 300‐ton injection‐molding machine might have an all‐inclusive machine rate of $24min and a 1200‐ton molding machine might have a rate of $33min However these historical machine rates assume high machine utilization typically 14 hours per day 240 workdays per year Consequently such data is of limited value to this study as it fails to address the cost implications of low annual production rates
To estimate machine rates at less than full machine utilizations the machine rate is broken down into five components
Capital amortization
Maintenancespare‐part costs
Miscellaneous Expenses
Utility costs
Machine labor
An overall machine rate is obtained by adding these five component costs over a yearrsquos operation and then dividing by the total minutes of actual machine run time
Capital Amortization The annual payment necessary to cover the initial capital cost of the machine is calculated by multiplying a fixed rate charge (FRC) times the capital cost The fixed rate charge is merely the annual fraction of uninstalled capital cost that must be paid back adjusted for the interest rate (typically 15 to achieve a 10 after‐tax return) machine lifetime (typically 7 to 15 years) corporate income tax rate (typically 40) with further adjustment for equipment installation costs (typically 40 of machine capital cost)
MaintenanceSpare Parts This is the fraction of uninstalled capital costs paid annually for maintenance and spare parts (typically 5ndash20)
Miscellaneous Expenses This is the fraction of uninstalled capital costs paid annually for all other expenses (typically 7)
Utility Costs These are the costs associated with machine electricity natural gas etc typically computed by multiplying the kW of machine power times the electricity cost (typically $008kWh)
9 Historically automakers purchase expendable tooling separately and then supply the tooling to subcontractors It this way should a labor dispute develop the automaker is (theoretically) able to retrieve the tooling and have the parts produced elsewhere
Directed Technologies Inc 19
Machine Labor Cost of machine operator labor Following automotive practices US labor rates are generally $050 to $100 per minute depending on the level of skill required All cases in this analysis use the median of those two values a rate of $075min ($45hr) Prior to the 2008 Update report the analysis used the rate of $1min For some processes non‐integer numbers of laborers were used per line (for instance 025 is used for the injection‐molding process) because workers do not need to devote 100 of their time to it and can perform other tasks over the course of their workday Note that manufacturing labor is only paid for time that the operator works Thus if a machine is only run for an average 3 hours per day only 3 hours per day of labor costs are incurred
Machine Utilization Machine utilization is determined by dividing the total runtime needed per year (including setup) by the number of simultaneous production lines needed For example if there is 15 lines worth of work and there are two lines each machine is assumed to run 75 of the time Full utilization is typically defined as 14 useful hours per day 240 workdays per year
Machine Setup Time The inclusion of machine setup time in determining the labor cost is a factor that contributes more significantly at lower production rates However due to the high number of repeat parts (such as bipolar plates or MEA gaskets) machine utilization is generally high even at low system annual production rates
Tooling Costs Tooling costs vary based on the rate of wear of the parts according to the number of machine cycles required and the properties of the materials involved Injection molding with abrasive carbon powder fillers will wear down tooling faster than if it were neat silicone From the total number of parts required per year an annual cycle count is determined for the machine and the number of tooling sets needed in the machinersquos lifetime can be calculated This is divided by the machine lifetime to determine the annual tooling cost per line It is calculated this way to account for usable tooling being leftover at the start of the following year
421 Machine Rate Validation To demonstrate the validity of the approach for the machine rate calculation described above Figure 21 plots
the calculated injection‐molding machine rate against two sets of injection‐molding machine rate data The first set of data comes from Boothroyd Dewhurst Inc (BDI) and is the estimated machine rate for 15 specific injection‐molding machines of various sizes The second set of data comes from Plastics Technology magazine and represents the average machine rate from a 2004 survey of injection‐molders (79 respondents) Excellent agreement is achieved between the DTI machine rate calculations and the BDI data10 The data from Plastics Technology (PT) magazine differs substantially from both the DTI estimates and the BDI data However the PT data has very large error bars indicating substantially variation in the vendor reported machine rate probably from inconsistent definition of what is included in the machine rate It is noted that the DTI estimates are conservative for large machines overestimating machine rate as compared to the PT survey data but underestimating rates at the lower machine sizes The PT survey data is judged significant at low machine sizes because it represents a minimum machine rate industry receives Consequently to achieve conservative estimates throughout a $25hr minimum machine rate was imposed for all machines (not just injection‐molding machines) This is consistent with previous guidance DTI has received from Ford Motor Company wherein the rule of thumb was never to let machine rate drop below $1min (including labor) for any process
Figure 22 plots the effective machine rate as a function of machine utilization As shown machine rates climb to very high levels when only used a fraction of the time11 This is a direct consequence of the annual capital cost repayment needing to be collected even if the machine is used infrequently
10 The BDI data contains one anomalously high data point at approximately 800 tons of clamping force This point appears to be real and corresponds to the largest machine in a manufacturerrsquos lineup
11 Full utilization is defined as 14 hours per day 240 days per year
Directed Technologies Inc 20
For each component manufacturing or assembly task the batch volume machine setup time and time to complete the task were computed using the above described DFMA techniques After applying the tooling and secondary operations costs and the labor and machine rates the total cost for the component is calculated A second detailed example of machine rate calculation occurs in section 4412 and describes the metal bipolar plate stamping costing process
Ma
ch
ine
Ra
te (w
ith
ou
t la
bo
r) $
hr
1000
BDI Machine Rate Data wo labor
PT Survey Machine Rate wo
100 labor DTI Machine Rate wo labor
DTI Machine Rate with Minimum amp wo labor
10
Figure 21 Injection‐molding machine rate vs machine clamping force
10 100 1000 10000
Machine Clamping Force US tons
Directed Technologies Inc 21
Ma
ch
ine
Ra
te $
hr
$2000
$1800
$1600
$1400
$1200
$1000
$800
$600
$400
$200
$0
0 20 40 60 80 100
Machine Utilization (of 14 hr day) Figure 22 Machine rate vs machine utilization
422 Material and Part Yields For the 2010 analysis material and part yield percentages (or inversely scrap percentages12) were added to all
componentsprocesses The material yield accounts for the scrap material lost in manufacturing for each part and the part yield estimates the number of whole parts lost to defects in the manufacturing process Material yields are typically much lower than part yields which approach unity for well‐refined high‐volume production lines
The yield percentages applied in this analysis are DTI estimates based on experience with industrial yields in previous work Figure 23 shows the yields for each process As the number of vehicles per year increases part yields increase due to the improved manufacturing success associated with numerous repeat parts
12 The yield represents what is left after the scrap has been subtracted so a yield rate of 95 corresponds to a scrap rate of 5
Directed Technologies Inc 22
Figure 23 Material and part yield percentages applied
Prior to 2010 the analyses for many of the most important components (eg the catalyst ink) accounted for one or both type of yield though there were some that did not Fortunately for the validity of the previous yearsrsquo analyses the change resulted in a mere $008kWnet cost increase across the entire system Despite the small cost impact this improvement succeeded in improving the realism and fidelity of the model
43 Markup Rates Markup rates are percentage increases to the material manufacturer and assembly cost to reflect the costs
associated with profit general and administrative (GampA) expenses research and development (RampD) expenses and scrap The markup percentage varies with manufacturing rate and with what is actually being marked up However to provide cost estimates consistent with other cost studies conducted for the Department of Energy
Directed Technologies Inc 23
no markup rates have been applied for this cost study Thus the costs presented are ldquobarerdquo costs of manufacture and assembly The factors that affect the markup rate are discussed below to give the reader some idea of the approximate magnitude of the markup rates under various circumstances In general the higher the manufacturingassembly rate the lower the markup to reflect the increased efficiencies of business operations and ability to amortize costs over a large base of products
Whether a company is vertically integrated or horizontally integrated affects overall markup rate In a vertically integrated company every step in the production process (from the acquisition of base materials to the final assembly) is completed ldquoin‐houserdquo by the company In a horizontally integrated company components andor subassemblies are fabricated by subcontractors and typically only the final assembly is conducted by the company Completely vertical or horizontal integration is quite rare but most companies are predominately one or the other
Whenever a part or process is subcontracted both the lower‐tier subcontractor as well as the top‐level company applies a markup This is reasonable since both companies must cover their respective costs of doing business (GampA scrap RampD and profit) However the numerical markup for each company can and should be different as they are adding different levels of value and have (potentially) different cost bases There is a distinction made between activities that add value (such as actual manufacturing or assembly steps) and mere product ldquopass‐throughrdquo namely the organization earns profit on value‐added activities and no profit on mere pass‐through (An example is a firm hired to do assembly work they justifiably earn profit on the value‐adding step of assembly but not on the material cost of the components they are assembling However there are real costs (GampA RampD scrap) associated with product pass‐through and the manufacturerassembler must be compensated for these costs)
Figure 24 displays some representative markup rates for various situations While the figure attempts to explain how and where markups are applied there are many exceptions to the general rule Different markup rates are used for different components because the type and quantity of work lend themselves to lower overhead costs MEA manufacturing markups are set at much higher rates to reflect the higher risks both technical and business of an evolving technology Markups are often accumulative as the product moves from manufacturer to sub‐system assembler to final assembler However in the case of the MEA the car company may be assumed to supply the raw materials so that the MEA manufacturerrsquos markup is only applied to the MEA manufacturersquos added value13 and not to the material cost
Annual Production Rate 1000 30000 80000 130000 500000 Fuel Cell Components Manufacturerrsquos Markup 27 ‐ 355 25 ‐ 355 25 ‐ 355 25 ‐ 355 25 Integratorrsquos Pass Through 30 21 20 20 19
MEA Manufacturers Markup 70 70 60 50 35 Auto Company Final Markup 37 265 235 20 15
2010 ‐ 2015
Figure 24 Representative markup rates (but not applied to cost estimates)
44 Fuel Cell Stack Materials Manufacturing and Assembly Cost estimates for fuel cell stacks were produced using detailed DFMA‐style techniques Each subcomponent
of the stack was independently considered with materials and manufacturing costs estimated for each Costs were estimated for the assembly of the gasketed membrane electrode assemblies (MEAs) and the stack Figure
13 This method is directed analogous to catalytic converter manufacture in the automotive industry the auto manufacturer supplies the expensive catalyst to the catalytic converter manufacturer specifically to avoid the extra markup rate that otherwise would occur
Directed Technologies Inc 24
25 displays an abridged view of the stack components and Figure 26 shows a cross‐sectional view of an assembled stack
Figure 25 Exploded stack view (abridged to 2 cells for clarity)
Directed Technologies Inc 25
Figure 26 Stack cross‐section
441 Bipolar Plates Each stack in the system consists of 369 active cells each of which contains two bipolar plates A 11 ratio of
active cells to cooling cells was assumed in order to ensure stack temperature uniformity Consequently one side of bipolar plate is a cooling cell flow field and the other side is an active cell flow field In previous estimates the cathode and anode flow field sides of the bipolar plates were envisioned as having identical flow patterns and being symmetrical Consequently only one bipolar plate design was needed and the cells could be flipped 180deg to alternate between cathode flow fields and anode flow fields However based on feedback from Ballard Power Systems unique designs were assumed for the anode and cathode plates An extra bipolar plate sits at each end of the stack and is not part of the repeating cell unit It is only half‐used as it does only cooling End gaskets are used to block off the flow into the gas channel side of those plates The total number of plates in a stack is therefore 740 369 active cells 2 plates per cell + 2 coolant‐only plates 1 stack14 Because each system contains 740 bipolar plates there are hundreds of thousands of plates needed even at the lowest production rate This means that bipolar plate mass‐manufacturing techniques remain appropriate across all production rates
14 In previous years there were multiple (smaller) stacks per system
Directed Technologies Inc 26
Two different concepts were examined for the bipolar plate injection‐molded carbon powderpolymer and stamped stainless steel Recent industry feedback has suggested that metallic plates may provide an advantage in conductivity over carbon plates but for now equivalent polarization performance is assumed between the two designs The stamped metal plates were selected because of consistent industry feedback suggesting that this is the most common approach
4411 Injection‐Molded Bipolar Plates Injection‐molded bipolar plate costs are based on a conceptual injection‐molded manufacturing process using
composite materials Such a composite is composed of a thermoplastic polymer and one or more electrically conductive filler materials In this analysis the composite is carbon powder in polypropylene at a volume ratio of 4060 carbonpolymer To date similar materials have been successfully molded to form bipolar plates with sufficient conductivity for fuel cell use15 The primary advantage of injection molding over compression molding is a shorter cycle time resulting in lower labor and machine costs However technical challenges likely exist in order to achieve adequate electrical conductivity using the assumed injection‐molding process Injection molding details are shown in Figure 27 and Figure 28
Figure 27 Injection‐molding machine cost vs clamp force
15 Multiple companies have successfully compression andor injection‐molded of thermoset andor thermoplastic bipolar plates Los Alamos National Laboratory International Fuel Cell (IFC) Quantum injection‐molding of PEMTEX thermoset material (formerly) Energy Partners Zentrum fur Brennstoffzellen Technik (ZBT) GmbH and Micro Molding Technology LLC
Directed Technologies Inc 27
Annual Production Rate 1000 30000 80000 130000 500000 Capital Cost ($Line)
Costs per Tooling Set ($) Tooling Lifetime (cycles)
Simultaneous Lines Laborers per Line
Line Utilization Cycle Time (s)
CavitiesPlaten Effective Total Machine Rate ($hr)
Carbon Filler Cost ($kg)
$174621 $42704 300000
1 025 934 243 4
$91891 $667
$463497 $112697 300000
4 025 $088 307 16
$75124 $667
$463497 $112697 300000
10 025 $094 307 16
$74691 $667
$463497 $112697 300000
16 025 $095 307 16
$74589 $667
$463497 $112697 300000
59 025 $099 307 16
$74322 $667
2010
Capital Cost ($Line) Costs per Tooling Set ($) Tooling Lifetime (cycles)
Simultaneous Lines Laborers per Line
Line Utilization Cycle Time (s)
CavitiesPlaten Effective Total Machine Rate ($hr)
Carbon Filler Cost ($kg)
$158005 $42704 300000
1 025 934 243 4
$89549 $667
$397035 $112697 300000
3 025
9303 243 16
$73796 $667
$397035 $112697 300000
8 025
9294 243 16
$73802 $667
$397035 $112697 300000
13 025
9294 243 16
$73802 $667
$397035 $112697 300000
47 025
9887 243 16
$73460 $667
2015
Figure 28 Bipolar plate injection‐molding process parameters
As shown in Figure 30 costs are seen to vary between roughly $3kWnet and $5kWnet Cost reduction for each of the advanced technology cases is due to higher power density leading to smaller plate area Injection‐molding machine cost is the main contributor accounting for ~75 of bipolar plate cost Materials and tooling contribute ~15 and ~10 respectively Since polypropylene is very inexpensive the electrically conductive carbon powder filler is the main contributor to material cost The conductive filler is assumed to be high‐purity carbon black Fuel cell manufacturers using polymer plates keep the exact proportions and material specifications as trade secrets but may use a mix of multiple fillers some possible very expensive For this analysis however a high fill fraction (40 by volume) and medium price ($635kg based on a quote for Vulcan XC‐72) were adopted as cost‐representative bases for our non‐proprietary cost estimates Since the carbon black market is quite mature and substantial amounts of powder are needed even for low system production rates a price decrease with high production rates is unlikely Consequently the carbon filler material cost of $635kg is fixed for all production rates
Annual Production Rate 1000 30000 80000 130000 500000 Equipment Lifetime
Interest Rate Corporate Income Tax Rate
Capital Recovery Factor Equipment Installation Factor
MaintenanceSpare Parts ( of CC) Miscellaneous Expenses ( of CC)
Power Consumption (kW)
15 10 40 0159 14 10 12 830
15 10 40 0163 14 10 12 1896
15 10 40 0163 14 10 12 1896
15 10 40 0163 14 10 12 1896
15 10 40 0163 14 10 12 1896
5
201
2010 ‐
Figure 29 Machine rate parameters for bipolar plate injection‐molding process
Directed Technologies Inc 28
Annual Production Rate 1000 30000 80000 130000 500000 Materials ($stack) $7818 $7818 $7818 $7818 $7818
Manufacturing ($stack) $28837 $29642 $29444 $29404 $29299 Tooling ($stack) $058 $020 $020 $020 $020
Total Cost ($stack) $36713 $37480 $37282 $37242 $37136 Total Cost ($kWnrt) $459 $468 $466 $466 $464 Materials ($stack) $6545 $6545 $6545 $6545 $6545
Manufacturing ($stack) $28103 $23066 $23047 $23047 $22940 Tooling ($stack) $058 $020 $020 $020 $020
Total Cost ($stack) $34706 $29632 $29613 $29613 $29505 Total Cost ($kWnrt) $434 $370 $370 $370 $369
2015
2010
Figure 30 Cost breakdown for injection‐molded bipolar plates
4412 Stamped Bipolar Plates Sheet metal stamping is an alternate method for the production of bipolar plates suspected to be employed
by General Motors for their fuel cell stacks16 Since 740 plates are needed per system and multiple features are required on each plate (flow fields manifolds etc) progressive die stamping is the logical choice In progressive die stamping coils of sheet metal are fed into stamping presses having a series of die stations each one sequentially imparting one or more features into the part as the coil advances The parts move through the stationary die stations by indexing and a fully formed part emerges from the last station Figure 31 displays a simplified drawing of progressive die operations
Figure 31 Bipolar plate stamping process diagram
16 The composition and manufacturing method for production of General Motors bipolar plates is a trade secret and is not known to the authors However a review of GM issued patents reveals that they are actively engaged in metallic plate research
Directed Technologies Inc 29
Costs for bipolar plate progressive die stamping were obtained following the standard DTI methodology described above In summary capital cost maintenance cost and power requirements were correlated between manufacturer quotes and survey data supplied within BDI proprietary software These data were then used to estimate true annual operating costs when operated at less than full capacity The cost estimation process and assumptions are described more fully below
Capital Cost and Press Tonnage Clamping force is the primary sizing and pricing parameter of a metal forming press Price quotes and performance data for AIRAM pneumatic presses ranging from 50 tons to 210 tons were curve‐fit to yield approximate purchase cost as a function of press tonnage The cost of supporting equipment required for press operation was then added to the base press cost Some of the supporting equipment has a fixed cost regardless of press size while other equipment scales in cost A sheet metal coil feeder was judged necessary and was costed largely independent of press size To insure part accuracy a sheet metal straightener17
was added although it may prove to be ultimately unnecessary due to the thin material used (762 microns or 3 mils) Typical capital costs are shown in Figure 32
Component Cost Stamping Press $33007
Air Compressor $17461
ATC‐10070 Control $3498
Stand $6044
Vibration Mounts $1320
Reel $6668
Loop Control $2215
Servo Feed $7306 Misc Add‐Ons $1091
Total Capital Cost $78611 times 5 = $393057
Feeding Equipment
Accesories
Figure 32 Capital costs breakdown for a typical bipolar plate stamping production line
In the 2006 report it was estimated that a 65‐ton press18 was necessary to produce the bipolar plates19 However it was noted that there was disagreement in the bipolar plate stamping community regarding the necessary press tonnage to form the plates20 with one practitioner stating that a 1000‐ton press was needed
Subsequent review by Ballard suggested that the previously estimate for total stamping system capital cost was substantially too low either due to press tonnage or supporting equipment differences Consequently estimated capital cost was increased five‐fold to better reflect reality The net effect of this change is relatively minor as it only increases the system cost by about $02kWnet (at high production) This crude multiplier yields a capital cost estimate less satisfying than the itemized listing previously presented
Press Speed The speed of the press (in strokes per minute) varies with press size (tons) a small press is capable of higher sustained operating speeds than a large press Press speed is correlated to press size and is shown in Figure 33
17 Email and telephone communication with Rick Meyer of AIRAM Press Co Covington Ohio 18 Press force figure corroborated by Dan Connors of GenCell Corporation 19 This press tonnage reflects the total press force of all four die stations forming a ~400 cm2 bipolar plate 20 Some flow fields require increased swaging of metal to form non‐uniform thickness plates whereas others require only bending of a
uniform thickness plate
Directed Technologies Inc 30
Str
ok
es
pe
r Min
ute
90
80
70
60
50
40
30
20
10
0
Curve Fit Strokesmin = 57439Force(kN)^-03267
0 500 1000 1500 2000 2500
AIRAM Data
Curve Fit
Stamping Press Force (kN) Figure 33 Press speed vs press force
Maintenance Given that the majority of the wear parts are shared across models the faster operating presses tend to require maintenance more frequently The minimal life of the set of these wear parts was estimated at 10 million cycles21 with a total replacement cost estimated at 20ndash25 of complete press initial capital cost22 depending on machine size Since the above cycle life is the minimum number of cycles but could be substantially more maintenance cost of the press is estimated to be 15 of initial press capital cost every 10 million cycles This deviates from DTIrsquos normal methodology which estimates maintenance costs as a percentage of initial capital per year rather than per cycle Likewise feeder equipment maintenance is estimated to be 5 of initial feeder capital cost every 10 million cycles23
Utilities The principal power consumer in the progressive die process train is the air compressor for the pneumatic press and the coil feeder24 Compressor power is a function of the volumetric airflow requirement of each press size and was estimated to vary between 19 kW at the low end (50‐ton press) and 30 kW at the high end (210‐ton press) Power consumption is curve‐fit to press size
Machine Rate Using the above information on total line capital cost maintenance and utilities machine rates curves can be generated for various size presses at varying utilization Basic input parameters are summarized in Figure 35 and Figure 36
Die Cost Die costing is estimated according to the equations outlined in the Boothroyd and Dewhurst section on sheet metal stamping As expected complex stamping operations require more intricate and therefore more expensive dies The first two and final press steps are simple punching and sheering operations and therefore
21 Email and telephone communication with Rick Meyer of AIRAM Press Co Covington Ohio 22 Email and telephone communication with Rick Meyer of AIRAM Press Co Covington Ohio 23 Although the anticipated longevity of the feeder equipment is much higher than that of the presses it was assumed that feed
equipment maintenance would take place concurrently with the press maintenance 24 The solenoid valves and controller unit each consume less than 50 watts and are therefore negligible for costing purposes
Directed Technologies Inc 31
do not require expensive dies The flowpath‐forming step involves forming a complex serpentine shape which requires a highly complex die that is significantly more expensive than the dies for other steps in the process This step also requires the majority of press force The die cost figures are listed below in Figure 34 (under ldquoToolingrdquo)
Annual Production Rate 1000 30000 80000 130000 500000 Materials ($stack) $21708 $21708 $21708 $21708 $21708
Manufacturing ($stack) $15847 $1889 $1695 $1650 $1610 Tooling ($stack) $9994 $8852 $8869 $8939 $8897
Secondary Operations Coating ($stack) $120880 $10966 $11723 $11005 $10692 Total Cost ($stack) $168428 $43415 $43995 $43303 $42907
Total Cost ($kWnet) $2105 $543 $550 $541 $536 Materials ($stack) $17962 $17962 $17962 $17962 $17962
Manufacturing ($stack) $15718 $1860 $1668 $1623 $1521 Tooling ($stack) $9637 $8535 $8552 $8620 $8590
Secondary Operations Coating ($stack) $120113 $10272 $11028 $10311 $9998 Total Cost ($stack) $163429 $38630 $39211 $38517 $38072
Total Cost ($kWnet) $2043 $483 $490 $481 $476
2010
2015
Figure 34 Cost breakdown for stamped bipolar plates
Die Life Over time the repetitive use of the dies to form the metallic bipolar plates will cause these tools to wear and lose form Consequently the dies require periodic refurbishing or replacement depending on the severity of the wear Based on communication with 3‐Dimensional Services Inc dies for progressive bipolar plate stampings were estimated to last between 400000 and 600000 cycles before refurbishment and may be refurbished 2 to 3 times before replacement Thus a die lifetime of 18 million cycles (3 x 600000) was specified with a die cost of $214149 ($100000 of which is from the two refurbishments at $50000 each)
Annual Production Rate 1000 30000 80000 130000 500000
2010 ‐2015
Equipment Lifetime 15 15 15 15 15
Interest Rate 10 10 10 10 10
Corporate Income Tax Rate 40 40 40 40 40
Capital Recovery Factor 0175 0175 0175 0175 0175
Equipment Installation Factor 14 14 14 14 14
MaintenanceSpare Parts ( of CC) 13 13 13 13 13
Miscellaneous Expenses ( of CC) 2 2 2 2 2 Power Consumption (kW) 166 166 166 166 166
Figure 35 Machine rate parameters for bipolar plate stamping process
Directed Technologies Inc 32
Annual Production Rate 1000 30000 80000 130000 500000
2010
Capital Cost ($Line) $393057 $393057 $393057 $393057 $393057 Costs per Tooling Set ($) $214149 $214149 $214149 $214149 $214149 Tooling Lifetime (cycles) 1800000 1800000 1800000 1800000 1800000
Simultaneous Lines 1 3 7 11 41 Laborers per Line 025 025 025 025 025
Line Utilization 814 8127 9286 9603 9909 Cycle Time (s) 062 062 062 062 062
Effective Total Machine Rate ($hr) $57914 $6917 $6208 $6044 $5895 Stainless Steel Cost ($kg) $1283 $1283 $1283 $1283 $1283
2015
Capital Cost ($Line) $390236 $390236 $390236 $390236 $390236 Costs per Tooling Set ($) $206498 $206498 $206498 $206498 $206498 Tooling Lifetime (cycles) 1800000 1800000 1800000 1800000 1800000
Simultaneous Lines 1 3 7 11 39 Laborers per Line 025 025 025 025 025
Line Utilization 773 7710 8809 9110 9882 Cycle Time (s) 061 061 061 061 061
Effective Total Machine Rate ($hr) $60532 $7181 $6439 $6267 $5874 Stainless Steel Cost ($kg) $1283 $1283 $1283 $1283 $1283
Figure 36 Bipolar plate stamping process parameters
44121 Alloy Selection and Corrosion Concerns One of the challenges presented by using metallic plates is that they are more susceptible to corrosion than
carbon‐based plates For this reason alloy selection is very important There is much uncertainty in the fuel cell community as to which alloy and surface treatments are needed to provide adequate corrosion resistance Although some believe that suitable stainless steel alloys exist that adequately address this problem others insist that protective coatings are necessary If the right coating method were selected it may be possible to use a cheaper andor lighter (but less corrosion‐resistant) material for the plates which could help offset the cost of coating In determining the coating method andor plate material consideration must be given to the different corrosion environments each plate will encounter hydrogen and coolant for the anode plates and oxygen and coolant for the cathode plates
Literature and patent reviews and conversations with researchers indicate that coatingssurface treatments may not be needed and that 316L stainless steel (or another commercial alloy of similar cost) is appropriate However further input from the USCAR Fuel Cell Technical Team suggested that coatings are necessary Because of this uncertainty both options were examined At the direction of the Fuel Cell Tech Team coatings were included in the system cost for all three technology levels and the effects of this inclusion were studied in the sensitivity analysis (page 107) The baseline system configurations specify 762‐micron (3‐mil) stainless steel 316L alloy metallic bipolar plates coated using a proprietary process from TreadStone Technologies Inc
The argument for uncoated plates is supported by the following two primary data sources
Published in 2000 Davies25 and fellow researchers at Loughborough University UK fabricated and tested bipolar plates of three uncoated stainless steel alloys26 (904L 310 and 316L) Contact resistance testing and multi‐thousand hour endurance tests in a functioning cell were conducted They concluded that 904L performs
25 DP Davies PL Adcock M Turpin SJ Rowen ldquoStainless steel as a bipolar plate material for solid polymer fuel cells Journal of Power Sources 86 (2000) 237‐242
26 An additional plate of 316 SS with a proprietary coating was also tested This plate demonstrated superior cell polarization performance but was not tested for thousands of hours as were the other samples
Directed Technologies Inc 33
better than 310 which performs better than 316L with the polarization differences attributable to variation in thickness of the oxide films Analysis showed no surface deleterious effects and no evidence of corrosion They summarized by stating that ldquoby optimizing the chemical composition of the alloy it would be feasible to use uncoated stainless steel bipolar plates to provide low cost fuel cell systems with power densities approaching that observed with graphiterdquo Recent communication with one of the co‐authors27 reveals that their 2000 paper was the last the team published in the series before forming Intelligent Energy (wwwintelligent‐energycom) all current research is proprietary and hence unavailable
Makkus28 et al at the Netherlands Energy Research Foundation have also done comparative corrosion and performance testing of metallic bipolar plates They examined seven alloys29 (including 316 317LMn 321 926 3974 and two proprietary alloys) Testing revealed varying levels of corrosion and an influence of alloy pre‐treatment methods Overall they conclude ldquoThe results indicated alloy B to be most suited for application in an SPFC as it shows the lowest contact resistance and it yields a contaminant level comparable to alloy Ardquo Recent communication with a co‐author30 indicates that alloy B is a commercially available high chromium alloy (containing some Molybdenum) Additionally the recommended ldquoadjusted pre‐treatmentrdquo is a small modification of the standard pickling31 process wherein the acid pickling solution is heated to a temperature above 50degC
In spite of evidence supporting the conclusion that bipolar plate coatings are not necessary when using 316L and similar alloy stainless steels there is still some debate as to whether or not this is true One question behind the skepticism on this issue is how the plates will perform in the long term under non‐steady state conditions CH Wang from TreadStone points out that even if stainless steel alloys are sufficiently corrosion resistant they will typically have unacceptable contact resistance due to the extra chromium content required The bipolar plate ldquoHoly Grailrdquo Wang said is to find an aluminum alloy that would work as it would be cheaper lighter and more corrosion‐resistant than any steel plate32
In the absence of a definitive answer the potential cost of applying protective coatings was examined and at the direction of the Tech Team this cost was included this cost in the estimates
44122 Bipolar Plate Surface Treatments and Coatings There are a variety of methods for providing bipolar plate corrosion resistance that are either under
investigation or currently being employed in the fuel cell industry Most of these methods fall into one of the following categories
Nitriding surface diffusion of nitrogen into steel surface typically via nitrogen or ammonia at ~550degC to form chromium nitride (or aluminum nitride in the case of aluminum plates)
27 Private communication PL Adcock April 2007 28 Robert D Makkus Arno HH Janssen Frank A de Bruijn Ronald KAM Mallant ldquoUse of stainless steel for cost competitive bipolar
plates in the SPFCrdquo Netherlands Energy Research Foundation Journal of Power Sources 86 (2000) 274‐282 29 A coated plated was also partially tested However only initial performance results as opposed to performance after 3000 hours of
operation were reported Consequently the conclusions in the Davies paper focus on the uncoated alloy results since a more comprehensive view of performance was obtained
30 Private communication Robert Makkus Netherlands Energy Research Foundation April 2007 31 Standard pickling treatment is defined as a room temperature bath of a sulfuric acid hydrochloric acid and HF solution 32 Private communication CH Wang TreadStone Technologies Inc November 2008
Directed Technologies Inc 34
Physical vapor depositions (PVD) use of ion‐beams or magnetron sputtering to create a charged molecular vapor cloud of coating material (gold TiN etc) which then settles and adheres to the bipolar plate surface
Electroplating use of an electric current to deposit a metal layer onto the surface of the bipolar plate immersed in an aqueous metallic ion bath
Pickling treatment of the bipolar plate surface with an acid mixture (typically hydrochloric and sulfuric) in order to remove impurities (rust scale etc)
There are a large number of non‐corrosive highly conductive materials that are well‐suited as coatings for stainless steel bipolar plates33 Gold is often considered one of the most effective however its cost is usually prohibitive Alternately Fonk34 from GM states ldquomost preferably the [coating] particles will comprise carbon or graphite (ie hexagonally crystallized carbon)rdquo
No quantitative judgment was made as to the fuel cell performance of one surface treatment method over another From a general perspective however the most important aspects are application speed and the ability to deliver a thin coating of reliable thickness with sufficient surface smoothness to cover the plate surface uniformly Methods such as ion‐beam assisted physical vapor deposition35 are able to achieve excellent uniformity and low layer thickness (10‐nanometer layers of gold with near‐perfect flatness) but are capital‐intensive and suffer from slow application speed if relatively thick layers are proven necessary Consequently a brief cost analysis was conducted for three surface treatment options (electroplating magnetron sputtering (titanium nitriding) and thermally grown chromium nitriding) In addition a detailed cost analysis was conducted for TreadStonersquos proprietary process which was included in the stack costs for the baseline system configurations
Based on conversations with industry an electroplating cost was estimated as approximately $150kWnet (or 25 cents per 100 cm2 of surface area) plus material costs Electroplating provides a consistently reliable coating to a minimum thickness of 127 microns (05 mils) Assuming this minimum coating thickness only 11 cm3 of coating material is needed per plate Consequently material cost can rise to $30ndash54kg before it adds $1kWnet
to stack cost If carbon power is used as the coating material the total material‐and‐application cost is estimated at under $175kWnet
Additionally a preliminary analysis was conducted for aluminum plates with a titanium‐nitride surface treatment via magnetron sputtering A GM patent from 1997 states that a preferred embodiment is an aluminum bipolar plate (6061‐T6) coated with a 10‐micron layer of stainless steel (Al‐6XN) and topped with a 03‐micron layer of titanium nitride Consultation with magnetron sputtering experts suggests that these are surprisingly thick layers to deposit and could take up to 60 minutes of sputtering time36 Since the patent is over ten years old a shorter deposition time was postulated which is consistent with using thinner layers (or a single layer) Preliminary analysis37 indicates a total bipolar plate cost of $5ndash11kWnet for production rates of 30000 to 500000
33 ldquoGold platinum graphite carbon nickel conductive metal borides nitrides and carbides (eg titanium nitride titanium carbide and titanium diboride) titanium alloyed with chromium andor nickel palladium niobium rhodium rare earth metals and other noble metalsrdquo (Fonk et al US Patent 6372376 p4)
34 US Patent 6372376 titled ldquoCorrosion resistant PEM fuel cellrdquo 35 US Patent 6866958 titled ldquoUltra‐low loadings of AU for stainless steel bipolar platesrdquo 36 60 minutes is only a rough estimate based on a 150 nmmin sputtering rate A detailed analysis would have to be conducted to
determine the exact duration and system configuration 37 Based on $6kg aluminum material cost standard plate forming costs as defined elsewhere in this report $200kg titanium material
cost a 10 micron TiN layer $12M magnetron sputtering system 600 kW electrical consumption 60 plates processed per batch and a 2‐10 minute sputtering time
Directed Technologies Inc 35
systems per year (Analysis at the 1000 systems per year rate was not conducted since alternate equipment would be required and therefore fell outside the scope of the preliminary analysis) Cost variation with manufacturing rate is low with the two‐to‐one cost variation resulting from uncertainty in deposition time (varied from two to ten minutes) Overall titanium‐nitrided aluminum stamped plates represents a potential $2kWnet to $8kWnet cost adder compared to uncoated stainless steel stamped plates
The thermally grown chromium nitriding process examined for this study (see Figure 37) was based on the work of Mike Brady at Oak Ridge National Laboratory Unlike the titanium nitriding process mentioned previously this is not a deposited coating but a surface conversion The plates are placed into a nitrogen‐rich environment and heated to 800ndash1000degC for approximately 2 hours The high temperature favors the reaction of all exposed metal surfaces and forms a chromium nitride layer with the chromium in the stainless steel This process does not leave any pinhole defects and is amenable to complex geometries (such as flow field grooves) while allowing the simultaneous ldquocoatingrdquo of both sides of the plates
Figure 37 Magnified chromium nitride surface conversion
Conventional nitriding is currently conducted in large automated facilities and is relatively cheap The anticipated process for bipolar plates is similar but simpler and faster The plates would be batch‐processed and could feasibly be handled in a ldquolights outrdquo facility meaning there would be zero human operators (not counting maintenance) Because of the long processing time (1ndash3 hrs) it is important to fit the maximum number of plates in each batch As such the spacing between the plates becomes a critical factor in the processing cost Figure 38 shows a parametric analysis of the relationship between plate spacing and nitriding cost for batch times of 1 and 3 hours
Directed Technologies Inc 36
Figure 38 Impact of plate spacing on nitriding cost
Based on discussions with Brady it was estimated that the coating would likely cost about $075kW However if an optimistic combination of a short batch time and high packing density can be achieved it may be possible to get the cost down around $025kW
Alternatively it may be possible to nitride the plates in a matter of seconds by using a pulsed plasma arc lamp In this method fewer plates would simultaneously be processed but the dramatically higher throughput would still yield a hefty cost savings more than offsetting the extremely high capital costs (~$1ndash2 million per line) DTI estimates suggest that this method could lower the costs down to between $016 and $044kW
The fourth coating method examined for this analysis (and the one integrated into the baseline model) is TreadStones proprietary LiteCell process A DFMA analysis was conducted based on information from TreadStonersquos patent US 7309540 as well as that transferred under a non‐disclosure agreement with close collaboration with CH Wang and Gerry DeCuollo of TreadStone Technologies Inc
According to the patent the coating consists of ldquoone or more resistant layers comprising conductive vias through the resistant layer(s)rdquo38 (see Figure 39) The resistant layer provides excellent corrosion protection while the vias provide sufficient electrical conduction to improve overall conductivity through the plate
Figure 39 Conductive vias shown in US patent 7309540
The resistant layer is applied via a physical vapor deposition process Details of the manufacturing process are considered proprietary so only limited explanation is provided here
The postulated coating application follows a three‐step process The major step is the deposition of a non‐continuous layer of gold dots (~1 surface coverage) via a patented low‐cost process designed to impart low contact resistance The plate coating is applied after bipolar plate stamping The gold layer is only applied to one side of the plates because only one side requires low contact resistance
38 US Patent 7309540 titled ldquoElectrical Power Source Designs and Componentsrdquo
Directed Technologies Inc 37
The cost breakdown for the TreadStone process is shown in Figure 40 The coating cost is observed to be primarily a function of annual production rate with cost spiking at low quantities of only 1000 systems per year This is a reflection of low utilization of the coating system and the application cost could perhaps be reduced with an alternate application technique
Annual Production Rate 1000 30000 80000 130000 500000 Materials ($stack) $3960 $3960 $3960 $3960 $3960
Manufacturing ($stack) $116920 $7006 $7763 $7045 $6732 Total Cost ($stack) $120880 $10966 $11723 $11005 $10692 Total Cost ($kWnet) $1511 $137 $147 $138 $134 Materials ($stack) $3276 $3276 $3276 $3276 $3276
Manufacturing ($stack) $116836 $6996 $7752 $7035 $6721 Total Cost ($stack) $120113 $10272 $11028 $10311 $9998 Total Cost ($kWnet) $1501 $128 $138 $129 $125
2010
2015
Figure 40 Cost breakdown for TreadStone LiteCell bipolar plate coating process
442 Membrane
4421 Membrane Material amp Structure (Nafionreg on ePTFE) The PEM membrane is widely acknowledged as one of the more costly stack components and one needing to
be reduced in cost to achieve a cost competitive fuel cell system Nafionreg a perfluorinated sulfonic acid (PFSA) from DuPont originally developed as chloro‐alkali membrane is the main membrane chemistry used in PEM fuel cells However multiple other PFSA variants are in use including membranes from Dow Asahi Gore and GEFC Multiple other membrane chemistries are under development39 including partially fluorinated (PVDF) and non‐fluorinated (BAM3G S‐PPBP MBS‐PBI MBS‐PPTA S‐PEK) Additionally membranes may be homogenous composites40 or placed on a substrate for mechanical reinforcement
For purposes of this study the approach selected was Nafionreg on a porous expanded polytetrafluoroethylene41
(ePTFE) substrate This approach is modeled on the WL Gore approach as understood by a review of Gore PEMSelect product literature patents and discussions with Gore engineers While alternate approaches (such as homogenous cast or extruded membranes) have the potential for lower cost by obviating the expense of the ePTFE substrate the Gore‐like approach was selected since it should theoretically supply substantially better mechanical properties and is thereby inherently better suited for roll‐to‐roll processing Mechanical strength is an important characteristic in roll‐to‐roll processing (also known as web converting) and roll‐to‐roll processing appears to offer the best opportunity for very fast (and thus lowest cost) membrane formation Alternate membrane formation techniques were not considered in detail for this study Basic parameters of the selected approach are shown in Figure 41
39 ldquoReview and analysis of PEM fuel cell design and manufacturingrdquo Miral Mehta Joyce Smith Cooper Journal of Power Sources 114 (2003) 32‐53
40 PFSA membranes used in the chloro‐alkali production process are typically composed of 5‐9 layers of tailored membranes 41 PTFE is most commonly known as Teflontrade and is used as a non‐stick coating for frying pans etc Expanded PTFE is most commonly
known as Gore‐Textrade and is used as a ldquobreathablerdquo but water resistant layer in sportswear
Directed Technologies Inc 38
Membrane Ionomer Nafiontrade (PFSA) Substrate ePTFE Substrate Porosity 95 Substrate Density 0098 gcc Membrane Thickness 254 microns Nafion Density 1979 gcc
Figure 41 Basic membrane characteristics
4422 Membrane Material Cost The membrane material system is quite simple and consists of only two elements the Nafionreg ionomer and the
ePTFE substrate Expanded PTFE is used extensively in the textile industry where the production quantities dwarf even the highest demands from the automotive sector Conversations with apparel makers confirm that the price of ePTFE is unlikely to change appreciable between the low and high fuel cell system demands Consequently the cost of ePTFE is set at $5m2 for all membrane production levels
The cost of Nafionreg ionomer greatly affects overall membrane cost even though the membrane is very thin42 Based on vendor quotes of Nafionreg quotes for products similar to Nafionreg and on discussion with industry experts it was projected that Nafionreg ionomer costs would drop by roughly 95 from low to high production Figure 42 displays the assumed cost of Nafionreg ionomer used in this cost study Since Nafionreg cost is a major driver of overall membrane cost the Nafionreg $kg is a prime candidate for further exploration in a sensitivity analysis
As discussed below there are appreciable cutting losses43 associated with the roll‐to‐roll manufacturing process which directly affect the membrane material costs The same yield rates were applied to the materials as were applied to the manufacturing process (50ndash80 depending on production rate) but it was further assumed that a portion of ionomer in the scrap membrane was able to be recycled Consequently it was assumed for costing purposes that the ionomer material wastage rate was half that of the overall membrane areal scrap rate
42 Even at 25 microns approximately 50 grams of Nafionreg is contained in a square meter of membrane At $1000kg this equals $50m2
43 These losses are meant to capture the total difference between gross and net material usage Thus they encompass losses associated with trimming cutting startupshutdown and improper ionomer application
Directed Technologies Inc 39
Figure 42 Ionomer material cost
4423 Membrane Manufacturing Cost At low and intermediate production rates the processing cost to manufacture the membrane remains a major
if not dominant cost element In 1998 DTI analyzed44 the cost of a Gore‐like45 PEM membrane of 90‐by‐volume Nafionreg ionomer in an expanded‐polytetrafluoroethylene (ePTFE) matrix Multiple generations of similar Gore membranes have achieved industry leading membrane performance and Gore maintains a publicly stated commitment to lowering membrane costs to automotive competitive levels The authors previously analyzed manufacturing costs using DFMA techniques based on automated roll‐to‐roll processing The major steps of the process trains included unwinding of previously manufactured ePTFE occlusion of ionomer into the ePTFE web IR drying of the ionomer de‐ionized water rinse catalyst ink deposition via rollers IR drying boiling water hydration air drying and finished membrane winding with tension control throughout The membrane manufacturing cost was estimated at $083m2 at high production rates (500000 systems per year) but to achieve these levels very aggressive assumptions were made regarding ionomer material cost processing speed technical feasibility and capital cost
In 2001 Directed Technologies revisited the membrane forming process46 Processing parameter were modified and capital costs of the web processing equipment was estimated by vendor quotes from USWebcon Multiple variants on the process train were considered including alteration of the starting ionomer form to
44 Franklin D Lomax Jr Brian D James George N Baum CE ldquoSandyrdquo Thomas ldquoDetailed Manufacturing Cost Estimates for Polymer
Electrolyte Membrane (PEM) Fuel Cells for Light Duty Vehiclesrdquo Directed Technologies Inc prepared for Ford Motor Company under DOE contract August 1998
45 W L Gore amp Associates manufactures a number of membrane products based on ePTFE fabric as a support structure for polymer electrolyte 18 microns reflects the membrane thickness of the Gore Series 57 membrane produced specifically for automotive application
46 Brian D James ldquoDFMA Cost Estimation of LowMidHigh Production Fuel CellReformer Systemsrdquo Project Review Meeting Directed Technologies Inc prepared under DOE contract February 2001
Directed Technologies Inc 40
eliminate the boiling water hydration step multiple passes on the occlusiondipping step to ensure pinhole free coverage and multiple rewind stations to reduce the continuous length of the process train
In 2005 DTI again refined the membrane fabrication process47 based on further discussion with industry experts Industry feedback suggested the following cost modeling changes
Substantially increase capital cost
Decrease membrane yield rates
Decrease plant life48 from 10 years to 5 years
Plan for significant plant underutilization49 (assume plant to function at 67 capacity for the low and moderate production rates (1000‐30000 unitsyear) and 81 capacity at high production (500000 unitsyear))
These changes had the cumulative effect of significantly increasing membrane cost particularly at the low production rates This is not surprising since the web processing equipment was selected specifically for its high volume capacity thus it can be expected to shine at high volume but have poor scale‐down attributes
The 2008 analysis was based strongly on the 2005 assessment As schematically detailed in Figure 43 the membrane fabrication process consists of eight main steps
1 Unwinding An unwind stand with tensioners to feed the previously procured ePTFE substrate into the process line Web width was selected as the optimal width to match an integer number of cells and thereby minimize waste A web width of ~ 1m was deemed feasible for both the membrane fabrication line and the subsequent catalyzation and MEA hot‐pressing lines
2 First Ionomer Bath The ePTFE substrate is dipped into an ionomersolvent bath to partially occlude the pores
3 First Infrared Oven Drying The web dries via infrared ovens A drying time of 30 seconds was postulated Since the web is traveling quickly considerable run length is required The ovens may be linear or contain multiple back‐and‐forth passes to achieve the total required dwell time
4 Second Ionomer Bath The ionomer bath dipping process is repeated to achieve full occlusion of the ePTFE pores and an even thickness pinhole‐free membrane
5 Second Infrared Oven Drying The web is drying after the second ionomer bath
6 Boiling Water Hydration The web is held in boiling water for 5 minutes to fully hydrate the ionomer Optimal selection of the ionomer may reduce or eliminate this boiling step
7 Air Dryer High velocity air is used to dry the web after the hydration step
47 Gregory D Ariff Duane B Myers Brian D James ldquoBaseline PEM Fuel Cell Power System Cost Assessment for a 50 kW Automotive Systemrdquo Directed Technologies Inc prepared under DOE contract January 2005
48 Because mass‐manufacturing of membrane is a rapidly evolving technology a 5 year plant useful life was thought appropriate not because the equipment would wear out but because it would rapidly become technologically obsolete
49 The 67 capacity was based on 5‐year average utilization of a plant with 25 annual production increases The 81 capacity was based on a 10‐year average utilization of a plant with 5 annual production increases
Directed Technologies Inc 41
8 Rewind The finished membrane is wound onto a spool for transport to the catalyzation process line
Figure 43 Membrane fabrication process diagram
Details of the membrane fabrication cost analysis are shown in Figure 44 Two roll‐to‐roll plants are postulated a ldquolow‐speed plantrdquo (5 mmin) and a ldquohigh‐speedrdquo plant (35 mmin) Run at part load they cover the full span of membrane production requirements (1000 to 500000 vehiclesyear) Key assumptions are noted below
Capital Cost Capital costs are coarsely estimated based on industry input and are significantly greater than the element‐by‐element summation based on component price quotes
Web speed Even the ldquohigh‐speedrdquo web (35 mmin) is very slow by converting machinery standards where speeds of 100 mmin are often achieved50 This is a nod toward cost conservativeness and a reflection that the upper bound of membrane web speed is not known at this time
Discount Rate The discount rate is increased to 20 to reflect the increased business risk of a membrane production line
50 Several factors influence web speed selection the inherent mechanical strength of the web as it endures high‐speed processing the complexitynumber‐of‐turns required in a particular element to allow adequate dwell time when moving at highndashspeed and the web material losses resulting from a malfunction If the web requires 30 seconds to dry and moves at 100 mmin the drying section must be 300 m long If something should break or not perform adequately many meters of web product are lost during a shut‐down because of the inertia of the rollers
Directed Technologies Inc 42
Production for Simultaneous Product Lines In virtually all other components of the fuel cell stack system it was assumed that there was vertical integration and dedicated component production for a single vehicle product For the membrane however it is likely that a separate company will fabricate the membrane for multiple car companies or at least that the membrane plant will produce membrane for more than one line of vehicles Consequently a multiplier on the yearly membrane demand was included to reflect supply to multiple vehicle product lines This multiplier is not constant as production rate increases since the plant at is some point limited by capacity The non‐constant nature of the multiplier leads to unevenness in the resulting $m2 cost projections
Peak Equipment Utilization DTI conversations with a membrane supplier led to limiting the utilization of the plant as a means of reflecting rapid demand growth Utilization (at most manufacturing rates) was limited to 67 to reflect the five‐year average utilization assuming 25 per year demand growth For the 500000 vehicles per year case plant utilization is allowed to increase to 80 to reflect a more stable production scenario
ProductionCutting Yield Further conversations with a membrane supplier led to the postulation of a substantial loss rate in membrane production Per supplier input a 50 yield was assumed up to 25 plant utilization with an 80 yield above 80 utilization and a linear variance in between
Workdays and Hours The maximum plant operating hours were assumed to be 20 hours per day 240 days per year Actual hours vary based on actual plant utilization
Cost Markup The standard methodology throughout the analysis had been not to apply manufacturer markups in keeping with the vertically integrated manufacturing assumption and the directives of the DOE on this costing project However since it is likely that the membrane producer will not be vertically integrated a markup was included in our membrane cost estimate Furthermore because the membrane is a critical component of the stack significantly higher margins are allocated than are typical to the automotive industry where there is a large supplier base with virtually interchangeable products competing solely on price
Revenue Annual membrane fabricator revenue is not an input in the analysis Rather it is an output However it is worth noting that even at high membrane production rates company revenues are still only about $33M per year This is a modest company size and supports the notion of allowing higher‐than‐average markups as a means to entice people into the business
Directed Technologies Inc 43
2010 ‐ 2030 Annual Veh Prod (1 product line) vehyear 1000 30000 80000 130000 500000
Capital Amortization Capital Cost (Membrane Fabrication) $ $15000000 $15000000 $25000000 $25000000 $30000000
Machine Lifetime years 10 10 10 10 10 Discount Rate 20 20 20 20 20
Corporate Income Tax Rate 40 40 40 40 40 Capital Recovery Factor (CRF) 0331 0331 0331 0331 0331
Labor Costs Min Mfg Labor Staff (Simul on 1 Shift) FTE
Labor Rate $min
5
1
25 50 50
1 1 1
50
1
Machine Costs MaintSpare Parts ( of inst CCyear) 5 5 5 5 5
Miscellaneous Expenses 5 5 5 5 5 Total Power Consumption kW 200 250 350 350 350
Electrical Utility Cost $kWh 007 007 007 007 007
Membrane Production Parameters Simul Prod Lines to Which Mem is Supplied 45 15 3 215 1
Vehicle Annual Production vehyear 4500 45000 240000 279500 500000
m 2 per Vehicle m 2vehicle 1395 1395 1395 1395 1395
Peak Equipment Utilization Due to Growth 67 67 67 67 80 ProductionCutting Yield 50 70 64 67 80
ProdCutting Yield (to avoid circular logic) 50 70 65 68 80
Gross Production 100 Utilization (plant) m 2year 187388 1338486 7807836 8685732 10898438
Gross Production (plant) m 2year 125550 896786 5231250 5819440 8718750
Net Production (plant) m 2year 62775 627750 3348000 3899025 6975000
Net Production of 1 Line m 2year 13950 418500 1116000 1813500 6975000
Design Web Speed mmin 5 5 35 35 35 Web Width m 1 1 1 1 1
Work Days per Year daysyear 240 240 240 240 240
Plant Utilization (of 20 hr days) 87 623 519 577 865 Hours per Year of Production hrsyear 419 2989 2491 2771 4152 Hours per Day of Production hrsday 174 1246 1038 1155 1730
Annual Cost Summation Capital Recovery Cost $year $4963069 $4963069 $8271782 $8271782 $9926138
Labor Cost $year $576000 $4483929 $7473214 $8313486 $12455357 MaintenanceSpares Cost $year $750000 $750000 $1250000 $1250000 $1500000 Miscellaneous Expenses $year $750000 $750000 $1250000 $1250000 $1500000
Utility Cost $year $5859 $52313 $61031 $67893 $101719
Effective Machine Rate $min $281 $61 $122 $115 $102
Total Mfg Cost per m2 (Pre‐Markup) $m
2 $112 $18 $5 $5 $4
Manufacturing Cost Markup 100 100 75 50 30 Gross Margin 50 50 43 33 23
Annual Revenue $year $14089856 $21998620 $32035547 $28729742 $33128178
Total Manufacturing Cost (Incl Markup) $m2 $22445 $3504 $957 $737 $475
Figure 44 Simplified membrane manufacturing cost analysis assumptions
Membrane manufacturing cost is plotted against membrane annual volume in Figure 45 below Membrane material cost is not included Note that annual membrane volume has two potential definitions depending on the assumption of either a single product line or multiple product lines When all membrane production goes toward
51 Note that because these numbers are used only to obtain a curve fit the manufacturing costs shown here differ slightly from the actual manufacturing costs used (shown in Figure 47)
Directed Technologies Inc 44
51
a single product line membrane volume is total production volume When multiple product lines are assumed membrane volume represents annual sales volume (to a single customer) Thus in essence the cost curve is shifted to the left due to economies of scale made possible by pooling multiple demands The cost curve is seen to be uneven due to this effect To aid in numerical calculation a power curve was curve‐fit to each relationship and the less expensive multiple‐product‐line curve is utilized in subsequent power system cost computations
$1000
$100 Cost with Single ProductLine
Cost with MultipleProduct Lines
$10
$1
Me
mb
ran
e M
anu
fact
uri
ng
Co
st
$m
2
y = 3658E+06x-08615
y = 1139096x-06531
1000 10000 100000 1000000 10000000
Annual Membrane Manufacturing Volume m2year Figure 45 Membrane manufacturing cost vs annual membrane manufacturing volume
4424 Total Membrane Cost and Comparison to Other Estimates Total membrane cost used in this study is shown in Figure 46 below along with 2005 membrane estimates52
from DuPont and GM The DuPont and GM estimates were for 25‐micron‐thick homogeneous PFSA membranes whereas the DTI estimates were for ePTFE‐supported 25 micron membranes All estimates represent membrane fabrication and materials cost alone and do not include any catalyst or catalyst application cost Overall the estimates are in excellent agreement although they represent two distinctly different fabrication methods using the same ionic material Figure 47 details the material and manufacturing costs of the uncatalyzed membrane Note that unlike most elements in the cost analysis membrane manufacturer markup is added to the membrane cost as the membrane is likely to be produced by an outside vendor rather than made in‐house by the fuel cell fabricator
52 ldquoTwo Fuel Cell Cars In Every Garagerdquo Mark F Mathias Rohit Makharia Hubert A Gasteiger Jason J Conley Timothy J Fuller Craig J Gittleman Shyam S Kocha Daniel P Miller Corky K Mittelsteadt Tao Xie Susan G Yan Paul T Yu (all from GMrsquos Fuel Cells Activities Division or Giner Electrochemical Systems) The Electrochemical Society Interface Fall 2005 pg 24‐35
Directed Technologies Inc 45
Figure 46 Membrane (material + manufacturing) cost compared to previous analysis and vendor quotes
Annual Production Rate 1000 30000 80000 130000 500000 Materials ($m2
) $19167 $5225 $3527 $2854 $1625
Manufacturing ($m2) $25069 $2775 $1472 $1078 $448
Total Cost ($m2) $44236 $7999 $4999 $3932 $2073
Total Cost ($stack) $518451 $90884 $56223 $43823 $23078 Total Cost ($kWnet) $6481 $1136 $703 $548 $288
Materials ($m2) $19819 $5695 $3815 $3072 $1720
Manufacturing ($m2) $28473 $3152 $1672 $1225 $508
Total Cost ($m2) $48292 $8847 $5487 $4297 $2229
Total Cost ($stack) $465735 $82711 $50781 $39404 $20421 Total Cost ($kWnet) $5822 $1034 $635 $493 $255
2010
2015
Figure 47 Cost breakdown for un‐catalyzed membrane
443 Nanostructured Thin Film (NSTF) Catalyst Application Previous analysis by DTI has focused on roller‐based application of carbon supported platinum catalysts
deposited directly onto the PEM membrane This technique has the advantage of being one of the least costly application techniques judged adequate for high production rates and reasonably high MEA performance However it is increasingly clear that further increases in power density with simultaneously lower Pt loading is probably not possible with this technique Consequently a new method of catalyst deposition was examined that has shown remarkable recent improvements in power density and durability at low Pt loadings Developed at 3M the Nanostructured Thin Film Catalyst (NSTF) deposition process begins with a layer of crystalline finger‐like projections or ldquowhiskersrdquo that create a high surface area substrate on which the active catalysts may be deposited Next vapor deposition methods are utilized to deposit a very thin layer of a ternary catalyst allow onto the whiskers in a very precise and even manner The resulting catalyst coated whiskers can then be hot‐pressed into the fuel cell membrane to form a porous mat electrode intimately bonded to the membrane 3M has
Directed Technologies Inc 46
recently demonstrated significant improvements in the durability and the power‐density‐to‐catalyst‐loading ratio that surpass the 2010 DOE performance targets
4431 Application Process The NSTF application process involves four main steps as identified by a review of non‐proprietary open source
literature5354 3M representatives have reviewed and critiqued the analysis not for 100 accuracy as to how they would specifically carrying out the production but rather to vet the general approach and major elements affecting cost They judge the process and resulting cost estimate to be consistent with internal proprietary projections of resulting catalyst cost
The main steps of the modeled NSTF catalyst application process are listed below and shown in Figure 48
1 Deposition Physical Vapor Deposition(PVD) of PR‐149 (Perylene Red pigment 149) onto a DuPont Kaptonreg polyamide web (a temporary deposition substrate)
2 Annealing Vacuum annealing of the PR‐149 resulting in the formation of crystalline nanostructures through a screw dislocation growth process
3 Catalyst Sputtering Ternary PtCoMn catalyst is magnetron‐sputtered into the nanostructures
4 Catalyst Transfer Roll‐to roll transfer of the catalyst coated nanostructures from the Kaptonreg substrate to the PEM membrane
53 US Patent 4812352 titled ldquoArticle having surface layer of uniformly oriented crystalline organic microstructuresrdquo 54 ldquoAdvanced Cathodes and Supports for PEM Fuel Cellrdquo presented by Mark Debe of 3M at the 2009 DOE Hydrogen Program Annual
Review Meeting Arlington VA 20 May 2009
Directed Technologies Inc 47
Steps 1‐3
Vacuum Chamber PR‐149 Sublimation Unit
(Step 1)
Rollers
Kapton Roll Annealing (Step 2) Heaters
(Actually has 7 folds for shorter vacuum chamber length)
PtCoMn Sputtering (Step 3) Step 4
page15
Uncoated membrane
Calendering
Used Kapton Rolls
NSTF Anode Catalyst on Kapton
NSTF Cathode Catalyst on Kapton
Coated Membrane
Figure 48 NSTF production process diagram
4432 Cost and Performance Assumptions Cost and performance assumptions concerning the NSTF catalyst creation system are listed below
Capital Cost The capital costs of the manufacturing machinery were primarily based on conversations with industry representatives or derived from previous DTI work involving similar components A complete list of capital cost is shown in Figure 49
Component Cost Evacuation Chamber 1 Evacuation Chamber 2 Sublimation Unit Cylindrical Magnetron Sputtering Unit 64 m (effective length) Vacuum Annealing Oven Re‐Pressurization Chamber 1 Re‐Pressurization Chamber 2 Hot Calender Decal Application (Step 4) Total Capital Cost per Line
$78732 $147623 $100000 $210321 $428571 $127940 $78732
$100000 $1271921
Figure 49 Capital costs of NSTF manufacturing line
Line Speed The line speed calculation is based on a balance between the vacuum chamber length and the time needed for the sublimation annealing and sputtering operations and is set at 584 mmin It is not cost
Directed Technologies Inc 48
effective to draw and release a vacuum for separate operations thus all three are postulated to occur within the same vacuum chamber The bulk of the chamber will be devoted to annealing which at the given line speed requires 5838m of length Creating a vacuum chamber this long would be prohibitively expensive and thus the web will travel in a serpentine pattern folding back on itself 7 times so the annealing chamber itself will be ~85 m in total length An additional ~35 m of sublimation and ~15m of sputtering chamber will be on either end of the annealing chamber A minimum of ten minutes of annealing time is required for nanostructure formation In addition to the annealing time ~17 seconds is needed for catalyst deposition and 40 seconds is needed for PR‐149 sublimation onto the substrate These times are based on the thickness of the coatings (100nm for the PR‐149 and 44nm for the catalyst coating) as indicated by 3M and an approximate deposition rate of 25 nmsec as indicated by representatives of Vergason Technology Inc
Catalyst Loading 3M has demonstrated that high performance can be achieved at catalyst loadings of 015 mgPtcm2 in this configuration55 The assumed mole fraction for the ternary catalyst was assumed to be 73 Platinum 24 Cobalt and 2 Manganese
Web Roll Assumptions We have assumed a roll length of 1500 m with a loading time of ~16 minutes per roll56
4433 Results When compared to the previous method of catalyst application considered (Die‐slot application based on the
Coatema VertiCoater) the total NSTF catalyst system and application is actually slightly more expensive for a given power density and catalyst loading This is somewhat misleading however since the NSTF method facilitates a lower catalyst loading and improved power density that cannot be otherwise achieved Consequently taking power density and catalyst loading into consideration a net savings of $1028kWnet is obtained A cost comparison of the two methods (assuming similar catalyst loading and power density) is shown in Figure 50
55 ldquoAdvanced Cathodes and Supports for PEM Fuel Cellrdquo presented by Mark Debe of 3M at the 2009 DOE Hydrogen Program Annual Review Meeting Arlington VA 20 May 2009
56 The 16 minute total time includes times for loading and unloading the Kapton rolls as well as pressurizing and drawing a vacuum
Directed Technologies Inc 49
(at equal power density amp catalyst loading)
NSTF Total Cost VertiCoater Total Cost
VertiCoater Manufacturing Cost NSTF Manufacturing Cost
ldquoTotalCostrdquo Includes Catalyst
ldquoManufacturing Costrdquo = Ink prep + Application
Figure 50 Cost comparison between NSTF and VertiCoater methods
Machine rate and process parameters are show in Figure 51 and Figure 52 The overall cost breakdown at various system values and technology levels is shown in Figure 53
Annual Production Rate 1000 30000 80000 130000 500000 Capital Cost ($Line) Simultaneous Lines Laborers per Line
Line Utilization Effective Total Machine Rate ($hr)
Line Speed (ms)
$1284255 1 2
247 $677571 00973
$1284255 1 2
7178 $37373 00973
$1284255 2 2
9473 $31836 00973
$1284255 4 2
7627 $36026 00973
$1284255 12 2
9770 $31310 00973
2010
Capital Cost ($Line) Simultaneous Lines Laborers per Line
Line Utilization Effective Total Machine Rate ($hr)
Line Speed (ms)
$1282957 1 2
181 $922289 00973
$1284255 1 2
5215 $45973 00973
$1284255 2 2
6882 $38354 00973
$1284255 3 2
7389 $36721 00973
$1284255 9 2
9464 $31853 00973
2015
Figure 51 NSTF application process parameters
Annual Production Rate 1000 30000 80000 130000 500000 Equipment Lifetime
Interest Rate Corporate Income Tax Rate
Capital Recovery Factor Equipment Installation Factor
MaintenanceSpare Parts ( of CC) Miscellaneous Expenses ( of CC)
Power Consumption (kW)
1267 10 40 0185 14 10 7 737
1267 10 40 0185 14 10 7 737
1267 10 40 0185 14 10 7 737
1267 10 40 0185 14 10 7 737
1267 10 40 0185 14 10 7 737
5
201
2010 ‐
Figure 52 Machine rate parameters for NSTF application process
Directed Technologies Inc 50
Annual Production Rate 1000 30000 80000 130000 500000 Material ($stack) $66234 $66234 $66234 $66234 $66234
Manufacturing ($stack) $56321 $3004 $2533 $2841 $2467 Tooling ($stack) $2673 $798 $789 $787 $782
Total Cost ($stack) $125228 $70037 $69557 $69862 $69483 Total Cost ($kWnet) $1565 $875 $869 $873 $869
Material ($stack) $54502 $54502 $54502 $54502 $54502 Manufacturing ($stack) $55942 $2685 $2217 $2104 $1823
Tooling ($stack) $3028 $660 $651 $645 $637 Total Cost ($stack) $113471 $57848 $57371 $57251 $56963 Total Cost ($kWnet) $1418 $723 $717 $716 $712
2010
2015
Figure 53 Cost breakdown for NSTF application process
444 Catalyst Cost As described in the previous section a PtCoMn catalyst is used for the NSTF catalyst system and is applied via a
physical vapor deposition method (modeled as magnetron sputtering) Consistent with PVD the metal is supplied in the form of a pure sputtering target for each metal The cost of each target is estimated to be
Platinum $1100troy ounce Cobalt $287troy ounce Manganese $ 015troy ounce
The raw material cost of platinum is the major cost element of the catalyst ink At the direction of the DOE a platinum cost of $1100 per troy ounce is selected Using this value ensures consistency with other DOE projects and provides some insulation for the model from the wild fluctuations of the platinum market In 2008 for example the price of platinum varied greatly (as shown in Figure 54) with the daily trading values reaching an annual (and all‐time) peak of $2280troz on March 4 and a low of $782troz on October 2757
57 Platinum prices found at httpwwwplatinummattheycompricesprice_chartshtml
Directed Technologies Inc 51
M
onthly
USD
Troy Ounce
$2500
$2000
$1500
$1000
$500
$0
Platinum DOE‐Suggested Pt Cost ($1100) DAILY min amp max
$2280
$782
Jul‐05 Jul‐06 Jul‐07 Jul‐08 Jul‐09 Jul‐10
Figure 54 Five‐year graph of monthly platinum prices
While 2008 may have been an anomalously turbulent year in the market the five‐year average cost is $1312troz which is relatively close to the $1100 value provided by the DOE58 Careful consideration should be paid to this as changes in platinum cost will dramatically affect the system cost59
445 Gas Diffusion Layer Figure 55 displays a cross‐sectional diagram of the modeled gas diffusion layer (GDL) Consistent with recent
research60 the GDL was assumed to be a dual‐layer sheet with macroporous amp microporous layers The 028 mm thick macroporous layer was assumed to be a non‐woven carbon substrate (based on SGL Carbonrsquos GDL 34BA) to which a hydrophobic 004 mm thick microporous layer of PTFE and Vulcan XC‐72 is applied A full DFMA analysis of the GDL was not conducted61 Rather a price quote was obtained for the base macroporous layer and the costs of the microporous layer material and application were added to it
58 Prior to 2010 the 5‐year average price was much closer to $1100troz If the price does not decrease sufficiently in upcoming months it may be worthwhile to reexamine the price used in the model
59 See section 5 (ldquoSensitivity Analysisrdquo) for the effect that platinum cost and other parameters have on the system cost 60 Development and Characterizations of Microporous Layer for PEM Fuel Cells Sehkyu Park Jong‐Won Lee Branko N Popov (University
of South Carolina) Robert E Mammarella Kimiaki K Miyamoto (Greenwood Research Laboratory) 61 A bottom‐up analysis of the macroporous GDL layer is planned for a later stage of this project
Directed Technologies Inc 52
Figure 55 Cross‐section of gas diffusion layer in stack
Figure 56 schematically portrays the dual‐layer GDL process train Major steps in the process train include
Unrolling of the macroporous layer
Application of a PTFE coating via dipping in a PTFEsolvent bath
Drying of the PTFE coating in an IR oven
Spray deposition of the microporous layer
Drying of the PTFE coating in an IR oven
Drying of the microporous coating in an IR oven
Cure of the microporous coating
Rewind of the finished dual‐layer GDL
Directed Technologies Inc 53
Figure 56 Dual‐layer GDL process diagram
Component Cost Unwind Stand w Tensioner Dipper Oven 1 (Macroporous Layer) VCF1500HV Ultrasonic Mixer Sprayer for Microporous Solution Oven 2 (Microporous Layer Stage 1) Oven 3 (Microporous Layer Stage 2) Rewind Stand wTensioner
Total Capital Cost
$27283 $81849
$156317 $26444
$327396 $156317 $468951 $27283
$1271840 Figure 57 Capital cost breakdown for a typical microporous layer application line
Figure 58 and Figure 59 report the key process parameters for the GDL manufacturing process including the cost of the macroporous layer in $m2 of material purchased (not per active area of membrane) One of the benefits of applying the catalyst to the membrane rather than the GDLrsquos is that the anode and cathode GDLrsquos are identical and thus do not need separate processing Figure 60 however shows the purchased cost of the macroporous layer independent of the material or manufacturing costs for the rest of the GDL as it inherently includes both Overall the GDL contributes approximately $2ndash27kW to the cost of the fuel cell stack The range is large because of high material cost and low line utilization at 1000 systems per year
Directed Technologies Inc 54
Capital Cost ($Line) Simultaneous Lines Laborers per Line
Line Utilization Effective Total Machine Rate ($hr)
Line Speed (ms) Macroporous Layer Cost ($m2
)
$1271840 1
025 324
$489506 017
$7183
$1271840 1
025 9656 $21129 017
$4852
$1271840 3
025 8581 $23164 017
$2958
$1271840 5
025 8367 $23632 017
$2262
$1271840 17 025
9465 $21457 017 $951
2010
Capital Cost ($Line) Simultaneous Lines Laborers per Line
Line Utilization Effective Total Machine Rate ($hr)
Line Speed (ms) Macroporous Layer Cost ($m2
)
$1271840 1
025 236
$669628 017
$7183
$1271840 1
025 7014 $27249 017
$4852
$1271840 2
025 9351 $21658 017
$2958
$1271840 4
025 7597 $25532 017
$2262
$1271840 12 025
9740 $20988 017 $951
2015
Figure 58 GDL manufacturing process parameters (microporous layer addition only)
Annual Production Rate 1000 30000 80000 130000 500000 Equipment Lifetime
Interest Rate Corporate Income Tax Rate
Capital Recovery Factor Equipment Installation Factor
MaintenanceSpare Parts ( of CC) Miscellaneous Expenses ( of CC)
Power Consumption (kW)
15 10 40 0175 14 10 7 493
15 10 40 0175 14 10 7 493
15 10 40 0175 14 10 7 493
15 10 40 0175 14 10 7 493
15 10 40 0175 14 10 7 493
5
201
2010 ‐
Figure 59 Machine rate parameters for GDL manufacturing process
Annual Production Rate 1000 30000 80000 130000 500000 Purchased Macroporous Layer ($kWnet) $2000 $1351 $824 $630 $265
Other Materials ($kWnet) $009 $009 $009 $009 $009 Manufacturing ($kWnet) $666 $029 $031 $032 $029
Total Cost ($kWnet) $2675 $1389 $864 $671 $303
Purchased Macroporous Layer ($kWnet) $1646 $1112 $678 $518 $218 Other Materials ($kWnet) $008 $008 $008 $008 $008 Manufacturing ($kWnet) $664 $027 $021 $025 $021
Total Cost ($kWnet) $2317 $1146 $707 $551 $246
2010
2015
Figure 60 Cost breakdown for gas diffusion layers
446 MEA Gaskets and MEA Assembly The MEA gasket was based on insertion molding a silicone frame around the catalyzed membrane and GDLrsquos
The gasketed MEA is formed in three steps First is the hot‐pressing which is done in an indexed roll‐to‐roll process The second is cutting amp slitting of the hot‐pressed membrane and electrode into individual rectangular pieces Then the pieces are manually inserted into a mold and the framegasket is insertion‐molded around it This frame has features to hold the GDL and membrane as well as a ldquoliprdquo which folds over and captures the sheets for easy handling
4461 Hot‐Pressing the Membrane and GDLs The hot‐pressing process (see Figure 61) starts with three rolls two of GDL and one of catalyzed membrane
Because of the decision to catalyze the membrane instead of the electrode the two rolls of GDL are identical Each of the three corresponding unwind stands is equipped with a brake and a tensioner These three rolls merge
Directed Technologies Inc 55
at a set of rollers and then travel through the hot press On the other side of the press a single rewind stand collects the hot‐pressed membrane and electrode
Figure 61 Hot‐pressing process diagram
The press is heated to 160degC and is indexed with a press time of 90 seconds It takes 3 seconds to open the press advance the roll to the next section and re‐close the press making the cycle time 93 seconds The section advance time could be quicker but because of the limited tensile strength of the materials 3 seconds is appropriate Furthermore 3 seconds is only 130th of the press time and for an already‐inexpensive process the savings in speeding up the section advance would be minimal The press is 50 cm wide by 150 cm in length so approximately 18 to 22 cells get hot‐pressed at a time depending on the cell geometry Processing parameters are further defined in Figure 62
Directed Technologies Inc 56
Capital Cost ($Line) Costs per Tooling Set ($) Tooling Lifetime (cycles)
Simultaneous Lines Laborers per Line
Line Utilization Effective Total Machine Rate ($hr)
Index Time (s)
$187542 $10913 1000000
1 025 722 $29415 9300
$187542 $10913 1000000
3 025
7216 $4055 9300
$187542 $10913 1000000
6 025
9620 $3350 9300
$187542 $10913 1000000
10 025
9380 $3404 9300
$187542 $10913 1000000
37 025
9751 $3321 9300
2010
Capital Cost ($Line) Costs per Tooling Set ($) Tooling Lifetime (cycles)
Simultaneous Lines Laborers per Line
Line Utilization Effective Total Machine Rate ($hr)
Index Time (s)
$187542 $10913 1000000
1 025 529 $39709 9300
$187542 $10913 1000000
2 025
7879 $3817 9300
$187542 $10913 1000000
5 025
8403 $3656 9300
$187542 $10913 1000000
7 025
9753 $3321 9300
$187542 $10913 1000000
27 025
9725 $3327 9300
2015
Figure 62 Hot‐pressing process parameters
Hot pressing cost is summarized in Figure 64 Because of the simplicity of the process the cost is quite low especially at high manufacturing rates Since the press is flat tool wear is minimal Material costs are zero since the cost of membrane and GDL were accounted for elsewhere
Annual Production Rate 1000 30000 80000 130000 500000 Equipment Lifetime
Interest Rate Corporate Income Tax Rate
Capital Recovery Factor Equipment Installation Factor
MaintenanceSpare Parts ( of CC) Miscellaneous Expenses ( of CC)
Power Consumption (kW)
15 10 40 0175 14 5 7 16
15 10 40 0175 14 5 7 16
15 10 40 0175 14 5 7 16
15 10 40 0175 14 5 7 16
15 10 40 0175 14 5 7 16
5
201
2010 ‐
Figure 63 Machine rate parameters for hot‐pressing process
Annual Production Rate 1000 30000 80000 130000 500000 Manufacturing ($stack) $7136 $983 $812 $825 $805
Tooling ($stack) $073 $015 $011 $011 $011 Total Cost ($stack) $7209 $998 $823 $836 $816 Total Cost ($kWnet) $090 $012 $010 $010 $010
Manufacturing ($stack) $7056 $674 $645 $586 $587 Tooling ($stack) $073 $010 $009 $008 $008
Total Cost ($stack) $7129 $683 $654 $594 $595 Total Cost ($kWnet) $089 $009 $008 $007 $007
2010
2015
Figure 64 Cost breakdown for hot‐pressing process
4462 Cutting amp Slitting As shown in Figure 65 the rolls of hot‐pressed membrane and GDL are fed through cutters and slitters to trim
to the desired dimensions for insertion into the MEA frame The 50‐cm‐wide input roll is slit into ribbon streams of the appropriate width (again depending on cell geometry) The streams continue through to the cutters which turn the continuous material into individual rectangles These rectangles are then sorted into magazine racks
Directed Technologies Inc 57
Figure 65 Cutting amp slitting process diagram
Figure 67 further details the process parameters Machine utilization at 1000 systems per year is extremely poor (as low as 018) However costs associated with manual cutting are comparable to the automated system running at poor utilization Consequently for simplicity this process is presented as being automated at all production rates Figure 69 summarizes the overall cost of the cutting and slitting operation
Component Cost Unwind Stand w Tensioner CutterSlitter Stacker
Total Capital Cost
$27283 $92762 $10913
$130958 Figure 66 Capital cost breakdown for the cutting and slitting process
Annual Production Rate 1000 30000 80000 130000 500000 Capital Cost ($Line)
Costs per Tooling Set ($) Tooling Lifetime (cycles)
Simultaneous Lines Laborers per Line
Line Utilization Effective Total Machine Rate ($hr)
Line Speed (ms)
$130958 $5457 200000
1 025 024
$667900 100
$130958 $5457 200000
1 025 628 $26962 133
$130958 $5457 200000
1 025
1673 $10900 133
$130958 $5457 200000
1 025
2720 $7184 133
$130958 $5457 200000
2 025
5228 $4334 133
2010
Capital Cost ($Line) Costs per Tooling Set ($) Tooling Lifetime (cycles)
Simultaneous Lines Laborers per Line
Line Utilization Effective Total Machine Rate ($hr)
Line Speed (ms)
$130958 $5457 200000
1 025 018
$884245 100
$130958 $5457 200000
1 025 457 $36631 133
$130958 $5457 200000
1 025
1216 $14531 133
$130958 $5457 200000
1 025
1975 $9423 133
$130958 $5457 200000
1 025
7595 $3370 133
2015
Figure 67 Cutting amp slitting process parameters
Directed Technologies Inc 58
Annual Production Rate 1000 30000 80000 130000 500000 Equipment Lifetime
Interest Rate Corporate Income Tax Rate
Capital Recovery Factor Equipment Installation Factor
MaintenanceSpare Parts ( of CC) Miscellaneous Expenses ( of CC)
Power Consumption (kW)
15 10 40 0175 14 10 7 17
15 10 40 0175 14 10 7 17
15 10 40 0175 14 10 7 17
15 10 40 0175 14 10 7 17
15 10 40 0175 14 10 7 17
5
201
2010 ‐
Figure 68 Machine rate parameters for cutting amp slitting process
Annual Production Rate 1000 30000 80000 130000 500000 Manufacturing ($stack) $5439 $190 $077 $050 $030
Tooling ($stack) $255 $252 $252 $252 $252 Total Cost ($stack) $5694 $442 $329 $302 $282 Total Cost ($kWnet) $071 $006 $004 $004 $004
Manufacturing ($stack) $5437 $187 $074 $048 $017 Tooling ($stack) $218 $203 $201 $201 $201
Total Cost ($stack) $5655 $390 $276 $250 $219 Total Cost ($kWnet) $071 $005 $003 $003 $003
2010
2015
Figure 69 Cost breakdown for cutting amp slitting process
4463 Insertion‐Molding the FrameGasket The final step in creating the membrane electrode assembly (MEA) is insertion molding the framegasket Its
purpose is twofold
Provide sealing and proper manifolding around the periphery of the MEA
Provide a rigid structure to the MEA for ease of handling during assembly
Based on a 2003 patent from Ballard Power Systems (see Figure 70) the rectangular hot‐pressed membraneGDL is inserted into an injection‐molding machine and the gasket is molded into place around it
Figure 70 Insertion‐molded framegasket concept US patent 7070876
Directed Technologies Inc 59
This process is similar to the insertion molding of the coolant amp end gaskets (pages 66 amp 73 respectively) but has different manifolds and is molded around the hot‐pressed membrane amp electrode rather than onto the face of a bipolar plate or an end plate Because the membrane is sensitive to temperature this limits the molding temperature to 130degC or 150degC if the process is fast enough This requirement greatly limits the material choices for the gasket
Prior to the 2008 Update the material specified was a generic silicone After reviewing DTI work Jason Parsons from UTC highlighted some durability problems with using silicone as well as the fact that the silicone cost used in the analysis was too low
Several new materials were investigated as alternatives including several types of DuPontrsquos Vitonreg material and a new liquid injection‐moldable (LIM) hydrocarbon material from Henkel Loctite These materials are listed in Figure 71 with the best‐in‐group properties highlighted in red font Although the new material costs more than the old (erroneous) silicone cost itrsquos cheaper than the updated silicone cost and exhibits dramatically better durability performance Although DuPontrsquos Vitonreg GF‐S has a lower material cost (in $kg) than the LIM hydrocarbon the Vitonreg requires a higher injection‐molding pressure and takes three times longer to mold Furthermore the density of the Vitonreg is almost double that of the other materials so a greater material mass is needed to fill the required gasket volume meaning the gaskets weigh more and the per‐volume costs are actually the highest These factors all made the selection of the LIM hydrocarbon an easy choice
Generic Henkel Loctite Silicone (2007 Henkel Loctite DuPont Vitonreg
DuPont Vitonreg LIM
Analysis) Silicone 5714 GBL‐600S GF‐S Hydrocarbon Density gcc 14 105 184 192 105 Cost $kg $1433 $5670 $3687 $3687 $4337 Cost $L $2006 $5954 $6784 $7079 $4554 Cure Time s 150 540 420 180 60 Cure Temp degC 127 130 177 187 130 Durability hrs ~5000 ~5000 ~15000 ~15000 ~10000 Inj Mold Pressure low low mid‐to‐high mid‐to‐high low
Figure 71 MEA framegasket materials comparison62
In the injection‐molding process each part is required to have a shot mass greater than the part mass to account for material lost in the sprue and cooling channels In the 2008 design for example the part mass is 75 grams and the shot mass is 117
As shown in Figure 72 the optimal number of cavities per platen ranges from 6 to 16 as determined by lowest overall cost The necessary clamping force ranges from 640 to 1300 tons and the injection pressure is a constant 1379 bar (20000 psi) for each case
62 The prices listed are for 2008 technology 500000 systemsyear
Directed Technologies Inc 60
Annual Production Rate 1000 30000 80000 130000 500000 Capital Cost ($Line)
Costs per Tooling Set ($) Tooling Lifetime (cycles)
Simultaneous Lines Laborers per Line
Line Utilization Cycle Time (s)
CavitiesPlaten Effective Total Machine Rate ($hr)
Material Cost ($kg)
$278367 $62634 1000000
1 100
6911 135 6
$10476 $5142
$567794 $118950 1000000
10 033
9647 158 15
$10315 $4691
$567794 $118950 1000000
26 033
9893 158 15
$10112 $4569
$598772 $124447 1000000
40 033
9954 161 16
$10515 $4509
$598772 $124447 1000000
154 033
9944 161 16
$10523 $4348
2010
Capital Cost ($Line) Costs per Tooling Set ($) Tooling Lifetime (cycles)
Simultaneous Lines Laborers per Line
Line Utilization Cycle Time (s)
CavitiesPlaten Effective Total Machine Rate ($hr)
Material Cost ($kg)
$257779 $69770 1000000
1 100
6035 138 7
$10794 $5173
$456420 $118950 1000000
10 033
9647 158 15
$8639 $4719
$480444 $124447 1000000
25 033
9801 161 16
$8893 $4595
$480444 $124447 1000000
40 033
9954 161 16
$8789 $4536
$480444 $124447 1000000
154 033
9944 161 16
$8796 $4374
2015
Figure 72 MEA framegasket insertion‐molding process parameters
Annual Production Rate 1000 30000 80000 130000 500000 Equipment Lifetime
Interest Rate Corporate Income Tax Rate
Capital Recovery Factor Equipment Installation Factor
MaintenanceSpare Parts ( of CC) Miscellaneous Expenses ( of CC)
Power Consumption (kW)
1 10 40 0175 14 10 12 61
0 10 40 0175 14 10 12 91
0 10 40 0175 14 10 12 91
0 10 40 0175 14 10 12 94
0 10 40 0175 14 10 12 94
5
201
2010 ‐
Figure 73 Machine rate parameters for MEA framegasket insertion‐molding process
The cost summary for the MEA framegasket molding process is shown in Figure 74
Annual Production Rate 1000 30000 80000 130000 500000 Materials ($stack) $22236 $20285 $19755 $19498 $18801
Manufacturing ($stack) $24326 $11145 $10925 $10821 $10829 Tooling ($stack) $418 $529 $515 $511 $511
Total Cost ($stack) $46980 $31959 $31195 $30829 $30142
Total Cost ($kWnet) $587 $399 $390 $385 $377 Materials ($stack) $18026 $16444 $16014 $15806 $15241
Manufacturing ($stack) $21886 $9334 $9152 $9045 $9052 Tooling ($stack) $465 $529 $519 $511 $511
Total Cost ($stack) $40376 $26306 $25685 $25361 $24804
Total Cost ($kWnet) $505 $329 $321 $317 $310
2010
2015
Figure 74 Cost breakdown for MEA framegasket insertion molding
447 End Plates In a typical PEM fuel cell stack the purposes of an end plate are threefold
Directed Technologies Inc 61
Evenly distribute compressive loads across the stack
Cap off and protect the stack
Interface with the current collector
Normally there is also a separate insulator plate at each end to electrically insulate the stack from the rest of the vehicle However our end plate design based on a UTC patent (see Figure 75) eliminates the need for separate insulators Thus our end plates also serve a fourth function electrically insulate the ends of the stack
Made from a compression‐molded composite (LYTEX 9063) the end plate is strong enough (455 MPa) to withstand the required compressive loading while also being sufficiently electrically non‐conductive (3x10¹⁴ ohm‐cm volume resistivity) Using this material allows for an end plate with lower cost and lower thermal capacity than the typical metal end plates with the additional benefit of having no susceptibility to corrosion The benefits of lower cost and corrosion resistance are obvious and the low thermal capacity limits the thermal energy absorbed during a cold start effectively accelerating the startup period
Figure 75 End plate concept US patent 6764786
Directed Technologies Inc 62
Figure 76 End plate amp current collector63
LYTEX 9063 is a high performance engineered structural composite (ESC) molding compound consisting of epoxy and glass fiber reinforcement It is designed for military and aerospace structural applications requiring excellent mechanical properties retention of properties at elevated temperatures good chemical resistance and excellent electrical properties For all of these reasons it is ideally suited for this application
The end plates are manufactured via compression molding A summary of the procedure is as follows64
1 Remove enough LYTEX from cold storage for one days usage Allow it to warm to room temperature
2 Clean mold thoroughly Apply a uniform thin coating of a mold release (Note Once the mold is conditioned for LYTEX only periodic reapplications are required)
3 Adjust mold temperature to 300degF (148degC)
4 Adjust molding pressure on the material to 1500 psi (105 kgcm)
5 Remove protective film completely from both sides of the LYTEX
6 Cut mold charge so the LYTEX covers approximately 80 of the mold area and is about 105 of the calculated part weight
7 Dielectrically preheat the LYTEX quickly to 175degF (80degC)
8 Load material into mold and close the mold
9 Cure for 3 minutes
10 Remove part from mold Because of low shrinkage and high strength the part may fit snugly in the mold
11 Clean up mold and begin again
12 Re‐wrap unused LYTEX and return to cold storage
63 Some details of the port connections are not shown in the illustration 64 Based on Quantum Composites recommended procedures for LYTEX molding
Directed Technologies Inc 63
Annual Production Rate 1000 30000 80000 130000 500000 Capital Cost ($Line)
Costs per Tooling Set ($) Tooling Lifetime (cycles)
Simultaneous Lines Laborers per Line
Line Utilization Cycle Time (s)
CavitiesPlaten Effective Total Machine Rate ($hr)
LYTEX Cost ($kg)
$111521 $25114 300000
1 025 259 310 2
$60833 $1910
$267088 $71971 300000
1 025
1906 346 9
$20871 $1684
$289312 $77480 300000
1 025
4641 351 10
$10133 $1564
$289312 $77480 300000
1 025
7541 351 10
$6818 $1444
$333760 $88027 300000
3 025
8290 361 12
$7118 $1083
2010
Capital Cost ($Line) Costs per Tooling Set ($) Tooling Lifetime (cycles)
Simultaneous Lines Laborers per Line
Line Utilization Cycle Time (s)
CavitiesPlaten Effective Total Machine Rate ($hr)
LYTEX Cost ($kg)
$103851 $25114 300000
1 025 259 310 2
$56728 $1910
$177407 $54187 300000
1 025
2732 330 6
$10369 $1684
$177407 $54187 300000
1 025
7286 330 6
$4759 $1564
$214186 $66275 300000
1 025
9153 341 8
$4672 $1444
$214186 $66275 300000
4 025
8801 341 8
$4801 $1083
2015
Figure 77 End plate compression molding process parameters
As seen in Figure 79 the material represents the majority of the end plate costs ranging from 35 to 95 depending on the production rate
Annual Production Rate 1000 30000 80000 130000 500000 Equipment Lifetime
Interest Rate Corporate Income Tax Rate
Capital Recovery Factor Equipment Installation Factor
MaintenanceSpare Parts ( of CC) Miscellaneous Expenses ( of CC)
Power Consumption (kW)
150 10 40 0175 14 10 12 25
150 10 40 0175 14 10 12 50
150 10 40 0175 14 10 12 53
150 10 40 0175 14 10 12 53
150 10 40 0175 14 10 12 58
5
201
2010 ‐
Figure 78 Machine rate parameters for compression molding process
Annual Production Rate 1000 30000 80000 130000 500000 Materials ($stack) $3282 $2893 $2687 $2480 $1860
Manufacturing ($stack) $5294 $445 $197 $133 $119 Tooling ($stack) $167 $016 $006 $008 $007
Total Cost ($stack) $8743 $3355 $2891 $2621 $1986 Total Cost ($kWnet) $109 $042 $036 $033 $025
Materials ($stack) $2692 $2373 $2203 $2034 $1525 Manufacturing ($stack) $4937 $317 $146 $111 $114
Tooling ($stack) $167 $012 $009 $007 $007 Total Cost ($stack) $7796 $2702 $2358 $2151 $1646 Total Cost ($kWnet) $097 $034 $029 $027 $021
2010
2015
Figure 79 Cost breakdown for end plates
Directed Technologies Inc 64
448 Current Collectors The job of the current collectors is to channel the current that is distributed across the active area of the stack
down to the positive and negative terminals In our design based on the UTC patent (Figure 75) and shown in Figure 76 two copper current studs protrude through the end plates to connect to a copper sheet in contact with the last bipolar plate
The current collectors were designed to fit snugly within the end plate A shallow (03 mm) cavity in the end plate provides room for the 1 mm thick copper sheet sized to the active area of the cells The remaining 07 mm of the sheet thickness protrudes from the end plate and the end plate gasket seals around the edges
The face of the current collector is pressed against the coolant side of the last bipolar plate in the stack With the compression of the stack it makes solid electrical contact with the bipolar plate and thus can collect the current generated by the stack
The other side of the current collector is flush against the inner face of the end plate Two copper studs protrude through their corresponding holes in the end plate where they are brazed to the current collector sheet On the outside of the end plate these studs serve as electrical terminals to which power cables may be attached
Annual Production Rate 1000 30000 80000 130000 500000 Manufacturing Process
Costs per Tooling Set ($) Tooling Lifetime (cycles)
Capital Cost ($Line) Simultaneous Lines Laborers per Line
Line Utilization Effective Total Machine Rate ($hr)
Index Time (s) Copper Cost ($kg)
Manual $1799 400000 $22959
1 100 006 $4748 300
$1091
Auto $1799 400000 $67089
1 025 042 $1896 053
$1091
Auto $1799 400000 $67089
1 025 111 $719 053
$1091
Auto $1799 400000 $67089
1 025 180 $449 053
$1091
Auto $1799 400000 $67089
1 025 694 $126 053
$1091
2010
Manufacturing Process Costs per Tooling Set ($) Tooling Lifetime (cycles)
Capital Cost ($Line) Simultaneous Lines Laborers per Line
Line Utilization Effective Total Machine Rate ($hr)
Index Time (s) Copper Cost ($kg)
Manual $1716 400000 $21440
1 100 006 $4437 300
$1091
Auto $1716 400000 $65094
1 025 040 $1946 051
$1091
Auto $1716 400000 $65094
1 025 106 $736 051
$1091
Auto $1716 400000 $65094
1 025 171 $459 051
$1091
Auto $1716 400000 $65094
1 025 657 $129 051
$1091
2015
Figure 80 Current collector manufacturing process parameters
Manufacturing the current collectors is a fairly simple process A roll of 1 mm thick copper sheeting is stamped to size and 8 mm diameter copper rod is cut to 243 cm lengths The ends of the rods are then brazed to one face of the sheet At low production (1000 systems per year) a manual cutting process is used All other manufacturing rates use an automated process that cuts parts from a roll of copper sheet stock
Directed Technologies Inc 65
Annual Production Rate 1000 30000 80000 130000 500000 Equipment Lifetime
Interest Rate Corporate Income Tax Rate
Capital Recovery Factor Equipment Installation Factor
MaintenanceSpare Parts ( of CC) Miscellaneous Expenses ( of CC)
Power Consumption (kW)
15 10 40 0175 14 13 2 16
15 10 40 0175 14 13 2 16
15 10 40 0175 14 13 2 16
15 10 40 0175 14 13 2 16
15 10 40 0175 14 13 2 16
5
201
2010 ‐
Figure 81 Machine rate parameters for current collector manufacturing process
Annual Production Rate 1000 30000 80000 130000 500000 Materials ($stack) $700 $575 $511 $479 $448
Manufacturing ($stack) $915 $089 $034 $021 $006 Tooling ($stack) $012 $001 $001 $001 $001
Secondary Operations ($stack) $053 $053 $053 $053 $053 Total Cost ($stack) $1679 $718 $599 $554 $507 Total Cost ($kWnet) $021 $009 $007 $007 $006
Materials ($stack) $589 $484 $430 $404 $377 Manufacturing ($stack) $855 $086 $033 $020 $006
Tooling ($stack) $011 $001 $001 $001 $001 Secondary Operations ($stack) $053 $053 $053 $053 $053
Total Cost ($stack) $1508 $624 $516 $477 $436 Total Cost ($kWnet) $019 $008 $006 $006 $005
2010
2015
Figure 82 Cost breakdown for current collector manufacturing process
449 Coolant Gaskets The coolant gaskets allow coolant from the coolant manifolds to flow across the bipolar plates while keeping
the air and hydrogen manifolds sealed off They seal between the facing coolant‐flow sides of the bipolar plates around the perimeter of the flow fields Because there is a coolant gasket in every repeat unit plus an extra at the end of the stack (see Figure 25) there are 370 coolant gaskets needed per stack
There are several different methods of manufacturing and applying coolant gaskets The first of these is an insertion molding process which was specified for the baseline systems prior to the 2008 Update Two more methods have since been examined laser welding and screen printing the former of which was ultimately selected Figure 83 shows a comparison between the costs of the three methods
Directed Technologies Inc 66
Coolant G
asket Cost
($kW
net)
$300
$250
$200
$150
$100
$050
$000
Insertion Molding
Laser Welding
Screen Printing
0 100000 200000 300000 400000 500000
Annual Production Rate (systemsyear) Figure 83 Coolant gasket manufacturing method cost comparison (for 2010 technology)
4491 Insertion‐Molded Coolant Gaskets In this process the bipolar plates are inserted into an injection‐molding machine prior to each cycle and the
gaskets are molded directly onto the plates This is preferable to making stand‐alone gaskets because they are so thin that they lack the structural integrity to stand on their own which would make the assembly process exceedingly difficult
Prior to the 2008 Update the material specified was a generic silicone As with the MEA framegasket this material specification has been changed to a new liquid injection‐moldable hydrocarbon material from Henkel Loctite More on the material selection can be found in the section on the MEA FrameGasket (section 4463)
Unfortunately the insertion‐molding process has a relatively high manufacturing cost owing mainly to the slow cycle time of the molding process Figure 84 details the process parameters and Figure 86 summarizes the gasket costs
Directed Technologies Inc 67
Annual Production Rate 1000 30000 80000 130000 500000 Capital Cost ($Line)
Costs per Tooling Set ($) Tooling Lifetime (cycles)
Cavities per Platen Total Cycle Time (s) Simultaneous Lines Laborers per Line
Line Utilization Effective Total Machine Rate ($hr)
Material Cost ($kg)
$221621 $55129 1000000
5 1327 1
025 8159 $5272 $5142
$495804 $118950 1000000
15 1581 10 025
9673 $8838 $4691
$521983 $124447 1000000
16 1606 25 025
9828 $9115 $4569
$521983 $124447 1000000
16 1606 40 025
9981 $9002 $4509
$521983 $124447 1000000
16 1606 154 025
9971 $9009 $4348
2010
Capital Cost ($Line) Costs per Tooling Set ($) Tooling Lifetime (cycles)
Cavities per Platen Total Cycle Time (s) Simultaneous Lines Laborers per Line
Line Utilization Effective Total Machine Rate ($hr)
Material Cost ($kg)
$190040 $55129 1000000
5 133 1
025 8159 $4705 $5173
$402183 $118950 1000000
15 158 10 025
9673 $7428 $4719
$422592 $124447 1000000
16 161 25 025
9828 $7641 $4595
$422592 $124447 1000000
16 161 40 025
9981 $7550 $4536
$422592 $124447 1000000
16 161 154 025
9971 $7556 $4374
2015
Figure 84 Gasket insertion‐molding process parameters
Annual Production Rate 1000 30000 80000 130000 500000 Equipment Lifetime
Interest Rate Corporate Income Tax Rate
Capital Recovery Factor Equipment Installation Factor
MaintenanceSpare Parts ( of CC) Miscellaneous Expenses ( of CC)
Power Consumption (kW)
15 10 40 0175 14 10 12 53
15 10 40 0175 14 10 12 84
15 10 40 0175 14 10 12 86
15 10 40 0175 14 10 12 86
15 10 40 0175 14 10 12 86
5
201
2010 ‐
Figure 85 Machine rate parameters for gasket insertion‐molding process
Annual Production Rate 1000 30000 80000 130000 500000 Materials ($stack) $5739 $5235 $5098 $5032 $4852
Manufacturing ($stack) $14453 $9575 $9405 $9289 $9296 Tooling ($stack) $735 $529 $519 $511 $511
Total Cost ($stack) $20927 $15339 $15022 $14831 $14659 Total Cost ($kWnet) $262 $192 $188 $185 $183
Materials ($stack) $4445 $4055 $3949 $3898 $3759 Manufacturing ($stack) $12898 $8047 $7885 $7791 $7797
Tooling ($stack) $735 $529 $519 $511 $511 Total Cost ($stack) $18079 $12631 $12353 $12199 $12067 Total Cost ($kWnet) $226 $158 $154 $152 $151
2010
2015
Figure 86 Cost breakdown for gasket insertion‐molding
4492 Laser‐Welded Coolant Gaskets Laser welding is an option that only applies to use with metallic bipolar plates The idea of welding two plates
together to form a seal is a popular approach in the fuel cell industry an alternative to injection‐molding with potential for increased production rates Conversations with Richard Trillwood of Electron Beam Engineering of Anaheim California indicated that grade 316L stainless steel is exceptionally well‐suited to laser welding
Directed Technologies Inc 68
Additionally the thinness of the plates allows welding from above which is significantly quicker and cheaper than welding around the perimeter Figure 87 shows the key process parameters
Annual Production Rate 1000 30000 80000 130000 500000 Capital Cost ($Line)
Gaskets Welded Simultaneously Runtime per Gasket (s)
Simultaneous Lines Laborers per Line
Line Utilization Effective Total Machine Rate ($hr)
Material Cost ($kg)
$394977 1
622 1
025 1903 $29005 $000
$789955 3 21 2
025 9516 $12424 $000
$789955 3 21 6
025 8459 $13806 $000
$789955 3 21 9
025 9164 $12849 $000
$789955 3 21 32 025
9913 $11982 $000
2010
Capital Cost ($Line) Gaskets Welded Simultaneously
Runtime per Gasket (s) Simultaneous Lines Laborers per Line
Line Utilization Effective Total Machine Rate ($hr)
Material Cost ($kg)
$394977 1 6 1
025 1755 $31341 $000
$789955 3 2 2
025 8774 $13359 $000
$789955 3 2 5
025 9359 $12609 $000
$789955 3 2 8
025 9506 $12436 $000
$789955 3 2 30 025
9749 $12160 $000
2015
Figure 87 Coolant gasket laser welding process parameters
Laser welding provides a number of distinct advantages compared to traditional gasketing methods The welds are extremely consistent and repeatable and do not degrade over time as some gaskets do It also has extremely low power requirements and very low maintenance and material costs The consumables include argon gas compressed air and a cold water supply Maintenance involves lamp replacement every three months lens cleaning and general machine repair Trillwood suggested that the welding speed is limited to a range of 60 to 100 inches per minute with a maximum of three parts being welded simultaneously However according to Manufacturing Engineering amp Technology65 laser welding speeds range from 25mmin to as high as 80 mmin Taking a guess at a conservative value in the middle 15 mmin (025ms) was selected
The impact this has on the cycle time proved the processrsquo most limiting factor Although it is quicker than injection molding it is still slower than screen printing However the capital costs are low enough that laser welding is cost‐competitive with screen printing most production rates while providing a more consistent durable and reliable seal Figure 88 shows the machine rate parameters and Figure 89 shows the cost breakdown
Annual Production Rate 1000 30000 80000 130000 500000 Equipment Lifetime
Interest Rate Corporate Income Tax Rate
Capital Recovery Factor Equipment Installation Factor
MaintenanceSpare Parts ( of CC) Miscellaneous Expenses ( of CC)
Power Consumption (kW)
20 10 40 0162 14 10 12 34
20 10 40 0162 14 10 12 34
20 10 40 0162 14 10 12 34
20 10 40 0162 14 10 12 34
20 10 40 0162 14 10 12 34
5
201
2010 ‐
Figure 88 Machine rate parameters for gasket laser‐welding process
65 Manufacturing Engineering amp Technology by Kalpakjian amp Schmid (5th edition) p 957
Directed Technologies Inc 69
Annual Production Rate 1000 30000 80000 130000 500000 Materials ($stack) $000 $000 $000 $000 $000
Manufacturing ($stack) $18548 $2648 $2943 $2739 $2554 Tooling ($stack) $000 $000 $000 $000 $000
Total Cost ($stack) $18548 $2648 $2943 $2739 $2554 Total Cost ($kWnet) $232 $033 $037 $034 $032
Materials ($stack) $000 $000 $000 $000 $000 Manufacturing ($stack) $18480 $2626 $2478 $2444 $2390
Tooling ($stack) $000 $000 $000 $000 $000 Total Cost ($stack) $18480 $2626 $2478 $2444 $2390 Total Cost ($kWnet) $231 $033 $031 $031 $030
2010
2015
Figure 89 Cost breakdown for coolant gasket laser welding
4493 Screen‐Printed Coolant Gaskets Preliminary research revealed that screen printing outperformed laser welding in both cycle time and cost
efficiency Although updates to the laser welding analysis tipped the scale towards that process screen printing the gaskets is still a useful approach to have analyzed and is actually slightly cheaper than welding at most production rates Conversations with DEK International confirmed initial DTI assumptions and various screen printers were examined for their efficacy at five production levels To screen print a seal onto a bipolar plate a single plate or a pallet holding several plates is first fed into the machine by conveyor Once in the screen printer it is locked into place and cameras utilize fiduciary markers on either the plate itself or the pallet for appropriate alignment A precision emulsion screen is placed over the plates allowing a wiper to apply the sealing resin After application the resin must be UV cured to ensure adequate sealing
Two different scenarios were examined in the screen printing process In the first one plate would be printed at a time reducing costs by halving the need for handling robots to align plates It would also avoid the necessity of a pallet to align multiple plates in the screen printer The second scenario requires two handling robots to place four plates onto prefabricated self‐aligning grooves in a pallet ensuring proper alignment in the screen printer The advantage of this technique is reduced cycle time per plate However it would result in increased capital costs due to more expensive screen printers increased necessity for handling robots and precise mass‐manufacture of pallets Small variations in the grooves of pallets would lead to failure of the screen printer to align properly or apply the resin appropriately
Printers Three different screen printer models were examined as recommended by representatives from the DEK Corporation The Horizon 01i machine was suggested for one‐plate printing The Europa VI and the PV‐1200 were both evaluated for four plate printing Comparison of the screen printers can be seen in Figure 90 After cost‐analysis it was determined that despite the increased capital cost of the PV‐1200 machines their reduced cycle time (1226 second to 4 seconds) led to significant savings at high volumes Of the five different production levels examined the PV‐1200 was cheapest and most effective for all except the smallest 1000 systems per year scenario Due to low utilization the Horizon machine is the cheapest alternative at this production level Figure 91 details the cost per kW of each screen printer at the different production levels
Directed Technologies Inc 70
Screen Printers (DEK) Machine Horizon Europa VI
$1000000
841
$
in2 400
PV‐1200 Cycle Time s 963 1226 4 Cost $150000 $200000 Power Consumption kW 35 35 07
Print Area 841 Figure 90 Screen printer comparison
Figure 91 Screen printer cost vs annual production rate
Resin Our resin formula was based upon information gleaned from the Dana Corporation US patent 6824874 The patent outlines several resins that would be suitable to provide an effective seal between bipolar plates and resin ldquoArdquo was selected for its formulaic simplicity However any of the other recommended resins could be substituted with negligible changes in cost and performances
UV Curing Following printing a short conveyor is needed to transfer the printed plate to a UV curing system Consultation with representatives from UV Fusion Systems Inc of Gaithersburg Maryland along with information from the Dana Corporation resin patent indicated that the VPS 1250 lamp carrying 350 watt type D and type H+ bulbs would be adequate to cure the resin If it is only necessary to cure a single plate then one seven inch type D and one seven inch type H+ bulb should be used In order to ensure full UV coverage for a 24 inch pallet holding four plates three side‐by‐side ten inch bulbs of both types would be employed
Patent research indicates that roughly two seconds of exposure for each type of lamp is sufficient for curing When using the PV‐1200 screen printer the curing time for both lamps matches the cycle time for the screen printer If using the Horizon printer the cure time is less than half the cycle time for the printer yet in both situations the plates could be indexed to match the screen printer cycle time A shutter would be built into the lamp to block each bulb for half of the time the plate is within the system to ensure adequate exposure of both light types Rapidly turning the bulbs on and off is more destructive to the bulb life than continuous operation making a shutter the preferred method of alternating light sources
Directed Technologies Inc 71
Cost estimation for UV curing system includes cost of lamps bulbs power supply rack light shield to protect operators and blowers for both lamp operation and heat reduction
Figure 92 shows the key process parameters as selected for the model The capital cost includes the cost of the screen printer plus a UV curing system plate handling robots and a conveyor belt
Annual Production Rate 1000 30000 80000 130000 500000 Capital Cost ($Line)
Gaskets Printed Simultaneously Runtime per Gasket (s)
Simultaneous Lines Laborers per Line
Line Utilization Effective Total Machine Rate ($hr)
Material Cost ($kg)
$382339 1
976 1
025 2986 $16468 $1304
$1420142 4 10 1
025 9493 $18921 $1304
$1420142 4 10 3
025 8438 $20989 $1304
$1420142 4 10 5
025 8228 $21466 $1304
$1420142 4 10 16 025
9889 $18259 $1304
2010
Capital Cost ($Line) Gaskets Printed Simultaneously
Runtime per Gasket (s) Simultaneous Lines Laborers per Line
Line Utilization Effective Total Machine Rate ($hr)
Material Cost ($kg)
$382339 1 10 1
025 2997 $16412 $1304
$1420142 4 1 1
025 9466 $18969 $1304
$1420142 4 1 3
025 8413 $21045 $1304
$1420142 4 1 5
025 8203 $21523 $1304
$1420142 4 1 16 025
9859 $18307 $1304
2015
Figure 92 Coolant gasket screen‐printing process parameters
Maintenance Communication with DEK has indicated that if properly cared for the screen printers have a lifetime of twenty years but on average are replaced after only eight years due to poor maintenance practices The lifetime was specified as ten years Regular maintenance including machine repair cleaning and replacement of screens every 10000 cycles costs an estimated $10000 per year
Figure 93 shows the assumed machine rate parameters
Annual Production Rate 1000 30000 80000 130000 500000 Equipment Lifetime
Interest Rate Corporate Income Tax Rate
Capital Recovery Factor Equipment Installation Factor
MaintenanceSpare Parts ( of CC) Miscellaneous Expenses ( of CC)
Power Consumption (kW)
15 10 40 0175 14 3 12 61
15 10 40 0175 14 1 12 166
15 10 40 0175 14 1 12 166
15 10 40 0175 14 1 12 166
15 10 40 0175 14 1 12 166
5
201
2010 ‐
Figure 93 Machine rate parameters for coolant gasket screen printing process
Utilities Relatively little power is used by the printers A belt‐drive system that collects and releases parts is the primary power consumer of the screen printers Additional consumption comes from the alignment system the wiper blade and the screen controls Depending on the specifications of the individual printer power consumption varies from 07 to 35 kW On the other hand the UV curing system has higher power demand The total power usage ranging from 61 to 166 kW is primarily consumed by the lamps but also by the exhaust blowers and the modular blowers for the lamps Figure 94 shows the cost breakdown for the process
Directed Technologies Inc 72
Annual Production Rate 1000 30000 80000 130000 500000 Materials ($stack) $264 $264 $264 $264 $264
Manufacturing ($stack) $16524 $2012 $2232 $2282 $1941 Tooling ($stack) $000 $000 $000 $000 $000
Total Cost ($stack) $16788 $2276 $2496 $2547 $2206 Total Cost ($kWnet) $191 $026 $028 $029 $025
Materials ($stack) $204 $204 $204 $204 $204 Manufacturing ($stack) $16530 $2011 $2231 $2282 $1941
Tooling ($stack) $000 $000 $000 $000 $000 Total Cost ($stack) $16733 $2215 $2434 $2485 $2144 Total Cost ($kWnet) $192 $025 $028 $028 $025
2010
2015
Figure 94 Cost breakdown for coolant gasket screen printing
4410 End Gaskets The end gaskets are very similar to the coolant gaskets (section 449 but are sandwiched between the last
bipolar plate and the end plate rather than between two bipolar plates This means that welding is not an option as the end plates are non‐metallic They also have slightly different geometry than the coolant gaskets because they manifold the reactant gasses rather than the coolant Like the coolant gaskets they were initially modeled using insertion molding but were switched to a screen printing approach for the 2008 Update The largest difference between coolant gaskets and end gaskets is simply the quantity needed with only two end gaskets per stack there are far fewer of them than the coolant gaskets Although the same methodology is applied to their manufacture the processes are optimized from those used for the coolant gaskets in order to account for the lower quantities Figure 95 shows a comparison between the costs of the two different end gasket production methods Because of the lower production quantities the screen printing method yields a far smaller savings over the insertion‐molding method than it does for the coolant gaskets
$200
End
Gasket Cost
($kW
net )
$180
$160
$140
$120
$100
$080
$060
$040
$020
$000
Insertion Molding
Screen Printing
0 100000 200000 300000 400000 500000
Annual Production Rate (systemsyear) Figure 95 End gasket manufacturing method cost comparison (for 2008 technology)
44101 Insertion‐Molded End Gaskets The methodology for insertion molding the end gaskets is identical to that of the insertion‐molded coolant
gaskets (section 4491) Thus only the data tables are presented in this section and the reader is directed to the coolant gasket section for more details
Directed Technologies Inc 73
Annual Production Rate 1000 30000 80000 130000 500000 Capital Cost ($Line)
Costs per Tooling Set ($) Tooling Lifetime (cycles)
Cavities per Platen Total Cycle Time (s) Simultaneous Lines Laborers per Line
Line Utilization Effective Total Machine Rate ($hr)
Material Cost ($kg)
$212868 $34888 1000000
4 1327 1
025 055
$535372 $5142
$209325 $34888 1000000
4 1581 1
025 1961 $16271 $4691
$242074 $40787 1000000
5 1606 1
025 4250 $9419 $4569
$307573 $51619 1000000
7 1606 1
025 4933 $10226 $4509
$535045 $83855 1000000
14 1606 1
025 9486 $9583 $4348
2010
Capital Cost ($Line) Costs per Tooling Set ($) Tooling Lifetime (cycles)
Cavities per Platen Total Cycle Time (s) Simultaneous Lines Laborers per Line
Line Utilization Effective Total Machine Rate ($hr)
Material Cost ($kg)
$182483 $34888 1000000
4 133 1
025 055
$459137 $5173
$179260 $34888 1000000
4 158 1
025 1961 $14120 $4719
$204896 $40787 1000000
5 161 1
025 4250 $8171 $4595
$254556 $51619 1000000
7 161 1
025 4933 $8690 $4536
$430784 $83855 1000000
14 161 1
025 9486 $7986 $4374
2015
Figure 96 End gasket insertion‐molding process parameters
Annual Production Rate 1000 30000 80000 130000 500000 Equipment Lifetime
Interest Rate Corporate Income Tax Rate
Capital Recovery Factor Equipment Installation Factor
MaintenanceSpare Parts ( of CC) Miscellaneous Expenses ( of CC)
Power Consumption (kW)
15 10 40 0175 14 10 12 52
15 10 40 0175 14 10 12 52
15 10 40 0175 14 10 12 57
15 10 40 0175 14 10 12 65
15 10 40 0175 14 10 12 88
5
201
2010 ‐
Figure 97 Machine rate parameters for end gasket insertion‐molding process
Annual Production Rate 1000 30000 80000 130000 500000 Materials ($stack) $037 $034 $033 $033 $031
Manufacturing ($stack) $9917 $357 $168 $130 $061 Tooling ($stack) $233 $008 $003 $003 $002
Total Cost ($stack) $10186 $399 $204 $166 $095 Total Cost ($kWnet) $127 $005 $003 $002 $001
Materials ($stack) $029 $026 $025 $025 $024 Manufacturing ($stack) $8505 $310 $146 $111 $051
Tooling ($stack) $233 $008 $003 $003 $002 Total Cost ($stack) $8766 $344 $175 $139 $077 Total Cost ($kWnet) $110 $004 $002 $002 $001
2010
2015
Figure 98 Cost breakdown for end gasket insertion molding
44102 Screen‐Printed End Gaskets As with the insertion‐molded end gaskets the screen‐printed end gaskets share an identical methodology to
their coolant gasket counterpart but are optimized according to their production volume For more details on this process see section 4493 The data tables are presented below
Directed Technologies Inc 74
Annual Production Rate 1000 30000 80000 130000 500000 Capital Cost ($Line)
Gaskets Printed Simultaneously Runtime per Gasket (s)
Simultaneous Lines Laborers per Line
Line Utilization Effective Total Machine Rate ($hr)
Material Cost ($kg)
$382339 1
976 1
025 016
$2742033 $1304
$382339 1
976 1
025 484 $93378 $1304
$382339 1
976 1
025 1291 $36008 $1304
$382339 1
976 1
025 2098 $22766 $1304
$630187 4
310 1
025 2563 $30189 $1304
2010
Capital Cost ($Line) Gaskets Printed Simultaneously
Runtime per Gasket (s) Simultaneous Lines Laborers per Line
Line Utilization Effective Total Machine Rate ($hr)
Material Cost ($kg)
$382339 1 10 1
025 016
$2745539 $1304
$382339 1 10 1
025 484 $93496 $1304
$382339 1 10 1
025 1290 $36052 $1304
$382339 1 10 1
025 2096 $22793 $1304
$630187 4 3 1
025 2560 $30217 $1304
2015
Figure 99 End gasket screen printing process parameters
Annual Production Rate 1000 30000 80000 130000 500000 Equipment Lifetime
Interest Rate Corporate Income Tax Rate
Capital Recovery Factor Equipment Installation Factor
MaintenanceSpare Parts ( of CC) Miscellaneous Expenses ( of CC)
Power Consumption (kW)
15 10 40 0175 14 3 12 61
15 10 40 0175 14 3 12 61
15 10 40 0175 14 3 12 61
15 10 40 0175 14 3 12 61
15 10 40 0175 14 2 12 162
5
201
2010 ‐
Figure 100 Machine rate parameters for end gasket screen printing process
Annual Production Rate 1000 30000 80000 130000 500000 Materials ($stack) $002 $002 $002 $002 $002
Manufacturing ($stack) $14947 $507 $195 $123 $052 Tooling ($stack) $000 $000 $000 $000 $000
Total Cost ($stack) $14948 $508 $197 $125 $054 Total Cost ($kWnet) $187 $006 $002 $002 $001
Materials ($stack) $001 $001 $001 $001 $001 Manufacturing ($stack) $14947 $506 $195 $123 $052
Tooling ($stack) $000 $000 $000 $000 $000 Total Cost ($stack) $14948 $508 $197 $125 $053 Total Cost ($kWnet) $187 $006 $002 $002 $001
2010
2015
Figure 101 Cost breakdown for end gasket screen printing
4411 Stack Compression Traditional PEM fuel cells use tie‐rods nuts and Belleville washers to supply axial compressive force to ensure
fluid sealing and adequate electrical connectivity However the use of metallic compression bands was assumed as used by Ballard Power Systems and described in US Patent 5993987 (Figure 102) Two stainless steel bands of 2 cm width are wrapped axially around the stack and tightened to a pre‐determined stack compressive loading and then the ends of the bands are tack welded to each other The end platesrsquo low conductivity allows them to act as insulators to prevent shorting of the stack Custom recesses in the end plates are used to provide a convenient access to the lower surface of the bands to enable welding The edges of the bipolar plates do not
Directed Technologies Inc 75
contact the compressive bands The costs are reported as part of the stack assembly section as shown in Figure 106
Figure 102 Stack compression bands concept US patent 5993987
4412 Stack Assembly Stack assembly costs were based on the amortized workstation costs and the estimated times to perform the
required actions Two methods of stack assembly were analyzed manual and semi‐automated
At the lowest production rate of 1000 systems per year manual assembly was selected Manual assembly consists of workers using their hands to individually acquire and place each element of the stack end plate insulator current collector bipolar plate gasketed MEA bipolar plate and so on An entire stack is assembled at a single workstation The worker sequentially builds the stack (vertically) and then binds the cells with metallic compression bands The finished stacks are removed from the workstation by conveyor belt
At higher production levels stack assembly is semi‐automatic requiring less time and labor and ensuring superior quality control This is termed ldquosemi‐automaticrdquo because the end components (end plates current conductors and initial cells) are assembled manually but the 369 active cell repeat units are assembled via automated fixture Figure 103 details the layout of the assembly workstations and Figure 104 and Figure 105 lists additional processing parameters
Directed Technologies Inc 76
Figure 103 Semi‐automated stack assembly work flow diagram
Following assembly each stack is transported to a leak‐check station where the three sets of fluid channels (hydrogen air and coolant) are individually pressurized with gas and monitored for leaks This test is very brief and meant only to verify gas and liquid sealing Full performance testing of the stack will occur during stack conditioning
As shown in Figure 106 stack assembly is quite inexpensive ranging from $108kWnet at the most to only $046kWnet The only material costs are those of the compressive metal bands
Annual Production Rate 1000 30000 80000 130000 500000 Assembly Method
Capital Cost ($Line) Simultaneous Lines
LaborersLine Line Utilization
Effective Total Machine Rate ($hr) Index Time (min)
Manual $10913
1 100
4768 $4776 956
Semi‐Auto $799418
4 025
7575 $11991 204
Semi‐Auto $799418
9 025
8977 $10299 204
Semi‐Auto $799418
14 025
9378 $9909 204
Semi‐Auto $799418
51 025
9902 $9447 204
2010
Assembly Method Capital Cost ($Line) Simultaneous Lines
LaborersLine Line Utilization
Effective Total Machine Rate ($hr) Index Time (min)
Manual $10913
1 100
4768 $4776 956
Semi‐Auto $799418
4 025
7575 $11991 204
Semi‐Auto $799418
9 025
8977 $10299 204
Semi‐Auto $799418
14 025
9378 $9909 204
Semi‐Auto $799418
51 025
9902 $9447 204
5
201
Figure 104 Stack assembly process parameters
Directed Technologies Inc 77
Annual Production Rate 1000 30000 80000 130000 500000 Equipment Lifetime
Interest Rate Corporate Income Tax Rate
Capital Recovery Factor Equipment Installation Factor
MaintenanceSpare Parts ( of CC) Miscellaneous Expenses ( of CC)
Power Consumption (kW)
5 10 40 0306 14 10 7 1
15 10 40 0175 14 10 7 7
15 10 40 0175 14 10 7 7
15 10 40 0175 14 10 7 7
15 10 40 0175 14 10 7 7
5
201
2010 ‐
Figure 105 Machine rate parameters for stack assembly process
Annual Production Rate 1000 30000 80000 130000 500000 Compression Bands ($stack) $1000 $800 $600 $550 $500
Assembly ($stack) $7612 $4069 $3495 $3362 $3206 Total Cost ($stack) $8612 $4869 $4095 $3912 $3706 Total Cost ($kWnet) $108 $061 $051 $049 $046
Compression Bands ($stack) $1000 $800 $600 $550 $500
Assembly ($stack) $7612 $4069 $3495 $3362 $3206 Total Cost ($stack) $8612 $4869 $4095 $3912 $3706 Total Cost ($kWnet) $108 $061 $051 $049 $046
2010
2015
Figure 106 Cost breakdown for stack assembly
4413 Stack Housing The stack insulation housing is a plastic housing that encases the stack It is meant primarily for protection
from physical damage caused by road debris and liquids as well as for protection from electrical shorting contacts and a small amount of thermal insulation It is modeled as vacuum‐thermoformed polypropylene It is 05 cm thick and is separated from the stack by a 1 cm gap At high production rate the cycle time is seven seconds three for insertion and four for the vacuum thermoforming A cost breakdown of the stack housing production is shown below in Figure 107 and additional processing parameters are shown in Figure 108 and Figure 109
Annual Production Rate 1000 30000 80000 130000 500000 Materials ($stack) $507 $507 $507 $507 $507
Manufacturing ($stack) $2246 $164 $131 $088 $034 Tooling ($stack) $3422 $114 $038 $023 $006
Total Cost ($stack) $6175 $785 $676 $618 $547 Total Cost ($kWnet) $077 $010 $008 $008 $007
Materials ($stack) $434 $434 $434 $434 $434 Manufacturing ($stack) $2246 $164 $131 $088 $034
Tooling ($stack) $3422 $114 $038 $023 $006 Total Cost ($stack) $6103 $713 $603 $546 $475 Total Cost ($kWnet) $076 $009 $008 $007 $006
2010
2015
Figure 107 Cost breakdown for stack housing
Directed Technologies Inc 78
Annual Production Rate 1000 30000 80000 130000 500000 Capital Cost ($Line) $50000 $50000 $250000 $250000 $447489
Costs per Tooling Set ($) $91260 $91260 $91260 $91260 $91260 Tooling Lifetime (years) 3 3 3 3 3
Cavities per Platen 1 1 1 1 1 Total Cycle Time (s) 712 712 152 152 70 Simultaneous Lines 1 1 1 1 1 Laborers per Line 100 100 100 100 025
Line Utilization 059 1766 1005 1634 2894 Effective Total Machine Rate ($hr) $113558 $8302 $30952 $20859 $17735
Material Cost ($kg) $129 $129 $129 $129 $129 Capital Cost ($Line) $50000 $50000 $250000 $250000 $447489
Costs per Tooling Set ($) $91260 $91260 $91260 $91260 $91260 Tooling Lifetime (years) 3 3 3 3 3
Cavities per Platen 1 1 1 1 1 Total Cycle Time (s) 71 71 15 15 7 Simultaneous Lines 1 1 1 1 1 Laborers per Line 100 100 100 100 025
Line Utilization 059 1766 1005 1634 2894 Effective Total Machine Rate ($hr) $113558 $8302 $30952 $20859 $17735
Material Cost ($kg) $129 $129 $129 $129 $129
2010
2015
Figure 108 Stack housing vacuum thermoforming process parameters
Annual Production Rate 1000 30000 80000 130000 500000 Equipment Lifetime
Interest Rate Corporate Income Tax Rate
Capital Recovery Factor Equipment Installation Factor
MaintenanceSpare Parts ( of CC) Miscellaneous Expenses ( of CC)
Power Consumption (kW)
15 10 40 0229 14 5 6 30
15 10 40 0229 14 5 6 30
15 10 40 0175 14 5 6 35
15 10 40 0175 14 5 6 35
15 10 40 0175 14 5 6 40
5
201
2010 ‐
Figure 109 Machine rate parameters for stack housing vacuum thermoforming process
4414 Stack Conditioning and Testing PEM fuel cell stacks have been observed to perform better in polarization tests if they first undergo ldquostack
conditioningrdquo Consequently a series of conditioning steps are modeled based on a regulation scheme discussed in UTC Fuel Cellrsquos US patent 7078118 The UTC Fuel Cell patent describes both a voltage variation and a fueloxidant variation regime for conditioning The voltage variation method is selected since it requires marginally less fuel consumption and allows easier valving of reactants The conditioning would occur immediately after stack assembly at the factory Because the conditioning is effectively a series of controlled polarization tests the conditioning process also serves a stack quality control purpose and no further system checkout is required
Figure 110 details the stack conditioning steps The UTC patent states that while prior‐art conditioning times were 70+ hours the UTC accelerated break‐in methodology is able to achieve 95 of the performance benefit in 5 hours and typically achieve maximum performance in 133 hours66 Declining conditioning durations (5 hours for
66 The UTC Fuel Cell patents does not overtly state 133 hours to maximum performance but that duration is suggested by their specification of test procedure 10 cycles of polarization testing for maximum performance 100mAcm
2 increments and 5 minute increment hold times
Directed Technologies Inc 79
2008 technology 4 hours for 2010 and 3 hours for 2015) are selected consistent with the patentrsquos assertion that ldquothe required number will be dependent on the formulation and processing conditions used to fabricate the fuel cellsrdquo and an expectation of process improvement in the future
Cathode Filling Cycles
Anode Filling Cycles
Performance Calibrations
Step Gas on Anode
Gas on Cathode
Primary Load Switch
DC Power Supply Positive Terminal
Electrode Potential
Current Density
1 4 H2‐N2 N2 Open Connected to Cathode
Cathode 004V to 104V
Low
2 4 H2‐N2 N2 Open Connected to Cathode
Cathode 004V to 104V
Low
3 Repeat Step 1 Low
4 Repeat Step 2 Low
5 Repeat Step 1 Low
6 Repeat Step 2 Low
7 N2 4 H2‐N2 Open Connected to Anode
Anode 004V to 104V
Low
8 N2 4 H2‐N2 Open Connected to Anode
Anode 004V to 104V
Low
9 Repeat Step 7 Low
10 Repeat Step 8 Low
11 Repeat Step 7 Low
12 Repeat Step 8 Low
13 H2 Air Closed Not
Connected
Depends on Current Density
0‐1600
mAcm2
14 Repeat step 13 up to 10 times Figure 110 Stack conditioning process based on US patent 7078118 (ldquoApplied Voltage Embodimentrdquo)
Conditioning cost is calculated by estimating the capital cost of a programmable load bank to run the stacks up and down the polarization curve according to the power‐conditioning regimen The fuel cells load banks are assumed to condition three stacks simultaneously Since the three stacks can be staggered in starting time peak power can be considerably less than 3 times the individual stack rated power of 88 kWgross (for the 2010 system) It is estimated that simultaneous peak power would be approximately 150 kW and cost approximately $145000 at 500000 fuel cell systemsyear67 Hydrogen usage is estimated based on 50 fuel cell efficiency and $3kg hydrogen DTIrsquos standard machine rate methodology yields machine rates as low as $028min for each load bank Total costs for stack conditioning are shown in Figure 113 Note that considerable power is generated and rather than dumping the load to a resistor bank it may be advantageous to sell the electricity back to the grid
67 The costs of the programmable load banks are modeled on systems from FuelCon Systems Inc for which a ROM price quote of $210000 to $280000 per bank was obtained for production quantities of 10‐20
Directed Technologies Inc 80
This would require considerable electrical infrastructure and is expected to provide only a relatively small benefit68 sale of electricity to the grid is not included in our cost estimates
Annual Production Rate 1000 30000 80000 130000 500000 Capital Cost ($Line) Simultaneous Lines Laborers per Line
Line Utilization Effective Total Machine Rate ($hr)
Test Duration (hrs)
$424062 1
010 2894 $10252
5
$372317 9
010 9646 $3232
5
$312775 24 010
9645 $2831
5
$268019 38 010
9899 $2483
5
$147516 145 010
9978 $1684
5
2010
Capital Cost ($Line) Simultaneous Lines Laborers per Line
Line Utilization Effective Total Machine Rate ($hr)
Test Duration (hrs)
$424062 1
010 1736 $16605
3
$372317 6
010 8681 $3511
3
$312775 14 010
9921 $2772
3
$268019 23 010
9813 $2498
3
$147516 87 010
9978 $1684
3
2015
Figure 111 Stack conditioning process parameters
Annual Production Rate 1000 30000 80000 130000 500000 Equipment Lifetime
Interest Rate Corporate Income Tax Rate
Capital Recovery Factor Equipment Installation Factor
MaintenanceSpare Parts ( of CC) Miscellaneous Expenses ( of CC)
Power Consumption (kW)
10 10 40 0205 14 10 7 3
10 10 40 0205 14 10 7 3
10 10 40 0205 14 10 7 3
10 10 40 0205 14 10 7 3
10 10 40 0205 14 10 7 3
5
201
2010 ‐
Figure 112 Machine rate parameters for stack conditioning process
2015
2010
Annual Production Rate 1000 30000 80000 130000 500000 ConditioningTesting ($stack) $17088 $5387 $4718 $4138 $2806
Total Cost ($stack) $17088 $5387 $4718 $4138 $2806 Total Cost ($kWnet) $214 $067 $059 $052 $035
ConditioningTesting ($stack) $16606 $3511 $2772 $2498 $1684 Total Cost ($stack) $16606 $3511 $2772 $2498 $1684 Total Cost ($kWnet) $208 $044 $035 $031 $021
Figure 113 Cost breakdown for stack conditioning
45 Balance of Plant (BOP) While the stack is the heart of the fuel cell system many other components are necessary to create a
functioning system In general our cost analysis utilizes a DFMA‐style analysis methodology for the stack but a less rigorous methodology for the balance of plant (BOP) components Each of the BOP components is discussed below along with its corresponding cost basis
451 Air Loop The power system air loop consists of five elements
68 A power conditioning savings of approximately $180stack is estimated based on the sale of electricity back to the grid at $004kWh (assuming no additional infrastructure capital costs were incurred)
Directed Technologies Inc 81
Air Compressor Expander and Motor (CEM) Unit
Air Mass Flow Sensor
Air Filter and Housing
Air Ducting
These components are described in the subsections below The cost breakdown is show below in Figure 114
Annual Production Rate 1000 30000 80000 130000 500000 Filter amp Housing ($system) $5450 $4955 $4955 $4955 $4955
Compressor Expander amp Motor ($system) $148328 $81516 $68612 $66471 $64520 Mass Flow Sensor ($system) $6250 $5000 $3750 $3500 $3000
Air Ducting ($system) $9500 $7600 $5700 $5320 $4560 Total Cost ($system) $169529 $99072 $83017 $80246 $77035
Total Cost ($kWnet) $2119 $1238 $1038 $1003 $963 Filter amp Housing ($system) $5450 $4955 $4955 $4955 $4955
Compressor Expander amp Motor ($system) $115841 $65195 $53835 $51986 $50444 Mass Flow Sensor ($system) $6250 $5000 $3750 $3500 $3000
Air Ducting ($system) $4318 $3455 $2591 $2418 $2073 Total Cost ($system) $131859 $78605 $65131 $62859 $60472
Total Cost ($kWnet) $1648 $983 $814 $786 $756
2010
2015
Figure 114 Cost breakdown for air loop
4511 Compressor‐Expander‐Motor Unit amp Motor Controller The air compression system is envisioned as an integrated air compressor exhaust gas expander and
permanent magnet motor An electronic CEM controller is also included in the system
In previous yearsrsquo analyses the cost estimates for the compressor‐expander‐motor unit (CEM) were based on a simplified DFMA analysis in which the system was broken into seven cost elements wheelslobes motor controller case bearings variable geometry and assemblytest A price quote was obtained from Opcon Autorotor of Sweden for a twin‐lobe compressor and expander unit specifically designed and optimized for fuel cell systems of roughly 80 kilowatts These Opcon estimates for low production (~$40000 for quantity = 1) and high production (~$665 for 500000year) were used to validate the DTI costing estimates
For the 2009 analysis an all‐new extremely detailed CEM cost estimate was conducted in collaboration with Honeywell69 It is a bottom‐up cost analysis based directly on the blueprints from an existing Honeywell design70 which pairs a centrifugal compressor and a radial‐inflow expander with a permanent‐magnet motor running on air bearings at 100000 rpm After analyzing the base design engineers from both DTI and Honeywell simplified and improved the design to increase its performance and lower cost to better‐reflect a mass‐production design Ultimately six different configurations were examined three main configurations plus a version of each without an expander
69 Details of the Honeywell design were provided under a non‐disclosure agreement Consequently many of the details of the CEM analysis are omitted from this report
70 Honeywell Aerospace report to the US DOE ldquoCost and Performance Enhancements for a PEM Fuel Cell Turbocompressorrdquo (Contract DE‐FC36‐02AL67624)
Directed Technologies Inc 82
The six different configurations examined are listed in Figure 115 ldquoDesign 1rdquo is based on the existing Honeywell design which runs at 100000 rpm Design 2 is an optimized version of Design 1 running at 165000 rpm in order to reduce its size Design 3 is a further‐optimized future system based on Design 2 but with slightly more aggressive design assumptions Designs 4 5 and 6 are identical to Designs 1 2 and 3 respectively but with the expander removed
Current Near Future Future (100k rpm) (165k rpm) (165k rpm)
With Design 1 Design 2 Design 3 Expander (2010 tech)
Without Design 4 Design 5 Design 6 Expander (2015 tech)
Figure 115 Matrix of CEM design configurations
The estimate utilizes a combination of DFMA methodology and price quotes from established Honeywell vendors Excluding repeat parts the existing Honeywell turbocompressor design (Design 1) has 104 different components and assemblies Each of these components is categorized into one of three different tiers ldquoTier 1rdquo consists of the 26 largestmost‐significant components in need of the most careful cost analysis ldquoTier 2rdquo corresponds to the 42 mid‐level components for which a vendor quote is sufficient The ldquoTier 3rdquo components are the minor components such as screws and adhesives that are insignificant enough that educated guesses are sufficient in lieu of vendor quotes Honeywell engineers solicited price quotes from their existing supplier base for components in the top two tiers as well as for some of the components in Tier 3 and supplied these values to DTI for review and analysis
In some cases the high‐volume quotes were judged to be inappropriate as they were merely based on repeated use of low‐production‐rate manufacturing methods rather than low‐cost high‐manufacturing‐rate production and assembly methods71 Consequently these quotes were replaced with cost estimates based on a mix of DFMA techniques and our best judgment
After having completed the initial cost summation for Design 1 the unit costs seemed prohibitively high Consequently Honeywell engineers reviewed their design and created a list of potential improvements DTI augmented the list with some DFMA‐based suggestions the list was vetted by both parties and the design changes incorporated into the cost model Changes deemed reasonable to describe as ldquocurrent technologyrdquo were applied to Design 2 and the more aggressive improvements were used to define Design 3 The most important of these improvements is the switch from 100000 to 165000 rpm which facilitates a reduction in the size of the CEM by roughly 35 thereby saving greatly on material (and to a lesser extent manufacturing) costs while also providing the intrinsic benefits of reduced size These improvements are listed in Figure 116
71 The vendors approached were typically those used by Honeywell in the past Unfortunately several vendors were prototype and lowmoderate volume manufacturing facilities and were not well suited for true high rate production
Directed Technologies Inc 83
Figure 116 List of Improvements for the 6 Compressor Configurations
2010 2015
Design 1 2 3 4 5 6
Current (100k rpm)
Future (165k rpm)
Future (165k rpm)
Current (100k rpm)
Future (165k rpm)
Future (165k rpm)
x x x
x x x x x x x x x x x x x x x x
x x
x x
x x
x x x x x x x x x x
x x
x x
x x x
Improved labryinth seal
Changed fasteners to more common inexpensive design
Changed threaded inserts to more common inexpensive design
Reduced testing of machinedcast parts
Aluminum turbine wheel
With Expander Without Expander
Removed Turbine (Expander)
[Baseline
System
Design]
Increased speed from 100000 to 165000 rpm
Improved turbine wheel design
Improved variable nozzle technology
Lower cost electrical connectors
Design change to integrate housing into single casting
Integrateeliminate mounting bosses on main housing
Compressor housing design change to re‐route cooling air over motor
Improved foil bearing design
Back‐to‐back compressor wheel
Removed washersface bolts
Improved bearing installationdesign
Each of the six CEM designs was analyzed across the range of five production rates (1000 to 500000 systems per year) this yields 30 different cost estimates for each of the 100+ components Summed together they provide 30 different estimates for the CEM cost The five Design 2 estimates provide the 2010 compressor costs across the range of production rates and the Design 6 estimates are used for 2015
For the 2010 update the CEM cost model was fully integrated into the fuel cell system cost model and adjusted to scale dynamically based on the pressure and power requirements of the system This was achieved via a complex system of multipliers that are applied differently for almost every different component since there are a wide variety of combinations and permutations for costing methods across the range of components and not everything scales at the same rate For example as the pressure ratio increases and the CEM increases in size the diameter of the turbine wheel increases and its volume increases at a rate proportional to the square of its diameter The diameter of the compressor wheel scales at a different rate than that of the turbine (expander) wheel and the shaft length and motor mass each scale at yet another rate The geometric scaling factors were derived from data that Honeywell provided showing dimensions of key components across a range of performance parameters such as pressure ratio mass flow rate and shaft power
The materials cost of each component increases proportionately with the volume of material needed and the manufacturing costs scale separately at rates dependent on the manufacturing processes involved and the specifics of each process
Directed Technologies Inc 84
For components whose cost estimates are derived partially or completely from price quotes rather than full DFMA analysis (such as those in Tier 2 and Tier 3) assumptions were made about the fractional split between the componentrsquos material and manufacturing costs so that each fraction can be scaled independently
With this new scaling and integration into the main fuel cell system cost model the size and cost of the CEM now scale dynamically based on the performance requirements of the system So if a new electrical component is added to the BOP that increases the parasitic load (and thus increases the gross power required) the CEM will scale to accommodate
The DTIHoneywell CEM analysis also examined the motor controller for which the same design was deemed applicable to control all six compressor designs Unlike with the custom parts involved in the compressor the motor controller uses almost exclusively off‐the‐shelf parts that are already manufactured at high volume As such there is limited value in conducting a detailed DFMA analysis72 so the cost analysis is primarily based on vendor quotation The original Honeywell controller design was a standalone unit with its own air or water cooling However in order to cut costs it is now assumed that the CEM controller is integrated into the water‐cooled electronics housing for the overall fuel cell system controller
The CEM and motor controller costs for the various configurations are shown below in Figure 117 Because the costs now scale with performance parameters costs for the same design number are different between 2010 and 2015 Values used in the 2010 and 2015 fuel cell system cost estimates are shown in green
72 While a bottoms‐up manufacturing analysis was not conducted for the controller components assembly of the controller was assessed using DFMA techniques
Directed Technologies Inc 85
2010 2015 2010 2015 2010 2015 CEM Motor Controller Total
Design Sysyear Cost Assy Markup Cost Assy Markup Cost
Design 1 Existing Tech 100000 RPM
1000 $121581 $116247
$2300 15
$40892 $40892
$767 10
$188288 $182153 30000 $51351 $47613 $34011 $34011 $99954 $95655 80000 $38881 $35261 $32894 $32894 $84385 $80221
130000 $38184 $34586 $31423 $31423 $81965 $77828 500000 $37118 $33557 $30339 $30339 $79547 $75452
Design 2 Near‐Future 165000 RPM
1000 $86833 $83881
$2300 15
$40892 $40892
$767 10
$148328 $144933 30000 $35318 $33002 $34011 $34011 $81516 $78853 80000 $25166 $22920 $32894 $32894 $68612 $66029
130000 $24710 $22478 $31423 $31423 $66471 $63903 500000 $24051 $21839 $30339 $30339 $64520 $61976
Design 3 Future
165000 RPM
1000 $73742 $71246
$2300 15
$40892 $40892
$767 10
$133273 $130402 30000 $31121 $29259 $34011 $34011 $76690 $74548 80000 $21726 $19917 $32894 $32894 $64656 $62576
130000 $21328 $19528 $31423 $31423 $62581 $60511 500000 $20749 $18966 $30339 $30339 $60723 $58672
Design 4 Existing Tech 100000 RPM No Expander
1000 $89395 $86379
$2300 15
$40892 $40892
$767 10
$151273 $147805 30000 $33794 $31227 $34011 $34011 $79764 $76812 80000 $22388 $19898 $32894 $32894 $65418 $62554
130000 $22031 $19555 $31423 $31423 $63390 $60542 500000 $21541 $19086 $30339 $30339 $61634 $58810
Design 5 Near‐Future 165000 RPM No Expander
1000 $72286 $70374
$2300 15
$40892 $40892
$767 10
$131599 $129400 30000 $25722 $24126 $34011 $34011 $70481 $68645 80000 $16148 $14597 $32894 $32894 $58241 $56458
130000 $15889 $14347 $31423 $31423 $56327 $54552 500000 $15503 $13973 $30339 $30339 $54691 $52931
Design 6 Future
165000 RPM No Expander
1000 $60240 $58584
$2300 15
$40892 $40892
$767 10
$117746 $115841 30000 $22453 $21126 $34011 $34011 $66721 $65195 80000 $13610 $12316 $32894 $32894 $55323 $53835
130000 $13402 $12115 $31423 $31423 $53467 $51986 500000 $13089 $11810 $30339 $30339 $51914 $50444
Figure 117 CEM cost results
4512 Air Mass Flow Sensor A high‐performance (~2 signal error) automotive hot‐wire mass flow sensor for measuring the air flow rate
into the fuel cell system Since these devices are already produced in very high quantities little change in cost is expected between high and low production rates The OEM cost of a mass flow sensor for quantities of 1000 per year is estimated to be roughly $100 and drops to about $65 for high quantities
4513 Air Ducting The air ducting is modeled as conformal polymer tubes to guide the cathode air in and out of the stack
Directed Technologies Inc 86
4514 Air Filter and Housing Some fuel cell manufacturers filter inlet air both for particles and for volatile organic compounds73 However
while particle filters are needed it is not clear that VOC filters are necessary Consequently a standard automotive air particle filter and polymer filter housing are assumed
452 Humidifier amp Water Recovery Loop Based on interaction with Rajesh Ahuwalia at Argonne National Laboratory an Air Precooler and a Demister
were added to the balance of plant for the 2010 update None of these components are included in the 2015 system
Annual Production Rate 1000 30000 80000 130000 500000 Air Precooler ($system) $5275 $5275 $5275 $5275 $5275
Demister ($system) $11620 $1338 $883 $783 $626 Membrane Air Humidifier ($system) $148707 $41494 $23876 $18228 $9425
Total Cost ($system) $165602 $48107 $30035 $24286 $15326
Total Cost ($kWnet) $2070 $601 $375 $304 $192 Air Precooler ($system) $000 $000 $000 $000 $000
Demister ($system) $000 $000 $000 $000 $000 Membrane Air Humidifier ($system) $000 $000 $000 $000 $000
Total Cost ($system) $000 $000 $000 $000 $000
Total Cost ($kWnet) $000 $000 $000 $000 $000
2010
2015
Figure 118 Cost breakdown for humidifier amp water recovery loop
4521 Air Precooler The air precooler sits between the air compressor and the membrane humidifier where it cools the hot
compressed air to the humidifierrsquos optimal inlet temperature of 55degC The design is based on the ANL‐supplied key parameters for a compact liquidair cross‐flow intercooler and the dimensions are scaled based on the specific heat transfer requirements The unit is 100 aluminum and uses an array of 04‐mm‐thick tubes with 008‐mm‐thick fins spaced at 24 fins per inch which cool the air with a very minimal pressure drop (005 psi) Because the cost impact of the precooler is small a full DFMA analysis was not conducted Instead the mass and volume of the radiator core were determined by heat transfer calculations conducted at ANL and the materials cost of the unit was estimated based on detailed geometry assumptions and the cost of aluminum ($770kg) The materials cost was then simply doubled to account for the cost of manufacturing
Annual Production Rate 1000 30000 80000 130000 500000 Materials ($system) $2638 $2638 $2638 $2638 $2638
Manufacturing ($system) $2638 $2638 $2638 $2638 $2638 Total Cost ($system) $5275 $5275 $5275 $5275 $5275 Total Cost ($kWnet) $066 $066 $066 $066 $066
Materials ($system) $1722 $1722 $1722 $1722 $1722 Manufacturing ($system) $1722 $1722 $1722 $1722 $1722
Total Cost ($system) $3444 $3444 $3444 $3444 $3444 Total Cost ($kWnet) $043 $043 $043 $043 $043
2015
2010
Figure 119 Cost breakdown for air precooler
73 Press Release from the Dana Company Inc ldquoSmart Fuel Cell uses Donaldson filters in its new EFOY line of direct methanol fuel cellsrdquo 25 May 2006
Directed Technologies Inc 87
4522 Demister The demister removes liquid water droplets from the cathode exhaust stream and thereby prevent erosion of
the turbine blades Designed by DTI the demisterrsquos housing consists of two threaded hollow 2‐mm‐thick polypropylene frustums that unscrew from one another to allow access to the filter inside The filter is a nylon mesh Millipore product designed for water removal and costed at $584 each at high volume (assuming 81 cm2
per demister) The polypropylene adds only 10 cents of material cost per part and at high volume the injection molding process is only 15 cents per part Because the housing is so inexpensive the filter dominates the total demister cost ($612 or $008kWnet)
Annual Production Rate 1000 30000 80000 130000 500000 Materials ($system) $1227 $983 $740 $692 $594
Manufacturing ($system) $9973 $340 $133 $085 $026 Tooling ($system) $420 $014 $011 $006 $005
Total Cost ($system) $11620 $1338 $883 $783 $626 Total Cost ($kWnet) $145 $017 $011 $010 $008
Materials ($system) $1227 $983 $740 $692 $594 Manufacturing ($system) $9973 $341 $133 $085 $026
Tooling ($system) $420 $014 $011 $006 $005 Total Cost ($system) $11620 $1338 $884 $783 $626 Total Cost ($kWnet) $145 $017 $011 $010 $008
2015
2010
Figure 120 Cost breakdown for demister
Annual Production Rate 1000 30000 80000 130000 500000 Capital Cost ($Line)
Costs per Tooling Set ($) Tooling Lifetime (cycles)
Cavities per Platen Total Cycle Time (s) Simultaneous Lines Laborers per Line
Line Utilization Effective Total Machine Rate ($hr)
Material Cost ($kg)
$280793 $31524 1000000
1 640 1 1
011 $2639830
$129
$280793 $31524 1000000
1 640 1 1
165 $184509
$129
$280793 $31524 1000000
1 640 1 1
429 $73627 $129
$280793 $31524 1000000
1 640 1 1
694 $47308 $129
$309696 $51212 1000000
2 681 1 1
1413 $27802 $129
2010
Capital Cost ($Line) Costs per Tooling Set ($) Tooling Lifetime (cycles)
Cavities per Platen Total Cycle Time (s) Simultaneous Lines Laborers per Line
Line Utilization Effective Total Machine Rate ($hr)
Material Cost ($kg)
$280793 $31524 1000000
1 681 1 1
012 $2562833
$129
$280793 $31524 1000000
1 681 1 1
175 $174068
$129
$280793 $31524 1000000
1 681 1 1
456 $69535 $129
$280793 $31524 1000000
1 681 1 1
738 $44763 $129
$309696 $51212 1000000
2 681 1 1
1413 $27802 $129
2015
Figure 121 Demister injection molding process parameters
Directed Technologies Inc 88
Annual Production Rate 1000 30000 80000 130000 500000 Equipment Lifetime
Interest Rate Corporate Income Tax Rate
Capital Recovery Factor Equipment Installation Factor
MaintenanceSpare Parts ( of CC) Miscellaneous Expenses ( of CC)
Power Consumption (kW)
15 10 40 017 14 5 6 21
15 10 40 017 14 5 6 21
15 10 40 017 14 5 6 21
15 10 40 017 14 5 6 21
15 10 40 017 14 5 6 31
5
201
2010 ‐
Figure 122 Machine rate parameters for demister injection molding process
4523 Membrane Humidifier The design and material parameters are based on the FC200‐780‐7PP membrane humidifier from Perma Pure
LLC but the sizing is adjusted for actual flow rates A representative diagram of this humidifier is shown in Figure 123
Figure 123 Perma Pure FC200‐780‐7PP humidifier74
The manufacturing process postulated for the cost analysis involves nine steps The steps are listed below and are illustrated in Figure 124
1 Extrusion 960 parallel Nafion tubes (~1 mm OD) are simultaneously extruded and subsequently wrapped in nylon mesh to create a tube bundle for facilitated handling
2 De‐ionized (DI) Water Bath Hydration of the Nafion tubing in a near boiling water bath
3 Tube Cutting Cut the tube bundles into their appropriate length
4 Quality Control Optical quality control measurements (includes length concentricity check etc)
5 Dipping End caps are dipped in polyurethane to secure the tube bundles in the appropriate shape and provide a barrier to gas flow between the tubes at the tube ends
6 End Cap Trimming Cut polyurethane end caps to expose the inner diameter ends and allow unimpeded flow through each tube
74 Image from httpwwwpermapurecom
Directed Technologies Inc 89
7 Injection Molding Each separately molded side of the Noryl housing has two ports for the intake and exhaust gas flows
8 Final Assembly Combine casing tube bundle O‐rings C‐clips and nylon mesh filters (but do not secure)
9 Vibration Welding Vibrationally weld the two halves of the plastic case thereby trapping all interior components in place
Figure 124 Membrane humidifier manufacturing process diagram
Key assumptions made concerning the humidifier manufacturing are listed below
Manufacturing
Nafion extrusion rate is 45 cmmin
5 minute DI water bath dwell time
30 second polyurethane end cap set time
10 second total vibration welding cycle time
Directed Technologies Inc 90
Assumed 5 seconds to pick up and place each O‐ring C‐clip and mesh filter
The effective line length of the DI bath is 225 meters with the tube bundle traveling along a serpentine path to increase line length
Capital Cost Capital costs are primarily derived from previous DTI work involving similar components The complete list of capital costs is shown in Figure 125
Component Cost Nafion Extruder DI Water Bath Tube Bunch Cutting Machine Shape Checking Quality Control Polyurethane End Cap Dipper Tube Bunch Cutting Machine Final Assembly Housing Injection Molder Vibration Welder Total per Line
$200000 $50000
$100000 $200000 $100000 $100000 $10000
$600000 $700000
$2060000 Figure 125 Capital cost breakdown for a typical membrane humidifier manufacturing process
Production Speed The production speed of the process train depicted in Figure 124 is limited by the slowest manufacturing step which is the Nafion extrusion machine For lower annual production quantities a single extrusion machines75 is shared between hydration beds in order to increase machine utilization and lower capital cost The extrusion machine creates Nafion tubing which is then coiled on spools The spools are then used to feed the hydration beds
Labor It is assumed that three laborers are needed per line to oversee the process and take care of the quality control checking
The machine rate and process parameters are shown in Figure 126 and Figure 127 Figure 128 shows the cost breakdown for the membrane air humidifier
Annual Production Rate 1000 30000 80000 130000 500000 Capital Cost ($line) Simultaneous Lines Laborers per Line
Line Utilization Effective Total Machine Rate ($hr)
Production Rate (humidifiersminline)
$844654 1 3
709 $154492
787
$1995126 2
300 5314 $58828 787
$2501614 2
300 7086 $56658 787
$3008103 2
300 7676 $61676 787
$4021081 4
300 8857 $69887 787
2010
Capital Cost ($line) Simultaneous Lines Laborers per Line
Line Utilization Effective Total Machine Rate ($hr)
Production Rate (humidifiersminline)
$844654 1 3
668 $162918
787
$1995126 2
300 5007 $61375 787
$2501614 2
300 6676 $58964 787
$3008103 2
300 7233 $64750 787
$4021081 4
300 8345 $73500 787
2015
Figure 126 Membrane humidifier production process parameters
75 The extrusion machine creates Nafion tubing which is then coiled on spools The spools are then used to feed the hydration beds
Directed Technologies Inc 91
Annual Production Rate 1000 30000 80000 130000 500000 Equipment Lifetime
Interest Rate Corporate Income Tax Rate
Capital Recovery Factor Equipment Installation Factor
MaintenanceSpare Parts ( of CC) Miscellaneous Expenses ( of CC)
Power Consumption (kW)
15 10 40 0175 14 13 2 155
15 10 40 0175 14 13 2 185
15 10 40 0175 14 13 2 245
15 10 40 0175 14 13 2 305
15 10 40 0175 14 13 2 425
5
201
2010 ‐
Figure 127 Machine rate parameters for membrane humidifier production process
Annual Production Rate 1000 30000 80000 130000 500000 Material ($system) $111926 $34491 $20504 $15781 $7761
Manufacturing ($system) $36781 $7003 $3372 $2447 $1664 Markup ($system) $000 $000 $000 $000 $000
Total Cost ($system) $148707 $41494 $23876 $18228 $9425 Total Cost ($kWnet) $1859 $519 $298 $228 $118
Material ($system) $69412 $26644 $16271 $12628 $6326 Manufacturing ($system) $36547 $6884 $3307 $2421 $1649
Markup ($system) $000 $000 $000 $000 $000 Total Cost ($system) $105958 $33528 $19578 $15049 $7975 Total Cost ($kWnet) $1324 $419 $245 $188 $100
2015
2010
Figure 128 Cost breakdown for membrane air humidifier
The Fuel Cell Technical Team (FCTT) has recently suggested the exploration of non‐Nafionreg membrane materials as well as alternatives to the tube configuration so this will be investigated as part of the 2011 analysis
453 Coolant Loops The 2010 technology system has two coolant loops a high‐temperature loop to cool the fuel cell stacks and a
low‐temperature loop to condense the water vapor in the escaping exhaust For the 2015 technology system the low‐temperature loop is not included Due to inefficiencies the system loses about 75 kW of energy by heat that needs to be dissipated in the high‐temperature loop With coolant liquid T of 10degC a fluid flow of 60 gallons per hour is required
4531 High‐Temperature Coolant Loop Coolant Reservoir The cost is based on a molded plastic water tank
Coolant Pump Small pumps to provide this flow are commercially available in large quantities at approximately $60 per pump at quantities of 1000 dropping to $50 at high quantity
Coolant DI Filter The cost is based on a resin deionizer bed in a plastic housing
Thermostat amp Valve The cost is based on standard automotive components
Radiator The heat dissipation requirements of the fuel cell system are similar to those of todayrsquos standard passenger cars Consequently costs for the high and low‐temperature loop radiators are aligned with those of appropriately sized radiators used in contemporary automotive applications
Radiator Fan The cost was based on a standard automotive radiator fan and sized based on the cooling load
Directed Technologies Inc 92
Coolant Piping Assumed 2rdquo diameter rubber pipe from McMaster Carr at $693ft
Annual Production Rate 1000 30000 80000 130000 500000 Coolant Reservoir ($system) $1313 $1050 $788 $735 $630
Coolant Pump ($system) $9454 $8403 $7563 $7248 $6951 Coolant DI Filter ($system) $7878 $6303 $4727 $4412 $3782
Thermostat amp Valve ($system) $1050 $840 $630 $588 $504 Radiator ($system) $21357 $19221 $18153 $17086 $16018
Radiator Fan ($system) $8610 $6584 $5065 $4862 $4558 Coolant Piping ($system) $6765 $5412 $4059 $3789 $3247
Total Cost ($system) $56428 $47815 $40986 $38720 $35691
Total Cost ($kWnet) $705 $598 $512 $484 $446 Coolant Reservoir ($system) $1313 $1050 $788 $735 $630
Coolant Pump ($system) $9454 $8403 $7563 $7248 $6951 Coolant DI Filter ($system) $7878 $6303 $4727 $4412 $3782
Thermostat amp Valve ($system) $1050 $840 $630 $588 $504 Radiator ($system) $22461 $20215 $19092 $17969 $16846
Radiator Fan ($system) $8610 $6584 $5065 $4862 $4558 Coolant Piping ($system) $7485 $5988 $4491 $4192 $3593
Total Cost ($system) $58252 $49384 $42356 $40006 $36865
Total Cost ($kWnet) $728 $617 $529 $500 $461
2010
2015
Figure 129 Cost breakdown for high‐temperature coolant loop
4532 Low‐Temperature Coolant Loop As of the 2008 Update report it was determined that some of the duties that the exhaust loop performs in the
vehicle are not covered by the scope of this analysis Because of this only 67 of the exhaust loop cost is now included in the analysis the fraction proportionate to the loops usage by the fuel cell system Because the exhaust loop is not necessary in the 2010 and 2015 technology systems this change only affects the 2008 system
Coolant Reservoir The cost is based on a molded plastic water tank
Coolant Pump The low and high‐temperature loops require similar flow rates so the same type of pump can be used in each
Thermostat amp Valve The cost is based on standard automotive components
Radiator As with the radiator for the high‐temperature coolant loop the exhaust loop uses a radiator similar to those used in conventional automotive applications It does not need to be as large as the one for the coolant loop however so it is scaled down in cost
Radiator Fan It is assumed that the radiators for the high and low‐temperature loops are installed together such that the air flow exiting the low‐temperature radiator immediately enters the high‐temperature radiator and as such there is a single fan for both radiators which is accounted for in the high‐temperature coolant loop
Coolant Piping Assumed 2rdquo diameter rubber pipe from McMaster Carr at $693ft
Directed Technologies Inc 93
Annual Production Rate 1000 30000 80000 130000 500000 Coolant Reservoir ($system) $410 $328 $246 $230 $197
Coolant Pump ($system) $4354 $3870 $3483 $3338 $3201 Thermostat amp Valve ($system) $626 $501 $376 $351 $301
Radiator ($system) $15641 $14077 $13295 $12513 $11731 Radiator Fan ($system) $000 $000 $000 $000 $000
Coolant Piping ($system) $5400 $4320 $3240 $3024 $2592 Total Cost ($system) $10375 $9066 $8101 $7636 $7074
Total Cost ($kWnet) $130 $113 $101 $095 $088 Coolant Reservoir ($system) $000 $000 $000 $000 $000
Coolant Pump ($system) $000 $000 $000 $000 $000 Thermostat amp Valve ($system) $000 $000 $000 $000 $000
Radiator ($system) $000 $000 $000 $000 $000 Radiator Fan ($system) $000 $000 $000 $000 $000
Coolant Piping ($system) $000 $000 $000 $000 $000 Total Cost ($system) $000 $000 $000 $000 $000
Total Cost ($kWnet) $000 $000 $000 $000 $000
2010
2015
Figure 130 Cost breakdown for low‐temperature coolant loop
454 Fuel Loop Per DOE system analysis guidelines the hydrogen tank the hydrogen pressure‐relief device amp regulator and
the hydrogen fueling receptacle are not included in the fuel cell power system cost analysis Based on industry input the proportional valve and pressure transducer were removed for the 2010 Update Check valves and an over‐pressure cut‐off valve were also added These changes rely on the hydrogen storage system (not included in cost analysis) to handle some of the pressure regulation duties
Inline Filter for Gas Purity Excursions This filter ensures that any contaminants that may have gotten into the fuel lines do not damage the stack
Flow Diverter Valve The flow diverter valve routes hydrogen to either the low‐flow or the high‐flow ejector depending on the pressure
Over‐Pressure Cut‐Off (OPCO) Valve The over‐pressure cut‐off valve was added as a safety precaution after the proportional valve was removed
Low‐Flow and High‐Flow Ejectors For the 2010 system dual static ejectors are employed to re‐circulate hydrogen from the anode exhaust to the anode inlet to achieve target flow rates and hence high stack performance The ejectors operate on the Bernoulli Principle wherein high‐pressure hydrogen gas from the fuel tank (gt250 psi) flows through a converging‐diverging nozzle to entrain lower‐pressure anode exhaust gas Two ejectors (high‐flow and low‐flow) are operated in parallel to achieve a wide turn‐down range The design of the ejectors is based on concepts from Graham Manufacturing and the patent literature (US Patent 5441821) The fabrication of each ejector consists of stainless steel investment casting of a two‐part assembly followed by machining welding and polishing DTI is also investigating ejectors with variable geometry for future systems and as indicated by ANL modeling whether a hydrogen recirculation blower is needed during very low part‐power system operation
Check Valves The check valves ensure that no hydrogen may flow backwards from the ejectors
Purge Valve The purge valve allows for periodic purging of the hydrogen in the fuel loop
Hydrogen Piping The piping through which the hydrogen flows It is modeled as frac34rdquo SS304 schedule 10 pipe $2061m from McMaster Carr
Directed Technologies Inc 94
Annual Production Rate 1000 30000 80000 130000 500000 Inline Filter for GPE ($system) $1820 $1820 $1820 $1820 $1820 Flow Diverter Valve ($system) $1519 $1519 $1519 $1519 $1519
Pressure Switch ($system) $2500 $2000 $1500 $1400 $1200 Low‐Flow Ejector ($system) $5089 $3552 $3270 $3136 $3064 High‐Flow Ejector ($system) $4371 $2859 $2603 $2485 $2424
Check Valves ($system) $1000 $1000 $1000 $1000 $1000 Purge Valve ($system) $2500 $2000 $1500 $1400 $1200
Hydrogen Piping ($system) $6394 $5115 $3836 $3580 $3069 Total Cost ($system) $25194 $19865 $17049 $16340 $15296
Total Cost ($kWnet) $315 $248 $213 $204 $191 Inline Filter for GPE ($system) $000 $000 $000 $000 $000 Flow Diverter Valve ($system) $1519 $1519 $1519 $1519 $1519
Pressure Switch ($system) $2500 $2000 $1500 $1400 $1200 Low‐Flow Ejector ($system) $5089 $3552 $3270 $3136 $3064 High‐Flow Ejector ($system) $4371 $2859 $2603 $2485 $2424
Check Valves ($system) $1000 $1000 $1000 $1000 $1000 Purge Valve ($system) $2500 $2000 $1500 $1400 $1200
Hydrogen Piping ($system) $6394 $5115 $3836 $3580 $3069 Total Cost ($system) $23374 $18046 $15229 $14520 $13476
Total Cost ($kWnet) $292 $226 $190 $182 $168
2015
2010
Figure 131 Cost breakdown for fuel loop
455 System Controller Conventional electronic engine controllers (EECrsquos) are assumed to control the fuel cell power system These
programmable circuit boards are currently mass‐produced for all conventional gasoline engines and are readily adaptable for fuel cell use Prototype fuel cell vehicles may use four or more controllers out of convenience so that each subsystem is able to have a separate controller However even at 1000 vehicles per year the system will be refined enough to minimize controller use on the rationale of simplicity of cost and design A single EEC is judged necessary to supply adequate control and sensor leads to the power plant
For the 2010 Update a new bottom‐up analysis of the system controller was conducted The controller was broken down into 17 input and output circuits as listed in Figure 132
Directed Technologies Inc 95
Name Signal
Inputs
Air Mass Flow Sensor Analog H2 Pressure Sensor (upstream of ejector) Analog
H2 Pressure Sensor (stack inlet manifold) Analog
Air Pressure Sensor (after compressor) Analog
Stack Voltage (DC bus) Analog
Throttle Request Analog
Current Sensors (drawn from motor) Analog
Current Sensors (output from stack) Analog
Signal for Coolant Temperature Analog H2 Leak Detector Digital
Outputs
Signal to TIM Analog
Signal to CEM Analog
Signal to Ejector 1 PWM
Signal to Ejector 2 PWM
High Voltage System Relay Digital
Signal to Coolant Pump PWM Signal to H2 Purge Valve Digital
Total Analog
Total Digital
Total PWM
11 3 3
Total InputsOutputs 17 Figure 132 System controller input amp output requirements
For each input or output circuit it was estimated that approximately 50 cents in electronic components (referencing catalog prices) would be needed The costs of input and output connectors an embedded controller and the housing were also estimated by catalog pricing A quote was used for the assumed dual‐layer 65rdquo x 45rdquocircuit board Assembly of 50 parts was based on robotic pick‐and‐place methods This new controller analysis is currently undergoing industry vetting to validate assumptions during which time a 10 cost contingency is added to cover any unforeseen cost increases
Figure 133 and Figure 134 list the estimated system controller costs
Directed Technologies Inc 96
Component Description Cost at 500k systemsyear
Cost Basis
Main Circuit Board 2 layer punchboard $801 $534 for single layer of 65x45 punchboard Q=500 Assume 25 discount for Q=500k
Input Connector Wire connector for inputs $018 $023 each in Q=10k reduced ~20 for Q=500k Output Connector Wire connector for outputs $020 $023 each in Q=10k reduced ~20 for Q=500k
Embedded Controller 25 MHz 25 channel microprocessor board
$3250 Digi‐Key Part No 336‐1489‐ND $50Q=1 assumed 35 reduction for Q=500k
MOSFETs (17 total 1 each per IO)
P‐channel 2W 49MOhm 5A 10V
$374 Digi‐Key Part No 785‐1047‐2‐ND $02352Q=3k$02184Q=12k
Misc Board Elements
Capacitor resistors etc $425 Estimate based on $025 component for each inputoutput
Housing Shielded plastic housing watertight
$500 Estimate based on comparable shielded electronic enclosures Includes fasteners
Assembly Assembly of boardshousing $583 Robotic assembly of approx 50 parts at 35 sec each $2min assembly cost
Contingency 10 of all components $597 Standard DFMA additional cost to capture un‐enumerated elementsactivities
Markup 25 of all Components $1642 Manufacturers Markup
Total $8211 Figure 133 System controller component costs
2010
2015
Annual Production Rate 1000 30000 80000 130000 500000 Controller ($) $17107 $13685 $10264 $9580 $8211
Total Cost ($system) $17107 $13685 $10264 $9580 $8211 Total Cost ($kWnet) $214 $171 $128 $120 $103
Controller ($) $17107 $13685 $10264 $9580 $8211 Total Cost ($system) $17107 $13685 $10264 $9580 $8211 Total Cost ($kWnet) $214 $171 $128 $120 $103
Figure 134 Cost breakdown for system controller
456 Sensors Aside from the air mass flow sensor (which is book‐kept as part of the air loop) there are three types of
sensors in the fuel cell system current sensors voltage sensors and hydrogen sensors The basic sensor descriptions and their costs are listed in Figure 135 and Figure 136
Component Description Cost at 500k systemsyear
Cost Basis
Current Sensor (for stack current)
~400A Hall Effect transducer $1000 Based on LEM Automotive Current Transducer HAH1BV S06 400 A
Current Sensor (for motor current)
~400A Hall Effect transducer $1000 Based on LEM Automotive Current Transducer HAH1BV S06 400 A Rough estimate based on a small Hall Effect
Voltage Sensor 225‐335V $800 sensor in series with a resistor Dual‐sensor unit for large
H2 Sensor and small H2 concentrations $9874 Makel Engineering price quote
Dual‐sensor unit for large H2 Sensor and small H2 concentrations $9874 Makel Engineering price quote
Total $2800 Figure 135 Sensor details
Directed Technologies Inc 97
Annual Production Rate 1000 30000 80000 130000 500000 Current Sensors ($system) $2000 $2000 $2000 $2000 $2000 Voltage Sensors ($system) $800 $800 $800 $800 $800
Hydrogen Sensors ($system) $167865 $86500 $63196 $51545 $19749 Total Cost ($system) $170665 $89300 $65996 $54345 $22549
Total Cost ($kWnet) $2133 $1116 $825 $679 $282 Current Sensors ($system) $2000 $2000 $2000 $2000 $2000 Voltage Sensors ($system) $800 $800 $800 $800 $800
Hydrogen Sensors ($system) $000 $000 $000 $000 $000 Total Cost ($system) $2800 $2800 $2800 $2800 $2800
Total Cost ($kWnet) $035 $035 $035 $035 $035
2015
2010
Figure 136 Cost breakdown for sensors
4561 Current Sensors The current sensors are located on the stack and allow the system controller to monitor the current being
produced
4562 Voltage Sensors The voltage sensors are located on the stack and allow the system controller to monitor the voltage being
produced
4563 Hydrogen Sensors The vehicle will require a hydrogen sensing system to guard against hydrogen leakage accumulation and fire
It was postulated that a declining number of hydrogen sensors will be used within the fuel cell power system as a function of time and as real‐world safety data is accumulated Consequently it is estimated that two sensors would initially be used in the engine compartment dropping to zero in 2015 Additional sensors may be necessary for the passenger compartment and the fuel storage subsystem but these are not in the defined boundary of our fuel cell power system assessment
The hydrogen sensor system specified is from Makel Engineering based on the technology used in Fordrsquos Model‐U Hydrogen Powered Vehicle prototype Each sensor unit (see Figure 137) is roughly the size of a quarter and contains two sensors one for detecting large concentrations of hydrogen and another for small concentrations Each unit is accompanied by a control electronics box (also pictured in Figure 137)
Directed Technologies Inc 98
Figure 137 Hydrogen sensors amp associated control electronics
Hydrogen sensors are currently quite expensive The specified hydrogen sensors from Makel are currently hand built and cost approximately $850 each Jeffrey Stroh from Makel estimates that such units would cost approximately $100 each if mass‐produced at 500000 per year With further technology and manufacturing improvements including a move to integrated circuitry he estimates that the unit cost could drop to only $20 per sensor by the year 2015 However since hydrogen sensors were not included in the 2015 system (which again does not include the passenger cabin or fuel storage) the cheapest sensor cost in the estimate is in the 2010 system Figure 138 lists the estimated hydrogen sensor costs
2015
2010
Annual Production Rate 1000 30000 80000 130000 500000 Sensors per System 2 2 2 2 2
Sensor ($) $83933 $43250 $31598 $25772 $9874 Total Cost ($system) $167865 $86500 $63196 $51545 $19749 Total Cost ($kWnet) $2098 $1081 $790 $644 $247
Sensors per System 2 2 2 2 2 Sensor ($) $49372 $23501 $15898 $12244 $1975
Total Cost ($system) $98744 $47002 $31796 $24489 $3950 Total Cost ($kWnet) $1234 $588 $397 $306 $049
Figure 138 Cost breakdown for hydrogen sensors
457 Miscellaneous BOP The BOP components which did not fit into any of the other categories are listed here in the miscellaneous
section
Figure 139 shows the cost breakdown for these components
Directed Technologies Inc 99
Annual Production Rate 1000 30000 80000 130000 500000 Belly Pan ($system) $6051 $661 $552 $495 $424
Mounting Frames ($system) $10000 $4300 $3300 $3000 $3000 Wiring ($system) $10490 $9021 $8811 $8706 $8392
Fasteners for Wiring amp Piping ($system) $6630 $5430 $4481 $4279 $3854 Voltage Sensors ($system) $800 $800 $800 $800 $800 Current Sensors ($system) $2000 $2000 $2000 $2000 $2000
Total Cost ($system) $33171 $19412 $17144 $16480 $15669
Total Cost ($kWnet) $415 $243 $214 $206 $196 Belly Pan ($system) $6051 $661 $552 $495 $424
Mounting Frames ($system) $10000 $4300 $3300 $3000 $3000 Wiring ($system) $8626 $7419 $7246 $7160 $6901
Fasteners for Wiring amp Piping ($system) $5365 $4395 $3633 $3470 $3127 Voltage Sensors ($system) $800 $800 $800 $800 $800 Current Sensors ($system) $2000 $2000 $2000 $2000 $2000
Total Cost ($system) $30042 $16775 $14731 $14125 $13452
Total Cost ($kWnet) $376 $210 $184 $177 $168
2015
2010
Figure 139 Cost breakdown for miscellaneous BOP components
4571 Belly Pan The belly pan is modeled as a 1 x 15 m shallow rectangular pan bolted to the underside of the fuel cell system
to protect it from weather and other ambient conditions
The belly pan manufacturing process is modeled as a vacuum thermoforming process in which thin polypropylene sheets are softened with heat and sucked down on top of a one‐sided mold The capital cost of the vacuum thermoforming machine is approximately $300000 and utilizes an optional automatic loading system which costs another $200000 If manual loading is selected the process requires one laborer per line instead of the 14 laborer facilitated by the automatic loading system The analysis shows that the automatic system is only cost effective at the 500000 systems per year production rate Naturally the loading option also changes the time per part the vacuum time is 8 seconds per part on top of which the insertion time adds another 112 seconds for the manual loading or 2 seconds for the automatic method The process parameters are shown in Figure 140 and the machine rate parameters are shown in Figure 141
Directed Technologies Inc 100
Annual Production Rate 1000 30000 80000 130000 500000
Machine Selection
Assembly Type Capital Cost ($Line)
Costs per Tooling Set ($) Tooling Lifetime (years)
Cavities per Platen Total Cycle Time (s) Simultaneous Lines Laborers per Line
Line Utilization Effective Total Machine Rate ($hr)
Material Cost ($kg)
Vacuum Thermo‐
former 1 Manual $50000 $91260
3 1
7120 1 1
059 $113558
$129
Vacuum Thermo‐
former 1 Manual $50000 $91260
3 1
7120 1 1
1766 $8302 $129
Vacuum Thermo‐
former 2 Manual $250000 $91260
3 1
1520 1 1
1005 $30952 $129
Vacuum Thermo‐
former 2 Manual $250000 $91260
3 1
1520 1 1
1634 $20859 $129
Vacuum Thermo‐
former 2 Auto
$447489 $91260
3 1
700 1
025 2894 $17735 $129
2010
Machine Selection
Assembly Type Capital Cost ($Line)
Costs per Tooling Set ($) Tooling Lifetime (years)
Cavities per Platen Total Cycle Time (s) Simultaneous Lines Laborers per Line
Line Utilization Effective Total Machine Rate ($hr)
Material Cost ($kg)
Vacuum Thermo‐
former 1 Manual $50000 $91260
3 1
7120 1 1
059 $113558
$129
Vacuum Thermo‐
former 1 Manual $50000 $91260
3 1
7120 1 1
1766 $8302 $129
Vacuum Thermo‐
former 2 Manual $250000 $91260
3 1
1520 1 1
1005 $30952 $129
Vacuum Thermo‐
former 2 Manual $250000 $91260
3 1
1520 1 1
1634 $20859 $129
Vacuum Thermo‐
former 2 Auto
$447489 $91260
3 1
700 1
025 2894 $17735 $129
2015
Figure 140 Belly pan thermoforming process parameters
Annual Production Rate 1000 30000 80000 130000 500000 Equipment Lifetime
Interest Rate Corporate Income Tax Rate
Capital Recovery Factor Equipment Installation Factor
MaintenanceSpare Parts ( of CC) Miscellaneous Expenses ( of CC)
Power Consumption (kW)
8 10 40 0229 14 5 6 30
8 10 40 0229 14 5 6 30
15 10 40 0175 14 5 6 35
15 10 40 0175 14 5 6 35
15 10 40 0175 14 5 6 40
5
201
2010 ‐
Figure 141 Machine rate parameters for belly pan thermoforming process
Because of the extremely soft nature of the hot polypropylene and the low impact of the process each mold ($85056) will easily last the entire lifetime of the machine However designs are likely to change well before the machine wears out so the moldrsquos lifetime was set at three years This means that the tooling costs are sufficiently low to ignore at all but the 1000 systems per year level where they account for almost 4 of the part cost Figure 142 shows the cost breakdown
Directed Technologies Inc 101
Annual Production Rate 1000 30000 80000 130000 500000 Materials ($system) $383 $383 $383 $383 $383
Manufacturing ($system) $2246 $164 $131 $088 $034 Tooling ($system) $3422 $114 $038 $023 $006
Total Cost ($system) $6051 $661 $552 $495 $424 Total Cost ($kWnet) $076 $008 $007 $006 $005
Materials ($system) $383 $383 $383 $383 $383 Manufacturing ($system) $2246 $164 $131 $088 $034
Tooling ($system) $3422 $114 $038 $023 $006 Total Cost ($system) $6051 $661 $552 $495 $424 Total Cost ($kWnet) $076 $008 $007 $006 $005
2015
2010
Figure 142 Cost breakdown for belly pan
4572 Mounting Frames It was assumed that the fuel cell power system would be built as a subsystem then hoisted as an assembly
into the automotive engine compartment Consequently the power system attaches to a mounting frame substructure to allow easy transport These mounting frames were assumed to be contoured steel beams with various attachment points for power system components facilitating attachment to the vehicle chassis The cost is roughly estimated at $30 at 500000year to $100 at 1000year
4573 Wiring Prior to the 2008 analysis the wiring costs were estimated via a rough approximation of the total wiring length
required Because the wiring costs were the largest contributor to the Miscellaneous BOP category they have since been investigated more closely and a detailed component specification and cost estimation were conducted As in the previous analyses these costs include only the materials because the wiring installation costs are covered under the system assembly calculations
A conceptual fuel cell system wiring schematic (Figure 143) was created to determine where cables were needed and whether they were for transmission of data power or both Cable types were selected based on the maximum current required by each electrical component
Directed Technologies Inc 102
Fuel Cell Stack
High Voltage Bus Traction Motor(s) CEM
Controller CEM
Low Voltage Bus SLI Battery
Bi‐directional DC‐DC converter
System Controller
Traction Inv Module
Air M
ass Flow
Sensor
Hydrog
en Se
nsor
Therm
ostat a
nd Valve
Pneumatic C
ontrol Va
lve
Voltage Sensor
Current Sensor
H 2 Pu
rge Va
lve
Therm
ostat and Va
lve
Radiator Fan
Radio H
eadligh
ts ETC
Power Cable Data Cable
Fuse Box Coolan
t Pump
High Voltage Hybridization Battery
Included in Cost Analysis
Not Included in Cost Analysis
Key
Low‐Voltage High‐Voltage
Figure 143 Fuel cell system wiring schematic
For both of the technology levels this worked out to be five different types of cables in each system See Figure 144 for details
2010 2015 Quantity Length (m) Quantity Length (m)
Cable Types Power Cable OOOO Gauge Power Cable 6 Gauge Power Cable 7 Gauge Power Cable 12 Gauge Data Cable 16 Gauge
2 1 4 3 10
05 025 35 3 9
2 1 3 2 7
05 025 25 2 6
Totals 20 1625 15 1125 Figure 144 Wiring details
With the exception of the heavy‐duty power cables attached to the current collectors every cable was comprised of multiple wires Each cable also required a unique type of connector of which two are needed for each cable
It is assumed that the wires and connectors would be purchased rather than manufactured in‐house and high‐volume pricing estimates were obtained for the cable components from Waytek Inc Taking into account the required length of each cable the number of wires per cable and selecting the appropriate connectors the
Directed Technologies Inc 103
component prices are applied to the wiring bill of materials and the total wiring cost is calculated for each system (see Figure 145)
Annual Production Rate 1000 30000 80000 130000 500000 Cables ($system) $3484 $2996 $2926 $2891 $2787
Connectors ($system) $7006 $6025 $5885 $5815 $5605 Total Cost ($system) $10490 $9021 $8811 $8706 $8392 Total Cost ($kWnet) $131 $113 $110 $109 $105
Cables ($system) $2780 $2391 $2335 $2308 $2224 Connectors ($system) $5846 $5028 $4911 $4852 $4677 Total Cost ($system) $8626 $7419 $7246 $7160 $6901 Total Cost ($kWnet) $108 $093 $091 $089 $086
2010
2015
Figure 145 Cost breakdown for wiring
4574 Fasteners for Wiring amp Piping A detailed DFMA analysis was not conducted for these components since the level of detailed required is well
outside the bounds of this project However these components are necessary and in aggregate are of substantial cost Consequently it was assumed that the cost and mass of the fasteners were equal to 20 of the wiring and piping The volumes were book‐kept as zero because the additional space they fill was deemed negligible
46 System Assembly A detailed analysis of system assembly was not conducted since that would require detailed specification of all
assembly steps including identification of all screws clips brackets and a definition of specific component placement within the system Such an analysis is clearly beyond the scope of this project Instead an estimate of system assembly time is obtained by breaking the system down into five categories of assembly components (major minor piping hoses wiring) estimating the number of components within each category and then postulating a time to assemble each of those components Specific assumptions and total estimated assembly time for manual assembly is shown in Figure 146
Directed Technologies Inc 104
Component Component Number of Component
Placement Time Fixation Time Components Totals (minutes)
(seconds) (seconds) Major Components (Stack motors pumps vessels etc) 19 45 60 333 Minor Components (instruments devices etc) 22 30 45 275 Piping
of pipe segments 5 bends per segment 2
time per bend 0 pipe placement time 30
welds per pipe 2
weld time 90
threaded ends per pipe 0 threading time 0
175 Hoses 21 30 105 473 Wiring (manual) 23 418 667 416 System Basic Functionality Test 100
Total System Assembly Time 1771
Figure 146 Single‐station system assembly assumptions
Two types of system assembly methods are examined single‐station and assembly line In single‐station assembly approach a single workstation is used to conduct assembly of the entire fuel cell power plant Very little custom machinery is needed to assemble the system and and the components and subsystems are arrayed around the workstation for easy access For 1000 systems per year only one such workstation is required
Annual Production Rate 1000 30000 80000 130000 500000
Assembly Method Single Station Assembly
Line Assembly
Line Assembly
Line Assembly
Line Index Time (min) 1771 142 142 142 142
Capital Cost ($Line) $50000 $150000 $150000 $150000 $150000 Simultaneous Lines 1 3 6 10 36 Laborers per Line 100 1000 1000 1000 1000
Line Utilization 8784 7027 9370 9136 9760 Effective Total Machine Rate ($hr) $5325 $47789 $46970 $47033 $46871
Cost per Stack ($) $15717 $11284 $11091 $11105 $11067
Assembly Method Single Station Assembly
Line Assembly
Line Assembly
Line Assembly
Line Index Time (min) 1471 118 118 118 118
Capital Cost ($Line) $50000 $150000 $150000 $150000 $150000 Simultaneous Lines 1 3 6 10 36 Laborers per Line 100 1000 1000 1000 1000
Line Utilization 8784 7027 9370 9136 9760 Effective Total Machine Rate ($hr) $5325 $47789 $46970 $47033 $46871
Cost per Stack ($) $13055 $9372 $9212 $9224 $9192
2010
2015
Figure 147 System assembly process parameters
The assembly for all other annual production rates uses a ten‐workstation assembly line configuration Each fuel cell system flows through the assembly line sequentially The line reduces the total cumulative time required
Directed Technologies Inc 105
for system assembly because workers at each workstation on the line have their tools and components closer at hand than they do under the single workstation approach and because tool changes are minimized due to the higher repetitive nature of an assembly line This method is approximately 20 faster than the single‐workstation approach with an assembly line index time76 of only 142 minutes The system assembly cost is detailed in Figure 148
Annual PSystem Assembly amp
Tot
T
System Assembly amp Tot
1000 $15717 $15717
$196 $13055 $13055
roduction Rate Testing ($system) al Cost ($system)
otal Cost ($kWnet) Testing ($system) al Cost ($system)
30000 $11284 $11284
$141 $9372 $9372
80000 $11091 $11091
$139 $9212 $9212
130000 $11105 $11105
$139 $9224 $9224
500000 $11067 $11067
$138 $9192 $9192
2015
2010
Total Cost ($kWnet) $163 $117 $115 $115 $115
Figure 148 Cost breakdown for system assembly amp testing
47 System Testing A ten‐minute system functionality and performance test is included in the system assembly process The stack
has separately undergone multiple hours of testing as part of stack conditioning and thus there is high confidence in the stack performance System testing is only needed to ensure that the peripheral systems are functioning properly and adequately supporting the stack Typically the only testing of gasoline engines contained within automobiles is a simple engine startup as the vehicles are driven off the assembly line Corresponding the fuel cell ldquoenginesrdquo are only minimally tested for functionality Cost for this system testing is reported under system assembly
48 Cost Contingency It is common practice in the automotive industry77 to include a 10 cost contingency to cover the cost of
procedures or materials not already explicitly covered in the analysis which serves as a guard against an underestimation of cost However no such contingency has been included in this cost analysis It was omitted upon the request of the DOE in order to present purer baseline cost estimates
76 Assembly line index time is defined as the time interval each system spends at a given workstation 77 Based on personal communication with Bob Mooradian Ford Motor Company
Directed Technologies Inc 106
5 Sensitivity Analysis In addition to the baseline cost calculations a Monte Carlo analysis and a single‐variable sensitivity analysis
were conducted Triangular probability distribution functions were applied to each of the parameters analyzed with the likeliest values (the baseline assumptions) at the peaks of the triangles Figure 149 and Figure 150 show the parameters used in the Monte Carlo analysis
2010 Technology 50000 Systemsyear Parameter Units Minimum Cost Likeliest Cost Maximum Cost
Power Density mWcm2
700 833 1000
Pt Loading mgPtcm2
01 015 02
Membrane Cost $m2
$250 $2073 $2488
GDL Cost $m2
$300 $1115 $1338
Bipolar Plate Cost Factor 075 100 125
Bipolar Plate Coating Cost Factor 0 1 2
Operating Pressure atm 15 169 2
Operating Temperature degC 80 90 95
Air Stoichiometry 15 250 275
Membrane Humidifier Cost $system $7500 $9425 $12500
Compressor Efficiency 500 638 690
Air Compressor Cost $system $51616 $64520 $77424
Balance of Air Compressor Cost $system $8343 $12515 $18773
Hydrogen Recirculation System Cost $system $10197 $15296 $22944
Figure 149 Monte Carlo parameters for 2010 technology 500k sysyr
2015 Technology 50000 Systemsyear Parameter Units Minimum Cost Likeliest Cost Maximum Cost
Power Density mWcm2
833 1000 1200
Pt Loading mgPtcm2
01 015 02
Membrane Cost $m2
$250 $2229 $3000
GDL Cost $m2
$300 $1097 $3000
Bipolar Plate Cost Factor 075 100 125
Bipolar Plate Coating Cost Factor 000 100 200
Operating Pressure atm 15 169 2
Operating Temperature degC 90 99 120
Air Stoichiometry 125 200 2
Membrane Humidifier Cost $system $000 $000 $10000
Compressor Efficiency 650 680 730
Air Compressor Cost $system $40355 $50444 $60533
Balance of Air Compressor Cost $system $6685 $10028 $15042
Hydrogen Recirculation System Cost $system $8984 $13476 $20214
Figure 150 Monte Carlo parameters for 2015 technology 500k sysyr
51 Monte Carlo Parameters
The parameters chosen for the 2010 analysis are different than those used in the 2009 analysis reflecting changes in the depth and complexity of the model Each parameter is explained in detail below
Directed Technologies Inc 107
Power Density (mWcm2) ndash The power density per cm2 of active area
Platinum Loading (mgcm2) ndashTotal Pt‐group metal loading per cm2 of active area for both anode and cathode combined
Membrane Cost ($m2) ndash Cost of the membrane (m2 on the roll not the active area)
GDL Cost ($m2) ndash Cost of the macroporous GDL material (m2 on the roll not the active area)
Bipolar Plate Cost Factor ndash A factor multiplied by the manufacturing costs (manufacturing and tooling costs but not materials costs) of the bipolar plate production Since the material costs are dependent on the area of the cell (which varies with power density pressure compressor size and power draw) it would be inappropriate to use plate cost as a Monte Carlo parameter as it would not be reflective of the other parameters related to plate sizing
Bipolar Plate Coating Cost Factor ndash This multiplier applies to the total cost of coating the Bipolar Plate Thus it applies to the total materials manufacturing and tooling associated with the plate coating (but not the bipolar plate itself)
Operating Pressure (atm) ndash Pressure at which the fuel cell stack operates
Operating Temperature (degC) ndash Average stack operating temperature
Air Stoichiometry ndash The total amount of oxygen (in air) entering the fuel cell divided by the oxygen consumed by the fuel cell reaction
Membrane Humidifier Cost ($) ndash Cost of the membrane humidifier
Compressor Efficiency () ndashThe isentropic efficiency of the air compressor including the impact of the controller efficiency
Air Compressor Cost ($) ndash Includes the cost of the air compressor expander and compressor motor controller
Balance of Air Compressor Cost ($) ndash Includes air filter air filter housing and the air mass flow sensor
Hydrogen Recirculation System Cost ($) ndash Includes all components of the fuel system such as ejectors pressure switches check valves purge valves inline filters and all associated piping and ducting
52 Monte Carlo Results The analysis was conducted using the Monte Carlo simulation package Risk a plug‐in for Microsoft Excel
The simulation ran for 10000 iterations and yielded cost outputs for each technology level (in $kWnet) for both the stack and the system The stack results are shown in the next two figures (Figure 151 and Figure 152) and the system results are shown in the two figures after that (Figure 153 through Figure 154) The solid red area in each chart indicates the middle 90 probability range of cost estimates of the Monte Carlo runs ie it is 5 likely that costs will be below this range and 5 likely that costs will be above it This provides a high degree of confidence that the actual result will be within the indicated range and is a more meaningful means of conveying the system cost than a single‐value cost estimate
Directed Technologies Inc 108
Values in $
Stack Baseline 2015
Values in $
Stack Baseline 2030
2141 3047
Probability
016
014
012
010
50 900 50
2010 StackCost
Minimum $174229 008 Maximum $371104
Mean $256982 Std Dev $27792 Values 10000006
004
002
000
$kWnet
Figure 151 Monte Carlo results for fuel cell stack cost (2010 technology 500k sysyr)
1824 2600
Probability
018
016
014
012
50 900 50
2015 StackCost
010 Minimum $148443 Maximum $315879 Mean $219202008 Std Dev $23468 Values 10000
006
004
002
000
$kWnet
Figure 152 Monte Carlo results for fuel cell stack cost (2015 technology 500k sysyr)
Directed Technologies Inc 109
4740 5688
50 900 50
Probability
016
014
012
006
008
010 Baseline 2015
Minimum $432872 Maximum $634387 Mean $519653 Std Dev $29180 Values 10000
2010 System Cost
004
002
000
Values in $ $kWnet
Figure 153 Monte Carlo results for fuel cell system cost (2010 technology 500k sysyr)
3623 4425
50 900 50 018
016
014
012
Probability
006
008
010
Baseline 2030
Minimum $320312 Maximum $510463 Mean $400415 Std Dev $24396 Values 10000
2015 System Cost
004
002
000
Values in $ $kWnet
Figure 154 Monte Carlo results for fuel cell system cost (2015 technology 500k sysyr)
53 Single‐Variable Sensitivity The parameters for the single‐variable sensitivity are similar to the parameters in the Monte Carlo analysis
Thirty different cases were run for each variable These parameters are shown in Figure 155 and Figure 157 The analysis was conducted on the 500k systemsyear case Figure 156 and Figure 158 show the results of this analysis plotted on tornado charts
Directed Technologies Inc 110
System Cost ($kWnet) 2010 Technology 500000 systemsyear Input
Variable Downside Upside Range Downside Upside Base Case
Power Density (mWcm2) $5565 $4752 $813 700 1000 833
GDL Cost ($m2) $4916 $5650 $734 $300 $3000 $1115
Pt Loading (mgPtcm2) $4860 $5415 $556 010 020 015
Membrane Cost ($m2) $4884 $5267 $383 $250 $3000 $2073
Air Compressor Cost ($system) $4976 $5299 $323 $51616 $77424 $64520 Bipolar Plate Coating Cost Factor $5004 $5271 $267 000 200 100
Bipolar Plate Cost Factor $5037 $5238 $201 075 125 100
Hydrogen Recirculation System Cost ($system) $5074 $5233 $159 $10197 $22944 $15296
Air Stoichiometry $5029 $5163 $134 150 275 250 Balance of Air Compressor Cost ($system) $5085 $5216 $130 $8343 $18773 $12515 Expert Compressor Efficiency () $5212 $5120 $092 50 69 64 Operating Temperature (degC) $5202 $5114 $088 80 95 90 Operating Pressure (atm) $5112 $5181 $069 150 200 169 Membrane Humidifier Cost ($system) $5113 $5176 $063 $7500 $12500 $9425
Figure 155 Inputs amp cost results for tornado chart (2010 technology 500k sysyr)
700
$300
01
$250
$51616
0
075
$10197
15
$8343
50
95
15
$12500
1000
$3000
02
$3000
$77424
2
125
$22944
275
$18773
69
80
2
$7500
$4500 $5000 $5500 $6000
Power Density (mWcm2)
GDL Cost ($m2)
Pt Loading (mgPtcm2)
Membrane Cost ($m2)
Air Compressor Cost ($system)
Bipolar Plate Coating Cost Factor
Bipolar Plate Cost Factor
Hydrogen Recirculation System Cost ($system)
Air Stoichiometry
Balance of Air Compressor Cost ($system)
Expert Compressor Efficiency ()
Operating Temperature (degC)
Operating Pressure (atm)
Membrane Humidifier Cost ($system)
System Cost ($kWnet) 2010 Technology 500000 systemsyear
Downside
Upside
Figure 156 Tornado chart cost results for single‐variable sensitivity analysis (2010 technology 500k sysyr)
Directed Technologies Inc 111
System Cost ($kWnet) 2015 Technology 500000 systemsyear Input Variable Downside Upside Range Downside Upside Best Case
Power Density (mWcm2) $4350 $3646 $704 833 1200 1000
GDL Cost ($m2) $3783 $4390 $607 $300 $3000 $1097
Pt Loading (mgPtcm2) $3733 $4191 $458 010 020 015
Membrane Cost ($m2) $3735 $4051 $315 $250 $3000 $2229
Air Compressor Cost ($system) $3836 $4088 $252 $40355 $60533 $50444 Bipolar Plate Coating Cost Factor $3837 $4087 $250 000 200 100 Bipolar Plate Cost Factor $3874 $4050 $176 075 125 100 Hydrogen Recirculation System Cost ($system) $3906 $4046 $140 $8984 $20214 $13476 Membrane Humidifier Cost ($system) $3962 $4087 $125 $000 $10000 $000 Balance of Air Compressor Cost ($system) $3920 $4025 $104 $6685 $15042 $10028 Operating Temperature (degC) $4000 $3907 $093 90 120 9900 Air Stoichiometry $3914 $3962 $048 125 200 200 Operating Pressure (atm) $3962 $4069 $107 150 200 150 Expert Compressor Efficiency () $3968 $3953 $015 65 73 68
Figure 157 Inputs and cost results for tornado chart (2015 technology 500k sysyr)
833
$300
010
$250
$40355
0
075
$8984
$000
$6685
120
125
15
73
1200
$3000
020
$3000
$60533
2
125
$20214
$10000
$15042
90
20
20
65
$3500 $4000 $4500
Power Density (mWcm2)
GDL Cost ($m2)
Pt Loading (mgPtcm2)
Membrane Cost ($m2)
Air Compressor Cost ($system)
Bipolar Plate Coating Cost Factor
Bipolar Plate Cost Factor
Hydrogen Recirculation System Cost ($system)
Membrane Humidifier Cost ($system)
Balance of Air Compressor Cost ($system)
Operating Temperature (degC)
Air Stoichiometry
Operating Pressure (atm)
Expert Compressor Efficiency ()
System Cost ($kWnet) 2015 Technology 500000 systemsyear
Upside
Downside
Figure 158 Tornado chart of cost results for single‐variable sensitivity analysis (2015 technology 500k sysyr)
Directed Technologies Inc 112
The single‐variable sensitivity analysis highlights some important aspects not reflected in the Monte Carlo analysis
1 The four most important factors affecting cost for both the 2010 and 2015 systems relate to the stack power density GDL cost catalyst loading and membrane cost Despite the high cost of several balance of plant items (such as the CEM) the foreseeable benefit from improvements in BOP costs is minor compared to the huge benefit achievable from changes in stack parameters Future research should focus on these issues
2 Parameters related to the gaseous thermodynamic conditions (such as pressure temperature air stoichiometry and compressor efficiency) have a surprisingly minimal effect on system cost
54 Peak Power Operating Point Analysis suggests that operating at a lower peak‐power cell voltage (06 Vcell instead of 0676 Vcell) will yield
a large cost savings due to substantially increased power density However while this shift results in a physically smaller (and thus less‐expensive) fuel cell stack it has the disadvantages of a large radiator larger compressor and decreased overall fuel economy Consequently to partially quantify these effects the cost and performance model were run at 06 Vcell
Based on recent 3M polarization curves it is expected that power density increases 34 from this voltage shift (833 mWcm2 at 0676 Vcell to 1115 mWcm2 at 06Vcell) Such a change necessitates a 29 increase in radiator size due to increased waste heat dissipation and a 14 increase in CEM size due to increased air flow Additionally it leads to a reduction in peak‐power system efficiency and a slight change (~1ndash2 mpgge) in fuel economy when averaged over the entire drive cycle However the increased power density from this decrease in voltage gives a substantial reduction in stack size and a $433kWnet savings in overall system cost Figure 159 outlines the changes between the current system and the postulated lower‐voltage system
Stack Eff Rated Power
System Eff Rated Power
Current Density (mAcm2)
Cell Voltage (V)
Areal Power Density (mWcm2)
Stack Cost Impact ($kWnet)
Radiator Cost Impact ($kWnet)
CEM Cost Impact ($kWnet)
System Cost ($kWnet)
2010 Status Alternate 55 488
501 441
1233 1859
0676 0600
833 1115
‐‐ ($520)
‐‐ $057
‐‐ $010
$5138 $4705
($433)Cost Difference ($kWnet)
Figure 159 Results of shifted power operating point
Directed Technologies Inc 113
6 Conclusions Figure 160 and Figure 161 (repeats of Figure 13 and Figure 14) graphically summarize the cost trends for the
80kWnet PEM fuel cell stacks and systems
Figure 160 Gross stack cost vs annual production rate
Figure 161 Net system cost vs annual production rate
In addition to the downward trend in the current cost projections there have been significant cost reductions compared to the previous four years of analysis a consequence of technology improvement and analysis refinement The current technology (2010) cost projection is 51 lower than the initial analysis (2006) at 500k systemsyear production level Figure 162 shows the downward trend in current technology cost since the beginning of the project Figure 163 shows that the annual updates of projections for the 2010 and 2015 systems also display a downward trend
Directed Technologies Inc 114
$300 $24000
$270
$240
$21000
$18000
$10581
$9358
$7507
$6096
$5138
2006 Study
2007 Study
2008 Study
2009 Study
2010 Study
System
Cost
($system
)
System
Cost
($kW
net)
$210
$180
$150
$120
$90
$15000
$12000
$9000
$6000
$3000
$60
$30
$0 $0
0 100000 200000 300000 400000 500000 600000
Annual Production Rate (systemsyear) Figure 162 Current‐technology cost evolution
Figure 163 System cost future projections (500k sysyr)
Directed Technologies Inc 115
It should be noted that as shown in Figure 164 current study estimates for future cost projections fall short of the DOE target costs (DOE cost targets are indicated as red dots in Figure 163) However given the overall downward trend of cost projections further significant cost reductions can likely be achieved with technology advancements that have not yet been discovered
Source Characteristic Units 2010 2015 DOE Target Stack Cost $kWe (net) $25 $15
Study Estimate Stack Cost $kWe (net) $25 $21
DOE Target System Cost $kWe (net) $45 $30
Study Estimate System Cost $kWe (net) $51 $39 Figure 164 DOE targets vs DTI estimates for the stack amp system
Key conclusions from the analysis include
System cost projections are 13 and 30 above the 2010 and 2015 DOE cost targets respectively
o Stack Cost The projections meet the 2010 DOE target but are $6kW over for 2015
o System Cost The projections are $6kW over the 2010 DOE target and $9kW over for 2015
Substantial cost reductions (factors of 3ndash5) are achievable by increasing manufacturing volume from 1000 to 500000 systems per year production rate
78 of the cost reduction between high (500000 systems per year) and low production (1000 systems per year) is achieved at the 30000 systems per year production rate 93 of the cost reduction is achieved at the 130000 systems per year production rate
Balance of plant (BOP) elements (ie everything other than the fuel cell stacks) represents a large portion of total system cost (20ndash48) Consequently RampD to reduce simplify or eliminate BOP components is needed to achieve significant overall system cost reductions
Three subsystems account for 74 of BOP costs air loop high‐temperature cooling loop and sensors
BOP costs drop significantly as technology level advances due to simplification of the air compressor humidification and H2 sensor subsystems RampD is needed to ensure that these projected advances are achieved
While only a preliminary system assembly analysis was conducted a maximum cost of $196kWnet is indicated and only half of that at 500000 systems per year A more detailed analysis is required to improve confidence in this estimate
Stamped metallic bipolar plates increasingly appear to be the industry standard However both stamped metallic and injected molded polymer bipolar plates are economically viable pathways and have a projected cost of $4ndash21kWnet across all production rates examined
o Performance and longevity issues may be a larger factor than cost in selecting between metallic plates and molded plates
o Appropriate alloy selection for bipolar plates may obviate costly anti‐corrosion coatings
Directed Technologies Inc 116
o Confidence has increased in the last year that a cost‐competitive metal plate coating system exists that provides adequate corrosion resistance
o Metal plates allow welding to be used in lieu of gaskets for plate sealing
Development of NSTF (Nanostructured Thin Film) catalysts enabled significant improvements in power density and catalyst loading between 2008 and 2009 (715 mWcm2 at 025 mgPtcm2 vs 833 mWcm2
at 015 mgPtcm2) These improvements yielded a system cost reduction of ~$10kWnet
Further modest power density improvements are expected in the future (1000 mWcm2 in 2015) and are expected to result in further cost reductions
While additional platinum catalyst usage reduction would obviously be cost beneficial we project future loadings to remain approximately constant at 015 mgPtcm2 This catalyst loading is sufficiently low that platinum cost is no longer a dominant element of the system as it once was We anticipate performance advances to instead manifest themselves in power density and durability improvements
Membrane cost is expected to drop a factor of ten due primarily to mass production methods Material cost of the Nafion ionomer (or some other ion conductive ionomer) likewise is expected to drop ten‐fold in cost Alternate membranes with reduced manufacturing complexity offer an additional route to material cost reduction
Application of the NSTF catalyst at high production rates can be quite low‐cost ~$040kWnet
The gas diffusion layer (GDL) ranges from $2ndash27kWnet and is a significant cost element within the stack While currently envisioned as a macroporous carbon electrode with a secondary microporous layer alternate materials and fabrication methods should be explored to reduce cost
Hot pressing of the MEA and cutting it to cell size are observed to be minor cost elements
A polymer framegasket insertion‐molded around the MEA is seen to be a cost viable design and manufacturing concept consistent with system operation and the economically processing of the subcomponents Costs are estimated at $3ndash6kWnet
Stack assembly using either manual or robotic assembly is relatively inexpensive $040ndash$095kWnet
Stack conditioning to improve MEA performance is estimated at lt$1kWnet based on an extrapolation of current procedures However ultimately the MEA and stack conditioning procedure must be optimized together The current analysis postulates only a generic conditioning procedure
The sensitivity analysis reveals that uncertainties in power density platinum loading and platinum cost lead to significant changes in the total system cost Uncertainties in all other parameters have much smaller potential impact
There is a 90 likelihood that the system costs are between the following values
o 2010 500000 systemsyear $4744ndash$5693kWnet (‐8 to +11 of $5138 projected value)
o 2015 500000 systemsyear $3623ndash$4425kWnet (‐8 to +12 of $3945 projected value)
o Overall the range of cost variation (generally plusmn10) while still maintaining 90 confidence is quite narrow
Directed Technologies Inc 117
- Mass Production Cost Estimation for Direct H2 PEM Fuel Cell Systems for Automotive Applications 2010 Update
- Foreward
- Table of Contents
- Table of Contents (cont)
- Table of Figures
- Table of Figures (cont)
- Table of Figures (cont)
- Table of Figures (cont)
- 1 Overview
- 2 Project Approach
- 2 Project Approach (cont)
- 3 Summary of Results
- 3 Summary of Results (cont)
- Figure 1 Changes in system costs since 2009 update
- 32 System Schematics
- Figure 3 Flow schematic for the ldquocurrent technologyrdquo fuel cell system from 2008
- 322 2009 System Schematic
- 323 2010 System Schematic
- 324 2015 System Schematic
- 33 System Cost Summaries
- 332 Cost Summary of the 2015 Technology System
- 34 Cost Comparison of the Two Systems
- Figures 13 and 14
- 4 Detailed Assumptions
- Figures 17 and 18
- 42 Manufacturing Cost
- 42 Manufacturing Cost (cont)
- 421 Machine Rate Validation
- Figure 21
- 422 Material and Part Yields
- 43 Markup Rates
- 43 Markup Rates (cont)
- Figure 25 Exploded stack view (abridged to 2 cells for clarity)
- 441 Bipolar Plates
- 4411 Injection‐Molded Bipolar Plates
- Figure 28 Bipolar plate injection‐molding process parameters
- 4412 Stamped Bipolar Plates
- Figure 32 Capital costs breakdown for a typical bipolar plate stamping production line
- Figure 33 Press speed vs press force
- Figures 34 and 35
- 44121 Alloy Selection and Corrosion Concerns
- 44122 Bipolar Plate Surface Treatments and Coatings
- 44122 Bipolar Plate Surface Treatments and Coatings (cont)
- Figure 37 Magnified chromium nitride surface conversion
- Figure 38 Impact of plate spacing on nitriding cost
- 442 Membrane
- 4422 Membrane Material Cost
- 4423 Membrane Manufacturing Cost
- 4423 Membrane Manufacturing Cost (cont)
- Figure 43 Membrane fabrication process diagram
- 4423 Membrane Manufacturing Cost (cont)
- Figure 44 Simplified membrane manufacturing cost analysis assumptions
- 4424 Total Membrane Cost and Comparison to Other Estimates
- 443 Nanostructured Thin Film (NSTF) Catalyst Application
- 4431 Application Process
- 4432 Cost and Performance Assumptions
- 4433 Results
- Comparison VertiCoater vs NSTF (at equal power density ampcatalyst loading)
- 444 Catalyst Cost
- 445 Gas Diffusion Layer
- Figures 55 and 56
- Figures 56 and 57
- 446 MEA Gaskets and MEA Assembly
- Figure 61 Hot‐pressing process diagram
- 4462 Cutting amp Slitting
- Figures 66 and 67
- 4463 Insertion‐Molding the FrameGasket
- 4463 Insertion‐Molding the FrameGasket (cont)
- 447 End Plates
- Figure 75 End plate concept US patent 6764786
- Figure 76 End plate amp current collector63
- Figures 77-79
- 448 Current Collectors
- 449 Coolant Gaskets
- 4491 Insertion‐Molded Coolant Gaskets
- Figures 84-86
- Figures 87 and 88
- 4493 Screen‐Printed Coolant Gaskets
- Figure 91 Screen printer cost vs annual production rate
- Figures 92 and 93
- 4410 End Gaskets
- 44102 Screen‐Printed End Gaskets
- 4411 Stack Compression
- Figures 103 and 104
- 4413 Stack Housing
- 4414 Stack Conditioning and Testing
- Figure 110 Stack conditioning process based on US patent 7078118 (ldquoApplied Voltage Embodimentrdquo
- 45 Balance of Plant (BOP)
- 4511 Compressor‐Expander‐Motor Unit amp Motor Controller
- Figure 115 Matrix of CEM design configurations
- Figure 116 List of Improvements for the 6 Compressor Configurations
- 4511 Compressor-Expander-Motor Unit amp Motor Controller (cont)
- 4512 Air Mass Flow Sensor
- 4514 Air Filter and Housing
- 4522 Demister
- 4523 Membrane Humidifier
- Figure 124 Membrane humidifier manufacturing process diagram
- Figure 125 Capital cost breakdown for a typical membrane humidifier manufacturing process
- 453 Coolant Loops
- 4532 Low‐Temperature Coolant Loop
- 454 Fuel Loop
- 455 System Controller
- Figure 132 System controller input amp output requirements
- 456 Sensors
- 4561 Current Sensors
- 457 Miscellaneous BOP
- 4571 Belly Pan
- Figures 140 and 141
- 5 Sensitivity Analysis
- 52 Monte Carlo Results
- Figures 151 and 152
- Figures 153 and 154
- Figures 155 and 156
- Figures 157 and 158
- 54 Peak Power Operating Point
- 6 Conclusions
- Figures 162 and 163
- 6 Conclusions (cont)
- Figure 164 DOE targets vs DTI estimates for the stack amp system
-

Foreword Energy security is fundamental to the mission of the US Department of Energy (DOE) and hydrogen fuel cell
vehicles have the potential to eliminate the need for oil in the transportation sector Fuel cell vehicles can operate on hydrogen which can be produced domestically emitting less greenhouse gasses and pollutants than conventional internal combustion engine (ICE) advanced ICE hybrid or plug‐in hybrid vehicles that are tethered to petroleum fuels A diverse portfolio of energy sources can be used to produce hydrogen including nuclear coal natural gas geothermal wind hydroelectric solar and biomass Thus fuel cell vehicles offer an environmentally clean and energy‐secure transportation pathway for transportation
Fuel cell systems will have to be cost‐competitive with conventional and advanced vehicle technologies to gain the market‐share required to influence the environment and reduce petroleum use Since the light duty vehicle sector consumes the most oil primarily due to the vast number of vehicles it represents the DOE has established detailed cost targets for automotive fuel cell systems and components To help achieve these cost targets the DOE has devoted research funding to analyze and track the cost of automotive fuel cell systems as progress is made in fuel cell technology The purpose of these cost analyses is to identify significant cost drivers so that RampD resources can be most effectively allocated toward their reduction The analyses are annually updated to track technical progress in terms of cost and to indicate how much a typical automotive fuel cell system would cost if produced in large quantities (up to 500000 vehicles per year)
The capacity to produce fuel cell systems at high manufacturing rates does not yet exist and significant investments will have to be made in manufacturing development and facilities in order to enable it Once the investment decisions are made it will take several years to develop and fabricate the necessary manufacturing facilities Furthermore the supply chain will need to develop which requires negotiation between suppliers and system developer with details rarely made public For these reasons the DOE has consciously decided not to analyze supply chain scenarios at this point instead opting to concentrate its resources on solidifying the tangible core of the analysis ie the manufacturing and materials costs
The DOE uses these analyses as tools for RampD management and tracking technological progress in terms of cost Consequently non‐technical variables are held constant to elucidate the effects of the technical variables For example the cost of platinum is held at $1100 per troy ounce to insulate the study from unpredictable and erratic platinum price fluctuations Sensitivity analyses are conducted to explore the effects of non‐technical parameters
To maximize the benefit of our work to the fuel cell community DTI strives to make each analysis as transparent as possible The transparency of the assumptions and methodology serve to strengthen the validity of the analysis We hope that these analyses have been and will continue to be valuable tools to the hydrogen and fuel cell RampD community
Directed Technologies Inc ii
Table of Contents 1 Overview 1 2 Project Approach 2 3 Summary of Results4
31 Changes since the 2009 Update Report 4 32 System Schematics 7
321 2008 System Schematic 7 322 2009 System Schematic 9 323 2010 System Schematic 10 324 2015 System Schematic 11
33 System Cost Summaries 12 331 Cost Summary of the 2010 Technology System 12 332 Cost Summary of the 2015 Technology System 13
34 Cost Comparison of the Two Systems 14 4 Detailed Assumptions 16
41 System Performance and Operation 16 42 Manufacturing Cost 18
421 Machine Rate Validation 20 422 Material and Part Yields 22
43 Markup Rates 23 44 Fuel Cell Stack Materials Manufacturing and Assembly 24
441 Bipolar Plates 26 4411 Injection‐Molded Bipolar Plates 27 4412 Stamped Bipolar Plates29
44121 Alloy Selection and Corrosion Concerns33 44122 Bipolar Plate Surface Treatments and Coatings 34
442 Membrane 38 4421 Membrane Material amp Structure (Nafionreg on ePTFE)38 4422 Membrane Material Cost39 4423 Membrane Manufacturing Cost 40 4424 Total Membrane Cost and Comparison to Other Estimates 45
443 Nanostructured Thin Film (NSTF) Catalyst Application 46 4431 Application Process47 4432 Cost and Performance Assumptions48 4433 Results49
444 Catalyst Cost 51 445 Gas Diffusion Layer 52 446 MEA Gaskets and MEA Assembly 55
4461 Hot‐Pressing the Membrane and GDLs 55 4462 Cutting amp Slitting57 4463 Insertion‐Molding the FrameGasket 59
447 End Plates 61 448 Current Collectors 65
Directed Technologies Inc iii
449 Coolant Gaskets 66 4491 Insertion‐Molded Coolant Gaskets 67 4492 Laser‐Welded Coolant Gaskets 68 4493 Screen‐Printed Coolant Gaskets 70
4410 End Gaskets 73 44101 Insertion‐Molded End Gaskets 73 44102 Screen‐Printed End Gaskets 74
4411 Stack Compression 75 4412 Stack Assembly 76 4413 Stack Housing 78 4414 Stack Conditioning and Testing 79
45 Balance of Plant (BOP) 81 451 Air Loop 81
4511 Compressor‐Expander‐Motor Unit amp Motor Controller 82 4512 Air Mass Flow Sensor 86 4513 Air Ducting 86 4514 Air Filter and Housing 87
452 Humidifier amp Water Recovery Loop 87 4521 Air Precooler 87 4522 Demister 88 4523 Membrane Humidifier 89
453 Coolant Loops 92 4531 High‐Temperature Coolant Loop 92 4532 Low‐Temperature Coolant Loop 93
454 Fuel Loop 94 455 System Controller 95 456 Sensors 97
4561 Current Sensors 98 4562 Voltage Sensors 98 4563 Hydrogen Sensors 98
457 Miscellaneous BOP 99 4571 Belly Pan 100 4572 Mounting Frames 102 4573 Wiring 102 4574 Fasteners for Wiring amp Piping 104
46 System Assembly 104 47 System Testing 106 48 Cost Contingency 106
5 Sensitivity Analysis 107 51 Monte Carlo Parameters 107 52 Monte Carlo Results 108 53 Single‐Variable Sensitivity 110 54 Peak Power Operating Point 113
6 Conclusions 114 Directed Technologies Inc iv
Table of Figures Figure 1 Changes in system costs since 2009 update 6 Figure 2 Summary chart of the two different systems analyzed 7 Figure 3 Flow schematic for the ldquocurrent technologyrdquo fuel cell system from 2008 8 Figure 4 Flow schematic for the ldquocurrent technologyrdquo fuel cell system from 2009 9 Figure 5 Flow schematic for the ldquocurrent technologyrdquo (2010) fuel cell system 10 Figure 6 Flow schematic for the 2015 fuel cell system11 Figure 7 Detailed stack cost for the 2010 technology system 12 Figure 8 Detailed balance of plant cost for the 2010 technology system 12 Figure 9 Detailed system cost for the 2010 technology system 13 Figure 10 Detailed stack cost for the 2015 technology system 13 Figure 11 Detailed balance of plant cost for the 2015 technology system 14 Figure 12 Detailed system cost for the 2015 technology system14 Figure 13 Gross stack cost vs annual production rate 15 Figure 14 Net system cost vs annual production rate 15 Figure 15 Basis of air compressor and expander power16 Figure 16 Power production amp loads at max power under peak ambient temp operating conditions16 Figure 17 Stack design parameters 17 Figure 18 Stack operation parameters17 Figure 19 Cell geometry 18 Figure 20 Cell dimensions 18 Figure 21 Injection‐molding machine rate vs machine clamping force21 Figure 22 Machine rate vs machine utilization 22 Figure 23 Material and part yield percentages applied23 Figure 24 Representative markup rates (but not applied to cost estimates)24 Figure 25 Exploded stack view (abridged to 2 cells for clarity)25 Figure 26 Stack cross‐section 26 Figure 27 Injection‐molding machine cost vs clamp force 27 Figure 28 Bipolar plate injection‐molding process parameters28 Figure 29 Machine rate parameters for bipolar plate injection‐molding process28 Figure 30 Cost breakdown for injection‐molded bipolar plates 29 Figure 31 Bipolar plate stamping process diagram29 Figure 32 Capital costs breakdown for a typical bipolar plate stamping production line 30 Figure 33 Press speed vs press force 31 Figure 34 Cost breakdown for stamped bipolar plates32 Figure 35 Machine rate parameters for bipolar plate stamping process 32 Figure 36 Bipolar plate stamping process parameters 33 Figure 37 Magnified chromium nitride surface conversion36 Figure 38 Impact of plate spacing on nitriding cost37 Figure 39 Conductive vias shown in US patent 730954037 Figure 40 Cost breakdown for TreadStone LiteCell bipolar plate coating process38 Figure 41 Basic membrane characteristics 39 Figure 42 Ionomer material cost40 Figure 43 Membrane fabrication process diagram42 Figure 44 Simplified membrane manufacturing cost analysis assumptions44 Figure 45 Membrane manufacturing cost vs annual membrane manufacturing volume45 Figure 46 Membrane (material + manufacturing) cost compared to previous analysis and vendor quotes 46 Figure 47 Cost breakdown for un‐catalyzed membrane 46 Figure 48 NSTF production process diagram 48 Figure 49 Capital costs of NSTF manufacturing line 48
Directed Technologies Inc v
Figure 50 Cost comparison between NSTF and VertiCoater methods 50 Figure 51 NSTF application process parameters 50 Figure 52 Machine rate parameters for NSTF application process 50 Figure 53 Cost breakdown for NSTF application process 51 Figure 54 Five‐year graph of monthly platinum prices 52 Figure 55 Cross‐section of gas diffusion layer in stack 53 Figure 56 Dual‐layer GDL process diagram 54 Figure 57 Capital cost breakdown for a typical microporous layer application line 54 Figure 58 GDL manufacturing process parameters (microporous layer addition only) 55 Figure 59 Machine rate parameters for GDL manufacturing process 55 Figure 60 Cost breakdown for gas diffusion layers 55 Figure 61 Hot‐pressing process diagram 56 Figure 62 Hot‐pressing process parameters 57 Figure 63 Machine rate parameters for hot‐pressing process 57 Figure 64 Cost breakdown for hot‐pressing process 57 Figure 65 Cutting amp slitting process diagram 58 Figure 66 Capital cost breakdown for the cutting and slitting process 58 Figure 67 Cutting amp slitting process parameters 58 Figure 68 Machine rate parameters for cutting amp slitting process 59 Figure 69 Cost breakdown for cutting amp slitting process 59 Figure 70 Insertion‐molded framegasket concept US patent 7070876 59 Figure 71 MEA framegasket materials comparison 60 Figure 72 MEA framegasket insertion‐molding process parameters 61 Figure 73 Machine rate parameters for MEA framegasket insertion‐molding process 61 Figure 74 Cost breakdown for MEA framegasket insertion molding 61 Figure 75 End plate concept US patent 6764786 62 Figure 76 End plate amp current collector 63 Figure 77 End plate compression molding process parameters 64 Figure 78 Machine rate parameters for compression molding process 64 Figure 79 Cost breakdown for end plates 64 Figure 80 Current collector manufacturing process parameters 65 Figure 81 Machine rate parameters for current collector manufacturing process 66 Figure 82 Cost breakdown for current collector manufacturing process 66 Figure 83 Coolant gasket manufacturing method cost comparison (for 2010 technology) 67 Figure 84 Gasket insertion‐molding process parameters 68 Figure 85 Machine rate parameters for gasket insertion‐molding process 68 Figure 86 Cost breakdown for gasket insertion‐molding 68 Figure 87 Coolant gasket laser welding process parameters 69 Figure 88 Machine rate parameters for gasket laser‐welding process 69 Figure 89 Cost breakdown for coolant gasket laser welding 70 Figure 90 Screen printer comparison 71 Figure 91 Screen printer cost vs annual production rate 71 Figure 92 Coolant gasket screen‐printing process parameters 72 Figure 93 Machine rate parameters for coolant gasket screen printing process 72 Figure 94 Cost breakdown for coolant gasket screen printing 73 Figure 95 End gasket manufacturing method cost comparison (for 2008 technology) 73 Figure 96 End gasket insertion‐molding process parameters 74 Figure 97 Machine rate parameters for end gasket insertion‐molding process 74 Figure 98 Cost breakdown for end gasket insertion molding 74 Figure 99 End gasket screen printing process parameters 75 Figure 100 Machine rate parameters for end gasket screen printing process 75
Directed Technologies Inc vi
Figure 101 Cost breakdown for end gasket screen printing 75 Figure 102 Stack compression bands concept US patent 599398776 Figure 103 Semi‐automated stack assembly work flow diagram 77 Figure 104 Stack assembly process parameters 77 Figure 105 Machine rate parameters for stack assembly process 78 Figure 106 Cost breakdown for stack assembly78 Figure 107 Cost breakdown for stack housing78 Figure 108 Stack housing vacuum thermoforming process parameters 79 Figure 109 Machine rate parameters for stack housing vacuum thermoforming process 79 Figure 110 Stack conditioning process based on US patent 7078118 (ldquoApplied Voltage Embodimentrdquo)80 Figure 111 Stack conditioning process parameters 81 Figure 112 Machine rate parameters for stack conditioning process 81 Figure 113 Cost breakdown for stack conditioning 81 Figure 114 Cost breakdown for air loop 82 Figure 115 Matrix of CEM design configurations83 Figure 116 List of Improvements for the 6 Compressor Configurations 84 Figure 117 CEM cost results86 Figure 118 Cost breakdown for humidifier amp water recovery loop87 Figure 119 Cost breakdown for air precooler 87 Figure 120 Cost breakdown for demister 88 Figure 121 Demister injection molding process parameters88 Figure 122 Machine rate parameters for demister injection molding process 89 Figure 123 Perma Pure FC200‐780‐7PP humidifier 89 Figure 124 Membrane humidifier manufacturing process diagram90 Figure 125 Capital cost breakdown for a typical membrane humidifier manufacturing process 91 Figure 126 Membrane humidifier production process parameters 91 Figure 127 Machine rate parameters for membrane humidifier production process 92 Figure 128 Cost breakdown for membrane air humidifier 92 Figure 129 Cost breakdown for high‐temperature coolant loop93 Figure 130 Cost breakdown for low‐temperature coolant loop94 Figure 131 Cost breakdown for fuel loop 95 Figure 132 System controller input amp output requirements 96 Figure 133 System controller component costs 97 Figure 134 Cost breakdown for system controller 97 Figure 135 Sensor details 97 Figure 136 Cost breakdown for sensors 98 Figure 137 Hydrogen sensors amp associated control electronics 99 Figure 138 Cost breakdown for hydrogen sensors 99 Figure 139 Cost breakdown for miscellaneous BOP components 100 Figure 140 Belly pan thermoforming process parameters 101 Figure 141 Machine rate parameters for belly pan thermoforming process 101 Figure 142 Cost breakdown for belly pan 102 Figure 143 Fuel cell system wiring schematic103 Figure 144 Wiring details 103 Figure 145 Cost breakdown for wiring104 Figure 146 Single‐station system assembly assumptions 105 Figure 147 System assembly process parameters 105 Figure 148 Cost breakdown for system assembly amp testing106 Figure 149 Monte Carlo parameters for 2010 technology 500k sysyr107 Figure 150 Monte Carlo parameters for 2015 technology 500k sysyr107 Figure 151 Monte Carlo results for fuel cell stack cost (2010 technology 500k sysyr) 109
Directed Technologies Inc vii
Figure 152 Monte Carlo results for fuel cell stack cost (2015 technology 500k sysyr) 109 Figure 153 Monte Carlo results for fuel cell system cost (2010 technology 500k sysyr) 110 Figure 154 Monte Carlo results for fuel cell system cost (2015 technology 500k sysyr) 110 Figure 155 Inputs amp cost results for tornado chart (2010 technology 500k sysyr) 111 Figure 156 Tornado chart cost results for single‐variable sensitivity analysis (2010 technology 500k sysyr)111 Figure 157 Inputs and cost results for tornado chart (2015 technology 500k sysyr) 112 Figure 158 Tornado chart of cost results for single‐variable sensitivity analysis (2015 technology 500k sysyr) 112 Figure 159 Results of shifted power operating point 113 Figure 160 Gross stack cost vs annual production rate 114 Figure 161 Net system cost vs annual production rate 114 Figure 162 Current‐technology cost evolution 115 Figure 163 System cost future projections (500k sysyr) 115 Figure 164 DOE targets vs DTI estimates for the stack amp system 116
Directed Technologies Inc viii
1 Overview This report is the fourth annual update of a comprehensive automotive fuel cell cost analysis1 conducted by
Directed Technologies Inc (DTI) under contract to the US Department of Energy (DOE) The first report (hereafter called the ldquo2006 cost reportrdquo) estimated fuel cell system cost for three different technology levels a ldquocurrentrdquo system that reflected 2006 technology a system based on projected 2010 technology and another system based on projections for 2015 The 2007 Update report incorporated technology advances made in 2007 and re‐appraised the projections for 2010 and 2015 Based on the earlier report it consequently repeated the structure and much of the approach and explanatory text The 2008 and 2009 Update reports followed suit and this 2010 Update report2 is another annual reappraisal of the state of technology and the corresponding costs However because the current year is now 2010 the ldquocurrentrdquo technology and the 2010 projected technology have merged leaving only two technology levels to be examined the current status (2010) and the 2015 projection The reader is directed to section 31 for a high‐level summary of the changes since the 2009 report
In this multi‐year project DTI estimates the material and manufacturing costs of complete 80 kWnet direct‐hydrogen Proton Exchange Membrane (PEM) fuel cell systems suitable for powering light‐duty automobiles To assess the cost benefits of mass manufacturing five annual production rates are examined for each technology level 1000 30000 80000 130000 and 500000 systems per year
A Design for Manufacturing and Assembly (DFMA) methodology is used to prepare the cost estimates However departing from DFMA standard practice a markup rate to account for the business expenses of general and administrative (GampA) RampD scrap and profit is not currently included in the cost estimates In other DTI cost estimate projects an additional 10 cost contingency has often been included though it has not for this study
In general the system designs do not change with production rate but material costs manufacturing methods and business‐operational assumptions vary Cost estimation at very low manufacturing rates (1000 systems per year) presents particular challenges Traditional low‐cost mass‐manufacturing methods are not cost‐effective due to high per‐unit setup and tooling costs and less defined less automated operations are typically employed For some repeat parts within the fuel cell stack (eg the membrane electrode assemblies (MEAs) and bipolar plates) such a large number of pieces are needed for each system that even at low system production rates (1000year) hundreds of thousands of individual parts are needed annually Thus for these parts mass‐manufacturing cost reductions are achieved even at low system production rates However other stack components (eg end plates and current collectors) and all balance of plant (BOP) equipment (eg compressors hoses and valves) do not benefit from this manufacturing multiplier effect
The 2010 system reflects the authorsrsquo best estimate of current technology and (with a few exceptions3) is not based on proprietary information Public presentations by fuel cell companies and other researchers along with extensive review of the patent literature are used as the basis for much of the design and fabrication technologies Consequently the presented information may lag behind what is being done ldquobehind the curtainrdquo in fuel cell companies Nonetheless the current‐technology system provides a benchmark against which the impact of future technologies may be compared Taken together the analysis of these two systems (2010 and 2015) provides a good sense of the likely range of costs for mass‐produced automotive fuel cell systems and of the dependence of cost on system performance manufacturing and business‐operational assumptions
1 ldquoMass Production Cost Estimation for Direct H2 PEM Fuel Cell Systems for Automotive Applicationsrdquo Brian D James amp Jeff Kalinoski Directed Technologies Inc October 2007
2 For previous analyses DTI was funded directly by the Department of Energyrsquos Energy Efficiency and Renewable Energy Office For the 2010 Annual Update report DTI is funded by the National Renewable Energy Laboratory
3 The following components were modeled based on proprietary information that cannot be fully disclosed Bipolar plate coatings ‐ TreadStone Technologies Inc Turbocompressor ‐ Honeywell
Directed Technologies Inc 1
2 Project Approach The two systems examined (2010 and 2015 technologies) do not reflect the design of any one manufacturer
but are composites of the best elements from a number of designs Both systems were normalized to a system output power of 80 kWnet although their gross powers were derived independently based on the parasitic load from the BOP components using an oxidant stoichiometry4 of 20ndash25 The stack efficiency at rated power for all three systems is pegged at 55 to match the DOE target value Multiplying this by the theoretical open circuit cell voltage (1229 V) yields a cell voltage of 0676 V at peak power Stack pressure levels (at peak power) are projected to decrease with time and were set at 169 and 15 atm56 for the 2010 and 2015 systems respectively
The main fuel cell subsystems included in this analysis are
Fuel cell stacks
Air loop
Humidifier and water recovery loop
High‐temperature coolant loop
Low‐temperature coolant loop
Fuel loop (but not fuel storage)
Fuel cell system controller
Sensors
Some vehicle electrical system components explicitly excluded from the analysis include
Main vehicle battery or ultra capacitor7
Electric traction motor (that drives the vehicle wheels)
Traction inverter module (TIM) (for control of the traction motor)
Vehicle frame body interior or comfort related features (eg driverrsquos instruments seats and windows)
Many of the components not included in this study are significant contributors to the total fuel cell vehicle cost but their design and cost are not necessarily dependent on the fuel cell configuration or operating
4 Air stoichiometry is 25 for 2010 and drops to 20 for 2015 5 The systems operate at these pressures (for both the air and hydrogen streams) at peak power Because a centrifugal air compressor
is used to achieve air pressurization operating pressure is highest at full power and is at a lower level for part‐power operation 6 In earlier years of the analysis (2006‐2008) there was a wider spread of projected stack operating pressures for each of the
technology levels typically 15‐23 atm However as will be discussed within the report polarization curve improvements during the 2009 analysis caused stack pressure to be re‐optimized resulting in a lowering of stack pressure
7 Fuel cell automobiles may be either ldquopure‐bredsrdquo or ldquohybridsrdquo depending on whether they have battery (or ultracapacitor) electrical energy storage or not This analysis only addresses the cost of an 80 kW fuel cell power system and does not include the cost of any peak‐power augmentation or hybridizing battery
Directed Technologies Inc 2
conditions The fuel cell system is the power plant that could be used in a variety of vehicle body types and drive configurations all of which could have a different cost structure
As mentioned above the costing methodology employed in this study is the Design for Manufacture and Assembly technique (DFMA) The Ford Motor Company has formally adopted the DFMA process as a systematic means for the design and evaluation of cost optimized components and systems These techniques are powerful and are flexible enough to incorporate historical cost data and manufacturing acumen that have been accumulated by Ford since the earliest days of the company Since fuel cell system production requires some manufacturing processes not normally found in automotive production the formal DFMA process and DTIrsquos manufacturing database are buttressed with budgetary and price quotations from experts and vendors in other fields It is possible to choose cost‐optimized manufacturing processes and component designs and accurately estimate the cost of the resulting products by combining historical knowledge with the technical understanding of the functionality of the fuel cell system and its component parts
The cost for any component analyzed via DFMA techniques includes direct material cost manufacturing cost assembly costs and markup Direct material costs are determined from the exact type and mass of material employed in the component This cost is usually based upon either historical volume prices for the material or vendor price quotations In the case of materials not widely used at present the manufacturing process must be analyzed to determine the probable high‐volume price for the material The manufacturing cost is based upon the required features of the part and the time it takes to generate those features in a typical machine of the appropriate type The cycle time can be combined with the ldquomachine raterdquo the hourly cost of the machine based upon amortization of capital and operating costs and the number of parts made per cycle to yield an accurate manufacturing cost per part The assembly costs are based upon the amount of time to complete the given operation and the cost of either manual labor or of the automatic assembly process train The piece cost derived in this fashion is quite accurate as it is based upon an exact physical manifestation of the part and the technically feasible means of producing it as well as the historically proven cost of operating the appropriate equipment and amortizing its capital cost Normally (though not in this report) a percentage markup is applied to the material manufacturing and assembly cost to account for profit general and administrative (GampA) costs research and development (RampD) costs and scrap costs This percentage typically varies with production rate to reflect the efficiencies of mass production It also changes based on the business type and on the amount of value that the manufacturer or assembler adds to the product (Markup rate is discussed in more detail in section 43)
Cost analyses were performed for mass‐manufactured systems at five production rates 1000 30000 80000 130000 and 500000 systems per year System designs did not change with production rate but material costs manufacturing methods and business‐operational assumptions (such as markup rates) often varied Fuel cell stack component costs were derived by combining manufacturersrsquo quotes for materials and manufacturing with detailed DFMA‐style analysis
For some components (eg the bipolar plates and the coolant and end gaskets) multiple designs or manufacturing approaches were analyzed The options were carefully compared and contrasted then examined within the context of the rest of the system The best choice for each component was included in one or more of the two baseline configurations (the 2010 and 2015 technology systems) Because of the interdependency of the various components the selection or configuration of one component sometimes affects the selection or configuration of another In order to handle these combinations the model was designed with switches for each option and logic was built in that automatically adjusts variables as needed As such the reader should not assume that accurate system costs could be calculated by merely substituting the cost of one component for another using only the data provided in this report Instead data provided on various component options should be used primarily to understand the decision process used to select the approach selected for the baseline configurations
Directed Technologies Inc 3
3 Summary of Results Complete fuel cell power systems are configured to allow assembly of comprehensive system Bills of Materials
A system configuration summary for both technology levels is shown in Figure 2 below System flow schematics for each of the systems are shown in Figure 3 through Figure 6 Note that for clarity only the main system components are identified in the flow schematics The reader is directed to the full bill of materials (BOM) in Section 45 for a comprehensive listing of system elements
31 Changes since the 2009 Update Report This report represents the fourth annual update of the 2006 DTI fuel cell cost estimate report8 under contract
to the DOE The 2006 report (dated October 2007) documented cost estimates for fuel cell systems based on projected 2006 2010 and 2015 technologies Like the other three updates before it this annual report updates the previous work to incorporate advances made over the course of 2010 These advances include new technologies improvements and corrections made in the cost analysis and alterations of how the systems are likely to develop Since the year is now 2010 the ldquocurrentrdquo technology and the 2010 projected technology have now merged leaving only two technology levels to examine the current status (2010) and the 2015 projection
As was the case with the 2009 Update the majority of changes this year revolve around the BOP components While most of these components are based on modifications of proven existing technology the stack designs are comparatively immature The impact of this is twofold the stack has the most room for technological improvement and the component production methods are less refined Therefore most of the analysis from previous years of the project has been focused on the stack since it provided the most potential for cost savings Since the 2008 status update however the focus has shifted towards the BOP and changes to the stack analysis have primarily been adjustments of operating parameters rather than the additions of new components or changes in design
Almost all of the BOP components were re‐examined in greater detail with extra emphasis on those with the largest contribution to cost The system schematics (see Figure 3 through Figure 6) were refined and components were added and subtracted Detailed analyses were conducted of the wiring and pipingtubing requirements with consideration for flow rates cooling and power requirements and the physical distances between components
A central theme of the past yearrsquos work has been the integration of performance‐parameter‐based scaling into the cost model Although the previous cost model included performance parameters we have enhanced the level of detail and interaction to better reflect actual performance Integration between all of the components (in both the stack and the BOP) has been greatly increased such that geometries and costs now scale dynamically based on a variety of parameters (eg operating pressure air mass flow and cooling and power requirements)
Noteworthy changes since the 2009 Update report are listed below
Changed Temperature at Peak Power from 80degC to 90degC Improved durability allows a higher peak temperature which allows for a smaller radiator
8 ldquoMass Production Cost Estimation for Direct H2 PEM Fuel Cell Systems for Automotive Applicationsrdquo Brian D James Jeff Kalinoski Directed Technologies Inc October 2007
Directed Technologies Inc 4
Lowered Channel Depth of Stamped Bipolar Plates from 092 to 05 mm The flow channel depth of the bipolar plates was reduced from 092 to 05 mm based on industry input This results in a more‐compact stack and the resulting reduction in gasket material lowered the cost by $103kWnet
Areal Power Density Tied Directly to Actual 3M NSTF Performance Curves Previously the stack power density on which the stack was sized was determined by the Fuel Cell Tech Team and represented general stack status and improvements from a range of stack manufacturers For 2010 stack power density is tied to a specific system (3M NSTF catalyst and membranes) and a specific set of operating conditions This enables the entire cost model to more‐realistically reflect changes in operating assumptions
Low‐Temperature Coolant Loop Added A separate lower‐temperature coolant loop is added to support the newly added air precooler However only 39 of the low temperature loop (LTL) cost is included in the fuel cell system cost estimate due to the assumption that part of its thermal duty serves components not included in this cost analysis (eg the traction inverter module)
Reconfigured Fuel Loop Based on industry input the proportional valve and pressure transducer have been removed and an over‐pressure cut‐off valve and check valves were added as well as an inline filter for gas purity excursions It is further assumed that the hydrogen storage system (which is not included in the cost analysis) can handle some of the pressure regulation requirements
Improved System Controller DFMA Analysis A more‐detailed cost analysis was conducted on the system controller (ie the electronic system controller analogous to the Electronic Engine Controller (EEC) in an internal combustion engine vehicle) The new cost projection extends the analysis down to the controller subcomponent level
CEM costs scaled to better reflect operating parameters Based on additional data from Honeywell the compressor‐expander‐motor (CEM) cost analysis was improved to scale dynamically with operating parameters such as power mass flow and pressure ratio
Enlarged Membrane Humidifier The membrane air humidifier was modified to scale based on the actual mass flow rates and to correct a previous membrane area sizing error
Air Precooler and Demister Added Based on interaction with Argonne National Laboratory an air precooler and a demister have been added to the analysis The air precooler lowers the temperature of the compressed air stream to an optimal temperature of 55degC prior to entry into the membrane humidifier The demister removes liquid water droplets from the exhaust gas stream prior to entry into the expander to prevent expander blade erosion
Stack Housing Added A vacuum‐thermoformed polypropylene stack housing has been added as a new component The housing primarily provides physical protection of the stack from liquids road debris and possible electrical shorting contacts but also provides a small amount of thermal insulation
Material and Part Yields Applied Across All Components Material and part yields were applied across every component in the cost model with a newly uniform methodology replacing the previous inconsistent treatment
Improved Wiring Analysis The wiring analysis was examined in greater detail cable lengths were updated by means of examining a more‐detailed system configuration layout and the power and amperage requirements were reassessed for each component Furthermore each cablersquos inclusion in the model is now tied dynamically to the inclusion of the corresponding components
Directed Technologies Inc 5
Assorted BOP Changes Improved cost analysis of many components (hydrogen piping air tubing mass air flow sensor etc)
Miscellaneous Numerous other small changes were made to the fuel cell system cost model the result of which yields a small cumulative net savings Although their net effect is comparatively small the improvements enhance the analysis appreciably and lead to greater confidence in the cost estimates
Figure 1 summarizes the major changes since the 2009 update and the corresponding effects on system cost Figure 2 summarizes the main manufacturing aspects of the two systems analyzed
2010 2015 Change Reason +‐ System Cost +‐ System Cost
Final Values for 2009 Update $6096 $5056 Reconfigured Ejector System Industry input ‐gt removed prop valve amp press
transducer added OPCO amp check valves relies on H2
storage system for some pressure regulation
($483) $5613 ($463) $4593
Improved System Controller DFMA Analysis Improved Cost Analysis by adding greater detail ($170) $5443 ($170) $4423 Lowered channel depth of stamped plates from 092 to 05 mm
Industry input allows gasket material reduction ($103) $5339 ($084) $4339
Changed Temperature at Peak Power from 80degC to 90degC (for 2010) and from 120degC to 99deg (for 2015)
Improved durability allows higher peak temperature ($050) $5289 $085 $4424
Changed Membrane Humidifier to larger model Previous model not large enough to handle mass flow $040 $5329 NA $4424 Added Demister and Air Precooler Added requirement after ANL review $073 $5402 NA $4424 Added Part and Material Yields across all components
Added part yields at component level homogenized methodology
$008 $5410 $007 $4431
Low‐Temperature Coolant Loop reconfigured amp reinserted
Needed for Air Precooler amp CEM but only 39 of LTL cost is included
$077 $5487 NA $4431
Improved Wiring Analysis Improved and updated wire lengths and specifications ($084) $5403 ($063) $4368 CEM costs scaled to better reflect operating parameters
New data from Honeywell improved cost analysis ($065) $5338 ($067) $4301
Assorted BOP Changes Improved Cost Analysis (H2 piping air tubing mass air flow sensor etc)
($209) $5129 ($330) $3971
Miscellaneous Costs Improved Cost Analysis (improved calculations error fixes etc)
$007 $5137 ($025) $3946
Final Values for 2010 Update $5137 $3946
Figure 1 Changes in system costs since 2009 update
Directed Technologies Inc 6
2010 Technology System 2015 Technology System
Power Density (mWcm2) 833 1000
Total Pt loading (mgPtcm2) 015 015
Gross Power (kWgross) 8791 8727
Operating Pressure (atm) 169 15
Peak Stack Temp (degC) 90 99
Active Cells 369 369
Membrane Material Nafion on 25‐micron ePTFE Advanced High‐Temperature Membrane
Radiator Cooling System Aluminum Radiator
WaterGlycol Coolant DI Filter Air Precooler
Smaller Aluminum Radiator WaterGlycol Coolant
DI Filter No Air Precooler
Bipolar Plates Stamped SS 316L with TreadStone Coating Stamped SS 316L with TreadStone Coating
Air Compression Centrifugal Compressor Radial‐Inflow Expander
Centrifugal Compressor No Expander
Gas Diffusion Layers Carbon Paper Macroporous Layer with
Microporous Layer Carbon Paper Macroporous Layer with
Microporous Layer
Catalyst Application Nanostructured Thin Film (NSTF) Nanostructured Thin Film (NSTF)
Air Humidification Tubular Membrane Humidifier None
Hydrogen Humidification None None
Exhaust Water Recovery None None
MEA Containment Injection‐Molded LIM Hydrocarbon MEA FrameGasket around Hot‐Pressed MampE
Injection‐Molded LIM Hydrocarbon MEA FrameGasket around Hot‐Pressed MampE
Coolant amp End Gaskets Laser Welding
Screen‐Printed Adhesive Resin Laser Welding
Screen‐Printed Adhesive Resin
Freeze Protection Drain Water at Shutdown Drain Water at Shutdown
Hydrogen Sensors 2 for FC System
1 for Passenger Cabin (not in cost estimate) 1 for Fuel System (not in cost estimate)
None
End Plates Compression System
Composite Molded End Plates with Compression Bands
Composite Molded End Plates with Compression Bands
Stack Conditioning (hrs) 5 3
Figure 2 Summary chart of the two different systems analyzed
32 System Schematics As the analysis has evolved throughout the course of the annual updates there has been a general trend
toward system simplification This reflects improvements in technology so as not to need as many parasitic supporting systems and facilitates reduced cost Although there has been a small step back in this trend for the 2010 system it is not indicative of a change in trend and merely reflects adjustments in the analysis The path to system simplification is likely to continue and remains necessary for achieving or surpassing the cost parity with internal combustion engines
321 2008 System Schematic The ldquocurrent technologyrdquo system from two years ago (2008) is a fairly standard direct hydrogen pressurized air
fuel cell system configuration It is shown here in order to illustrate the evolution of the system design The 2006 and 2007 configurations are omitted from this report because their schematics are very similar to the 2008 system
Directed Technologies Inc 7
Figure 3 Flow schematic for the ldquocurrent technologyrdquo fuel cell system from 2008
The main features of the 2008 system include
2 separate liquid‐cooled fuel cell stacks plumbed in parallel but connected electrically in series
A twin‐lobe air compressor
A twin‐lobe exhaust air expander
A water spray humidifier to both humidify and cool the inlet cathode air after compression
A liquidgas heat exchanger to condense water in the exhaust stream for recycle to the air humidifier
A high‐temperature coolant loop of waterethylene glycol to maintain a stack temperature of ~80degC
An exhaust loop of waterethylene‐glycol mixture to provide cooling for the exhaust air condenser
o Only 67 of this loop is included in the system cost because the remainder of its duty is for components outside of the scope of this analysis
Twin hydrogen ejectors(high‐flow and low‐flow) to utilize the high pressure (gt 300 psi) in the hydrogen storage tanks to re‐circulate anode hydrogen
Directed Technologies Inc 8
322 2009 System Schematic
Figure 4 Flow schematic for the ldquocurrent technologyrdquo fuel cell system from 2009
The 2009 system is much simpler than that of 2008 and differs in the following key ways
The number of stacks is reduced from 2 to 1
A centrifugal compressor replaces the twin‐lobe compressor
A centrifugal expander replaces the twin‐lobe expander
A membrane humidifier replaces the water spray humidifier
The exhaust gas condenser is eliminated (because there is no need to capture liquid water for the water spray humidifier)
The low‐temperature cooling loop is eliminated (because the condenser has been eliminated)
The high‐temperature radiator is slightly smaller (because the peak operating temperature of the stack has been increased and thus there is a larger temperature difference between the coolant and the ambient temperature)
Directed Technologies Inc 9
323 2010 System Schematic For 2010 the current‐technology system reflects both additions and subtractions to the BOP though there is a
net increase in complexity This increase can be primarily attributed to feedback received from Rajesh Ahuwalia at Argonne National Laboratory suggesting the need for both a demister and an air precooler the latter of which requires the re‐addition of a low‐temperature loop
Figure 5 Flow schematic for the ldquocurrent technologyrdquo (2010) fuel cell system
The 2010 system configuration differs from the 2009 version in the following key ways
The ejector system has been reconfigured with the assumption that the fuel storage system (not included in the cost analysis) handles some of the pressure regulation duties
o The proportional valve has been removed
o The pressure transducer has been removed
o An over‐pressure cut‐off (OPCO) valve has been added
o Check valves have been added
o An inline filter for gas purity excursions has been added
A demister has been added in order to ensure that no ice may form in the expander
Directed Technologies Inc 10
A new low‐temperature cooling loop (different from the one in the 2008 system) has been inserted into the system to cool the previously air‐cooled CEM and the new air precooler It also cools the traction inverter module (TIM) but as this is outside the boundary of this cost analysis the fraction of the LTL cost proportionate to the TIMrsquos cooling duty (61) is excluded from the model
The high‐temperature radiator is once again smaller than the previous year (because the peak operating temperature of the stack has been increased and thus there is a larger temperature difference between the coolant and the ambient temperature)
324 2015 System Schematic In keeping with the general trend of system simplification the 2015 system is the simplest one of all
Figure 6 Flow schematic for the 2015 fuel cell system
It is marked by the following further key configuration changes
The centrifugal compressor shrinks (because the peak cathode air pressure has been further lowered)
The exhaust air expander is eliminated (because the overall cathode air pressure has been reduced and therefore the benefits of an expander are diminished)
The membrane humidifier is eliminated (because an advanced PEM membrane that doesnrsquot require humidification was assumed to be used)
The radiator is further reduced in size (because the stack peak operating temperature is even higher)
Directed Technologies Inc 11
33 System Cost Summaries
331 Cost Summary of the 2010 Technology System Results of the cost analysis of the 2010 technology system at each of the five annual production rates are
shown below Figure 7 details the cost of the stacks Figure 8 details the cost of the balance of plant components and Figure 9 details the cost summation for the system
2010 Annual Production Rate 1000 30000 80000 130000 500000
System Net Electric Power (Output) System Gross Electric Power (Output)
80 8791
80 8791
80 8791
80 8791
80 8791
Bipolar Plates (Stamped) MEAs
$168428 $43415 $43995 $43303 $42907
Membranes $518451 $90884 $56223 $43823 $23078 Catalyst Ink amp Application (NSTF) $125228 $70037 $69557 $69862 $69483 GDLs $214033 $111135 $69153 $53704 $24257 M amp E Hot Pressing $7209 $998 $823 $836 $816 M amp E Cutting amp Slitting $5694 $442 $329 $302 $282 MEA FrameGaskets $46980 $31959 $31195 $30829 $30142
Coolant Gaskets (Laser Welding) $18548 $2648 $2943 $2739 $2554 End Gaskets (Screen Printing) $14948 $508 $197 $125 $054 End Plates $8743 $3355 $2891 $2621 $1986 Current Collectors $1679 $718 $599 $554 $507 Compression Bands $1000 $800 $600 $550 $500 Stack Housing $6144 $754 $644 $587 $516 Stack Assembly $7612 $4069 $3495 $3362 $3206 Stack Conditioning $17088 $5387 $4718 $4138 $2806 Total Stack Cost $1161787 $367108 $287361 $257336 $203092 Total Stack Cost ($kWnet) $14522 $4589 $3592 $3217 $2539 Total Stack Cost ($kWgross) $13216 $4176 $3269 $2927 $2310
Figure 7 Detailed stack cost for the 2010 technology system
Annual Production Rate 1000 30000 80000 130000 500000 System Net Electric Power (Output) 80 80 80 80 80
System Gross Electric Power (Output) 8791 8791 8791 8791 8791 Air Loop $169529 $99072 $83017 $80246 $77035 Humidifier and Water Recovery Loop $165602 $48107 $30035 $24286 $15326 High‐Temperature Coolant Loop $56428 $47815 $40986 $38720 $35691 Low‐Temperature Coolant Loop $10375 $9066 $8101 $7636 $7074 Fuel Loop $25194 $19865 $17049 $16340 $15296 System Controllers $17107 $13685 $10264 $9580 $8211 Sensors $170665 $89300 $65996 $54345 $22549 Miscellaneous $33171 $19412 $17144 $16480 $15669 Total BOP Cost $648071 $346322 $272593 $247633 $196852
Total BOP Cost ($kWnet) $8101 $4329 $3407 $3095 $2461 Total BOP Cost ($kWgross) $7372 $3940 $3101 $2817 $2239
2010
Figure 8 Detailed balance of plant cost for the 2010 technology system
Directed Technologies Inc 12
2010
Annual ProductionRate 1000 30000 80000 130000 500000 System NetElectric Power (Output) 80 80 80 80 80
System Gross Electric Power (Output) 8791 8791 8791 8791 8791 Fuel Cell Stacks $1161787 $367108 $287361 $257336 $203092 Balanceof Plant $648071 $346322 $272593 $247633 $196852 System Assembly ampTesting $15717 $11284 $11091 $11105 $11067 Total SystemCost ($) $1825575 $724714 $571044 $516075 $411011
Total SystemCost ($kWnet) $22820 $9059 $7138 $6451 $5138 Total SystemCost ($kWgross) $20767 $8244 $6496 $5871 $4675
Figure 9 Detailed system cost for the 2010 technology system
332 Cost Summary of the 2015 Technology System Results of the cost analysis of the 2015 technology system at each of the five annual production rates are
shown below Figure 10 details the cost of the stacks Figure 11 details the remaining balance of plant components and Figure 12 details the cost summation for the system
2015Annual ProductionRate 1000 30000 80000 130000 500000
System NetElectric Power (Output) 80 80 80 80 80 System Gross Electric Power (Output) 8727 8727 8727 8727 8727
Bipolar Plates (Stamped) $163429 $38630 $39211 $38517 $38072 MEAs
Membranes $465735 $82711 $50781 $39404 $20421$57371 $57251 $56963 Catalyst InkampApplication (NSTF) $113471 $57848
GDLs $185385 $91689 $56527 $44078 $19686
Mamp EHot Pressing $7129 $683 $654 $594 $595 Mamp ECuttingampSlitting $5655 $390 $276 $250 $219
MEAFrameGaskets $40376 $26306 $25685 $25361 $24804 Coolant Gaskets (LaserWelding) $18480 $2626 $2478 $2444 $2390 End Gaskets (ScreenPrinting) $14948 $508 $197 $125 $053 End Plates $7796 $2702 $2358 $2151 $1646 CurrentCollectors $1508 $624 $516 $477 $436 Compression Bands $1000 $800 $600 $550 $500 Stack Housing $6103 $713 $603 $546 $475 Stack Assembly $7612 $4069 $3495 $3362 $3206 Stack Conditioning $16606 $3511 $2772 $2498 $1684 Total Stack Cost $1055233 $313809 $243524 $217609 $171148 Total Stack Cost ($kWnet) $13190 $3923 $3044 $2720 $2139 Total Stack Cost ($kWgross) $12091 $3596 $2790 $2493 $1961
Figure 10 Detailed stack cost for the 2015 technology system
Directed Technologies Inc
13
Annual Production Rate 1000 30000 80000 130000 500000 System Net Electric Power (Output) 80 80 80 80 80
System Gross Electric Power (Output) 8727 8727 8727 8727 8727 Air Loop $131859 $78605 $65131 $62859 $60472 Humidifier and Water Recovery Loop $000 $000 $000 $000 $000 High‐Temperature Coolant Loop $58252 $49384 $42356 $40006 $36865 Low‐Temperature Coolant Loop $000 $000 $000 $000 $000 Fuel Loop $23374 $18046 $15229 $14520 $13476 System Controllers $17107 $13685 $10264 $9580 $8211 Sensors $2800 $2800 $2800 $2800 $2800 Miscellaneous $30042 $16775 $14731 $14125 $13452 Total BOP Cost $263434 $179296 $150511 $143890 $135276
Total BOP Cost ($kWnet) $3293 $2241 $1881 $1799 $1691 Total BOP Cost ($kWgross) $3018 $2054 $1725 $1649 $1550
2015
Figure 11 Detailed balance of plant cost for the 2015 technology system
2015 Annual Production Rate 1000 30000 80000 130000 500000
System Net Electric Power (Output) 80 80 80 80 80 System Gross Electric Power (Output) 8727 8727 8727 8727 8727
Fuel Cell Stacks $1055233 $313809 $243524 $217609 $171148 Balance of Plant $263434 $179296 $150511 $143890 $135276 System Assembly amp Testing $13055 $9372 $9212 $9224 $9192 Total System Cost ($) $1331722 $502477 $403247 $370723 $315616
Total System Cost ($kWnet) $16647 $6281 $5041 $4634 $3945 Total System Cost ($kWgross) $15259 $5757 $4620 $4248 $3616
Figure 12 Detailed system cost for the 2015 technology system
34 Cost Comparison of the Two Systems The stack and system costs for both technology levels are compared in Figure 13 and Figure 14 All three
technology levels experience an initial steep drop in price with the ldquoknee of the curverdquo at around 50000 systems per year While each technology level represents a combination of configuration and performance improvements the system cost reductions are primarily due to balance of plant configuration changes and the stack cost reductions are primarily due to power density and catalyst loading improvements Consequently the cost curves have very similar shapes but vary in amplitude according to cell performance and loading Very little stack cost change is observed between 2010 and 2015 because stack performance and catalyst loadings are not expected to change
Directed Technologies Inc 14
Figure 13 Gross stack cost vs annual production rate
Figure 14 Net system cost vs annual production rate
Directed Technologies Inc 15
4 Detailed Assumptions
41 System Performance and Operation The fuel cell stacks contained within each of the three technology level systems are identical in most design
and operational parameters differing only in active area per cell and stack gross power However the stack gross power is nearly constant 8791 kW and 8727 kW for 2010 and 2015 respectively The slight differences are primarily the result of differences in the air compression load which in turn results from different air compression approaches and levels of pressurization Figure 15 details the efficiency pressure and mass flow assumptions that were used to calculate expected air compressor motor power Note that the fuel cell system needs to supply 80 kWnet under all conditions and thus air compression for peak system power must be evaluated at the most adverse temperature (40degC ambient) Figure 16 summarizes total system parasitic loads
2010 2015
Gross Power kW 8791 8727 Air Mass Flow kgh 411 327
Peak Stack Operating Pressure atm 169 150 Compression Ratio atm 178 150
Compression Efficiency 75 80 Ambient Temperature degC 40 40
Compressor Shaft Power Req kW 861 440
Mass Flow kgh 417 Compression Ratio atm 148
Compression Efficiency 80 Starting Temperature degC 80
Expander Shaft Power Out kW 377
MotorController Efficiency 85 85 CEM Input Power kW 569 517
No expander in 2015 System
Compressor‐Expander Unit
Compressor
Expander
Figure 15 Basis of air compressor and expander power
(All values in kW) 2010 2015 Fuel Cell Gross Electric Power (Output) System Net Electrical Power (Output)
8791 80
8727 80
Air Compressor Motor Coolant Pump Coolant Radiator Fan Exhaust Radiator Fan Other (Controller Instruments etc)
569 11 090 000 01
517 11 090 000 01
Total Parasitic Loads 791 727 Figure 16 Power production amp loads at max power under peak ambient temp operating conditions
Stack design parameters and operating conditions are summarized in Figure 17 and Figure 18 All systems operate with low single‐pass hydrogen utilization but high total utilization due to a hydrogen recirculation loop
Directed Technologies Inc 16
2010 2015 Number of Stacks per System 1
Number of Active Cells per Stack 369
Number of Cooling Cells per Stack 371
Cell Voltage at Max Power 0676
Membrane Power Density at Max Power (mWcm2) 833 1000
This is perhaps misleading because every plate is half active half cooling (except for the ones that bookend the stack which have coolant on one face and nothing on the other)
Figure 17 Stack design parameters
2010 2015 Peak Operating Pressure (atm) 17 15 Cell Temperature (degC) 90 99 Oxygen Stoichiometry Anode Gas Stream
25 20
Hydrogen Purity 99999 (molar basis) Inlet Temperature (degC) Ambient + ~10degC Relative Humidity 0
790 878 Max (single pass) H2 flowrate (kghr) Cathode Gas Stream Oxygen Purity 21 (molar basis) Inlet Temperature (degC) 75degC Relative Humidity 67 3 Max (single pass) Air flowrate (kghr) 49870 44337 Figure 18 Stack operation parameters
The power density (listed in Figure 17) drives the active area used in the stack geometry so it directly affects the material quantities thereby having a major effect on the system cost This geometry (Figure 19) describes everything between the end plates The table in Figure 20 lists the numerical values of these dimensions
Directed Technologies Inc 17
Figure 19 Cell geometry
2010 2015 Active Area (cm2
) 28584 23652 Active Width (cm) Active Height (cm)
2071 1380
1884 1256
M amp E (Catalyzed) Area (cm2) 886 666
M amp E (Catalyzed) Width (cm) M amp E (Catalyzed) Height (cm)
055 29470
042 24317
Total Area (cm2) 35730 29565
Total Width (cm) Total Height (cm)
2267 1576
2062 1434
Ratio of Width to Height Ratio of Active Area to Total Area Inactive Border (cm)
15 08 098
15 08 089
Figure 20 Cell dimensions
42 Manufacturing Cost Manufacturing cost comprises three elements
Machine Costs
Secondary Operation Costs
Directed Technologies Inc 18
Tooling Costs
It is defined as the total cost of performing a manufacturing process on a material or component Machine cost is the total cost of operating a manufacturing machine (eg stamping press injection‐molding machine lathe etc) and includes amortization of the machine capital cost machine maintenance labor and utilities to operate the machine Secondary Operation costs are minor process costs incurred in association with a major machine operation (eg anodizing after metal stamping) Expendable tooling (dies molds etc) costs are historically calculated separately from machine costs since manufactures often supply tooling to outside vendors9 but pay them only for use of the processing machinery
Machine cost is determined by multiplying machine rate (dollars per minute of machine time) times minutes of machine use Machine rates typically range from $100 to $300 per minute depending on the complexity of the machine maintenance costs and intensity of utilities Typical DFMA methodology uses historical or actual data to determine machine rates for a given class and size of machine For example a 300‐ton injection‐molding machine might have an all‐inclusive machine rate of $24min and a 1200‐ton molding machine might have a rate of $33min However these historical machine rates assume high machine utilization typically 14 hours per day 240 workdays per year Consequently such data is of limited value to this study as it fails to address the cost implications of low annual production rates
To estimate machine rates at less than full machine utilizations the machine rate is broken down into five components
Capital amortization
Maintenancespare‐part costs
Miscellaneous Expenses
Utility costs
Machine labor
An overall machine rate is obtained by adding these five component costs over a yearrsquos operation and then dividing by the total minutes of actual machine run time
Capital Amortization The annual payment necessary to cover the initial capital cost of the machine is calculated by multiplying a fixed rate charge (FRC) times the capital cost The fixed rate charge is merely the annual fraction of uninstalled capital cost that must be paid back adjusted for the interest rate (typically 15 to achieve a 10 after‐tax return) machine lifetime (typically 7 to 15 years) corporate income tax rate (typically 40) with further adjustment for equipment installation costs (typically 40 of machine capital cost)
MaintenanceSpare Parts This is the fraction of uninstalled capital costs paid annually for maintenance and spare parts (typically 5ndash20)
Miscellaneous Expenses This is the fraction of uninstalled capital costs paid annually for all other expenses (typically 7)
Utility Costs These are the costs associated with machine electricity natural gas etc typically computed by multiplying the kW of machine power times the electricity cost (typically $008kWh)
9 Historically automakers purchase expendable tooling separately and then supply the tooling to subcontractors It this way should a labor dispute develop the automaker is (theoretically) able to retrieve the tooling and have the parts produced elsewhere
Directed Technologies Inc 19
Machine Labor Cost of machine operator labor Following automotive practices US labor rates are generally $050 to $100 per minute depending on the level of skill required All cases in this analysis use the median of those two values a rate of $075min ($45hr) Prior to the 2008 Update report the analysis used the rate of $1min For some processes non‐integer numbers of laborers were used per line (for instance 025 is used for the injection‐molding process) because workers do not need to devote 100 of their time to it and can perform other tasks over the course of their workday Note that manufacturing labor is only paid for time that the operator works Thus if a machine is only run for an average 3 hours per day only 3 hours per day of labor costs are incurred
Machine Utilization Machine utilization is determined by dividing the total runtime needed per year (including setup) by the number of simultaneous production lines needed For example if there is 15 lines worth of work and there are two lines each machine is assumed to run 75 of the time Full utilization is typically defined as 14 useful hours per day 240 workdays per year
Machine Setup Time The inclusion of machine setup time in determining the labor cost is a factor that contributes more significantly at lower production rates However due to the high number of repeat parts (such as bipolar plates or MEA gaskets) machine utilization is generally high even at low system annual production rates
Tooling Costs Tooling costs vary based on the rate of wear of the parts according to the number of machine cycles required and the properties of the materials involved Injection molding with abrasive carbon powder fillers will wear down tooling faster than if it were neat silicone From the total number of parts required per year an annual cycle count is determined for the machine and the number of tooling sets needed in the machinersquos lifetime can be calculated This is divided by the machine lifetime to determine the annual tooling cost per line It is calculated this way to account for usable tooling being leftover at the start of the following year
421 Machine Rate Validation To demonstrate the validity of the approach for the machine rate calculation described above Figure 21 plots
the calculated injection‐molding machine rate against two sets of injection‐molding machine rate data The first set of data comes from Boothroyd Dewhurst Inc (BDI) and is the estimated machine rate for 15 specific injection‐molding machines of various sizes The second set of data comes from Plastics Technology magazine and represents the average machine rate from a 2004 survey of injection‐molders (79 respondents) Excellent agreement is achieved between the DTI machine rate calculations and the BDI data10 The data from Plastics Technology (PT) magazine differs substantially from both the DTI estimates and the BDI data However the PT data has very large error bars indicating substantially variation in the vendor reported machine rate probably from inconsistent definition of what is included in the machine rate It is noted that the DTI estimates are conservative for large machines overestimating machine rate as compared to the PT survey data but underestimating rates at the lower machine sizes The PT survey data is judged significant at low machine sizes because it represents a minimum machine rate industry receives Consequently to achieve conservative estimates throughout a $25hr minimum machine rate was imposed for all machines (not just injection‐molding machines) This is consistent with previous guidance DTI has received from Ford Motor Company wherein the rule of thumb was never to let machine rate drop below $1min (including labor) for any process
Figure 22 plots the effective machine rate as a function of machine utilization As shown machine rates climb to very high levels when only used a fraction of the time11 This is a direct consequence of the annual capital cost repayment needing to be collected even if the machine is used infrequently
10 The BDI data contains one anomalously high data point at approximately 800 tons of clamping force This point appears to be real and corresponds to the largest machine in a manufacturerrsquos lineup
11 Full utilization is defined as 14 hours per day 240 days per year
Directed Technologies Inc 20
For each component manufacturing or assembly task the batch volume machine setup time and time to complete the task were computed using the above described DFMA techniques After applying the tooling and secondary operations costs and the labor and machine rates the total cost for the component is calculated A second detailed example of machine rate calculation occurs in section 4412 and describes the metal bipolar plate stamping costing process
Ma
ch
ine
Ra
te (w
ith
ou
t la
bo
r) $
hr
1000
BDI Machine Rate Data wo labor
PT Survey Machine Rate wo
100 labor DTI Machine Rate wo labor
DTI Machine Rate with Minimum amp wo labor
10
Figure 21 Injection‐molding machine rate vs machine clamping force
10 100 1000 10000
Machine Clamping Force US tons
Directed Technologies Inc 21
Ma
ch
ine
Ra
te $
hr
$2000
$1800
$1600
$1400
$1200
$1000
$800
$600
$400
$200
$0
0 20 40 60 80 100
Machine Utilization (of 14 hr day) Figure 22 Machine rate vs machine utilization
422 Material and Part Yields For the 2010 analysis material and part yield percentages (or inversely scrap percentages12) were added to all
componentsprocesses The material yield accounts for the scrap material lost in manufacturing for each part and the part yield estimates the number of whole parts lost to defects in the manufacturing process Material yields are typically much lower than part yields which approach unity for well‐refined high‐volume production lines
The yield percentages applied in this analysis are DTI estimates based on experience with industrial yields in previous work Figure 23 shows the yields for each process As the number of vehicles per year increases part yields increase due to the improved manufacturing success associated with numerous repeat parts
12 The yield represents what is left after the scrap has been subtracted so a yield rate of 95 corresponds to a scrap rate of 5
Directed Technologies Inc 22
Figure 23 Material and part yield percentages applied
Prior to 2010 the analyses for many of the most important components (eg the catalyst ink) accounted for one or both type of yield though there were some that did not Fortunately for the validity of the previous yearsrsquo analyses the change resulted in a mere $008kWnet cost increase across the entire system Despite the small cost impact this improvement succeeded in improving the realism and fidelity of the model
43 Markup Rates Markup rates are percentage increases to the material manufacturer and assembly cost to reflect the costs
associated with profit general and administrative (GampA) expenses research and development (RampD) expenses and scrap The markup percentage varies with manufacturing rate and with what is actually being marked up However to provide cost estimates consistent with other cost studies conducted for the Department of Energy
Directed Technologies Inc 23
no markup rates have been applied for this cost study Thus the costs presented are ldquobarerdquo costs of manufacture and assembly The factors that affect the markup rate are discussed below to give the reader some idea of the approximate magnitude of the markup rates under various circumstances In general the higher the manufacturingassembly rate the lower the markup to reflect the increased efficiencies of business operations and ability to amortize costs over a large base of products
Whether a company is vertically integrated or horizontally integrated affects overall markup rate In a vertically integrated company every step in the production process (from the acquisition of base materials to the final assembly) is completed ldquoin‐houserdquo by the company In a horizontally integrated company components andor subassemblies are fabricated by subcontractors and typically only the final assembly is conducted by the company Completely vertical or horizontal integration is quite rare but most companies are predominately one or the other
Whenever a part or process is subcontracted both the lower‐tier subcontractor as well as the top‐level company applies a markup This is reasonable since both companies must cover their respective costs of doing business (GampA scrap RampD and profit) However the numerical markup for each company can and should be different as they are adding different levels of value and have (potentially) different cost bases There is a distinction made between activities that add value (such as actual manufacturing or assembly steps) and mere product ldquopass‐throughrdquo namely the organization earns profit on value‐added activities and no profit on mere pass‐through (An example is a firm hired to do assembly work they justifiably earn profit on the value‐adding step of assembly but not on the material cost of the components they are assembling However there are real costs (GampA RampD scrap) associated with product pass‐through and the manufacturerassembler must be compensated for these costs)
Figure 24 displays some representative markup rates for various situations While the figure attempts to explain how and where markups are applied there are many exceptions to the general rule Different markup rates are used for different components because the type and quantity of work lend themselves to lower overhead costs MEA manufacturing markups are set at much higher rates to reflect the higher risks both technical and business of an evolving technology Markups are often accumulative as the product moves from manufacturer to sub‐system assembler to final assembler However in the case of the MEA the car company may be assumed to supply the raw materials so that the MEA manufacturerrsquos markup is only applied to the MEA manufacturersquos added value13 and not to the material cost
Annual Production Rate 1000 30000 80000 130000 500000 Fuel Cell Components Manufacturerrsquos Markup 27 ‐ 355 25 ‐ 355 25 ‐ 355 25 ‐ 355 25 Integratorrsquos Pass Through 30 21 20 20 19
MEA Manufacturers Markup 70 70 60 50 35 Auto Company Final Markup 37 265 235 20 15
2010 ‐ 2015
Figure 24 Representative markup rates (but not applied to cost estimates)
44 Fuel Cell Stack Materials Manufacturing and Assembly Cost estimates for fuel cell stacks were produced using detailed DFMA‐style techniques Each subcomponent
of the stack was independently considered with materials and manufacturing costs estimated for each Costs were estimated for the assembly of the gasketed membrane electrode assemblies (MEAs) and the stack Figure
13 This method is directed analogous to catalytic converter manufacture in the automotive industry the auto manufacturer supplies the expensive catalyst to the catalytic converter manufacturer specifically to avoid the extra markup rate that otherwise would occur
Directed Technologies Inc 24
25 displays an abridged view of the stack components and Figure 26 shows a cross‐sectional view of an assembled stack
Figure 25 Exploded stack view (abridged to 2 cells for clarity)
Directed Technologies Inc 25
Figure 26 Stack cross‐section
441 Bipolar Plates Each stack in the system consists of 369 active cells each of which contains two bipolar plates A 11 ratio of
active cells to cooling cells was assumed in order to ensure stack temperature uniformity Consequently one side of bipolar plate is a cooling cell flow field and the other side is an active cell flow field In previous estimates the cathode and anode flow field sides of the bipolar plates were envisioned as having identical flow patterns and being symmetrical Consequently only one bipolar plate design was needed and the cells could be flipped 180deg to alternate between cathode flow fields and anode flow fields However based on feedback from Ballard Power Systems unique designs were assumed for the anode and cathode plates An extra bipolar plate sits at each end of the stack and is not part of the repeating cell unit It is only half‐used as it does only cooling End gaskets are used to block off the flow into the gas channel side of those plates The total number of plates in a stack is therefore 740 369 active cells 2 plates per cell + 2 coolant‐only plates 1 stack14 Because each system contains 740 bipolar plates there are hundreds of thousands of plates needed even at the lowest production rate This means that bipolar plate mass‐manufacturing techniques remain appropriate across all production rates
14 In previous years there were multiple (smaller) stacks per system
Directed Technologies Inc 26
Two different concepts were examined for the bipolar plate injection‐molded carbon powderpolymer and stamped stainless steel Recent industry feedback has suggested that metallic plates may provide an advantage in conductivity over carbon plates but for now equivalent polarization performance is assumed between the two designs The stamped metal plates were selected because of consistent industry feedback suggesting that this is the most common approach
4411 Injection‐Molded Bipolar Plates Injection‐molded bipolar plate costs are based on a conceptual injection‐molded manufacturing process using
composite materials Such a composite is composed of a thermoplastic polymer and one or more electrically conductive filler materials In this analysis the composite is carbon powder in polypropylene at a volume ratio of 4060 carbonpolymer To date similar materials have been successfully molded to form bipolar plates with sufficient conductivity for fuel cell use15 The primary advantage of injection molding over compression molding is a shorter cycle time resulting in lower labor and machine costs However technical challenges likely exist in order to achieve adequate electrical conductivity using the assumed injection‐molding process Injection molding details are shown in Figure 27 and Figure 28
Figure 27 Injection‐molding machine cost vs clamp force
15 Multiple companies have successfully compression andor injection‐molded of thermoset andor thermoplastic bipolar plates Los Alamos National Laboratory International Fuel Cell (IFC) Quantum injection‐molding of PEMTEX thermoset material (formerly) Energy Partners Zentrum fur Brennstoffzellen Technik (ZBT) GmbH and Micro Molding Technology LLC
Directed Technologies Inc 27
Annual Production Rate 1000 30000 80000 130000 500000 Capital Cost ($Line)
Costs per Tooling Set ($) Tooling Lifetime (cycles)
Simultaneous Lines Laborers per Line
Line Utilization Cycle Time (s)
CavitiesPlaten Effective Total Machine Rate ($hr)
Carbon Filler Cost ($kg)
$174621 $42704 300000
1 025 934 243 4
$91891 $667
$463497 $112697 300000
4 025 $088 307 16
$75124 $667
$463497 $112697 300000
10 025 $094 307 16
$74691 $667
$463497 $112697 300000
16 025 $095 307 16
$74589 $667
$463497 $112697 300000
59 025 $099 307 16
$74322 $667
2010
Capital Cost ($Line) Costs per Tooling Set ($) Tooling Lifetime (cycles)
Simultaneous Lines Laborers per Line
Line Utilization Cycle Time (s)
CavitiesPlaten Effective Total Machine Rate ($hr)
Carbon Filler Cost ($kg)
$158005 $42704 300000
1 025 934 243 4
$89549 $667
$397035 $112697 300000
3 025
9303 243 16
$73796 $667
$397035 $112697 300000
8 025
9294 243 16
$73802 $667
$397035 $112697 300000
13 025
9294 243 16
$73802 $667
$397035 $112697 300000
47 025
9887 243 16
$73460 $667
2015
Figure 28 Bipolar plate injection‐molding process parameters
As shown in Figure 30 costs are seen to vary between roughly $3kWnet and $5kWnet Cost reduction for each of the advanced technology cases is due to higher power density leading to smaller plate area Injection‐molding machine cost is the main contributor accounting for ~75 of bipolar plate cost Materials and tooling contribute ~15 and ~10 respectively Since polypropylene is very inexpensive the electrically conductive carbon powder filler is the main contributor to material cost The conductive filler is assumed to be high‐purity carbon black Fuel cell manufacturers using polymer plates keep the exact proportions and material specifications as trade secrets but may use a mix of multiple fillers some possible very expensive For this analysis however a high fill fraction (40 by volume) and medium price ($635kg based on a quote for Vulcan XC‐72) were adopted as cost‐representative bases for our non‐proprietary cost estimates Since the carbon black market is quite mature and substantial amounts of powder are needed even for low system production rates a price decrease with high production rates is unlikely Consequently the carbon filler material cost of $635kg is fixed for all production rates
Annual Production Rate 1000 30000 80000 130000 500000 Equipment Lifetime
Interest Rate Corporate Income Tax Rate
Capital Recovery Factor Equipment Installation Factor
MaintenanceSpare Parts ( of CC) Miscellaneous Expenses ( of CC)
Power Consumption (kW)
15 10 40 0159 14 10 12 830
15 10 40 0163 14 10 12 1896
15 10 40 0163 14 10 12 1896
15 10 40 0163 14 10 12 1896
15 10 40 0163 14 10 12 1896
5
201
2010 ‐
Figure 29 Machine rate parameters for bipolar plate injection‐molding process
Directed Technologies Inc 28
Annual Production Rate 1000 30000 80000 130000 500000 Materials ($stack) $7818 $7818 $7818 $7818 $7818
Manufacturing ($stack) $28837 $29642 $29444 $29404 $29299 Tooling ($stack) $058 $020 $020 $020 $020
Total Cost ($stack) $36713 $37480 $37282 $37242 $37136 Total Cost ($kWnrt) $459 $468 $466 $466 $464 Materials ($stack) $6545 $6545 $6545 $6545 $6545
Manufacturing ($stack) $28103 $23066 $23047 $23047 $22940 Tooling ($stack) $058 $020 $020 $020 $020
Total Cost ($stack) $34706 $29632 $29613 $29613 $29505 Total Cost ($kWnrt) $434 $370 $370 $370 $369
2015
2010
Figure 30 Cost breakdown for injection‐molded bipolar plates
4412 Stamped Bipolar Plates Sheet metal stamping is an alternate method for the production of bipolar plates suspected to be employed
by General Motors for their fuel cell stacks16 Since 740 plates are needed per system and multiple features are required on each plate (flow fields manifolds etc) progressive die stamping is the logical choice In progressive die stamping coils of sheet metal are fed into stamping presses having a series of die stations each one sequentially imparting one or more features into the part as the coil advances The parts move through the stationary die stations by indexing and a fully formed part emerges from the last station Figure 31 displays a simplified drawing of progressive die operations
Figure 31 Bipolar plate stamping process diagram
16 The composition and manufacturing method for production of General Motors bipolar plates is a trade secret and is not known to the authors However a review of GM issued patents reveals that they are actively engaged in metallic plate research
Directed Technologies Inc 29
Costs for bipolar plate progressive die stamping were obtained following the standard DTI methodology described above In summary capital cost maintenance cost and power requirements were correlated between manufacturer quotes and survey data supplied within BDI proprietary software These data were then used to estimate true annual operating costs when operated at less than full capacity The cost estimation process and assumptions are described more fully below
Capital Cost and Press Tonnage Clamping force is the primary sizing and pricing parameter of a metal forming press Price quotes and performance data for AIRAM pneumatic presses ranging from 50 tons to 210 tons were curve‐fit to yield approximate purchase cost as a function of press tonnage The cost of supporting equipment required for press operation was then added to the base press cost Some of the supporting equipment has a fixed cost regardless of press size while other equipment scales in cost A sheet metal coil feeder was judged necessary and was costed largely independent of press size To insure part accuracy a sheet metal straightener17
was added although it may prove to be ultimately unnecessary due to the thin material used (762 microns or 3 mils) Typical capital costs are shown in Figure 32
Component Cost Stamping Press $33007
Air Compressor $17461
ATC‐10070 Control $3498
Stand $6044
Vibration Mounts $1320
Reel $6668
Loop Control $2215
Servo Feed $7306 Misc Add‐Ons $1091
Total Capital Cost $78611 times 5 = $393057
Feeding Equipment
Accesories
Figure 32 Capital costs breakdown for a typical bipolar plate stamping production line
In the 2006 report it was estimated that a 65‐ton press18 was necessary to produce the bipolar plates19 However it was noted that there was disagreement in the bipolar plate stamping community regarding the necessary press tonnage to form the plates20 with one practitioner stating that a 1000‐ton press was needed
Subsequent review by Ballard suggested that the previously estimate for total stamping system capital cost was substantially too low either due to press tonnage or supporting equipment differences Consequently estimated capital cost was increased five‐fold to better reflect reality The net effect of this change is relatively minor as it only increases the system cost by about $02kWnet (at high production) This crude multiplier yields a capital cost estimate less satisfying than the itemized listing previously presented
Press Speed The speed of the press (in strokes per minute) varies with press size (tons) a small press is capable of higher sustained operating speeds than a large press Press speed is correlated to press size and is shown in Figure 33
17 Email and telephone communication with Rick Meyer of AIRAM Press Co Covington Ohio 18 Press force figure corroborated by Dan Connors of GenCell Corporation 19 This press tonnage reflects the total press force of all four die stations forming a ~400 cm2 bipolar plate 20 Some flow fields require increased swaging of metal to form non‐uniform thickness plates whereas others require only bending of a
uniform thickness plate
Directed Technologies Inc 30
Str
ok
es
pe
r Min
ute
90
80
70
60
50
40
30
20
10
0
Curve Fit Strokesmin = 57439Force(kN)^-03267
0 500 1000 1500 2000 2500
AIRAM Data
Curve Fit
Stamping Press Force (kN) Figure 33 Press speed vs press force
Maintenance Given that the majority of the wear parts are shared across models the faster operating presses tend to require maintenance more frequently The minimal life of the set of these wear parts was estimated at 10 million cycles21 with a total replacement cost estimated at 20ndash25 of complete press initial capital cost22 depending on machine size Since the above cycle life is the minimum number of cycles but could be substantially more maintenance cost of the press is estimated to be 15 of initial press capital cost every 10 million cycles This deviates from DTIrsquos normal methodology which estimates maintenance costs as a percentage of initial capital per year rather than per cycle Likewise feeder equipment maintenance is estimated to be 5 of initial feeder capital cost every 10 million cycles23
Utilities The principal power consumer in the progressive die process train is the air compressor for the pneumatic press and the coil feeder24 Compressor power is a function of the volumetric airflow requirement of each press size and was estimated to vary between 19 kW at the low end (50‐ton press) and 30 kW at the high end (210‐ton press) Power consumption is curve‐fit to press size
Machine Rate Using the above information on total line capital cost maintenance and utilities machine rates curves can be generated for various size presses at varying utilization Basic input parameters are summarized in Figure 35 and Figure 36
Die Cost Die costing is estimated according to the equations outlined in the Boothroyd and Dewhurst section on sheet metal stamping As expected complex stamping operations require more intricate and therefore more expensive dies The first two and final press steps are simple punching and sheering operations and therefore
21 Email and telephone communication with Rick Meyer of AIRAM Press Co Covington Ohio 22 Email and telephone communication with Rick Meyer of AIRAM Press Co Covington Ohio 23 Although the anticipated longevity of the feeder equipment is much higher than that of the presses it was assumed that feed
equipment maintenance would take place concurrently with the press maintenance 24 The solenoid valves and controller unit each consume less than 50 watts and are therefore negligible for costing purposes
Directed Technologies Inc 31
do not require expensive dies The flowpath‐forming step involves forming a complex serpentine shape which requires a highly complex die that is significantly more expensive than the dies for other steps in the process This step also requires the majority of press force The die cost figures are listed below in Figure 34 (under ldquoToolingrdquo)
Annual Production Rate 1000 30000 80000 130000 500000 Materials ($stack) $21708 $21708 $21708 $21708 $21708
Manufacturing ($stack) $15847 $1889 $1695 $1650 $1610 Tooling ($stack) $9994 $8852 $8869 $8939 $8897
Secondary Operations Coating ($stack) $120880 $10966 $11723 $11005 $10692 Total Cost ($stack) $168428 $43415 $43995 $43303 $42907
Total Cost ($kWnet) $2105 $543 $550 $541 $536 Materials ($stack) $17962 $17962 $17962 $17962 $17962
Manufacturing ($stack) $15718 $1860 $1668 $1623 $1521 Tooling ($stack) $9637 $8535 $8552 $8620 $8590
Secondary Operations Coating ($stack) $120113 $10272 $11028 $10311 $9998 Total Cost ($stack) $163429 $38630 $39211 $38517 $38072
Total Cost ($kWnet) $2043 $483 $490 $481 $476
2010
2015
Figure 34 Cost breakdown for stamped bipolar plates
Die Life Over time the repetitive use of the dies to form the metallic bipolar plates will cause these tools to wear and lose form Consequently the dies require periodic refurbishing or replacement depending on the severity of the wear Based on communication with 3‐Dimensional Services Inc dies for progressive bipolar plate stampings were estimated to last between 400000 and 600000 cycles before refurbishment and may be refurbished 2 to 3 times before replacement Thus a die lifetime of 18 million cycles (3 x 600000) was specified with a die cost of $214149 ($100000 of which is from the two refurbishments at $50000 each)
Annual Production Rate 1000 30000 80000 130000 500000
2010 ‐2015
Equipment Lifetime 15 15 15 15 15
Interest Rate 10 10 10 10 10
Corporate Income Tax Rate 40 40 40 40 40
Capital Recovery Factor 0175 0175 0175 0175 0175
Equipment Installation Factor 14 14 14 14 14
MaintenanceSpare Parts ( of CC) 13 13 13 13 13
Miscellaneous Expenses ( of CC) 2 2 2 2 2 Power Consumption (kW) 166 166 166 166 166
Figure 35 Machine rate parameters for bipolar plate stamping process
Directed Technologies Inc 32
Annual Production Rate 1000 30000 80000 130000 500000
2010
Capital Cost ($Line) $393057 $393057 $393057 $393057 $393057 Costs per Tooling Set ($) $214149 $214149 $214149 $214149 $214149 Tooling Lifetime (cycles) 1800000 1800000 1800000 1800000 1800000
Simultaneous Lines 1 3 7 11 41 Laborers per Line 025 025 025 025 025
Line Utilization 814 8127 9286 9603 9909 Cycle Time (s) 062 062 062 062 062
Effective Total Machine Rate ($hr) $57914 $6917 $6208 $6044 $5895 Stainless Steel Cost ($kg) $1283 $1283 $1283 $1283 $1283
2015
Capital Cost ($Line) $390236 $390236 $390236 $390236 $390236 Costs per Tooling Set ($) $206498 $206498 $206498 $206498 $206498 Tooling Lifetime (cycles) 1800000 1800000 1800000 1800000 1800000
Simultaneous Lines 1 3 7 11 39 Laborers per Line 025 025 025 025 025
Line Utilization 773 7710 8809 9110 9882 Cycle Time (s) 061 061 061 061 061
Effective Total Machine Rate ($hr) $60532 $7181 $6439 $6267 $5874 Stainless Steel Cost ($kg) $1283 $1283 $1283 $1283 $1283
Figure 36 Bipolar plate stamping process parameters
44121 Alloy Selection and Corrosion Concerns One of the challenges presented by using metallic plates is that they are more susceptible to corrosion than
carbon‐based plates For this reason alloy selection is very important There is much uncertainty in the fuel cell community as to which alloy and surface treatments are needed to provide adequate corrosion resistance Although some believe that suitable stainless steel alloys exist that adequately address this problem others insist that protective coatings are necessary If the right coating method were selected it may be possible to use a cheaper andor lighter (but less corrosion‐resistant) material for the plates which could help offset the cost of coating In determining the coating method andor plate material consideration must be given to the different corrosion environments each plate will encounter hydrogen and coolant for the anode plates and oxygen and coolant for the cathode plates
Literature and patent reviews and conversations with researchers indicate that coatingssurface treatments may not be needed and that 316L stainless steel (or another commercial alloy of similar cost) is appropriate However further input from the USCAR Fuel Cell Technical Team suggested that coatings are necessary Because of this uncertainty both options were examined At the direction of the Fuel Cell Tech Team coatings were included in the system cost for all three technology levels and the effects of this inclusion were studied in the sensitivity analysis (page 107) The baseline system configurations specify 762‐micron (3‐mil) stainless steel 316L alloy metallic bipolar plates coated using a proprietary process from TreadStone Technologies Inc
The argument for uncoated plates is supported by the following two primary data sources
Published in 2000 Davies25 and fellow researchers at Loughborough University UK fabricated and tested bipolar plates of three uncoated stainless steel alloys26 (904L 310 and 316L) Contact resistance testing and multi‐thousand hour endurance tests in a functioning cell were conducted They concluded that 904L performs
25 DP Davies PL Adcock M Turpin SJ Rowen ldquoStainless steel as a bipolar plate material for solid polymer fuel cells Journal of Power Sources 86 (2000) 237‐242
26 An additional plate of 316 SS with a proprietary coating was also tested This plate demonstrated superior cell polarization performance but was not tested for thousands of hours as were the other samples
Directed Technologies Inc 33
better than 310 which performs better than 316L with the polarization differences attributable to variation in thickness of the oxide films Analysis showed no surface deleterious effects and no evidence of corrosion They summarized by stating that ldquoby optimizing the chemical composition of the alloy it would be feasible to use uncoated stainless steel bipolar plates to provide low cost fuel cell systems with power densities approaching that observed with graphiterdquo Recent communication with one of the co‐authors27 reveals that their 2000 paper was the last the team published in the series before forming Intelligent Energy (wwwintelligent‐energycom) all current research is proprietary and hence unavailable
Makkus28 et al at the Netherlands Energy Research Foundation have also done comparative corrosion and performance testing of metallic bipolar plates They examined seven alloys29 (including 316 317LMn 321 926 3974 and two proprietary alloys) Testing revealed varying levels of corrosion and an influence of alloy pre‐treatment methods Overall they conclude ldquoThe results indicated alloy B to be most suited for application in an SPFC as it shows the lowest contact resistance and it yields a contaminant level comparable to alloy Ardquo Recent communication with a co‐author30 indicates that alloy B is a commercially available high chromium alloy (containing some Molybdenum) Additionally the recommended ldquoadjusted pre‐treatmentrdquo is a small modification of the standard pickling31 process wherein the acid pickling solution is heated to a temperature above 50degC
In spite of evidence supporting the conclusion that bipolar plate coatings are not necessary when using 316L and similar alloy stainless steels there is still some debate as to whether or not this is true One question behind the skepticism on this issue is how the plates will perform in the long term under non‐steady state conditions CH Wang from TreadStone points out that even if stainless steel alloys are sufficiently corrosion resistant they will typically have unacceptable contact resistance due to the extra chromium content required The bipolar plate ldquoHoly Grailrdquo Wang said is to find an aluminum alloy that would work as it would be cheaper lighter and more corrosion‐resistant than any steel plate32
In the absence of a definitive answer the potential cost of applying protective coatings was examined and at the direction of the Tech Team this cost was included this cost in the estimates
44122 Bipolar Plate Surface Treatments and Coatings There are a variety of methods for providing bipolar plate corrosion resistance that are either under
investigation or currently being employed in the fuel cell industry Most of these methods fall into one of the following categories
Nitriding surface diffusion of nitrogen into steel surface typically via nitrogen or ammonia at ~550degC to form chromium nitride (or aluminum nitride in the case of aluminum plates)
27 Private communication PL Adcock April 2007 28 Robert D Makkus Arno HH Janssen Frank A de Bruijn Ronald KAM Mallant ldquoUse of stainless steel for cost competitive bipolar
plates in the SPFCrdquo Netherlands Energy Research Foundation Journal of Power Sources 86 (2000) 274‐282 29 A coated plated was also partially tested However only initial performance results as opposed to performance after 3000 hours of
operation were reported Consequently the conclusions in the Davies paper focus on the uncoated alloy results since a more comprehensive view of performance was obtained
30 Private communication Robert Makkus Netherlands Energy Research Foundation April 2007 31 Standard pickling treatment is defined as a room temperature bath of a sulfuric acid hydrochloric acid and HF solution 32 Private communication CH Wang TreadStone Technologies Inc November 2008
Directed Technologies Inc 34
Physical vapor depositions (PVD) use of ion‐beams or magnetron sputtering to create a charged molecular vapor cloud of coating material (gold TiN etc) which then settles and adheres to the bipolar plate surface
Electroplating use of an electric current to deposit a metal layer onto the surface of the bipolar plate immersed in an aqueous metallic ion bath
Pickling treatment of the bipolar plate surface with an acid mixture (typically hydrochloric and sulfuric) in order to remove impurities (rust scale etc)
There are a large number of non‐corrosive highly conductive materials that are well‐suited as coatings for stainless steel bipolar plates33 Gold is often considered one of the most effective however its cost is usually prohibitive Alternately Fonk34 from GM states ldquomost preferably the [coating] particles will comprise carbon or graphite (ie hexagonally crystallized carbon)rdquo
No quantitative judgment was made as to the fuel cell performance of one surface treatment method over another From a general perspective however the most important aspects are application speed and the ability to deliver a thin coating of reliable thickness with sufficient surface smoothness to cover the plate surface uniformly Methods such as ion‐beam assisted physical vapor deposition35 are able to achieve excellent uniformity and low layer thickness (10‐nanometer layers of gold with near‐perfect flatness) but are capital‐intensive and suffer from slow application speed if relatively thick layers are proven necessary Consequently a brief cost analysis was conducted for three surface treatment options (electroplating magnetron sputtering (titanium nitriding) and thermally grown chromium nitriding) In addition a detailed cost analysis was conducted for TreadStonersquos proprietary process which was included in the stack costs for the baseline system configurations
Based on conversations with industry an electroplating cost was estimated as approximately $150kWnet (or 25 cents per 100 cm2 of surface area) plus material costs Electroplating provides a consistently reliable coating to a minimum thickness of 127 microns (05 mils) Assuming this minimum coating thickness only 11 cm3 of coating material is needed per plate Consequently material cost can rise to $30ndash54kg before it adds $1kWnet
to stack cost If carbon power is used as the coating material the total material‐and‐application cost is estimated at under $175kWnet
Additionally a preliminary analysis was conducted for aluminum plates with a titanium‐nitride surface treatment via magnetron sputtering A GM patent from 1997 states that a preferred embodiment is an aluminum bipolar plate (6061‐T6) coated with a 10‐micron layer of stainless steel (Al‐6XN) and topped with a 03‐micron layer of titanium nitride Consultation with magnetron sputtering experts suggests that these are surprisingly thick layers to deposit and could take up to 60 minutes of sputtering time36 Since the patent is over ten years old a shorter deposition time was postulated which is consistent with using thinner layers (or a single layer) Preliminary analysis37 indicates a total bipolar plate cost of $5ndash11kWnet for production rates of 30000 to 500000
33 ldquoGold platinum graphite carbon nickel conductive metal borides nitrides and carbides (eg titanium nitride titanium carbide and titanium diboride) titanium alloyed with chromium andor nickel palladium niobium rhodium rare earth metals and other noble metalsrdquo (Fonk et al US Patent 6372376 p4)
34 US Patent 6372376 titled ldquoCorrosion resistant PEM fuel cellrdquo 35 US Patent 6866958 titled ldquoUltra‐low loadings of AU for stainless steel bipolar platesrdquo 36 60 minutes is only a rough estimate based on a 150 nmmin sputtering rate A detailed analysis would have to be conducted to
determine the exact duration and system configuration 37 Based on $6kg aluminum material cost standard plate forming costs as defined elsewhere in this report $200kg titanium material
cost a 10 micron TiN layer $12M magnetron sputtering system 600 kW electrical consumption 60 plates processed per batch and a 2‐10 minute sputtering time
Directed Technologies Inc 35
systems per year (Analysis at the 1000 systems per year rate was not conducted since alternate equipment would be required and therefore fell outside the scope of the preliminary analysis) Cost variation with manufacturing rate is low with the two‐to‐one cost variation resulting from uncertainty in deposition time (varied from two to ten minutes) Overall titanium‐nitrided aluminum stamped plates represents a potential $2kWnet to $8kWnet cost adder compared to uncoated stainless steel stamped plates
The thermally grown chromium nitriding process examined for this study (see Figure 37) was based on the work of Mike Brady at Oak Ridge National Laboratory Unlike the titanium nitriding process mentioned previously this is not a deposited coating but a surface conversion The plates are placed into a nitrogen‐rich environment and heated to 800ndash1000degC for approximately 2 hours The high temperature favors the reaction of all exposed metal surfaces and forms a chromium nitride layer with the chromium in the stainless steel This process does not leave any pinhole defects and is amenable to complex geometries (such as flow field grooves) while allowing the simultaneous ldquocoatingrdquo of both sides of the plates
Figure 37 Magnified chromium nitride surface conversion
Conventional nitriding is currently conducted in large automated facilities and is relatively cheap The anticipated process for bipolar plates is similar but simpler and faster The plates would be batch‐processed and could feasibly be handled in a ldquolights outrdquo facility meaning there would be zero human operators (not counting maintenance) Because of the long processing time (1ndash3 hrs) it is important to fit the maximum number of plates in each batch As such the spacing between the plates becomes a critical factor in the processing cost Figure 38 shows a parametric analysis of the relationship between plate spacing and nitriding cost for batch times of 1 and 3 hours
Directed Technologies Inc 36
Figure 38 Impact of plate spacing on nitriding cost
Based on discussions with Brady it was estimated that the coating would likely cost about $075kW However if an optimistic combination of a short batch time and high packing density can be achieved it may be possible to get the cost down around $025kW
Alternatively it may be possible to nitride the plates in a matter of seconds by using a pulsed plasma arc lamp In this method fewer plates would simultaneously be processed but the dramatically higher throughput would still yield a hefty cost savings more than offsetting the extremely high capital costs (~$1ndash2 million per line) DTI estimates suggest that this method could lower the costs down to between $016 and $044kW
The fourth coating method examined for this analysis (and the one integrated into the baseline model) is TreadStones proprietary LiteCell process A DFMA analysis was conducted based on information from TreadStonersquos patent US 7309540 as well as that transferred under a non‐disclosure agreement with close collaboration with CH Wang and Gerry DeCuollo of TreadStone Technologies Inc
According to the patent the coating consists of ldquoone or more resistant layers comprising conductive vias through the resistant layer(s)rdquo38 (see Figure 39) The resistant layer provides excellent corrosion protection while the vias provide sufficient electrical conduction to improve overall conductivity through the plate
Figure 39 Conductive vias shown in US patent 7309540
The resistant layer is applied via a physical vapor deposition process Details of the manufacturing process are considered proprietary so only limited explanation is provided here
The postulated coating application follows a three‐step process The major step is the deposition of a non‐continuous layer of gold dots (~1 surface coverage) via a patented low‐cost process designed to impart low contact resistance The plate coating is applied after bipolar plate stamping The gold layer is only applied to one side of the plates because only one side requires low contact resistance
38 US Patent 7309540 titled ldquoElectrical Power Source Designs and Componentsrdquo
Directed Technologies Inc 37
The cost breakdown for the TreadStone process is shown in Figure 40 The coating cost is observed to be primarily a function of annual production rate with cost spiking at low quantities of only 1000 systems per year This is a reflection of low utilization of the coating system and the application cost could perhaps be reduced with an alternate application technique
Annual Production Rate 1000 30000 80000 130000 500000 Materials ($stack) $3960 $3960 $3960 $3960 $3960
Manufacturing ($stack) $116920 $7006 $7763 $7045 $6732 Total Cost ($stack) $120880 $10966 $11723 $11005 $10692 Total Cost ($kWnet) $1511 $137 $147 $138 $134 Materials ($stack) $3276 $3276 $3276 $3276 $3276
Manufacturing ($stack) $116836 $6996 $7752 $7035 $6721 Total Cost ($stack) $120113 $10272 $11028 $10311 $9998 Total Cost ($kWnet) $1501 $128 $138 $129 $125
2010
2015
Figure 40 Cost breakdown for TreadStone LiteCell bipolar plate coating process
442 Membrane
4421 Membrane Material amp Structure (Nafionreg on ePTFE) The PEM membrane is widely acknowledged as one of the more costly stack components and one needing to
be reduced in cost to achieve a cost competitive fuel cell system Nafionreg a perfluorinated sulfonic acid (PFSA) from DuPont originally developed as chloro‐alkali membrane is the main membrane chemistry used in PEM fuel cells However multiple other PFSA variants are in use including membranes from Dow Asahi Gore and GEFC Multiple other membrane chemistries are under development39 including partially fluorinated (PVDF) and non‐fluorinated (BAM3G S‐PPBP MBS‐PBI MBS‐PPTA S‐PEK) Additionally membranes may be homogenous composites40 or placed on a substrate for mechanical reinforcement
For purposes of this study the approach selected was Nafionreg on a porous expanded polytetrafluoroethylene41
(ePTFE) substrate This approach is modeled on the WL Gore approach as understood by a review of Gore PEMSelect product literature patents and discussions with Gore engineers While alternate approaches (such as homogenous cast or extruded membranes) have the potential for lower cost by obviating the expense of the ePTFE substrate the Gore‐like approach was selected since it should theoretically supply substantially better mechanical properties and is thereby inherently better suited for roll‐to‐roll processing Mechanical strength is an important characteristic in roll‐to‐roll processing (also known as web converting) and roll‐to‐roll processing appears to offer the best opportunity for very fast (and thus lowest cost) membrane formation Alternate membrane formation techniques were not considered in detail for this study Basic parameters of the selected approach are shown in Figure 41
39 ldquoReview and analysis of PEM fuel cell design and manufacturingrdquo Miral Mehta Joyce Smith Cooper Journal of Power Sources 114 (2003) 32‐53
40 PFSA membranes used in the chloro‐alkali production process are typically composed of 5‐9 layers of tailored membranes 41 PTFE is most commonly known as Teflontrade and is used as a non‐stick coating for frying pans etc Expanded PTFE is most commonly
known as Gore‐Textrade and is used as a ldquobreathablerdquo but water resistant layer in sportswear
Directed Technologies Inc 38
Membrane Ionomer Nafiontrade (PFSA) Substrate ePTFE Substrate Porosity 95 Substrate Density 0098 gcc Membrane Thickness 254 microns Nafion Density 1979 gcc
Figure 41 Basic membrane characteristics
4422 Membrane Material Cost The membrane material system is quite simple and consists of only two elements the Nafionreg ionomer and the
ePTFE substrate Expanded PTFE is used extensively in the textile industry where the production quantities dwarf even the highest demands from the automotive sector Conversations with apparel makers confirm that the price of ePTFE is unlikely to change appreciable between the low and high fuel cell system demands Consequently the cost of ePTFE is set at $5m2 for all membrane production levels
The cost of Nafionreg ionomer greatly affects overall membrane cost even though the membrane is very thin42 Based on vendor quotes of Nafionreg quotes for products similar to Nafionreg and on discussion with industry experts it was projected that Nafionreg ionomer costs would drop by roughly 95 from low to high production Figure 42 displays the assumed cost of Nafionreg ionomer used in this cost study Since Nafionreg cost is a major driver of overall membrane cost the Nafionreg $kg is a prime candidate for further exploration in a sensitivity analysis
As discussed below there are appreciable cutting losses43 associated with the roll‐to‐roll manufacturing process which directly affect the membrane material costs The same yield rates were applied to the materials as were applied to the manufacturing process (50ndash80 depending on production rate) but it was further assumed that a portion of ionomer in the scrap membrane was able to be recycled Consequently it was assumed for costing purposes that the ionomer material wastage rate was half that of the overall membrane areal scrap rate
42 Even at 25 microns approximately 50 grams of Nafionreg is contained in a square meter of membrane At $1000kg this equals $50m2
43 These losses are meant to capture the total difference between gross and net material usage Thus they encompass losses associated with trimming cutting startupshutdown and improper ionomer application
Directed Technologies Inc 39
Figure 42 Ionomer material cost
4423 Membrane Manufacturing Cost At low and intermediate production rates the processing cost to manufacture the membrane remains a major
if not dominant cost element In 1998 DTI analyzed44 the cost of a Gore‐like45 PEM membrane of 90‐by‐volume Nafionreg ionomer in an expanded‐polytetrafluoroethylene (ePTFE) matrix Multiple generations of similar Gore membranes have achieved industry leading membrane performance and Gore maintains a publicly stated commitment to lowering membrane costs to automotive competitive levels The authors previously analyzed manufacturing costs using DFMA techniques based on automated roll‐to‐roll processing The major steps of the process trains included unwinding of previously manufactured ePTFE occlusion of ionomer into the ePTFE web IR drying of the ionomer de‐ionized water rinse catalyst ink deposition via rollers IR drying boiling water hydration air drying and finished membrane winding with tension control throughout The membrane manufacturing cost was estimated at $083m2 at high production rates (500000 systems per year) but to achieve these levels very aggressive assumptions were made regarding ionomer material cost processing speed technical feasibility and capital cost
In 2001 Directed Technologies revisited the membrane forming process46 Processing parameter were modified and capital costs of the web processing equipment was estimated by vendor quotes from USWebcon Multiple variants on the process train were considered including alteration of the starting ionomer form to
44 Franklin D Lomax Jr Brian D James George N Baum CE ldquoSandyrdquo Thomas ldquoDetailed Manufacturing Cost Estimates for Polymer
Electrolyte Membrane (PEM) Fuel Cells for Light Duty Vehiclesrdquo Directed Technologies Inc prepared for Ford Motor Company under DOE contract August 1998
45 W L Gore amp Associates manufactures a number of membrane products based on ePTFE fabric as a support structure for polymer electrolyte 18 microns reflects the membrane thickness of the Gore Series 57 membrane produced specifically for automotive application
46 Brian D James ldquoDFMA Cost Estimation of LowMidHigh Production Fuel CellReformer Systemsrdquo Project Review Meeting Directed Technologies Inc prepared under DOE contract February 2001
Directed Technologies Inc 40
eliminate the boiling water hydration step multiple passes on the occlusiondipping step to ensure pinhole free coverage and multiple rewind stations to reduce the continuous length of the process train
In 2005 DTI again refined the membrane fabrication process47 based on further discussion with industry experts Industry feedback suggested the following cost modeling changes
Substantially increase capital cost
Decrease membrane yield rates
Decrease plant life48 from 10 years to 5 years
Plan for significant plant underutilization49 (assume plant to function at 67 capacity for the low and moderate production rates (1000‐30000 unitsyear) and 81 capacity at high production (500000 unitsyear))
These changes had the cumulative effect of significantly increasing membrane cost particularly at the low production rates This is not surprising since the web processing equipment was selected specifically for its high volume capacity thus it can be expected to shine at high volume but have poor scale‐down attributes
The 2008 analysis was based strongly on the 2005 assessment As schematically detailed in Figure 43 the membrane fabrication process consists of eight main steps
1 Unwinding An unwind stand with tensioners to feed the previously procured ePTFE substrate into the process line Web width was selected as the optimal width to match an integer number of cells and thereby minimize waste A web width of ~ 1m was deemed feasible for both the membrane fabrication line and the subsequent catalyzation and MEA hot‐pressing lines
2 First Ionomer Bath The ePTFE substrate is dipped into an ionomersolvent bath to partially occlude the pores
3 First Infrared Oven Drying The web dries via infrared ovens A drying time of 30 seconds was postulated Since the web is traveling quickly considerable run length is required The ovens may be linear or contain multiple back‐and‐forth passes to achieve the total required dwell time
4 Second Ionomer Bath The ionomer bath dipping process is repeated to achieve full occlusion of the ePTFE pores and an even thickness pinhole‐free membrane
5 Second Infrared Oven Drying The web is drying after the second ionomer bath
6 Boiling Water Hydration The web is held in boiling water for 5 minutes to fully hydrate the ionomer Optimal selection of the ionomer may reduce or eliminate this boiling step
7 Air Dryer High velocity air is used to dry the web after the hydration step
47 Gregory D Ariff Duane B Myers Brian D James ldquoBaseline PEM Fuel Cell Power System Cost Assessment for a 50 kW Automotive Systemrdquo Directed Technologies Inc prepared under DOE contract January 2005
48 Because mass‐manufacturing of membrane is a rapidly evolving technology a 5 year plant useful life was thought appropriate not because the equipment would wear out but because it would rapidly become technologically obsolete
49 The 67 capacity was based on 5‐year average utilization of a plant with 25 annual production increases The 81 capacity was based on a 10‐year average utilization of a plant with 5 annual production increases
Directed Technologies Inc 41
8 Rewind The finished membrane is wound onto a spool for transport to the catalyzation process line
Figure 43 Membrane fabrication process diagram
Details of the membrane fabrication cost analysis are shown in Figure 44 Two roll‐to‐roll plants are postulated a ldquolow‐speed plantrdquo (5 mmin) and a ldquohigh‐speedrdquo plant (35 mmin) Run at part load they cover the full span of membrane production requirements (1000 to 500000 vehiclesyear) Key assumptions are noted below
Capital Cost Capital costs are coarsely estimated based on industry input and are significantly greater than the element‐by‐element summation based on component price quotes
Web speed Even the ldquohigh‐speedrdquo web (35 mmin) is very slow by converting machinery standards where speeds of 100 mmin are often achieved50 This is a nod toward cost conservativeness and a reflection that the upper bound of membrane web speed is not known at this time
Discount Rate The discount rate is increased to 20 to reflect the increased business risk of a membrane production line
50 Several factors influence web speed selection the inherent mechanical strength of the web as it endures high‐speed processing the complexitynumber‐of‐turns required in a particular element to allow adequate dwell time when moving at highndashspeed and the web material losses resulting from a malfunction If the web requires 30 seconds to dry and moves at 100 mmin the drying section must be 300 m long If something should break or not perform adequately many meters of web product are lost during a shut‐down because of the inertia of the rollers
Directed Technologies Inc 42
Production for Simultaneous Product Lines In virtually all other components of the fuel cell stack system it was assumed that there was vertical integration and dedicated component production for a single vehicle product For the membrane however it is likely that a separate company will fabricate the membrane for multiple car companies or at least that the membrane plant will produce membrane for more than one line of vehicles Consequently a multiplier on the yearly membrane demand was included to reflect supply to multiple vehicle product lines This multiplier is not constant as production rate increases since the plant at is some point limited by capacity The non‐constant nature of the multiplier leads to unevenness in the resulting $m2 cost projections
Peak Equipment Utilization DTI conversations with a membrane supplier led to limiting the utilization of the plant as a means of reflecting rapid demand growth Utilization (at most manufacturing rates) was limited to 67 to reflect the five‐year average utilization assuming 25 per year demand growth For the 500000 vehicles per year case plant utilization is allowed to increase to 80 to reflect a more stable production scenario
ProductionCutting Yield Further conversations with a membrane supplier led to the postulation of a substantial loss rate in membrane production Per supplier input a 50 yield was assumed up to 25 plant utilization with an 80 yield above 80 utilization and a linear variance in between
Workdays and Hours The maximum plant operating hours were assumed to be 20 hours per day 240 days per year Actual hours vary based on actual plant utilization
Cost Markup The standard methodology throughout the analysis had been not to apply manufacturer markups in keeping with the vertically integrated manufacturing assumption and the directives of the DOE on this costing project However since it is likely that the membrane producer will not be vertically integrated a markup was included in our membrane cost estimate Furthermore because the membrane is a critical component of the stack significantly higher margins are allocated than are typical to the automotive industry where there is a large supplier base with virtually interchangeable products competing solely on price
Revenue Annual membrane fabricator revenue is not an input in the analysis Rather it is an output However it is worth noting that even at high membrane production rates company revenues are still only about $33M per year This is a modest company size and supports the notion of allowing higher‐than‐average markups as a means to entice people into the business
Directed Technologies Inc 43
2010 ‐ 2030 Annual Veh Prod (1 product line) vehyear 1000 30000 80000 130000 500000
Capital Amortization Capital Cost (Membrane Fabrication) $ $15000000 $15000000 $25000000 $25000000 $30000000
Machine Lifetime years 10 10 10 10 10 Discount Rate 20 20 20 20 20
Corporate Income Tax Rate 40 40 40 40 40 Capital Recovery Factor (CRF) 0331 0331 0331 0331 0331
Labor Costs Min Mfg Labor Staff (Simul on 1 Shift) FTE
Labor Rate $min
5
1
25 50 50
1 1 1
50
1
Machine Costs MaintSpare Parts ( of inst CCyear) 5 5 5 5 5
Miscellaneous Expenses 5 5 5 5 5 Total Power Consumption kW 200 250 350 350 350
Electrical Utility Cost $kWh 007 007 007 007 007
Membrane Production Parameters Simul Prod Lines to Which Mem is Supplied 45 15 3 215 1
Vehicle Annual Production vehyear 4500 45000 240000 279500 500000
m 2 per Vehicle m 2vehicle 1395 1395 1395 1395 1395
Peak Equipment Utilization Due to Growth 67 67 67 67 80 ProductionCutting Yield 50 70 64 67 80
ProdCutting Yield (to avoid circular logic) 50 70 65 68 80
Gross Production 100 Utilization (plant) m 2year 187388 1338486 7807836 8685732 10898438
Gross Production (plant) m 2year 125550 896786 5231250 5819440 8718750
Net Production (plant) m 2year 62775 627750 3348000 3899025 6975000
Net Production of 1 Line m 2year 13950 418500 1116000 1813500 6975000
Design Web Speed mmin 5 5 35 35 35 Web Width m 1 1 1 1 1
Work Days per Year daysyear 240 240 240 240 240
Plant Utilization (of 20 hr days) 87 623 519 577 865 Hours per Year of Production hrsyear 419 2989 2491 2771 4152 Hours per Day of Production hrsday 174 1246 1038 1155 1730
Annual Cost Summation Capital Recovery Cost $year $4963069 $4963069 $8271782 $8271782 $9926138
Labor Cost $year $576000 $4483929 $7473214 $8313486 $12455357 MaintenanceSpares Cost $year $750000 $750000 $1250000 $1250000 $1500000 Miscellaneous Expenses $year $750000 $750000 $1250000 $1250000 $1500000
Utility Cost $year $5859 $52313 $61031 $67893 $101719
Effective Machine Rate $min $281 $61 $122 $115 $102
Total Mfg Cost per m2 (Pre‐Markup) $m
2 $112 $18 $5 $5 $4
Manufacturing Cost Markup 100 100 75 50 30 Gross Margin 50 50 43 33 23
Annual Revenue $year $14089856 $21998620 $32035547 $28729742 $33128178
Total Manufacturing Cost (Incl Markup) $m2 $22445 $3504 $957 $737 $475
Figure 44 Simplified membrane manufacturing cost analysis assumptions
Membrane manufacturing cost is plotted against membrane annual volume in Figure 45 below Membrane material cost is not included Note that annual membrane volume has two potential definitions depending on the assumption of either a single product line or multiple product lines When all membrane production goes toward
51 Note that because these numbers are used only to obtain a curve fit the manufacturing costs shown here differ slightly from the actual manufacturing costs used (shown in Figure 47)
Directed Technologies Inc 44
51
a single product line membrane volume is total production volume When multiple product lines are assumed membrane volume represents annual sales volume (to a single customer) Thus in essence the cost curve is shifted to the left due to economies of scale made possible by pooling multiple demands The cost curve is seen to be uneven due to this effect To aid in numerical calculation a power curve was curve‐fit to each relationship and the less expensive multiple‐product‐line curve is utilized in subsequent power system cost computations
$1000
$100 Cost with Single ProductLine
Cost with MultipleProduct Lines
$10
$1
Me
mb
ran
e M
anu
fact
uri
ng
Co
st
$m
2
y = 3658E+06x-08615
y = 1139096x-06531
1000 10000 100000 1000000 10000000
Annual Membrane Manufacturing Volume m2year Figure 45 Membrane manufacturing cost vs annual membrane manufacturing volume
4424 Total Membrane Cost and Comparison to Other Estimates Total membrane cost used in this study is shown in Figure 46 below along with 2005 membrane estimates52
from DuPont and GM The DuPont and GM estimates were for 25‐micron‐thick homogeneous PFSA membranes whereas the DTI estimates were for ePTFE‐supported 25 micron membranes All estimates represent membrane fabrication and materials cost alone and do not include any catalyst or catalyst application cost Overall the estimates are in excellent agreement although they represent two distinctly different fabrication methods using the same ionic material Figure 47 details the material and manufacturing costs of the uncatalyzed membrane Note that unlike most elements in the cost analysis membrane manufacturer markup is added to the membrane cost as the membrane is likely to be produced by an outside vendor rather than made in‐house by the fuel cell fabricator
52 ldquoTwo Fuel Cell Cars In Every Garagerdquo Mark F Mathias Rohit Makharia Hubert A Gasteiger Jason J Conley Timothy J Fuller Craig J Gittleman Shyam S Kocha Daniel P Miller Corky K Mittelsteadt Tao Xie Susan G Yan Paul T Yu (all from GMrsquos Fuel Cells Activities Division or Giner Electrochemical Systems) The Electrochemical Society Interface Fall 2005 pg 24‐35
Directed Technologies Inc 45
Figure 46 Membrane (material + manufacturing) cost compared to previous analysis and vendor quotes
Annual Production Rate 1000 30000 80000 130000 500000 Materials ($m2
) $19167 $5225 $3527 $2854 $1625
Manufacturing ($m2) $25069 $2775 $1472 $1078 $448
Total Cost ($m2) $44236 $7999 $4999 $3932 $2073
Total Cost ($stack) $518451 $90884 $56223 $43823 $23078 Total Cost ($kWnet) $6481 $1136 $703 $548 $288
Materials ($m2) $19819 $5695 $3815 $3072 $1720
Manufacturing ($m2) $28473 $3152 $1672 $1225 $508
Total Cost ($m2) $48292 $8847 $5487 $4297 $2229
Total Cost ($stack) $465735 $82711 $50781 $39404 $20421 Total Cost ($kWnet) $5822 $1034 $635 $493 $255
2010
2015
Figure 47 Cost breakdown for un‐catalyzed membrane
443 Nanostructured Thin Film (NSTF) Catalyst Application Previous analysis by DTI has focused on roller‐based application of carbon supported platinum catalysts
deposited directly onto the PEM membrane This technique has the advantage of being one of the least costly application techniques judged adequate for high production rates and reasonably high MEA performance However it is increasingly clear that further increases in power density with simultaneously lower Pt loading is probably not possible with this technique Consequently a new method of catalyst deposition was examined that has shown remarkable recent improvements in power density and durability at low Pt loadings Developed at 3M the Nanostructured Thin Film Catalyst (NSTF) deposition process begins with a layer of crystalline finger‐like projections or ldquowhiskersrdquo that create a high surface area substrate on which the active catalysts may be deposited Next vapor deposition methods are utilized to deposit a very thin layer of a ternary catalyst allow onto the whiskers in a very precise and even manner The resulting catalyst coated whiskers can then be hot‐pressed into the fuel cell membrane to form a porous mat electrode intimately bonded to the membrane 3M has
Directed Technologies Inc 46
recently demonstrated significant improvements in the durability and the power‐density‐to‐catalyst‐loading ratio that surpass the 2010 DOE performance targets
4431 Application Process The NSTF application process involves four main steps as identified by a review of non‐proprietary open source
literature5354 3M representatives have reviewed and critiqued the analysis not for 100 accuracy as to how they would specifically carrying out the production but rather to vet the general approach and major elements affecting cost They judge the process and resulting cost estimate to be consistent with internal proprietary projections of resulting catalyst cost
The main steps of the modeled NSTF catalyst application process are listed below and shown in Figure 48
1 Deposition Physical Vapor Deposition(PVD) of PR‐149 (Perylene Red pigment 149) onto a DuPont Kaptonreg polyamide web (a temporary deposition substrate)
2 Annealing Vacuum annealing of the PR‐149 resulting in the formation of crystalline nanostructures through a screw dislocation growth process
3 Catalyst Sputtering Ternary PtCoMn catalyst is magnetron‐sputtered into the nanostructures
4 Catalyst Transfer Roll‐to roll transfer of the catalyst coated nanostructures from the Kaptonreg substrate to the PEM membrane
53 US Patent 4812352 titled ldquoArticle having surface layer of uniformly oriented crystalline organic microstructuresrdquo 54 ldquoAdvanced Cathodes and Supports for PEM Fuel Cellrdquo presented by Mark Debe of 3M at the 2009 DOE Hydrogen Program Annual
Review Meeting Arlington VA 20 May 2009
Directed Technologies Inc 47
Steps 1‐3
Vacuum Chamber PR‐149 Sublimation Unit
(Step 1)
Rollers
Kapton Roll Annealing (Step 2) Heaters
(Actually has 7 folds for shorter vacuum chamber length)
PtCoMn Sputtering (Step 3) Step 4
page15
Uncoated membrane
Calendering
Used Kapton Rolls
NSTF Anode Catalyst on Kapton
NSTF Cathode Catalyst on Kapton
Coated Membrane
Figure 48 NSTF production process diagram
4432 Cost and Performance Assumptions Cost and performance assumptions concerning the NSTF catalyst creation system are listed below
Capital Cost The capital costs of the manufacturing machinery were primarily based on conversations with industry representatives or derived from previous DTI work involving similar components A complete list of capital cost is shown in Figure 49
Component Cost Evacuation Chamber 1 Evacuation Chamber 2 Sublimation Unit Cylindrical Magnetron Sputtering Unit 64 m (effective length) Vacuum Annealing Oven Re‐Pressurization Chamber 1 Re‐Pressurization Chamber 2 Hot Calender Decal Application (Step 4) Total Capital Cost per Line
$78732 $147623 $100000 $210321 $428571 $127940 $78732
$100000 $1271921
Figure 49 Capital costs of NSTF manufacturing line
Line Speed The line speed calculation is based on a balance between the vacuum chamber length and the time needed for the sublimation annealing and sputtering operations and is set at 584 mmin It is not cost
Directed Technologies Inc 48
effective to draw and release a vacuum for separate operations thus all three are postulated to occur within the same vacuum chamber The bulk of the chamber will be devoted to annealing which at the given line speed requires 5838m of length Creating a vacuum chamber this long would be prohibitively expensive and thus the web will travel in a serpentine pattern folding back on itself 7 times so the annealing chamber itself will be ~85 m in total length An additional ~35 m of sublimation and ~15m of sputtering chamber will be on either end of the annealing chamber A minimum of ten minutes of annealing time is required for nanostructure formation In addition to the annealing time ~17 seconds is needed for catalyst deposition and 40 seconds is needed for PR‐149 sublimation onto the substrate These times are based on the thickness of the coatings (100nm for the PR‐149 and 44nm for the catalyst coating) as indicated by 3M and an approximate deposition rate of 25 nmsec as indicated by representatives of Vergason Technology Inc
Catalyst Loading 3M has demonstrated that high performance can be achieved at catalyst loadings of 015 mgPtcm2 in this configuration55 The assumed mole fraction for the ternary catalyst was assumed to be 73 Platinum 24 Cobalt and 2 Manganese
Web Roll Assumptions We have assumed a roll length of 1500 m with a loading time of ~16 minutes per roll56
4433 Results When compared to the previous method of catalyst application considered (Die‐slot application based on the
Coatema VertiCoater) the total NSTF catalyst system and application is actually slightly more expensive for a given power density and catalyst loading This is somewhat misleading however since the NSTF method facilitates a lower catalyst loading and improved power density that cannot be otherwise achieved Consequently taking power density and catalyst loading into consideration a net savings of $1028kWnet is obtained A cost comparison of the two methods (assuming similar catalyst loading and power density) is shown in Figure 50
55 ldquoAdvanced Cathodes and Supports for PEM Fuel Cellrdquo presented by Mark Debe of 3M at the 2009 DOE Hydrogen Program Annual Review Meeting Arlington VA 20 May 2009
56 The 16 minute total time includes times for loading and unloading the Kapton rolls as well as pressurizing and drawing a vacuum
Directed Technologies Inc 49
(at equal power density amp catalyst loading)
NSTF Total Cost VertiCoater Total Cost
VertiCoater Manufacturing Cost NSTF Manufacturing Cost
ldquoTotalCostrdquo Includes Catalyst
ldquoManufacturing Costrdquo = Ink prep + Application
Figure 50 Cost comparison between NSTF and VertiCoater methods
Machine rate and process parameters are show in Figure 51 and Figure 52 The overall cost breakdown at various system values and technology levels is shown in Figure 53
Annual Production Rate 1000 30000 80000 130000 500000 Capital Cost ($Line) Simultaneous Lines Laborers per Line
Line Utilization Effective Total Machine Rate ($hr)
Line Speed (ms)
$1284255 1 2
247 $677571 00973
$1284255 1 2
7178 $37373 00973
$1284255 2 2
9473 $31836 00973
$1284255 4 2
7627 $36026 00973
$1284255 12 2
9770 $31310 00973
2010
Capital Cost ($Line) Simultaneous Lines Laborers per Line
Line Utilization Effective Total Machine Rate ($hr)
Line Speed (ms)
$1282957 1 2
181 $922289 00973
$1284255 1 2
5215 $45973 00973
$1284255 2 2
6882 $38354 00973
$1284255 3 2
7389 $36721 00973
$1284255 9 2
9464 $31853 00973
2015
Figure 51 NSTF application process parameters
Annual Production Rate 1000 30000 80000 130000 500000 Equipment Lifetime
Interest Rate Corporate Income Tax Rate
Capital Recovery Factor Equipment Installation Factor
MaintenanceSpare Parts ( of CC) Miscellaneous Expenses ( of CC)
Power Consumption (kW)
1267 10 40 0185 14 10 7 737
1267 10 40 0185 14 10 7 737
1267 10 40 0185 14 10 7 737
1267 10 40 0185 14 10 7 737
1267 10 40 0185 14 10 7 737
5
201
2010 ‐
Figure 52 Machine rate parameters for NSTF application process
Directed Technologies Inc 50
Annual Production Rate 1000 30000 80000 130000 500000 Material ($stack) $66234 $66234 $66234 $66234 $66234
Manufacturing ($stack) $56321 $3004 $2533 $2841 $2467 Tooling ($stack) $2673 $798 $789 $787 $782
Total Cost ($stack) $125228 $70037 $69557 $69862 $69483 Total Cost ($kWnet) $1565 $875 $869 $873 $869
Material ($stack) $54502 $54502 $54502 $54502 $54502 Manufacturing ($stack) $55942 $2685 $2217 $2104 $1823
Tooling ($stack) $3028 $660 $651 $645 $637 Total Cost ($stack) $113471 $57848 $57371 $57251 $56963 Total Cost ($kWnet) $1418 $723 $717 $716 $712
2010
2015
Figure 53 Cost breakdown for NSTF application process
444 Catalyst Cost As described in the previous section a PtCoMn catalyst is used for the NSTF catalyst system and is applied via a
physical vapor deposition method (modeled as magnetron sputtering) Consistent with PVD the metal is supplied in the form of a pure sputtering target for each metal The cost of each target is estimated to be
Platinum $1100troy ounce Cobalt $287troy ounce Manganese $ 015troy ounce
The raw material cost of platinum is the major cost element of the catalyst ink At the direction of the DOE a platinum cost of $1100 per troy ounce is selected Using this value ensures consistency with other DOE projects and provides some insulation for the model from the wild fluctuations of the platinum market In 2008 for example the price of platinum varied greatly (as shown in Figure 54) with the daily trading values reaching an annual (and all‐time) peak of $2280troz on March 4 and a low of $782troz on October 2757
57 Platinum prices found at httpwwwplatinummattheycompricesprice_chartshtml
Directed Technologies Inc 51
M
onthly
USD
Troy Ounce
$2500
$2000
$1500
$1000
$500
$0
Platinum DOE‐Suggested Pt Cost ($1100) DAILY min amp max
$2280
$782
Jul‐05 Jul‐06 Jul‐07 Jul‐08 Jul‐09 Jul‐10
Figure 54 Five‐year graph of monthly platinum prices
While 2008 may have been an anomalously turbulent year in the market the five‐year average cost is $1312troz which is relatively close to the $1100 value provided by the DOE58 Careful consideration should be paid to this as changes in platinum cost will dramatically affect the system cost59
445 Gas Diffusion Layer Figure 55 displays a cross‐sectional diagram of the modeled gas diffusion layer (GDL) Consistent with recent
research60 the GDL was assumed to be a dual‐layer sheet with macroporous amp microporous layers The 028 mm thick macroporous layer was assumed to be a non‐woven carbon substrate (based on SGL Carbonrsquos GDL 34BA) to which a hydrophobic 004 mm thick microporous layer of PTFE and Vulcan XC‐72 is applied A full DFMA analysis of the GDL was not conducted61 Rather a price quote was obtained for the base macroporous layer and the costs of the microporous layer material and application were added to it
58 Prior to 2010 the 5‐year average price was much closer to $1100troz If the price does not decrease sufficiently in upcoming months it may be worthwhile to reexamine the price used in the model
59 See section 5 (ldquoSensitivity Analysisrdquo) for the effect that platinum cost and other parameters have on the system cost 60 Development and Characterizations of Microporous Layer for PEM Fuel Cells Sehkyu Park Jong‐Won Lee Branko N Popov (University
of South Carolina) Robert E Mammarella Kimiaki K Miyamoto (Greenwood Research Laboratory) 61 A bottom‐up analysis of the macroporous GDL layer is planned for a later stage of this project
Directed Technologies Inc 52
Figure 55 Cross‐section of gas diffusion layer in stack
Figure 56 schematically portrays the dual‐layer GDL process train Major steps in the process train include
Unrolling of the macroporous layer
Application of a PTFE coating via dipping in a PTFEsolvent bath
Drying of the PTFE coating in an IR oven
Spray deposition of the microporous layer
Drying of the PTFE coating in an IR oven
Drying of the microporous coating in an IR oven
Cure of the microporous coating
Rewind of the finished dual‐layer GDL
Directed Technologies Inc 53
Figure 56 Dual‐layer GDL process diagram
Component Cost Unwind Stand w Tensioner Dipper Oven 1 (Macroporous Layer) VCF1500HV Ultrasonic Mixer Sprayer for Microporous Solution Oven 2 (Microporous Layer Stage 1) Oven 3 (Microporous Layer Stage 2) Rewind Stand wTensioner
Total Capital Cost
$27283 $81849
$156317 $26444
$327396 $156317 $468951 $27283
$1271840 Figure 57 Capital cost breakdown for a typical microporous layer application line
Figure 58 and Figure 59 report the key process parameters for the GDL manufacturing process including the cost of the macroporous layer in $m2 of material purchased (not per active area of membrane) One of the benefits of applying the catalyst to the membrane rather than the GDLrsquos is that the anode and cathode GDLrsquos are identical and thus do not need separate processing Figure 60 however shows the purchased cost of the macroporous layer independent of the material or manufacturing costs for the rest of the GDL as it inherently includes both Overall the GDL contributes approximately $2ndash27kW to the cost of the fuel cell stack The range is large because of high material cost and low line utilization at 1000 systems per year
Directed Technologies Inc 54
Capital Cost ($Line) Simultaneous Lines Laborers per Line
Line Utilization Effective Total Machine Rate ($hr)
Line Speed (ms) Macroporous Layer Cost ($m2
)
$1271840 1
025 324
$489506 017
$7183
$1271840 1
025 9656 $21129 017
$4852
$1271840 3
025 8581 $23164 017
$2958
$1271840 5
025 8367 $23632 017
$2262
$1271840 17 025
9465 $21457 017 $951
2010
Capital Cost ($Line) Simultaneous Lines Laborers per Line
Line Utilization Effective Total Machine Rate ($hr)
Line Speed (ms) Macroporous Layer Cost ($m2
)
$1271840 1
025 236
$669628 017
$7183
$1271840 1
025 7014 $27249 017
$4852
$1271840 2
025 9351 $21658 017
$2958
$1271840 4
025 7597 $25532 017
$2262
$1271840 12 025
9740 $20988 017 $951
2015
Figure 58 GDL manufacturing process parameters (microporous layer addition only)
Annual Production Rate 1000 30000 80000 130000 500000 Equipment Lifetime
Interest Rate Corporate Income Tax Rate
Capital Recovery Factor Equipment Installation Factor
MaintenanceSpare Parts ( of CC) Miscellaneous Expenses ( of CC)
Power Consumption (kW)
15 10 40 0175 14 10 7 493
15 10 40 0175 14 10 7 493
15 10 40 0175 14 10 7 493
15 10 40 0175 14 10 7 493
15 10 40 0175 14 10 7 493
5
201
2010 ‐
Figure 59 Machine rate parameters for GDL manufacturing process
Annual Production Rate 1000 30000 80000 130000 500000 Purchased Macroporous Layer ($kWnet) $2000 $1351 $824 $630 $265
Other Materials ($kWnet) $009 $009 $009 $009 $009 Manufacturing ($kWnet) $666 $029 $031 $032 $029
Total Cost ($kWnet) $2675 $1389 $864 $671 $303
Purchased Macroporous Layer ($kWnet) $1646 $1112 $678 $518 $218 Other Materials ($kWnet) $008 $008 $008 $008 $008 Manufacturing ($kWnet) $664 $027 $021 $025 $021
Total Cost ($kWnet) $2317 $1146 $707 $551 $246
2010
2015
Figure 60 Cost breakdown for gas diffusion layers
446 MEA Gaskets and MEA Assembly The MEA gasket was based on insertion molding a silicone frame around the catalyzed membrane and GDLrsquos
The gasketed MEA is formed in three steps First is the hot‐pressing which is done in an indexed roll‐to‐roll process The second is cutting amp slitting of the hot‐pressed membrane and electrode into individual rectangular pieces Then the pieces are manually inserted into a mold and the framegasket is insertion‐molded around it This frame has features to hold the GDL and membrane as well as a ldquoliprdquo which folds over and captures the sheets for easy handling
4461 Hot‐Pressing the Membrane and GDLs The hot‐pressing process (see Figure 61) starts with three rolls two of GDL and one of catalyzed membrane
Because of the decision to catalyze the membrane instead of the electrode the two rolls of GDL are identical Each of the three corresponding unwind stands is equipped with a brake and a tensioner These three rolls merge
Directed Technologies Inc 55
at a set of rollers and then travel through the hot press On the other side of the press a single rewind stand collects the hot‐pressed membrane and electrode
Figure 61 Hot‐pressing process diagram
The press is heated to 160degC and is indexed with a press time of 90 seconds It takes 3 seconds to open the press advance the roll to the next section and re‐close the press making the cycle time 93 seconds The section advance time could be quicker but because of the limited tensile strength of the materials 3 seconds is appropriate Furthermore 3 seconds is only 130th of the press time and for an already‐inexpensive process the savings in speeding up the section advance would be minimal The press is 50 cm wide by 150 cm in length so approximately 18 to 22 cells get hot‐pressed at a time depending on the cell geometry Processing parameters are further defined in Figure 62
Directed Technologies Inc 56
Capital Cost ($Line) Costs per Tooling Set ($) Tooling Lifetime (cycles)
Simultaneous Lines Laborers per Line
Line Utilization Effective Total Machine Rate ($hr)
Index Time (s)
$187542 $10913 1000000
1 025 722 $29415 9300
$187542 $10913 1000000
3 025
7216 $4055 9300
$187542 $10913 1000000
6 025
9620 $3350 9300
$187542 $10913 1000000
10 025
9380 $3404 9300
$187542 $10913 1000000
37 025
9751 $3321 9300
2010
Capital Cost ($Line) Costs per Tooling Set ($) Tooling Lifetime (cycles)
Simultaneous Lines Laborers per Line
Line Utilization Effective Total Machine Rate ($hr)
Index Time (s)
$187542 $10913 1000000
1 025 529 $39709 9300
$187542 $10913 1000000
2 025
7879 $3817 9300
$187542 $10913 1000000
5 025
8403 $3656 9300
$187542 $10913 1000000
7 025
9753 $3321 9300
$187542 $10913 1000000
27 025
9725 $3327 9300
2015
Figure 62 Hot‐pressing process parameters
Hot pressing cost is summarized in Figure 64 Because of the simplicity of the process the cost is quite low especially at high manufacturing rates Since the press is flat tool wear is minimal Material costs are zero since the cost of membrane and GDL were accounted for elsewhere
Annual Production Rate 1000 30000 80000 130000 500000 Equipment Lifetime
Interest Rate Corporate Income Tax Rate
Capital Recovery Factor Equipment Installation Factor
MaintenanceSpare Parts ( of CC) Miscellaneous Expenses ( of CC)
Power Consumption (kW)
15 10 40 0175 14 5 7 16
15 10 40 0175 14 5 7 16
15 10 40 0175 14 5 7 16
15 10 40 0175 14 5 7 16
15 10 40 0175 14 5 7 16
5
201
2010 ‐
Figure 63 Machine rate parameters for hot‐pressing process
Annual Production Rate 1000 30000 80000 130000 500000 Manufacturing ($stack) $7136 $983 $812 $825 $805
Tooling ($stack) $073 $015 $011 $011 $011 Total Cost ($stack) $7209 $998 $823 $836 $816 Total Cost ($kWnet) $090 $012 $010 $010 $010
Manufacturing ($stack) $7056 $674 $645 $586 $587 Tooling ($stack) $073 $010 $009 $008 $008
Total Cost ($stack) $7129 $683 $654 $594 $595 Total Cost ($kWnet) $089 $009 $008 $007 $007
2010
2015
Figure 64 Cost breakdown for hot‐pressing process
4462 Cutting amp Slitting As shown in Figure 65 the rolls of hot‐pressed membrane and GDL are fed through cutters and slitters to trim
to the desired dimensions for insertion into the MEA frame The 50‐cm‐wide input roll is slit into ribbon streams of the appropriate width (again depending on cell geometry) The streams continue through to the cutters which turn the continuous material into individual rectangles These rectangles are then sorted into magazine racks
Directed Technologies Inc 57
Figure 65 Cutting amp slitting process diagram
Figure 67 further details the process parameters Machine utilization at 1000 systems per year is extremely poor (as low as 018) However costs associated with manual cutting are comparable to the automated system running at poor utilization Consequently for simplicity this process is presented as being automated at all production rates Figure 69 summarizes the overall cost of the cutting and slitting operation
Component Cost Unwind Stand w Tensioner CutterSlitter Stacker
Total Capital Cost
$27283 $92762 $10913
$130958 Figure 66 Capital cost breakdown for the cutting and slitting process
Annual Production Rate 1000 30000 80000 130000 500000 Capital Cost ($Line)
Costs per Tooling Set ($) Tooling Lifetime (cycles)
Simultaneous Lines Laborers per Line
Line Utilization Effective Total Machine Rate ($hr)
Line Speed (ms)
$130958 $5457 200000
1 025 024
$667900 100
$130958 $5457 200000
1 025 628 $26962 133
$130958 $5457 200000
1 025
1673 $10900 133
$130958 $5457 200000
1 025
2720 $7184 133
$130958 $5457 200000
2 025
5228 $4334 133
2010
Capital Cost ($Line) Costs per Tooling Set ($) Tooling Lifetime (cycles)
Simultaneous Lines Laborers per Line
Line Utilization Effective Total Machine Rate ($hr)
Line Speed (ms)
$130958 $5457 200000
1 025 018
$884245 100
$130958 $5457 200000
1 025 457 $36631 133
$130958 $5457 200000
1 025
1216 $14531 133
$130958 $5457 200000
1 025
1975 $9423 133
$130958 $5457 200000
1 025
7595 $3370 133
2015
Figure 67 Cutting amp slitting process parameters
Directed Technologies Inc 58
Annual Production Rate 1000 30000 80000 130000 500000 Equipment Lifetime
Interest Rate Corporate Income Tax Rate
Capital Recovery Factor Equipment Installation Factor
MaintenanceSpare Parts ( of CC) Miscellaneous Expenses ( of CC)
Power Consumption (kW)
15 10 40 0175 14 10 7 17
15 10 40 0175 14 10 7 17
15 10 40 0175 14 10 7 17
15 10 40 0175 14 10 7 17
15 10 40 0175 14 10 7 17
5
201
2010 ‐
Figure 68 Machine rate parameters for cutting amp slitting process
Annual Production Rate 1000 30000 80000 130000 500000 Manufacturing ($stack) $5439 $190 $077 $050 $030
Tooling ($stack) $255 $252 $252 $252 $252 Total Cost ($stack) $5694 $442 $329 $302 $282 Total Cost ($kWnet) $071 $006 $004 $004 $004
Manufacturing ($stack) $5437 $187 $074 $048 $017 Tooling ($stack) $218 $203 $201 $201 $201
Total Cost ($stack) $5655 $390 $276 $250 $219 Total Cost ($kWnet) $071 $005 $003 $003 $003
2010
2015
Figure 69 Cost breakdown for cutting amp slitting process
4463 Insertion‐Molding the FrameGasket The final step in creating the membrane electrode assembly (MEA) is insertion molding the framegasket Its
purpose is twofold
Provide sealing and proper manifolding around the periphery of the MEA
Provide a rigid structure to the MEA for ease of handling during assembly
Based on a 2003 patent from Ballard Power Systems (see Figure 70) the rectangular hot‐pressed membraneGDL is inserted into an injection‐molding machine and the gasket is molded into place around it
Figure 70 Insertion‐molded framegasket concept US patent 7070876
Directed Technologies Inc 59
This process is similar to the insertion molding of the coolant amp end gaskets (pages 66 amp 73 respectively) but has different manifolds and is molded around the hot‐pressed membrane amp electrode rather than onto the face of a bipolar plate or an end plate Because the membrane is sensitive to temperature this limits the molding temperature to 130degC or 150degC if the process is fast enough This requirement greatly limits the material choices for the gasket
Prior to the 2008 Update the material specified was a generic silicone After reviewing DTI work Jason Parsons from UTC highlighted some durability problems with using silicone as well as the fact that the silicone cost used in the analysis was too low
Several new materials were investigated as alternatives including several types of DuPontrsquos Vitonreg material and a new liquid injection‐moldable (LIM) hydrocarbon material from Henkel Loctite These materials are listed in Figure 71 with the best‐in‐group properties highlighted in red font Although the new material costs more than the old (erroneous) silicone cost itrsquos cheaper than the updated silicone cost and exhibits dramatically better durability performance Although DuPontrsquos Vitonreg GF‐S has a lower material cost (in $kg) than the LIM hydrocarbon the Vitonreg requires a higher injection‐molding pressure and takes three times longer to mold Furthermore the density of the Vitonreg is almost double that of the other materials so a greater material mass is needed to fill the required gasket volume meaning the gaskets weigh more and the per‐volume costs are actually the highest These factors all made the selection of the LIM hydrocarbon an easy choice
Generic Henkel Loctite Silicone (2007 Henkel Loctite DuPont Vitonreg
DuPont Vitonreg LIM
Analysis) Silicone 5714 GBL‐600S GF‐S Hydrocarbon Density gcc 14 105 184 192 105 Cost $kg $1433 $5670 $3687 $3687 $4337 Cost $L $2006 $5954 $6784 $7079 $4554 Cure Time s 150 540 420 180 60 Cure Temp degC 127 130 177 187 130 Durability hrs ~5000 ~5000 ~15000 ~15000 ~10000 Inj Mold Pressure low low mid‐to‐high mid‐to‐high low
Figure 71 MEA framegasket materials comparison62
In the injection‐molding process each part is required to have a shot mass greater than the part mass to account for material lost in the sprue and cooling channels In the 2008 design for example the part mass is 75 grams and the shot mass is 117
As shown in Figure 72 the optimal number of cavities per platen ranges from 6 to 16 as determined by lowest overall cost The necessary clamping force ranges from 640 to 1300 tons and the injection pressure is a constant 1379 bar (20000 psi) for each case
62 The prices listed are for 2008 technology 500000 systemsyear
Directed Technologies Inc 60
Annual Production Rate 1000 30000 80000 130000 500000 Capital Cost ($Line)
Costs per Tooling Set ($) Tooling Lifetime (cycles)
Simultaneous Lines Laborers per Line
Line Utilization Cycle Time (s)
CavitiesPlaten Effective Total Machine Rate ($hr)
Material Cost ($kg)
$278367 $62634 1000000
1 100
6911 135 6
$10476 $5142
$567794 $118950 1000000
10 033
9647 158 15
$10315 $4691
$567794 $118950 1000000
26 033
9893 158 15
$10112 $4569
$598772 $124447 1000000
40 033
9954 161 16
$10515 $4509
$598772 $124447 1000000
154 033
9944 161 16
$10523 $4348
2010
Capital Cost ($Line) Costs per Tooling Set ($) Tooling Lifetime (cycles)
Simultaneous Lines Laborers per Line
Line Utilization Cycle Time (s)
CavitiesPlaten Effective Total Machine Rate ($hr)
Material Cost ($kg)
$257779 $69770 1000000
1 100
6035 138 7
$10794 $5173
$456420 $118950 1000000
10 033
9647 158 15
$8639 $4719
$480444 $124447 1000000
25 033
9801 161 16
$8893 $4595
$480444 $124447 1000000
40 033
9954 161 16
$8789 $4536
$480444 $124447 1000000
154 033
9944 161 16
$8796 $4374
2015
Figure 72 MEA framegasket insertion‐molding process parameters
Annual Production Rate 1000 30000 80000 130000 500000 Equipment Lifetime
Interest Rate Corporate Income Tax Rate
Capital Recovery Factor Equipment Installation Factor
MaintenanceSpare Parts ( of CC) Miscellaneous Expenses ( of CC)
Power Consumption (kW)
1 10 40 0175 14 10 12 61
0 10 40 0175 14 10 12 91
0 10 40 0175 14 10 12 91
0 10 40 0175 14 10 12 94
0 10 40 0175 14 10 12 94
5
201
2010 ‐
Figure 73 Machine rate parameters for MEA framegasket insertion‐molding process
The cost summary for the MEA framegasket molding process is shown in Figure 74
Annual Production Rate 1000 30000 80000 130000 500000 Materials ($stack) $22236 $20285 $19755 $19498 $18801
Manufacturing ($stack) $24326 $11145 $10925 $10821 $10829 Tooling ($stack) $418 $529 $515 $511 $511
Total Cost ($stack) $46980 $31959 $31195 $30829 $30142
Total Cost ($kWnet) $587 $399 $390 $385 $377 Materials ($stack) $18026 $16444 $16014 $15806 $15241
Manufacturing ($stack) $21886 $9334 $9152 $9045 $9052 Tooling ($stack) $465 $529 $519 $511 $511
Total Cost ($stack) $40376 $26306 $25685 $25361 $24804
Total Cost ($kWnet) $505 $329 $321 $317 $310
2010
2015
Figure 74 Cost breakdown for MEA framegasket insertion molding
447 End Plates In a typical PEM fuel cell stack the purposes of an end plate are threefold
Directed Technologies Inc 61
Evenly distribute compressive loads across the stack
Cap off and protect the stack
Interface with the current collector
Normally there is also a separate insulator plate at each end to electrically insulate the stack from the rest of the vehicle However our end plate design based on a UTC patent (see Figure 75) eliminates the need for separate insulators Thus our end plates also serve a fourth function electrically insulate the ends of the stack
Made from a compression‐molded composite (LYTEX 9063) the end plate is strong enough (455 MPa) to withstand the required compressive loading while also being sufficiently electrically non‐conductive (3x10¹⁴ ohm‐cm volume resistivity) Using this material allows for an end plate with lower cost and lower thermal capacity than the typical metal end plates with the additional benefit of having no susceptibility to corrosion The benefits of lower cost and corrosion resistance are obvious and the low thermal capacity limits the thermal energy absorbed during a cold start effectively accelerating the startup period
Figure 75 End plate concept US patent 6764786
Directed Technologies Inc 62
Figure 76 End plate amp current collector63
LYTEX 9063 is a high performance engineered structural composite (ESC) molding compound consisting of epoxy and glass fiber reinforcement It is designed for military and aerospace structural applications requiring excellent mechanical properties retention of properties at elevated temperatures good chemical resistance and excellent electrical properties For all of these reasons it is ideally suited for this application
The end plates are manufactured via compression molding A summary of the procedure is as follows64
1 Remove enough LYTEX from cold storage for one days usage Allow it to warm to room temperature
2 Clean mold thoroughly Apply a uniform thin coating of a mold release (Note Once the mold is conditioned for LYTEX only periodic reapplications are required)
3 Adjust mold temperature to 300degF (148degC)
4 Adjust molding pressure on the material to 1500 psi (105 kgcm)
5 Remove protective film completely from both sides of the LYTEX
6 Cut mold charge so the LYTEX covers approximately 80 of the mold area and is about 105 of the calculated part weight
7 Dielectrically preheat the LYTEX quickly to 175degF (80degC)
8 Load material into mold and close the mold
9 Cure for 3 minutes
10 Remove part from mold Because of low shrinkage and high strength the part may fit snugly in the mold
11 Clean up mold and begin again
12 Re‐wrap unused LYTEX and return to cold storage
63 Some details of the port connections are not shown in the illustration 64 Based on Quantum Composites recommended procedures for LYTEX molding
Directed Technologies Inc 63
Annual Production Rate 1000 30000 80000 130000 500000 Capital Cost ($Line)
Costs per Tooling Set ($) Tooling Lifetime (cycles)
Simultaneous Lines Laborers per Line
Line Utilization Cycle Time (s)
CavitiesPlaten Effective Total Machine Rate ($hr)
LYTEX Cost ($kg)
$111521 $25114 300000
1 025 259 310 2
$60833 $1910
$267088 $71971 300000
1 025
1906 346 9
$20871 $1684
$289312 $77480 300000
1 025
4641 351 10
$10133 $1564
$289312 $77480 300000
1 025
7541 351 10
$6818 $1444
$333760 $88027 300000
3 025
8290 361 12
$7118 $1083
2010
Capital Cost ($Line) Costs per Tooling Set ($) Tooling Lifetime (cycles)
Simultaneous Lines Laborers per Line
Line Utilization Cycle Time (s)
CavitiesPlaten Effective Total Machine Rate ($hr)
LYTEX Cost ($kg)
$103851 $25114 300000
1 025 259 310 2
$56728 $1910
$177407 $54187 300000
1 025
2732 330 6
$10369 $1684
$177407 $54187 300000
1 025
7286 330 6
$4759 $1564
$214186 $66275 300000
1 025
9153 341 8
$4672 $1444
$214186 $66275 300000
4 025
8801 341 8
$4801 $1083
2015
Figure 77 End plate compression molding process parameters
As seen in Figure 79 the material represents the majority of the end plate costs ranging from 35 to 95 depending on the production rate
Annual Production Rate 1000 30000 80000 130000 500000 Equipment Lifetime
Interest Rate Corporate Income Tax Rate
Capital Recovery Factor Equipment Installation Factor
MaintenanceSpare Parts ( of CC) Miscellaneous Expenses ( of CC)
Power Consumption (kW)
150 10 40 0175 14 10 12 25
150 10 40 0175 14 10 12 50
150 10 40 0175 14 10 12 53
150 10 40 0175 14 10 12 53
150 10 40 0175 14 10 12 58
5
201
2010 ‐
Figure 78 Machine rate parameters for compression molding process
Annual Production Rate 1000 30000 80000 130000 500000 Materials ($stack) $3282 $2893 $2687 $2480 $1860
Manufacturing ($stack) $5294 $445 $197 $133 $119 Tooling ($stack) $167 $016 $006 $008 $007
Total Cost ($stack) $8743 $3355 $2891 $2621 $1986 Total Cost ($kWnet) $109 $042 $036 $033 $025
Materials ($stack) $2692 $2373 $2203 $2034 $1525 Manufacturing ($stack) $4937 $317 $146 $111 $114
Tooling ($stack) $167 $012 $009 $007 $007 Total Cost ($stack) $7796 $2702 $2358 $2151 $1646 Total Cost ($kWnet) $097 $034 $029 $027 $021
2010
2015
Figure 79 Cost breakdown for end plates
Directed Technologies Inc 64
448 Current Collectors The job of the current collectors is to channel the current that is distributed across the active area of the stack
down to the positive and negative terminals In our design based on the UTC patent (Figure 75) and shown in Figure 76 two copper current studs protrude through the end plates to connect to a copper sheet in contact with the last bipolar plate
The current collectors were designed to fit snugly within the end plate A shallow (03 mm) cavity in the end plate provides room for the 1 mm thick copper sheet sized to the active area of the cells The remaining 07 mm of the sheet thickness protrudes from the end plate and the end plate gasket seals around the edges
The face of the current collector is pressed against the coolant side of the last bipolar plate in the stack With the compression of the stack it makes solid electrical contact with the bipolar plate and thus can collect the current generated by the stack
The other side of the current collector is flush against the inner face of the end plate Two copper studs protrude through their corresponding holes in the end plate where they are brazed to the current collector sheet On the outside of the end plate these studs serve as electrical terminals to which power cables may be attached
Annual Production Rate 1000 30000 80000 130000 500000 Manufacturing Process
Costs per Tooling Set ($) Tooling Lifetime (cycles)
Capital Cost ($Line) Simultaneous Lines Laborers per Line
Line Utilization Effective Total Machine Rate ($hr)
Index Time (s) Copper Cost ($kg)
Manual $1799 400000 $22959
1 100 006 $4748 300
$1091
Auto $1799 400000 $67089
1 025 042 $1896 053
$1091
Auto $1799 400000 $67089
1 025 111 $719 053
$1091
Auto $1799 400000 $67089
1 025 180 $449 053
$1091
Auto $1799 400000 $67089
1 025 694 $126 053
$1091
2010
Manufacturing Process Costs per Tooling Set ($) Tooling Lifetime (cycles)
Capital Cost ($Line) Simultaneous Lines Laborers per Line
Line Utilization Effective Total Machine Rate ($hr)
Index Time (s) Copper Cost ($kg)
Manual $1716 400000 $21440
1 100 006 $4437 300
$1091
Auto $1716 400000 $65094
1 025 040 $1946 051
$1091
Auto $1716 400000 $65094
1 025 106 $736 051
$1091
Auto $1716 400000 $65094
1 025 171 $459 051
$1091
Auto $1716 400000 $65094
1 025 657 $129 051
$1091
2015
Figure 80 Current collector manufacturing process parameters
Manufacturing the current collectors is a fairly simple process A roll of 1 mm thick copper sheeting is stamped to size and 8 mm diameter copper rod is cut to 243 cm lengths The ends of the rods are then brazed to one face of the sheet At low production (1000 systems per year) a manual cutting process is used All other manufacturing rates use an automated process that cuts parts from a roll of copper sheet stock
Directed Technologies Inc 65
Annual Production Rate 1000 30000 80000 130000 500000 Equipment Lifetime
Interest Rate Corporate Income Tax Rate
Capital Recovery Factor Equipment Installation Factor
MaintenanceSpare Parts ( of CC) Miscellaneous Expenses ( of CC)
Power Consumption (kW)
15 10 40 0175 14 13 2 16
15 10 40 0175 14 13 2 16
15 10 40 0175 14 13 2 16
15 10 40 0175 14 13 2 16
15 10 40 0175 14 13 2 16
5
201
2010 ‐
Figure 81 Machine rate parameters for current collector manufacturing process
Annual Production Rate 1000 30000 80000 130000 500000 Materials ($stack) $700 $575 $511 $479 $448
Manufacturing ($stack) $915 $089 $034 $021 $006 Tooling ($stack) $012 $001 $001 $001 $001
Secondary Operations ($stack) $053 $053 $053 $053 $053 Total Cost ($stack) $1679 $718 $599 $554 $507 Total Cost ($kWnet) $021 $009 $007 $007 $006
Materials ($stack) $589 $484 $430 $404 $377 Manufacturing ($stack) $855 $086 $033 $020 $006
Tooling ($stack) $011 $001 $001 $001 $001 Secondary Operations ($stack) $053 $053 $053 $053 $053
Total Cost ($stack) $1508 $624 $516 $477 $436 Total Cost ($kWnet) $019 $008 $006 $006 $005
2010
2015
Figure 82 Cost breakdown for current collector manufacturing process
449 Coolant Gaskets The coolant gaskets allow coolant from the coolant manifolds to flow across the bipolar plates while keeping
the air and hydrogen manifolds sealed off They seal between the facing coolant‐flow sides of the bipolar plates around the perimeter of the flow fields Because there is a coolant gasket in every repeat unit plus an extra at the end of the stack (see Figure 25) there are 370 coolant gaskets needed per stack
There are several different methods of manufacturing and applying coolant gaskets The first of these is an insertion molding process which was specified for the baseline systems prior to the 2008 Update Two more methods have since been examined laser welding and screen printing the former of which was ultimately selected Figure 83 shows a comparison between the costs of the three methods
Directed Technologies Inc 66
Coolant G
asket Cost
($kW
net)
$300
$250
$200
$150
$100
$050
$000
Insertion Molding
Laser Welding
Screen Printing
0 100000 200000 300000 400000 500000
Annual Production Rate (systemsyear) Figure 83 Coolant gasket manufacturing method cost comparison (for 2010 technology)
4491 Insertion‐Molded Coolant Gaskets In this process the bipolar plates are inserted into an injection‐molding machine prior to each cycle and the
gaskets are molded directly onto the plates This is preferable to making stand‐alone gaskets because they are so thin that they lack the structural integrity to stand on their own which would make the assembly process exceedingly difficult
Prior to the 2008 Update the material specified was a generic silicone As with the MEA framegasket this material specification has been changed to a new liquid injection‐moldable hydrocarbon material from Henkel Loctite More on the material selection can be found in the section on the MEA FrameGasket (section 4463)
Unfortunately the insertion‐molding process has a relatively high manufacturing cost owing mainly to the slow cycle time of the molding process Figure 84 details the process parameters and Figure 86 summarizes the gasket costs
Directed Technologies Inc 67
Annual Production Rate 1000 30000 80000 130000 500000 Capital Cost ($Line)
Costs per Tooling Set ($) Tooling Lifetime (cycles)
Cavities per Platen Total Cycle Time (s) Simultaneous Lines Laborers per Line
Line Utilization Effective Total Machine Rate ($hr)
Material Cost ($kg)
$221621 $55129 1000000
5 1327 1
025 8159 $5272 $5142
$495804 $118950 1000000
15 1581 10 025
9673 $8838 $4691
$521983 $124447 1000000
16 1606 25 025
9828 $9115 $4569
$521983 $124447 1000000
16 1606 40 025
9981 $9002 $4509
$521983 $124447 1000000
16 1606 154 025
9971 $9009 $4348
2010
Capital Cost ($Line) Costs per Tooling Set ($) Tooling Lifetime (cycles)
Cavities per Platen Total Cycle Time (s) Simultaneous Lines Laborers per Line
Line Utilization Effective Total Machine Rate ($hr)
Material Cost ($kg)
$190040 $55129 1000000
5 133 1
025 8159 $4705 $5173
$402183 $118950 1000000
15 158 10 025
9673 $7428 $4719
$422592 $124447 1000000
16 161 25 025
9828 $7641 $4595
$422592 $124447 1000000
16 161 40 025
9981 $7550 $4536
$422592 $124447 1000000
16 161 154 025
9971 $7556 $4374
2015
Figure 84 Gasket insertion‐molding process parameters
Annual Production Rate 1000 30000 80000 130000 500000 Equipment Lifetime
Interest Rate Corporate Income Tax Rate
Capital Recovery Factor Equipment Installation Factor
MaintenanceSpare Parts ( of CC) Miscellaneous Expenses ( of CC)
Power Consumption (kW)
15 10 40 0175 14 10 12 53
15 10 40 0175 14 10 12 84
15 10 40 0175 14 10 12 86
15 10 40 0175 14 10 12 86
15 10 40 0175 14 10 12 86
5
201
2010 ‐
Figure 85 Machine rate parameters for gasket insertion‐molding process
Annual Production Rate 1000 30000 80000 130000 500000 Materials ($stack) $5739 $5235 $5098 $5032 $4852
Manufacturing ($stack) $14453 $9575 $9405 $9289 $9296 Tooling ($stack) $735 $529 $519 $511 $511
Total Cost ($stack) $20927 $15339 $15022 $14831 $14659 Total Cost ($kWnet) $262 $192 $188 $185 $183
Materials ($stack) $4445 $4055 $3949 $3898 $3759 Manufacturing ($stack) $12898 $8047 $7885 $7791 $7797
Tooling ($stack) $735 $529 $519 $511 $511 Total Cost ($stack) $18079 $12631 $12353 $12199 $12067 Total Cost ($kWnet) $226 $158 $154 $152 $151
2010
2015
Figure 86 Cost breakdown for gasket insertion‐molding
4492 Laser‐Welded Coolant Gaskets Laser welding is an option that only applies to use with metallic bipolar plates The idea of welding two plates
together to form a seal is a popular approach in the fuel cell industry an alternative to injection‐molding with potential for increased production rates Conversations with Richard Trillwood of Electron Beam Engineering of Anaheim California indicated that grade 316L stainless steel is exceptionally well‐suited to laser welding
Directed Technologies Inc 68
Additionally the thinness of the plates allows welding from above which is significantly quicker and cheaper than welding around the perimeter Figure 87 shows the key process parameters
Annual Production Rate 1000 30000 80000 130000 500000 Capital Cost ($Line)
Gaskets Welded Simultaneously Runtime per Gasket (s)
Simultaneous Lines Laborers per Line
Line Utilization Effective Total Machine Rate ($hr)
Material Cost ($kg)
$394977 1
622 1
025 1903 $29005 $000
$789955 3 21 2
025 9516 $12424 $000
$789955 3 21 6
025 8459 $13806 $000
$789955 3 21 9
025 9164 $12849 $000
$789955 3 21 32 025
9913 $11982 $000
2010
Capital Cost ($Line) Gaskets Welded Simultaneously
Runtime per Gasket (s) Simultaneous Lines Laborers per Line
Line Utilization Effective Total Machine Rate ($hr)
Material Cost ($kg)
$394977 1 6 1
025 1755 $31341 $000
$789955 3 2 2
025 8774 $13359 $000
$789955 3 2 5
025 9359 $12609 $000
$789955 3 2 8
025 9506 $12436 $000
$789955 3 2 30 025
9749 $12160 $000
2015
Figure 87 Coolant gasket laser welding process parameters
Laser welding provides a number of distinct advantages compared to traditional gasketing methods The welds are extremely consistent and repeatable and do not degrade over time as some gaskets do It also has extremely low power requirements and very low maintenance and material costs The consumables include argon gas compressed air and a cold water supply Maintenance involves lamp replacement every three months lens cleaning and general machine repair Trillwood suggested that the welding speed is limited to a range of 60 to 100 inches per minute with a maximum of three parts being welded simultaneously However according to Manufacturing Engineering amp Technology65 laser welding speeds range from 25mmin to as high as 80 mmin Taking a guess at a conservative value in the middle 15 mmin (025ms) was selected
The impact this has on the cycle time proved the processrsquo most limiting factor Although it is quicker than injection molding it is still slower than screen printing However the capital costs are low enough that laser welding is cost‐competitive with screen printing most production rates while providing a more consistent durable and reliable seal Figure 88 shows the machine rate parameters and Figure 89 shows the cost breakdown
Annual Production Rate 1000 30000 80000 130000 500000 Equipment Lifetime
Interest Rate Corporate Income Tax Rate
Capital Recovery Factor Equipment Installation Factor
MaintenanceSpare Parts ( of CC) Miscellaneous Expenses ( of CC)
Power Consumption (kW)
20 10 40 0162 14 10 12 34
20 10 40 0162 14 10 12 34
20 10 40 0162 14 10 12 34
20 10 40 0162 14 10 12 34
20 10 40 0162 14 10 12 34
5
201
2010 ‐
Figure 88 Machine rate parameters for gasket laser‐welding process
65 Manufacturing Engineering amp Technology by Kalpakjian amp Schmid (5th edition) p 957
Directed Technologies Inc 69
Annual Production Rate 1000 30000 80000 130000 500000 Materials ($stack) $000 $000 $000 $000 $000
Manufacturing ($stack) $18548 $2648 $2943 $2739 $2554 Tooling ($stack) $000 $000 $000 $000 $000
Total Cost ($stack) $18548 $2648 $2943 $2739 $2554 Total Cost ($kWnet) $232 $033 $037 $034 $032
Materials ($stack) $000 $000 $000 $000 $000 Manufacturing ($stack) $18480 $2626 $2478 $2444 $2390
Tooling ($stack) $000 $000 $000 $000 $000 Total Cost ($stack) $18480 $2626 $2478 $2444 $2390 Total Cost ($kWnet) $231 $033 $031 $031 $030
2010
2015
Figure 89 Cost breakdown for coolant gasket laser welding
4493 Screen‐Printed Coolant Gaskets Preliminary research revealed that screen printing outperformed laser welding in both cycle time and cost
efficiency Although updates to the laser welding analysis tipped the scale towards that process screen printing the gaskets is still a useful approach to have analyzed and is actually slightly cheaper than welding at most production rates Conversations with DEK International confirmed initial DTI assumptions and various screen printers were examined for their efficacy at five production levels To screen print a seal onto a bipolar plate a single plate or a pallet holding several plates is first fed into the machine by conveyor Once in the screen printer it is locked into place and cameras utilize fiduciary markers on either the plate itself or the pallet for appropriate alignment A precision emulsion screen is placed over the plates allowing a wiper to apply the sealing resin After application the resin must be UV cured to ensure adequate sealing
Two different scenarios were examined in the screen printing process In the first one plate would be printed at a time reducing costs by halving the need for handling robots to align plates It would also avoid the necessity of a pallet to align multiple plates in the screen printer The second scenario requires two handling robots to place four plates onto prefabricated self‐aligning grooves in a pallet ensuring proper alignment in the screen printer The advantage of this technique is reduced cycle time per plate However it would result in increased capital costs due to more expensive screen printers increased necessity for handling robots and precise mass‐manufacture of pallets Small variations in the grooves of pallets would lead to failure of the screen printer to align properly or apply the resin appropriately
Printers Three different screen printer models were examined as recommended by representatives from the DEK Corporation The Horizon 01i machine was suggested for one‐plate printing The Europa VI and the PV‐1200 were both evaluated for four plate printing Comparison of the screen printers can be seen in Figure 90 After cost‐analysis it was determined that despite the increased capital cost of the PV‐1200 machines their reduced cycle time (1226 second to 4 seconds) led to significant savings at high volumes Of the five different production levels examined the PV‐1200 was cheapest and most effective for all except the smallest 1000 systems per year scenario Due to low utilization the Horizon machine is the cheapest alternative at this production level Figure 91 details the cost per kW of each screen printer at the different production levels
Directed Technologies Inc 70
Screen Printers (DEK) Machine Horizon Europa VI
$1000000
841
$
in2 400
PV‐1200 Cycle Time s 963 1226 4 Cost $150000 $200000 Power Consumption kW 35 35 07
Print Area 841 Figure 90 Screen printer comparison
Figure 91 Screen printer cost vs annual production rate
Resin Our resin formula was based upon information gleaned from the Dana Corporation US patent 6824874 The patent outlines several resins that would be suitable to provide an effective seal between bipolar plates and resin ldquoArdquo was selected for its formulaic simplicity However any of the other recommended resins could be substituted with negligible changes in cost and performances
UV Curing Following printing a short conveyor is needed to transfer the printed plate to a UV curing system Consultation with representatives from UV Fusion Systems Inc of Gaithersburg Maryland along with information from the Dana Corporation resin patent indicated that the VPS 1250 lamp carrying 350 watt type D and type H+ bulbs would be adequate to cure the resin If it is only necessary to cure a single plate then one seven inch type D and one seven inch type H+ bulb should be used In order to ensure full UV coverage for a 24 inch pallet holding four plates three side‐by‐side ten inch bulbs of both types would be employed
Patent research indicates that roughly two seconds of exposure for each type of lamp is sufficient for curing When using the PV‐1200 screen printer the curing time for both lamps matches the cycle time for the screen printer If using the Horizon printer the cure time is less than half the cycle time for the printer yet in both situations the plates could be indexed to match the screen printer cycle time A shutter would be built into the lamp to block each bulb for half of the time the plate is within the system to ensure adequate exposure of both light types Rapidly turning the bulbs on and off is more destructive to the bulb life than continuous operation making a shutter the preferred method of alternating light sources
Directed Technologies Inc 71
Cost estimation for UV curing system includes cost of lamps bulbs power supply rack light shield to protect operators and blowers for both lamp operation and heat reduction
Figure 92 shows the key process parameters as selected for the model The capital cost includes the cost of the screen printer plus a UV curing system plate handling robots and a conveyor belt
Annual Production Rate 1000 30000 80000 130000 500000 Capital Cost ($Line)
Gaskets Printed Simultaneously Runtime per Gasket (s)
Simultaneous Lines Laborers per Line
Line Utilization Effective Total Machine Rate ($hr)
Material Cost ($kg)
$382339 1
976 1
025 2986 $16468 $1304
$1420142 4 10 1
025 9493 $18921 $1304
$1420142 4 10 3
025 8438 $20989 $1304
$1420142 4 10 5
025 8228 $21466 $1304
$1420142 4 10 16 025
9889 $18259 $1304
2010
Capital Cost ($Line) Gaskets Printed Simultaneously
Runtime per Gasket (s) Simultaneous Lines Laborers per Line
Line Utilization Effective Total Machine Rate ($hr)
Material Cost ($kg)
$382339 1 10 1
025 2997 $16412 $1304
$1420142 4 1 1
025 9466 $18969 $1304
$1420142 4 1 3
025 8413 $21045 $1304
$1420142 4 1 5
025 8203 $21523 $1304
$1420142 4 1 16 025
9859 $18307 $1304
2015
Figure 92 Coolant gasket screen‐printing process parameters
Maintenance Communication with DEK has indicated that if properly cared for the screen printers have a lifetime of twenty years but on average are replaced after only eight years due to poor maintenance practices The lifetime was specified as ten years Regular maintenance including machine repair cleaning and replacement of screens every 10000 cycles costs an estimated $10000 per year
Figure 93 shows the assumed machine rate parameters
Annual Production Rate 1000 30000 80000 130000 500000 Equipment Lifetime
Interest Rate Corporate Income Tax Rate
Capital Recovery Factor Equipment Installation Factor
MaintenanceSpare Parts ( of CC) Miscellaneous Expenses ( of CC)
Power Consumption (kW)
15 10 40 0175 14 3 12 61
15 10 40 0175 14 1 12 166
15 10 40 0175 14 1 12 166
15 10 40 0175 14 1 12 166
15 10 40 0175 14 1 12 166
5
201
2010 ‐
Figure 93 Machine rate parameters for coolant gasket screen printing process
Utilities Relatively little power is used by the printers A belt‐drive system that collects and releases parts is the primary power consumer of the screen printers Additional consumption comes from the alignment system the wiper blade and the screen controls Depending on the specifications of the individual printer power consumption varies from 07 to 35 kW On the other hand the UV curing system has higher power demand The total power usage ranging from 61 to 166 kW is primarily consumed by the lamps but also by the exhaust blowers and the modular blowers for the lamps Figure 94 shows the cost breakdown for the process
Directed Technologies Inc 72
Annual Production Rate 1000 30000 80000 130000 500000 Materials ($stack) $264 $264 $264 $264 $264
Manufacturing ($stack) $16524 $2012 $2232 $2282 $1941 Tooling ($stack) $000 $000 $000 $000 $000
Total Cost ($stack) $16788 $2276 $2496 $2547 $2206 Total Cost ($kWnet) $191 $026 $028 $029 $025
Materials ($stack) $204 $204 $204 $204 $204 Manufacturing ($stack) $16530 $2011 $2231 $2282 $1941
Tooling ($stack) $000 $000 $000 $000 $000 Total Cost ($stack) $16733 $2215 $2434 $2485 $2144 Total Cost ($kWnet) $192 $025 $028 $028 $025
2010
2015
Figure 94 Cost breakdown for coolant gasket screen printing
4410 End Gaskets The end gaskets are very similar to the coolant gaskets (section 449 but are sandwiched between the last
bipolar plate and the end plate rather than between two bipolar plates This means that welding is not an option as the end plates are non‐metallic They also have slightly different geometry than the coolant gaskets because they manifold the reactant gasses rather than the coolant Like the coolant gaskets they were initially modeled using insertion molding but were switched to a screen printing approach for the 2008 Update The largest difference between coolant gaskets and end gaskets is simply the quantity needed with only two end gaskets per stack there are far fewer of them than the coolant gaskets Although the same methodology is applied to their manufacture the processes are optimized from those used for the coolant gaskets in order to account for the lower quantities Figure 95 shows a comparison between the costs of the two different end gasket production methods Because of the lower production quantities the screen printing method yields a far smaller savings over the insertion‐molding method than it does for the coolant gaskets
$200
End
Gasket Cost
($kW
net )
$180
$160
$140
$120
$100
$080
$060
$040
$020
$000
Insertion Molding
Screen Printing
0 100000 200000 300000 400000 500000
Annual Production Rate (systemsyear) Figure 95 End gasket manufacturing method cost comparison (for 2008 technology)
44101 Insertion‐Molded End Gaskets The methodology for insertion molding the end gaskets is identical to that of the insertion‐molded coolant
gaskets (section 4491) Thus only the data tables are presented in this section and the reader is directed to the coolant gasket section for more details
Directed Technologies Inc 73
Annual Production Rate 1000 30000 80000 130000 500000 Capital Cost ($Line)
Costs per Tooling Set ($) Tooling Lifetime (cycles)
Cavities per Platen Total Cycle Time (s) Simultaneous Lines Laborers per Line
Line Utilization Effective Total Machine Rate ($hr)
Material Cost ($kg)
$212868 $34888 1000000
4 1327 1
025 055
$535372 $5142
$209325 $34888 1000000
4 1581 1
025 1961 $16271 $4691
$242074 $40787 1000000
5 1606 1
025 4250 $9419 $4569
$307573 $51619 1000000
7 1606 1
025 4933 $10226 $4509
$535045 $83855 1000000
14 1606 1
025 9486 $9583 $4348
2010
Capital Cost ($Line) Costs per Tooling Set ($) Tooling Lifetime (cycles)
Cavities per Platen Total Cycle Time (s) Simultaneous Lines Laborers per Line
Line Utilization Effective Total Machine Rate ($hr)
Material Cost ($kg)
$182483 $34888 1000000
4 133 1
025 055
$459137 $5173
$179260 $34888 1000000
4 158 1
025 1961 $14120 $4719
$204896 $40787 1000000
5 161 1
025 4250 $8171 $4595
$254556 $51619 1000000
7 161 1
025 4933 $8690 $4536
$430784 $83855 1000000
14 161 1
025 9486 $7986 $4374
2015
Figure 96 End gasket insertion‐molding process parameters
Annual Production Rate 1000 30000 80000 130000 500000 Equipment Lifetime
Interest Rate Corporate Income Tax Rate
Capital Recovery Factor Equipment Installation Factor
MaintenanceSpare Parts ( of CC) Miscellaneous Expenses ( of CC)
Power Consumption (kW)
15 10 40 0175 14 10 12 52
15 10 40 0175 14 10 12 52
15 10 40 0175 14 10 12 57
15 10 40 0175 14 10 12 65
15 10 40 0175 14 10 12 88
5
201
2010 ‐
Figure 97 Machine rate parameters for end gasket insertion‐molding process
Annual Production Rate 1000 30000 80000 130000 500000 Materials ($stack) $037 $034 $033 $033 $031
Manufacturing ($stack) $9917 $357 $168 $130 $061 Tooling ($stack) $233 $008 $003 $003 $002
Total Cost ($stack) $10186 $399 $204 $166 $095 Total Cost ($kWnet) $127 $005 $003 $002 $001
Materials ($stack) $029 $026 $025 $025 $024 Manufacturing ($stack) $8505 $310 $146 $111 $051
Tooling ($stack) $233 $008 $003 $003 $002 Total Cost ($stack) $8766 $344 $175 $139 $077 Total Cost ($kWnet) $110 $004 $002 $002 $001
2010
2015
Figure 98 Cost breakdown for end gasket insertion molding
44102 Screen‐Printed End Gaskets As with the insertion‐molded end gaskets the screen‐printed end gaskets share an identical methodology to
their coolant gasket counterpart but are optimized according to their production volume For more details on this process see section 4493 The data tables are presented below
Directed Technologies Inc 74
Annual Production Rate 1000 30000 80000 130000 500000 Capital Cost ($Line)
Gaskets Printed Simultaneously Runtime per Gasket (s)
Simultaneous Lines Laborers per Line
Line Utilization Effective Total Machine Rate ($hr)
Material Cost ($kg)
$382339 1
976 1
025 016
$2742033 $1304
$382339 1
976 1
025 484 $93378 $1304
$382339 1
976 1
025 1291 $36008 $1304
$382339 1
976 1
025 2098 $22766 $1304
$630187 4
310 1
025 2563 $30189 $1304
2010
Capital Cost ($Line) Gaskets Printed Simultaneously
Runtime per Gasket (s) Simultaneous Lines Laborers per Line
Line Utilization Effective Total Machine Rate ($hr)
Material Cost ($kg)
$382339 1 10 1
025 016
$2745539 $1304
$382339 1 10 1
025 484 $93496 $1304
$382339 1 10 1
025 1290 $36052 $1304
$382339 1 10 1
025 2096 $22793 $1304
$630187 4 3 1
025 2560 $30217 $1304
2015
Figure 99 End gasket screen printing process parameters
Annual Production Rate 1000 30000 80000 130000 500000 Equipment Lifetime
Interest Rate Corporate Income Tax Rate
Capital Recovery Factor Equipment Installation Factor
MaintenanceSpare Parts ( of CC) Miscellaneous Expenses ( of CC)
Power Consumption (kW)
15 10 40 0175 14 3 12 61
15 10 40 0175 14 3 12 61
15 10 40 0175 14 3 12 61
15 10 40 0175 14 3 12 61
15 10 40 0175 14 2 12 162
5
201
2010 ‐
Figure 100 Machine rate parameters for end gasket screen printing process
Annual Production Rate 1000 30000 80000 130000 500000 Materials ($stack) $002 $002 $002 $002 $002
Manufacturing ($stack) $14947 $507 $195 $123 $052 Tooling ($stack) $000 $000 $000 $000 $000
Total Cost ($stack) $14948 $508 $197 $125 $054 Total Cost ($kWnet) $187 $006 $002 $002 $001
Materials ($stack) $001 $001 $001 $001 $001 Manufacturing ($stack) $14947 $506 $195 $123 $052
Tooling ($stack) $000 $000 $000 $000 $000 Total Cost ($stack) $14948 $508 $197 $125 $053 Total Cost ($kWnet) $187 $006 $002 $002 $001
2010
2015
Figure 101 Cost breakdown for end gasket screen printing
4411 Stack Compression Traditional PEM fuel cells use tie‐rods nuts and Belleville washers to supply axial compressive force to ensure
fluid sealing and adequate electrical connectivity However the use of metallic compression bands was assumed as used by Ballard Power Systems and described in US Patent 5993987 (Figure 102) Two stainless steel bands of 2 cm width are wrapped axially around the stack and tightened to a pre‐determined stack compressive loading and then the ends of the bands are tack welded to each other The end platesrsquo low conductivity allows them to act as insulators to prevent shorting of the stack Custom recesses in the end plates are used to provide a convenient access to the lower surface of the bands to enable welding The edges of the bipolar plates do not
Directed Technologies Inc 75
contact the compressive bands The costs are reported as part of the stack assembly section as shown in Figure 106
Figure 102 Stack compression bands concept US patent 5993987
4412 Stack Assembly Stack assembly costs were based on the amortized workstation costs and the estimated times to perform the
required actions Two methods of stack assembly were analyzed manual and semi‐automated
At the lowest production rate of 1000 systems per year manual assembly was selected Manual assembly consists of workers using their hands to individually acquire and place each element of the stack end plate insulator current collector bipolar plate gasketed MEA bipolar plate and so on An entire stack is assembled at a single workstation The worker sequentially builds the stack (vertically) and then binds the cells with metallic compression bands The finished stacks are removed from the workstation by conveyor belt
At higher production levels stack assembly is semi‐automatic requiring less time and labor and ensuring superior quality control This is termed ldquosemi‐automaticrdquo because the end components (end plates current conductors and initial cells) are assembled manually but the 369 active cell repeat units are assembled via automated fixture Figure 103 details the layout of the assembly workstations and Figure 104 and Figure 105 lists additional processing parameters
Directed Technologies Inc 76
Figure 103 Semi‐automated stack assembly work flow diagram
Following assembly each stack is transported to a leak‐check station where the three sets of fluid channels (hydrogen air and coolant) are individually pressurized with gas and monitored for leaks This test is very brief and meant only to verify gas and liquid sealing Full performance testing of the stack will occur during stack conditioning
As shown in Figure 106 stack assembly is quite inexpensive ranging from $108kWnet at the most to only $046kWnet The only material costs are those of the compressive metal bands
Annual Production Rate 1000 30000 80000 130000 500000 Assembly Method
Capital Cost ($Line) Simultaneous Lines
LaborersLine Line Utilization
Effective Total Machine Rate ($hr) Index Time (min)
Manual $10913
1 100
4768 $4776 956
Semi‐Auto $799418
4 025
7575 $11991 204
Semi‐Auto $799418
9 025
8977 $10299 204
Semi‐Auto $799418
14 025
9378 $9909 204
Semi‐Auto $799418
51 025
9902 $9447 204
2010
Assembly Method Capital Cost ($Line) Simultaneous Lines
LaborersLine Line Utilization
Effective Total Machine Rate ($hr) Index Time (min)
Manual $10913
1 100
4768 $4776 956
Semi‐Auto $799418
4 025
7575 $11991 204
Semi‐Auto $799418
9 025
8977 $10299 204
Semi‐Auto $799418
14 025
9378 $9909 204
Semi‐Auto $799418
51 025
9902 $9447 204
5
201
Figure 104 Stack assembly process parameters
Directed Technologies Inc 77
Annual Production Rate 1000 30000 80000 130000 500000 Equipment Lifetime
Interest Rate Corporate Income Tax Rate
Capital Recovery Factor Equipment Installation Factor
MaintenanceSpare Parts ( of CC) Miscellaneous Expenses ( of CC)
Power Consumption (kW)
5 10 40 0306 14 10 7 1
15 10 40 0175 14 10 7 7
15 10 40 0175 14 10 7 7
15 10 40 0175 14 10 7 7
15 10 40 0175 14 10 7 7
5
201
2010 ‐
Figure 105 Machine rate parameters for stack assembly process
Annual Production Rate 1000 30000 80000 130000 500000 Compression Bands ($stack) $1000 $800 $600 $550 $500
Assembly ($stack) $7612 $4069 $3495 $3362 $3206 Total Cost ($stack) $8612 $4869 $4095 $3912 $3706 Total Cost ($kWnet) $108 $061 $051 $049 $046
Compression Bands ($stack) $1000 $800 $600 $550 $500
Assembly ($stack) $7612 $4069 $3495 $3362 $3206 Total Cost ($stack) $8612 $4869 $4095 $3912 $3706 Total Cost ($kWnet) $108 $061 $051 $049 $046
2010
2015
Figure 106 Cost breakdown for stack assembly
4413 Stack Housing The stack insulation housing is a plastic housing that encases the stack It is meant primarily for protection
from physical damage caused by road debris and liquids as well as for protection from electrical shorting contacts and a small amount of thermal insulation It is modeled as vacuum‐thermoformed polypropylene It is 05 cm thick and is separated from the stack by a 1 cm gap At high production rate the cycle time is seven seconds three for insertion and four for the vacuum thermoforming A cost breakdown of the stack housing production is shown below in Figure 107 and additional processing parameters are shown in Figure 108 and Figure 109
Annual Production Rate 1000 30000 80000 130000 500000 Materials ($stack) $507 $507 $507 $507 $507
Manufacturing ($stack) $2246 $164 $131 $088 $034 Tooling ($stack) $3422 $114 $038 $023 $006
Total Cost ($stack) $6175 $785 $676 $618 $547 Total Cost ($kWnet) $077 $010 $008 $008 $007
Materials ($stack) $434 $434 $434 $434 $434 Manufacturing ($stack) $2246 $164 $131 $088 $034
Tooling ($stack) $3422 $114 $038 $023 $006 Total Cost ($stack) $6103 $713 $603 $546 $475 Total Cost ($kWnet) $076 $009 $008 $007 $006
2010
2015
Figure 107 Cost breakdown for stack housing
Directed Technologies Inc 78
Annual Production Rate 1000 30000 80000 130000 500000 Capital Cost ($Line) $50000 $50000 $250000 $250000 $447489
Costs per Tooling Set ($) $91260 $91260 $91260 $91260 $91260 Tooling Lifetime (years) 3 3 3 3 3
Cavities per Platen 1 1 1 1 1 Total Cycle Time (s) 712 712 152 152 70 Simultaneous Lines 1 1 1 1 1 Laborers per Line 100 100 100 100 025
Line Utilization 059 1766 1005 1634 2894 Effective Total Machine Rate ($hr) $113558 $8302 $30952 $20859 $17735
Material Cost ($kg) $129 $129 $129 $129 $129 Capital Cost ($Line) $50000 $50000 $250000 $250000 $447489
Costs per Tooling Set ($) $91260 $91260 $91260 $91260 $91260 Tooling Lifetime (years) 3 3 3 3 3
Cavities per Platen 1 1 1 1 1 Total Cycle Time (s) 71 71 15 15 7 Simultaneous Lines 1 1 1 1 1 Laborers per Line 100 100 100 100 025
Line Utilization 059 1766 1005 1634 2894 Effective Total Machine Rate ($hr) $113558 $8302 $30952 $20859 $17735
Material Cost ($kg) $129 $129 $129 $129 $129
2010
2015
Figure 108 Stack housing vacuum thermoforming process parameters
Annual Production Rate 1000 30000 80000 130000 500000 Equipment Lifetime
Interest Rate Corporate Income Tax Rate
Capital Recovery Factor Equipment Installation Factor
MaintenanceSpare Parts ( of CC) Miscellaneous Expenses ( of CC)
Power Consumption (kW)
15 10 40 0229 14 5 6 30
15 10 40 0229 14 5 6 30
15 10 40 0175 14 5 6 35
15 10 40 0175 14 5 6 35
15 10 40 0175 14 5 6 40
5
201
2010 ‐
Figure 109 Machine rate parameters for stack housing vacuum thermoforming process
4414 Stack Conditioning and Testing PEM fuel cell stacks have been observed to perform better in polarization tests if they first undergo ldquostack
conditioningrdquo Consequently a series of conditioning steps are modeled based on a regulation scheme discussed in UTC Fuel Cellrsquos US patent 7078118 The UTC Fuel Cell patent describes both a voltage variation and a fueloxidant variation regime for conditioning The voltage variation method is selected since it requires marginally less fuel consumption and allows easier valving of reactants The conditioning would occur immediately after stack assembly at the factory Because the conditioning is effectively a series of controlled polarization tests the conditioning process also serves a stack quality control purpose and no further system checkout is required
Figure 110 details the stack conditioning steps The UTC patent states that while prior‐art conditioning times were 70+ hours the UTC accelerated break‐in methodology is able to achieve 95 of the performance benefit in 5 hours and typically achieve maximum performance in 133 hours66 Declining conditioning durations (5 hours for
66 The UTC Fuel Cell patents does not overtly state 133 hours to maximum performance but that duration is suggested by their specification of test procedure 10 cycles of polarization testing for maximum performance 100mAcm
2 increments and 5 minute increment hold times
Directed Technologies Inc 79
2008 technology 4 hours for 2010 and 3 hours for 2015) are selected consistent with the patentrsquos assertion that ldquothe required number will be dependent on the formulation and processing conditions used to fabricate the fuel cellsrdquo and an expectation of process improvement in the future
Cathode Filling Cycles
Anode Filling Cycles
Performance Calibrations
Step Gas on Anode
Gas on Cathode
Primary Load Switch
DC Power Supply Positive Terminal
Electrode Potential
Current Density
1 4 H2‐N2 N2 Open Connected to Cathode
Cathode 004V to 104V
Low
2 4 H2‐N2 N2 Open Connected to Cathode
Cathode 004V to 104V
Low
3 Repeat Step 1 Low
4 Repeat Step 2 Low
5 Repeat Step 1 Low
6 Repeat Step 2 Low
7 N2 4 H2‐N2 Open Connected to Anode
Anode 004V to 104V
Low
8 N2 4 H2‐N2 Open Connected to Anode
Anode 004V to 104V
Low
9 Repeat Step 7 Low
10 Repeat Step 8 Low
11 Repeat Step 7 Low
12 Repeat Step 8 Low
13 H2 Air Closed Not
Connected
Depends on Current Density
0‐1600
mAcm2
14 Repeat step 13 up to 10 times Figure 110 Stack conditioning process based on US patent 7078118 (ldquoApplied Voltage Embodimentrdquo)
Conditioning cost is calculated by estimating the capital cost of a programmable load bank to run the stacks up and down the polarization curve according to the power‐conditioning regimen The fuel cells load banks are assumed to condition three stacks simultaneously Since the three stacks can be staggered in starting time peak power can be considerably less than 3 times the individual stack rated power of 88 kWgross (for the 2010 system) It is estimated that simultaneous peak power would be approximately 150 kW and cost approximately $145000 at 500000 fuel cell systemsyear67 Hydrogen usage is estimated based on 50 fuel cell efficiency and $3kg hydrogen DTIrsquos standard machine rate methodology yields machine rates as low as $028min for each load bank Total costs for stack conditioning are shown in Figure 113 Note that considerable power is generated and rather than dumping the load to a resistor bank it may be advantageous to sell the electricity back to the grid
67 The costs of the programmable load banks are modeled on systems from FuelCon Systems Inc for which a ROM price quote of $210000 to $280000 per bank was obtained for production quantities of 10‐20
Directed Technologies Inc 80
This would require considerable electrical infrastructure and is expected to provide only a relatively small benefit68 sale of electricity to the grid is not included in our cost estimates
Annual Production Rate 1000 30000 80000 130000 500000 Capital Cost ($Line) Simultaneous Lines Laborers per Line
Line Utilization Effective Total Machine Rate ($hr)
Test Duration (hrs)
$424062 1
010 2894 $10252
5
$372317 9
010 9646 $3232
5
$312775 24 010
9645 $2831
5
$268019 38 010
9899 $2483
5
$147516 145 010
9978 $1684
5
2010
Capital Cost ($Line) Simultaneous Lines Laborers per Line
Line Utilization Effective Total Machine Rate ($hr)
Test Duration (hrs)
$424062 1
010 1736 $16605
3
$372317 6
010 8681 $3511
3
$312775 14 010
9921 $2772
3
$268019 23 010
9813 $2498
3
$147516 87 010
9978 $1684
3
2015
Figure 111 Stack conditioning process parameters
Annual Production Rate 1000 30000 80000 130000 500000 Equipment Lifetime
Interest Rate Corporate Income Tax Rate
Capital Recovery Factor Equipment Installation Factor
MaintenanceSpare Parts ( of CC) Miscellaneous Expenses ( of CC)
Power Consumption (kW)
10 10 40 0205 14 10 7 3
10 10 40 0205 14 10 7 3
10 10 40 0205 14 10 7 3
10 10 40 0205 14 10 7 3
10 10 40 0205 14 10 7 3
5
201
2010 ‐
Figure 112 Machine rate parameters for stack conditioning process
2015
2010
Annual Production Rate 1000 30000 80000 130000 500000 ConditioningTesting ($stack) $17088 $5387 $4718 $4138 $2806
Total Cost ($stack) $17088 $5387 $4718 $4138 $2806 Total Cost ($kWnet) $214 $067 $059 $052 $035
ConditioningTesting ($stack) $16606 $3511 $2772 $2498 $1684 Total Cost ($stack) $16606 $3511 $2772 $2498 $1684 Total Cost ($kWnet) $208 $044 $035 $031 $021
Figure 113 Cost breakdown for stack conditioning
45 Balance of Plant (BOP) While the stack is the heart of the fuel cell system many other components are necessary to create a
functioning system In general our cost analysis utilizes a DFMA‐style analysis methodology for the stack but a less rigorous methodology for the balance of plant (BOP) components Each of the BOP components is discussed below along with its corresponding cost basis
451 Air Loop The power system air loop consists of five elements
68 A power conditioning savings of approximately $180stack is estimated based on the sale of electricity back to the grid at $004kWh (assuming no additional infrastructure capital costs were incurred)
Directed Technologies Inc 81
Air Compressor Expander and Motor (CEM) Unit
Air Mass Flow Sensor
Air Filter and Housing
Air Ducting
These components are described in the subsections below The cost breakdown is show below in Figure 114
Annual Production Rate 1000 30000 80000 130000 500000 Filter amp Housing ($system) $5450 $4955 $4955 $4955 $4955
Compressor Expander amp Motor ($system) $148328 $81516 $68612 $66471 $64520 Mass Flow Sensor ($system) $6250 $5000 $3750 $3500 $3000
Air Ducting ($system) $9500 $7600 $5700 $5320 $4560 Total Cost ($system) $169529 $99072 $83017 $80246 $77035
Total Cost ($kWnet) $2119 $1238 $1038 $1003 $963 Filter amp Housing ($system) $5450 $4955 $4955 $4955 $4955
Compressor Expander amp Motor ($system) $115841 $65195 $53835 $51986 $50444 Mass Flow Sensor ($system) $6250 $5000 $3750 $3500 $3000
Air Ducting ($system) $4318 $3455 $2591 $2418 $2073 Total Cost ($system) $131859 $78605 $65131 $62859 $60472
Total Cost ($kWnet) $1648 $983 $814 $786 $756
2010
2015
Figure 114 Cost breakdown for air loop
4511 Compressor‐Expander‐Motor Unit amp Motor Controller The air compression system is envisioned as an integrated air compressor exhaust gas expander and
permanent magnet motor An electronic CEM controller is also included in the system
In previous yearsrsquo analyses the cost estimates for the compressor‐expander‐motor unit (CEM) were based on a simplified DFMA analysis in which the system was broken into seven cost elements wheelslobes motor controller case bearings variable geometry and assemblytest A price quote was obtained from Opcon Autorotor of Sweden for a twin‐lobe compressor and expander unit specifically designed and optimized for fuel cell systems of roughly 80 kilowatts These Opcon estimates for low production (~$40000 for quantity = 1) and high production (~$665 for 500000year) were used to validate the DTI costing estimates
For the 2009 analysis an all‐new extremely detailed CEM cost estimate was conducted in collaboration with Honeywell69 It is a bottom‐up cost analysis based directly on the blueprints from an existing Honeywell design70 which pairs a centrifugal compressor and a radial‐inflow expander with a permanent‐magnet motor running on air bearings at 100000 rpm After analyzing the base design engineers from both DTI and Honeywell simplified and improved the design to increase its performance and lower cost to better‐reflect a mass‐production design Ultimately six different configurations were examined three main configurations plus a version of each without an expander
69 Details of the Honeywell design were provided under a non‐disclosure agreement Consequently many of the details of the CEM analysis are omitted from this report
70 Honeywell Aerospace report to the US DOE ldquoCost and Performance Enhancements for a PEM Fuel Cell Turbocompressorrdquo (Contract DE‐FC36‐02AL67624)
Directed Technologies Inc 82
The six different configurations examined are listed in Figure 115 ldquoDesign 1rdquo is based on the existing Honeywell design which runs at 100000 rpm Design 2 is an optimized version of Design 1 running at 165000 rpm in order to reduce its size Design 3 is a further‐optimized future system based on Design 2 but with slightly more aggressive design assumptions Designs 4 5 and 6 are identical to Designs 1 2 and 3 respectively but with the expander removed
Current Near Future Future (100k rpm) (165k rpm) (165k rpm)
With Design 1 Design 2 Design 3 Expander (2010 tech)
Without Design 4 Design 5 Design 6 Expander (2015 tech)
Figure 115 Matrix of CEM design configurations
The estimate utilizes a combination of DFMA methodology and price quotes from established Honeywell vendors Excluding repeat parts the existing Honeywell turbocompressor design (Design 1) has 104 different components and assemblies Each of these components is categorized into one of three different tiers ldquoTier 1rdquo consists of the 26 largestmost‐significant components in need of the most careful cost analysis ldquoTier 2rdquo corresponds to the 42 mid‐level components for which a vendor quote is sufficient The ldquoTier 3rdquo components are the minor components such as screws and adhesives that are insignificant enough that educated guesses are sufficient in lieu of vendor quotes Honeywell engineers solicited price quotes from their existing supplier base for components in the top two tiers as well as for some of the components in Tier 3 and supplied these values to DTI for review and analysis
In some cases the high‐volume quotes were judged to be inappropriate as they were merely based on repeated use of low‐production‐rate manufacturing methods rather than low‐cost high‐manufacturing‐rate production and assembly methods71 Consequently these quotes were replaced with cost estimates based on a mix of DFMA techniques and our best judgment
After having completed the initial cost summation for Design 1 the unit costs seemed prohibitively high Consequently Honeywell engineers reviewed their design and created a list of potential improvements DTI augmented the list with some DFMA‐based suggestions the list was vetted by both parties and the design changes incorporated into the cost model Changes deemed reasonable to describe as ldquocurrent technologyrdquo were applied to Design 2 and the more aggressive improvements were used to define Design 3 The most important of these improvements is the switch from 100000 to 165000 rpm which facilitates a reduction in the size of the CEM by roughly 35 thereby saving greatly on material (and to a lesser extent manufacturing) costs while also providing the intrinsic benefits of reduced size These improvements are listed in Figure 116
71 The vendors approached were typically those used by Honeywell in the past Unfortunately several vendors were prototype and lowmoderate volume manufacturing facilities and were not well suited for true high rate production
Directed Technologies Inc 83
Figure 116 List of Improvements for the 6 Compressor Configurations
2010 2015
Design 1 2 3 4 5 6
Current (100k rpm)
Future (165k rpm)
Future (165k rpm)
Current (100k rpm)
Future (165k rpm)
Future (165k rpm)
x x x
x x x x x x x x x x x x x x x x
x x
x x
x x
x x x x x x x x x x
x x
x x
x x x
Improved labryinth seal
Changed fasteners to more common inexpensive design
Changed threaded inserts to more common inexpensive design
Reduced testing of machinedcast parts
Aluminum turbine wheel
With Expander Without Expander
Removed Turbine (Expander)
[Baseline
System
Design]
Increased speed from 100000 to 165000 rpm
Improved turbine wheel design
Improved variable nozzle technology
Lower cost electrical connectors
Design change to integrate housing into single casting
Integrateeliminate mounting bosses on main housing
Compressor housing design change to re‐route cooling air over motor
Improved foil bearing design
Back‐to‐back compressor wheel
Removed washersface bolts
Improved bearing installationdesign
Each of the six CEM designs was analyzed across the range of five production rates (1000 to 500000 systems per year) this yields 30 different cost estimates for each of the 100+ components Summed together they provide 30 different estimates for the CEM cost The five Design 2 estimates provide the 2010 compressor costs across the range of production rates and the Design 6 estimates are used for 2015
For the 2010 update the CEM cost model was fully integrated into the fuel cell system cost model and adjusted to scale dynamically based on the pressure and power requirements of the system This was achieved via a complex system of multipliers that are applied differently for almost every different component since there are a wide variety of combinations and permutations for costing methods across the range of components and not everything scales at the same rate For example as the pressure ratio increases and the CEM increases in size the diameter of the turbine wheel increases and its volume increases at a rate proportional to the square of its diameter The diameter of the compressor wheel scales at a different rate than that of the turbine (expander) wheel and the shaft length and motor mass each scale at yet another rate The geometric scaling factors were derived from data that Honeywell provided showing dimensions of key components across a range of performance parameters such as pressure ratio mass flow rate and shaft power
The materials cost of each component increases proportionately with the volume of material needed and the manufacturing costs scale separately at rates dependent on the manufacturing processes involved and the specifics of each process
Directed Technologies Inc 84
For components whose cost estimates are derived partially or completely from price quotes rather than full DFMA analysis (such as those in Tier 2 and Tier 3) assumptions were made about the fractional split between the componentrsquos material and manufacturing costs so that each fraction can be scaled independently
With this new scaling and integration into the main fuel cell system cost model the size and cost of the CEM now scale dynamically based on the performance requirements of the system So if a new electrical component is added to the BOP that increases the parasitic load (and thus increases the gross power required) the CEM will scale to accommodate
The DTIHoneywell CEM analysis also examined the motor controller for which the same design was deemed applicable to control all six compressor designs Unlike with the custom parts involved in the compressor the motor controller uses almost exclusively off‐the‐shelf parts that are already manufactured at high volume As such there is limited value in conducting a detailed DFMA analysis72 so the cost analysis is primarily based on vendor quotation The original Honeywell controller design was a standalone unit with its own air or water cooling However in order to cut costs it is now assumed that the CEM controller is integrated into the water‐cooled electronics housing for the overall fuel cell system controller
The CEM and motor controller costs for the various configurations are shown below in Figure 117 Because the costs now scale with performance parameters costs for the same design number are different between 2010 and 2015 Values used in the 2010 and 2015 fuel cell system cost estimates are shown in green
72 While a bottoms‐up manufacturing analysis was not conducted for the controller components assembly of the controller was assessed using DFMA techniques
Directed Technologies Inc 85
2010 2015 2010 2015 2010 2015 CEM Motor Controller Total
Design Sysyear Cost Assy Markup Cost Assy Markup Cost
Design 1 Existing Tech 100000 RPM
1000 $121581 $116247
$2300 15
$40892 $40892
$767 10
$188288 $182153 30000 $51351 $47613 $34011 $34011 $99954 $95655 80000 $38881 $35261 $32894 $32894 $84385 $80221
130000 $38184 $34586 $31423 $31423 $81965 $77828 500000 $37118 $33557 $30339 $30339 $79547 $75452
Design 2 Near‐Future 165000 RPM
1000 $86833 $83881
$2300 15
$40892 $40892
$767 10
$148328 $144933 30000 $35318 $33002 $34011 $34011 $81516 $78853 80000 $25166 $22920 $32894 $32894 $68612 $66029
130000 $24710 $22478 $31423 $31423 $66471 $63903 500000 $24051 $21839 $30339 $30339 $64520 $61976
Design 3 Future
165000 RPM
1000 $73742 $71246
$2300 15
$40892 $40892
$767 10
$133273 $130402 30000 $31121 $29259 $34011 $34011 $76690 $74548 80000 $21726 $19917 $32894 $32894 $64656 $62576
130000 $21328 $19528 $31423 $31423 $62581 $60511 500000 $20749 $18966 $30339 $30339 $60723 $58672
Design 4 Existing Tech 100000 RPM No Expander
1000 $89395 $86379
$2300 15
$40892 $40892
$767 10
$151273 $147805 30000 $33794 $31227 $34011 $34011 $79764 $76812 80000 $22388 $19898 $32894 $32894 $65418 $62554
130000 $22031 $19555 $31423 $31423 $63390 $60542 500000 $21541 $19086 $30339 $30339 $61634 $58810
Design 5 Near‐Future 165000 RPM No Expander
1000 $72286 $70374
$2300 15
$40892 $40892
$767 10
$131599 $129400 30000 $25722 $24126 $34011 $34011 $70481 $68645 80000 $16148 $14597 $32894 $32894 $58241 $56458
130000 $15889 $14347 $31423 $31423 $56327 $54552 500000 $15503 $13973 $30339 $30339 $54691 $52931
Design 6 Future
165000 RPM No Expander
1000 $60240 $58584
$2300 15
$40892 $40892
$767 10
$117746 $115841 30000 $22453 $21126 $34011 $34011 $66721 $65195 80000 $13610 $12316 $32894 $32894 $55323 $53835
130000 $13402 $12115 $31423 $31423 $53467 $51986 500000 $13089 $11810 $30339 $30339 $51914 $50444
Figure 117 CEM cost results
4512 Air Mass Flow Sensor A high‐performance (~2 signal error) automotive hot‐wire mass flow sensor for measuring the air flow rate
into the fuel cell system Since these devices are already produced in very high quantities little change in cost is expected between high and low production rates The OEM cost of a mass flow sensor for quantities of 1000 per year is estimated to be roughly $100 and drops to about $65 for high quantities
4513 Air Ducting The air ducting is modeled as conformal polymer tubes to guide the cathode air in and out of the stack
Directed Technologies Inc 86
4514 Air Filter and Housing Some fuel cell manufacturers filter inlet air both for particles and for volatile organic compounds73 However
while particle filters are needed it is not clear that VOC filters are necessary Consequently a standard automotive air particle filter and polymer filter housing are assumed
452 Humidifier amp Water Recovery Loop Based on interaction with Rajesh Ahuwalia at Argonne National Laboratory an Air Precooler and a Demister
were added to the balance of plant for the 2010 update None of these components are included in the 2015 system
Annual Production Rate 1000 30000 80000 130000 500000 Air Precooler ($system) $5275 $5275 $5275 $5275 $5275
Demister ($system) $11620 $1338 $883 $783 $626 Membrane Air Humidifier ($system) $148707 $41494 $23876 $18228 $9425
Total Cost ($system) $165602 $48107 $30035 $24286 $15326
Total Cost ($kWnet) $2070 $601 $375 $304 $192 Air Precooler ($system) $000 $000 $000 $000 $000
Demister ($system) $000 $000 $000 $000 $000 Membrane Air Humidifier ($system) $000 $000 $000 $000 $000
Total Cost ($system) $000 $000 $000 $000 $000
Total Cost ($kWnet) $000 $000 $000 $000 $000
2010
2015
Figure 118 Cost breakdown for humidifier amp water recovery loop
4521 Air Precooler The air precooler sits between the air compressor and the membrane humidifier where it cools the hot
compressed air to the humidifierrsquos optimal inlet temperature of 55degC The design is based on the ANL‐supplied key parameters for a compact liquidair cross‐flow intercooler and the dimensions are scaled based on the specific heat transfer requirements The unit is 100 aluminum and uses an array of 04‐mm‐thick tubes with 008‐mm‐thick fins spaced at 24 fins per inch which cool the air with a very minimal pressure drop (005 psi) Because the cost impact of the precooler is small a full DFMA analysis was not conducted Instead the mass and volume of the radiator core were determined by heat transfer calculations conducted at ANL and the materials cost of the unit was estimated based on detailed geometry assumptions and the cost of aluminum ($770kg) The materials cost was then simply doubled to account for the cost of manufacturing
Annual Production Rate 1000 30000 80000 130000 500000 Materials ($system) $2638 $2638 $2638 $2638 $2638
Manufacturing ($system) $2638 $2638 $2638 $2638 $2638 Total Cost ($system) $5275 $5275 $5275 $5275 $5275 Total Cost ($kWnet) $066 $066 $066 $066 $066
Materials ($system) $1722 $1722 $1722 $1722 $1722 Manufacturing ($system) $1722 $1722 $1722 $1722 $1722
Total Cost ($system) $3444 $3444 $3444 $3444 $3444 Total Cost ($kWnet) $043 $043 $043 $043 $043
2015
2010
Figure 119 Cost breakdown for air precooler
73 Press Release from the Dana Company Inc ldquoSmart Fuel Cell uses Donaldson filters in its new EFOY line of direct methanol fuel cellsrdquo 25 May 2006
Directed Technologies Inc 87
4522 Demister The demister removes liquid water droplets from the cathode exhaust stream and thereby prevent erosion of
the turbine blades Designed by DTI the demisterrsquos housing consists of two threaded hollow 2‐mm‐thick polypropylene frustums that unscrew from one another to allow access to the filter inside The filter is a nylon mesh Millipore product designed for water removal and costed at $584 each at high volume (assuming 81 cm2
per demister) The polypropylene adds only 10 cents of material cost per part and at high volume the injection molding process is only 15 cents per part Because the housing is so inexpensive the filter dominates the total demister cost ($612 or $008kWnet)
Annual Production Rate 1000 30000 80000 130000 500000 Materials ($system) $1227 $983 $740 $692 $594
Manufacturing ($system) $9973 $340 $133 $085 $026 Tooling ($system) $420 $014 $011 $006 $005
Total Cost ($system) $11620 $1338 $883 $783 $626 Total Cost ($kWnet) $145 $017 $011 $010 $008
Materials ($system) $1227 $983 $740 $692 $594 Manufacturing ($system) $9973 $341 $133 $085 $026
Tooling ($system) $420 $014 $011 $006 $005 Total Cost ($system) $11620 $1338 $884 $783 $626 Total Cost ($kWnet) $145 $017 $011 $010 $008
2015
2010
Figure 120 Cost breakdown for demister
Annual Production Rate 1000 30000 80000 130000 500000 Capital Cost ($Line)
Costs per Tooling Set ($) Tooling Lifetime (cycles)
Cavities per Platen Total Cycle Time (s) Simultaneous Lines Laborers per Line
Line Utilization Effective Total Machine Rate ($hr)
Material Cost ($kg)
$280793 $31524 1000000
1 640 1 1
011 $2639830
$129
$280793 $31524 1000000
1 640 1 1
165 $184509
$129
$280793 $31524 1000000
1 640 1 1
429 $73627 $129
$280793 $31524 1000000
1 640 1 1
694 $47308 $129
$309696 $51212 1000000
2 681 1 1
1413 $27802 $129
2010
Capital Cost ($Line) Costs per Tooling Set ($) Tooling Lifetime (cycles)
Cavities per Platen Total Cycle Time (s) Simultaneous Lines Laborers per Line
Line Utilization Effective Total Machine Rate ($hr)
Material Cost ($kg)
$280793 $31524 1000000
1 681 1 1
012 $2562833
$129
$280793 $31524 1000000
1 681 1 1
175 $174068
$129
$280793 $31524 1000000
1 681 1 1
456 $69535 $129
$280793 $31524 1000000
1 681 1 1
738 $44763 $129
$309696 $51212 1000000
2 681 1 1
1413 $27802 $129
2015
Figure 121 Demister injection molding process parameters
Directed Technologies Inc 88
Annual Production Rate 1000 30000 80000 130000 500000 Equipment Lifetime
Interest Rate Corporate Income Tax Rate
Capital Recovery Factor Equipment Installation Factor
MaintenanceSpare Parts ( of CC) Miscellaneous Expenses ( of CC)
Power Consumption (kW)
15 10 40 017 14 5 6 21
15 10 40 017 14 5 6 21
15 10 40 017 14 5 6 21
15 10 40 017 14 5 6 21
15 10 40 017 14 5 6 31
5
201
2010 ‐
Figure 122 Machine rate parameters for demister injection molding process
4523 Membrane Humidifier The design and material parameters are based on the FC200‐780‐7PP membrane humidifier from Perma Pure
LLC but the sizing is adjusted for actual flow rates A representative diagram of this humidifier is shown in Figure 123
Figure 123 Perma Pure FC200‐780‐7PP humidifier74
The manufacturing process postulated for the cost analysis involves nine steps The steps are listed below and are illustrated in Figure 124
1 Extrusion 960 parallel Nafion tubes (~1 mm OD) are simultaneously extruded and subsequently wrapped in nylon mesh to create a tube bundle for facilitated handling
2 De‐ionized (DI) Water Bath Hydration of the Nafion tubing in a near boiling water bath
3 Tube Cutting Cut the tube bundles into their appropriate length
4 Quality Control Optical quality control measurements (includes length concentricity check etc)
5 Dipping End caps are dipped in polyurethane to secure the tube bundles in the appropriate shape and provide a barrier to gas flow between the tubes at the tube ends
6 End Cap Trimming Cut polyurethane end caps to expose the inner diameter ends and allow unimpeded flow through each tube
74 Image from httpwwwpermapurecom
Directed Technologies Inc 89
7 Injection Molding Each separately molded side of the Noryl housing has two ports for the intake and exhaust gas flows
8 Final Assembly Combine casing tube bundle O‐rings C‐clips and nylon mesh filters (but do not secure)
9 Vibration Welding Vibrationally weld the two halves of the plastic case thereby trapping all interior components in place
Figure 124 Membrane humidifier manufacturing process diagram
Key assumptions made concerning the humidifier manufacturing are listed below
Manufacturing
Nafion extrusion rate is 45 cmmin
5 minute DI water bath dwell time
30 second polyurethane end cap set time
10 second total vibration welding cycle time
Directed Technologies Inc 90
Assumed 5 seconds to pick up and place each O‐ring C‐clip and mesh filter
The effective line length of the DI bath is 225 meters with the tube bundle traveling along a serpentine path to increase line length
Capital Cost Capital costs are primarily derived from previous DTI work involving similar components The complete list of capital costs is shown in Figure 125
Component Cost Nafion Extruder DI Water Bath Tube Bunch Cutting Machine Shape Checking Quality Control Polyurethane End Cap Dipper Tube Bunch Cutting Machine Final Assembly Housing Injection Molder Vibration Welder Total per Line
$200000 $50000
$100000 $200000 $100000 $100000 $10000
$600000 $700000
$2060000 Figure 125 Capital cost breakdown for a typical membrane humidifier manufacturing process
Production Speed The production speed of the process train depicted in Figure 124 is limited by the slowest manufacturing step which is the Nafion extrusion machine For lower annual production quantities a single extrusion machines75 is shared between hydration beds in order to increase machine utilization and lower capital cost The extrusion machine creates Nafion tubing which is then coiled on spools The spools are then used to feed the hydration beds
Labor It is assumed that three laborers are needed per line to oversee the process and take care of the quality control checking
The machine rate and process parameters are shown in Figure 126 and Figure 127 Figure 128 shows the cost breakdown for the membrane air humidifier
Annual Production Rate 1000 30000 80000 130000 500000 Capital Cost ($line) Simultaneous Lines Laborers per Line
Line Utilization Effective Total Machine Rate ($hr)
Production Rate (humidifiersminline)
$844654 1 3
709 $154492
787
$1995126 2
300 5314 $58828 787
$2501614 2
300 7086 $56658 787
$3008103 2
300 7676 $61676 787
$4021081 4
300 8857 $69887 787
2010
Capital Cost ($line) Simultaneous Lines Laborers per Line
Line Utilization Effective Total Machine Rate ($hr)
Production Rate (humidifiersminline)
$844654 1 3
668 $162918
787
$1995126 2
300 5007 $61375 787
$2501614 2
300 6676 $58964 787
$3008103 2
300 7233 $64750 787
$4021081 4
300 8345 $73500 787
2015
Figure 126 Membrane humidifier production process parameters
75 The extrusion machine creates Nafion tubing which is then coiled on spools The spools are then used to feed the hydration beds
Directed Technologies Inc 91
Annual Production Rate 1000 30000 80000 130000 500000 Equipment Lifetime
Interest Rate Corporate Income Tax Rate
Capital Recovery Factor Equipment Installation Factor
MaintenanceSpare Parts ( of CC) Miscellaneous Expenses ( of CC)
Power Consumption (kW)
15 10 40 0175 14 13 2 155
15 10 40 0175 14 13 2 185
15 10 40 0175 14 13 2 245
15 10 40 0175 14 13 2 305
15 10 40 0175 14 13 2 425
5
201
2010 ‐
Figure 127 Machine rate parameters for membrane humidifier production process
Annual Production Rate 1000 30000 80000 130000 500000 Material ($system) $111926 $34491 $20504 $15781 $7761
Manufacturing ($system) $36781 $7003 $3372 $2447 $1664 Markup ($system) $000 $000 $000 $000 $000
Total Cost ($system) $148707 $41494 $23876 $18228 $9425 Total Cost ($kWnet) $1859 $519 $298 $228 $118
Material ($system) $69412 $26644 $16271 $12628 $6326 Manufacturing ($system) $36547 $6884 $3307 $2421 $1649
Markup ($system) $000 $000 $000 $000 $000 Total Cost ($system) $105958 $33528 $19578 $15049 $7975 Total Cost ($kWnet) $1324 $419 $245 $188 $100
2015
2010
Figure 128 Cost breakdown for membrane air humidifier
The Fuel Cell Technical Team (FCTT) has recently suggested the exploration of non‐Nafionreg membrane materials as well as alternatives to the tube configuration so this will be investigated as part of the 2011 analysis
453 Coolant Loops The 2010 technology system has two coolant loops a high‐temperature loop to cool the fuel cell stacks and a
low‐temperature loop to condense the water vapor in the escaping exhaust For the 2015 technology system the low‐temperature loop is not included Due to inefficiencies the system loses about 75 kW of energy by heat that needs to be dissipated in the high‐temperature loop With coolant liquid T of 10degC a fluid flow of 60 gallons per hour is required
4531 High‐Temperature Coolant Loop Coolant Reservoir The cost is based on a molded plastic water tank
Coolant Pump Small pumps to provide this flow are commercially available in large quantities at approximately $60 per pump at quantities of 1000 dropping to $50 at high quantity
Coolant DI Filter The cost is based on a resin deionizer bed in a plastic housing
Thermostat amp Valve The cost is based on standard automotive components
Radiator The heat dissipation requirements of the fuel cell system are similar to those of todayrsquos standard passenger cars Consequently costs for the high and low‐temperature loop radiators are aligned with those of appropriately sized radiators used in contemporary automotive applications
Radiator Fan The cost was based on a standard automotive radiator fan and sized based on the cooling load
Directed Technologies Inc 92
Coolant Piping Assumed 2rdquo diameter rubber pipe from McMaster Carr at $693ft
Annual Production Rate 1000 30000 80000 130000 500000 Coolant Reservoir ($system) $1313 $1050 $788 $735 $630
Coolant Pump ($system) $9454 $8403 $7563 $7248 $6951 Coolant DI Filter ($system) $7878 $6303 $4727 $4412 $3782
Thermostat amp Valve ($system) $1050 $840 $630 $588 $504 Radiator ($system) $21357 $19221 $18153 $17086 $16018
Radiator Fan ($system) $8610 $6584 $5065 $4862 $4558 Coolant Piping ($system) $6765 $5412 $4059 $3789 $3247
Total Cost ($system) $56428 $47815 $40986 $38720 $35691
Total Cost ($kWnet) $705 $598 $512 $484 $446 Coolant Reservoir ($system) $1313 $1050 $788 $735 $630
Coolant Pump ($system) $9454 $8403 $7563 $7248 $6951 Coolant DI Filter ($system) $7878 $6303 $4727 $4412 $3782
Thermostat amp Valve ($system) $1050 $840 $630 $588 $504 Radiator ($system) $22461 $20215 $19092 $17969 $16846
Radiator Fan ($system) $8610 $6584 $5065 $4862 $4558 Coolant Piping ($system) $7485 $5988 $4491 $4192 $3593
Total Cost ($system) $58252 $49384 $42356 $40006 $36865
Total Cost ($kWnet) $728 $617 $529 $500 $461
2010
2015
Figure 129 Cost breakdown for high‐temperature coolant loop
4532 Low‐Temperature Coolant Loop As of the 2008 Update report it was determined that some of the duties that the exhaust loop performs in the
vehicle are not covered by the scope of this analysis Because of this only 67 of the exhaust loop cost is now included in the analysis the fraction proportionate to the loops usage by the fuel cell system Because the exhaust loop is not necessary in the 2010 and 2015 technology systems this change only affects the 2008 system
Coolant Reservoir The cost is based on a molded plastic water tank
Coolant Pump The low and high‐temperature loops require similar flow rates so the same type of pump can be used in each
Thermostat amp Valve The cost is based on standard automotive components
Radiator As with the radiator for the high‐temperature coolant loop the exhaust loop uses a radiator similar to those used in conventional automotive applications It does not need to be as large as the one for the coolant loop however so it is scaled down in cost
Radiator Fan It is assumed that the radiators for the high and low‐temperature loops are installed together such that the air flow exiting the low‐temperature radiator immediately enters the high‐temperature radiator and as such there is a single fan for both radiators which is accounted for in the high‐temperature coolant loop
Coolant Piping Assumed 2rdquo diameter rubber pipe from McMaster Carr at $693ft
Directed Technologies Inc 93
Annual Production Rate 1000 30000 80000 130000 500000 Coolant Reservoir ($system) $410 $328 $246 $230 $197
Coolant Pump ($system) $4354 $3870 $3483 $3338 $3201 Thermostat amp Valve ($system) $626 $501 $376 $351 $301
Radiator ($system) $15641 $14077 $13295 $12513 $11731 Radiator Fan ($system) $000 $000 $000 $000 $000
Coolant Piping ($system) $5400 $4320 $3240 $3024 $2592 Total Cost ($system) $10375 $9066 $8101 $7636 $7074
Total Cost ($kWnet) $130 $113 $101 $095 $088 Coolant Reservoir ($system) $000 $000 $000 $000 $000
Coolant Pump ($system) $000 $000 $000 $000 $000 Thermostat amp Valve ($system) $000 $000 $000 $000 $000
Radiator ($system) $000 $000 $000 $000 $000 Radiator Fan ($system) $000 $000 $000 $000 $000
Coolant Piping ($system) $000 $000 $000 $000 $000 Total Cost ($system) $000 $000 $000 $000 $000
Total Cost ($kWnet) $000 $000 $000 $000 $000
2010
2015
Figure 130 Cost breakdown for low‐temperature coolant loop
454 Fuel Loop Per DOE system analysis guidelines the hydrogen tank the hydrogen pressure‐relief device amp regulator and
the hydrogen fueling receptacle are not included in the fuel cell power system cost analysis Based on industry input the proportional valve and pressure transducer were removed for the 2010 Update Check valves and an over‐pressure cut‐off valve were also added These changes rely on the hydrogen storage system (not included in cost analysis) to handle some of the pressure regulation duties
Inline Filter for Gas Purity Excursions This filter ensures that any contaminants that may have gotten into the fuel lines do not damage the stack
Flow Diverter Valve The flow diverter valve routes hydrogen to either the low‐flow or the high‐flow ejector depending on the pressure
Over‐Pressure Cut‐Off (OPCO) Valve The over‐pressure cut‐off valve was added as a safety precaution after the proportional valve was removed
Low‐Flow and High‐Flow Ejectors For the 2010 system dual static ejectors are employed to re‐circulate hydrogen from the anode exhaust to the anode inlet to achieve target flow rates and hence high stack performance The ejectors operate on the Bernoulli Principle wherein high‐pressure hydrogen gas from the fuel tank (gt250 psi) flows through a converging‐diverging nozzle to entrain lower‐pressure anode exhaust gas Two ejectors (high‐flow and low‐flow) are operated in parallel to achieve a wide turn‐down range The design of the ejectors is based on concepts from Graham Manufacturing and the patent literature (US Patent 5441821) The fabrication of each ejector consists of stainless steel investment casting of a two‐part assembly followed by machining welding and polishing DTI is also investigating ejectors with variable geometry for future systems and as indicated by ANL modeling whether a hydrogen recirculation blower is needed during very low part‐power system operation
Check Valves The check valves ensure that no hydrogen may flow backwards from the ejectors
Purge Valve The purge valve allows for periodic purging of the hydrogen in the fuel loop
Hydrogen Piping The piping through which the hydrogen flows It is modeled as frac34rdquo SS304 schedule 10 pipe $2061m from McMaster Carr
Directed Technologies Inc 94
Annual Production Rate 1000 30000 80000 130000 500000 Inline Filter for GPE ($system) $1820 $1820 $1820 $1820 $1820 Flow Diverter Valve ($system) $1519 $1519 $1519 $1519 $1519
Pressure Switch ($system) $2500 $2000 $1500 $1400 $1200 Low‐Flow Ejector ($system) $5089 $3552 $3270 $3136 $3064 High‐Flow Ejector ($system) $4371 $2859 $2603 $2485 $2424
Check Valves ($system) $1000 $1000 $1000 $1000 $1000 Purge Valve ($system) $2500 $2000 $1500 $1400 $1200
Hydrogen Piping ($system) $6394 $5115 $3836 $3580 $3069 Total Cost ($system) $25194 $19865 $17049 $16340 $15296
Total Cost ($kWnet) $315 $248 $213 $204 $191 Inline Filter for GPE ($system) $000 $000 $000 $000 $000 Flow Diverter Valve ($system) $1519 $1519 $1519 $1519 $1519
Pressure Switch ($system) $2500 $2000 $1500 $1400 $1200 Low‐Flow Ejector ($system) $5089 $3552 $3270 $3136 $3064 High‐Flow Ejector ($system) $4371 $2859 $2603 $2485 $2424
Check Valves ($system) $1000 $1000 $1000 $1000 $1000 Purge Valve ($system) $2500 $2000 $1500 $1400 $1200
Hydrogen Piping ($system) $6394 $5115 $3836 $3580 $3069 Total Cost ($system) $23374 $18046 $15229 $14520 $13476
Total Cost ($kWnet) $292 $226 $190 $182 $168
2015
2010
Figure 131 Cost breakdown for fuel loop
455 System Controller Conventional electronic engine controllers (EECrsquos) are assumed to control the fuel cell power system These
programmable circuit boards are currently mass‐produced for all conventional gasoline engines and are readily adaptable for fuel cell use Prototype fuel cell vehicles may use four or more controllers out of convenience so that each subsystem is able to have a separate controller However even at 1000 vehicles per year the system will be refined enough to minimize controller use on the rationale of simplicity of cost and design A single EEC is judged necessary to supply adequate control and sensor leads to the power plant
For the 2010 Update a new bottom‐up analysis of the system controller was conducted The controller was broken down into 17 input and output circuits as listed in Figure 132
Directed Technologies Inc 95
Name Signal
Inputs
Air Mass Flow Sensor Analog H2 Pressure Sensor (upstream of ejector) Analog
H2 Pressure Sensor (stack inlet manifold) Analog
Air Pressure Sensor (after compressor) Analog
Stack Voltage (DC bus) Analog
Throttle Request Analog
Current Sensors (drawn from motor) Analog
Current Sensors (output from stack) Analog
Signal for Coolant Temperature Analog H2 Leak Detector Digital
Outputs
Signal to TIM Analog
Signal to CEM Analog
Signal to Ejector 1 PWM
Signal to Ejector 2 PWM
High Voltage System Relay Digital
Signal to Coolant Pump PWM Signal to H2 Purge Valve Digital
Total Analog
Total Digital
Total PWM
11 3 3
Total InputsOutputs 17 Figure 132 System controller input amp output requirements
For each input or output circuit it was estimated that approximately 50 cents in electronic components (referencing catalog prices) would be needed The costs of input and output connectors an embedded controller and the housing were also estimated by catalog pricing A quote was used for the assumed dual‐layer 65rdquo x 45rdquocircuit board Assembly of 50 parts was based on robotic pick‐and‐place methods This new controller analysis is currently undergoing industry vetting to validate assumptions during which time a 10 cost contingency is added to cover any unforeseen cost increases
Figure 133 and Figure 134 list the estimated system controller costs
Directed Technologies Inc 96
Component Description Cost at 500k systemsyear
Cost Basis
Main Circuit Board 2 layer punchboard $801 $534 for single layer of 65x45 punchboard Q=500 Assume 25 discount for Q=500k
Input Connector Wire connector for inputs $018 $023 each in Q=10k reduced ~20 for Q=500k Output Connector Wire connector for outputs $020 $023 each in Q=10k reduced ~20 for Q=500k
Embedded Controller 25 MHz 25 channel microprocessor board
$3250 Digi‐Key Part No 336‐1489‐ND $50Q=1 assumed 35 reduction for Q=500k
MOSFETs (17 total 1 each per IO)
P‐channel 2W 49MOhm 5A 10V
$374 Digi‐Key Part No 785‐1047‐2‐ND $02352Q=3k$02184Q=12k
Misc Board Elements
Capacitor resistors etc $425 Estimate based on $025 component for each inputoutput
Housing Shielded plastic housing watertight
$500 Estimate based on comparable shielded electronic enclosures Includes fasteners
Assembly Assembly of boardshousing $583 Robotic assembly of approx 50 parts at 35 sec each $2min assembly cost
Contingency 10 of all components $597 Standard DFMA additional cost to capture un‐enumerated elementsactivities
Markup 25 of all Components $1642 Manufacturers Markup
Total $8211 Figure 133 System controller component costs
2010
2015
Annual Production Rate 1000 30000 80000 130000 500000 Controller ($) $17107 $13685 $10264 $9580 $8211
Total Cost ($system) $17107 $13685 $10264 $9580 $8211 Total Cost ($kWnet) $214 $171 $128 $120 $103
Controller ($) $17107 $13685 $10264 $9580 $8211 Total Cost ($system) $17107 $13685 $10264 $9580 $8211 Total Cost ($kWnet) $214 $171 $128 $120 $103
Figure 134 Cost breakdown for system controller
456 Sensors Aside from the air mass flow sensor (which is book‐kept as part of the air loop) there are three types of
sensors in the fuel cell system current sensors voltage sensors and hydrogen sensors The basic sensor descriptions and their costs are listed in Figure 135 and Figure 136
Component Description Cost at 500k systemsyear
Cost Basis
Current Sensor (for stack current)
~400A Hall Effect transducer $1000 Based on LEM Automotive Current Transducer HAH1BV S06 400 A
Current Sensor (for motor current)
~400A Hall Effect transducer $1000 Based on LEM Automotive Current Transducer HAH1BV S06 400 A Rough estimate based on a small Hall Effect
Voltage Sensor 225‐335V $800 sensor in series with a resistor Dual‐sensor unit for large
H2 Sensor and small H2 concentrations $9874 Makel Engineering price quote
Dual‐sensor unit for large H2 Sensor and small H2 concentrations $9874 Makel Engineering price quote
Total $2800 Figure 135 Sensor details
Directed Technologies Inc 97
Annual Production Rate 1000 30000 80000 130000 500000 Current Sensors ($system) $2000 $2000 $2000 $2000 $2000 Voltage Sensors ($system) $800 $800 $800 $800 $800
Hydrogen Sensors ($system) $167865 $86500 $63196 $51545 $19749 Total Cost ($system) $170665 $89300 $65996 $54345 $22549
Total Cost ($kWnet) $2133 $1116 $825 $679 $282 Current Sensors ($system) $2000 $2000 $2000 $2000 $2000 Voltage Sensors ($system) $800 $800 $800 $800 $800
Hydrogen Sensors ($system) $000 $000 $000 $000 $000 Total Cost ($system) $2800 $2800 $2800 $2800 $2800
Total Cost ($kWnet) $035 $035 $035 $035 $035
2015
2010
Figure 136 Cost breakdown for sensors
4561 Current Sensors The current sensors are located on the stack and allow the system controller to monitor the current being
produced
4562 Voltage Sensors The voltage sensors are located on the stack and allow the system controller to monitor the voltage being
produced
4563 Hydrogen Sensors The vehicle will require a hydrogen sensing system to guard against hydrogen leakage accumulation and fire
It was postulated that a declining number of hydrogen sensors will be used within the fuel cell power system as a function of time and as real‐world safety data is accumulated Consequently it is estimated that two sensors would initially be used in the engine compartment dropping to zero in 2015 Additional sensors may be necessary for the passenger compartment and the fuel storage subsystem but these are not in the defined boundary of our fuel cell power system assessment
The hydrogen sensor system specified is from Makel Engineering based on the technology used in Fordrsquos Model‐U Hydrogen Powered Vehicle prototype Each sensor unit (see Figure 137) is roughly the size of a quarter and contains two sensors one for detecting large concentrations of hydrogen and another for small concentrations Each unit is accompanied by a control electronics box (also pictured in Figure 137)
Directed Technologies Inc 98
Figure 137 Hydrogen sensors amp associated control electronics
Hydrogen sensors are currently quite expensive The specified hydrogen sensors from Makel are currently hand built and cost approximately $850 each Jeffrey Stroh from Makel estimates that such units would cost approximately $100 each if mass‐produced at 500000 per year With further technology and manufacturing improvements including a move to integrated circuitry he estimates that the unit cost could drop to only $20 per sensor by the year 2015 However since hydrogen sensors were not included in the 2015 system (which again does not include the passenger cabin or fuel storage) the cheapest sensor cost in the estimate is in the 2010 system Figure 138 lists the estimated hydrogen sensor costs
2015
2010
Annual Production Rate 1000 30000 80000 130000 500000 Sensors per System 2 2 2 2 2
Sensor ($) $83933 $43250 $31598 $25772 $9874 Total Cost ($system) $167865 $86500 $63196 $51545 $19749 Total Cost ($kWnet) $2098 $1081 $790 $644 $247
Sensors per System 2 2 2 2 2 Sensor ($) $49372 $23501 $15898 $12244 $1975
Total Cost ($system) $98744 $47002 $31796 $24489 $3950 Total Cost ($kWnet) $1234 $588 $397 $306 $049
Figure 138 Cost breakdown for hydrogen sensors
457 Miscellaneous BOP The BOP components which did not fit into any of the other categories are listed here in the miscellaneous
section
Figure 139 shows the cost breakdown for these components
Directed Technologies Inc 99
Annual Production Rate 1000 30000 80000 130000 500000 Belly Pan ($system) $6051 $661 $552 $495 $424
Mounting Frames ($system) $10000 $4300 $3300 $3000 $3000 Wiring ($system) $10490 $9021 $8811 $8706 $8392
Fasteners for Wiring amp Piping ($system) $6630 $5430 $4481 $4279 $3854 Voltage Sensors ($system) $800 $800 $800 $800 $800 Current Sensors ($system) $2000 $2000 $2000 $2000 $2000
Total Cost ($system) $33171 $19412 $17144 $16480 $15669
Total Cost ($kWnet) $415 $243 $214 $206 $196 Belly Pan ($system) $6051 $661 $552 $495 $424
Mounting Frames ($system) $10000 $4300 $3300 $3000 $3000 Wiring ($system) $8626 $7419 $7246 $7160 $6901
Fasteners for Wiring amp Piping ($system) $5365 $4395 $3633 $3470 $3127 Voltage Sensors ($system) $800 $800 $800 $800 $800 Current Sensors ($system) $2000 $2000 $2000 $2000 $2000
Total Cost ($system) $30042 $16775 $14731 $14125 $13452
Total Cost ($kWnet) $376 $210 $184 $177 $168
2015
2010
Figure 139 Cost breakdown for miscellaneous BOP components
4571 Belly Pan The belly pan is modeled as a 1 x 15 m shallow rectangular pan bolted to the underside of the fuel cell system
to protect it from weather and other ambient conditions
The belly pan manufacturing process is modeled as a vacuum thermoforming process in which thin polypropylene sheets are softened with heat and sucked down on top of a one‐sided mold The capital cost of the vacuum thermoforming machine is approximately $300000 and utilizes an optional automatic loading system which costs another $200000 If manual loading is selected the process requires one laborer per line instead of the 14 laborer facilitated by the automatic loading system The analysis shows that the automatic system is only cost effective at the 500000 systems per year production rate Naturally the loading option also changes the time per part the vacuum time is 8 seconds per part on top of which the insertion time adds another 112 seconds for the manual loading or 2 seconds for the automatic method The process parameters are shown in Figure 140 and the machine rate parameters are shown in Figure 141
Directed Technologies Inc 100
Annual Production Rate 1000 30000 80000 130000 500000
Machine Selection
Assembly Type Capital Cost ($Line)
Costs per Tooling Set ($) Tooling Lifetime (years)
Cavities per Platen Total Cycle Time (s) Simultaneous Lines Laborers per Line
Line Utilization Effective Total Machine Rate ($hr)
Material Cost ($kg)
Vacuum Thermo‐
former 1 Manual $50000 $91260
3 1
7120 1 1
059 $113558
$129
Vacuum Thermo‐
former 1 Manual $50000 $91260
3 1
7120 1 1
1766 $8302 $129
Vacuum Thermo‐
former 2 Manual $250000 $91260
3 1
1520 1 1
1005 $30952 $129
Vacuum Thermo‐
former 2 Manual $250000 $91260
3 1
1520 1 1
1634 $20859 $129
Vacuum Thermo‐
former 2 Auto
$447489 $91260
3 1
700 1
025 2894 $17735 $129
2010
Machine Selection
Assembly Type Capital Cost ($Line)
Costs per Tooling Set ($) Tooling Lifetime (years)
Cavities per Platen Total Cycle Time (s) Simultaneous Lines Laborers per Line
Line Utilization Effective Total Machine Rate ($hr)
Material Cost ($kg)
Vacuum Thermo‐
former 1 Manual $50000 $91260
3 1
7120 1 1
059 $113558
$129
Vacuum Thermo‐
former 1 Manual $50000 $91260
3 1
7120 1 1
1766 $8302 $129
Vacuum Thermo‐
former 2 Manual $250000 $91260
3 1
1520 1 1
1005 $30952 $129
Vacuum Thermo‐
former 2 Manual $250000 $91260
3 1
1520 1 1
1634 $20859 $129
Vacuum Thermo‐
former 2 Auto
$447489 $91260
3 1
700 1
025 2894 $17735 $129
2015
Figure 140 Belly pan thermoforming process parameters
Annual Production Rate 1000 30000 80000 130000 500000 Equipment Lifetime
Interest Rate Corporate Income Tax Rate
Capital Recovery Factor Equipment Installation Factor
MaintenanceSpare Parts ( of CC) Miscellaneous Expenses ( of CC)
Power Consumption (kW)
8 10 40 0229 14 5 6 30
8 10 40 0229 14 5 6 30
15 10 40 0175 14 5 6 35
15 10 40 0175 14 5 6 35
15 10 40 0175 14 5 6 40
5
201
2010 ‐
Figure 141 Machine rate parameters for belly pan thermoforming process
Because of the extremely soft nature of the hot polypropylene and the low impact of the process each mold ($85056) will easily last the entire lifetime of the machine However designs are likely to change well before the machine wears out so the moldrsquos lifetime was set at three years This means that the tooling costs are sufficiently low to ignore at all but the 1000 systems per year level where they account for almost 4 of the part cost Figure 142 shows the cost breakdown
Directed Technologies Inc 101
Annual Production Rate 1000 30000 80000 130000 500000 Materials ($system) $383 $383 $383 $383 $383
Manufacturing ($system) $2246 $164 $131 $088 $034 Tooling ($system) $3422 $114 $038 $023 $006
Total Cost ($system) $6051 $661 $552 $495 $424 Total Cost ($kWnet) $076 $008 $007 $006 $005
Materials ($system) $383 $383 $383 $383 $383 Manufacturing ($system) $2246 $164 $131 $088 $034
Tooling ($system) $3422 $114 $038 $023 $006 Total Cost ($system) $6051 $661 $552 $495 $424 Total Cost ($kWnet) $076 $008 $007 $006 $005
2015
2010
Figure 142 Cost breakdown for belly pan
4572 Mounting Frames It was assumed that the fuel cell power system would be built as a subsystem then hoisted as an assembly
into the automotive engine compartment Consequently the power system attaches to a mounting frame substructure to allow easy transport These mounting frames were assumed to be contoured steel beams with various attachment points for power system components facilitating attachment to the vehicle chassis The cost is roughly estimated at $30 at 500000year to $100 at 1000year
4573 Wiring Prior to the 2008 analysis the wiring costs were estimated via a rough approximation of the total wiring length
required Because the wiring costs were the largest contributor to the Miscellaneous BOP category they have since been investigated more closely and a detailed component specification and cost estimation were conducted As in the previous analyses these costs include only the materials because the wiring installation costs are covered under the system assembly calculations
A conceptual fuel cell system wiring schematic (Figure 143) was created to determine where cables were needed and whether they were for transmission of data power or both Cable types were selected based on the maximum current required by each electrical component
Directed Technologies Inc 102
Fuel Cell Stack
High Voltage Bus Traction Motor(s) CEM
Controller CEM
Low Voltage Bus SLI Battery
Bi‐directional DC‐DC converter
System Controller
Traction Inv Module
Air M
ass Flow
Sensor
Hydrog
en Se
nsor
Therm
ostat a
nd Valve
Pneumatic C
ontrol Va
lve
Voltage Sensor
Current Sensor
H 2 Pu
rge Va
lve
Therm
ostat and Va
lve
Radiator Fan
Radio H
eadligh
ts ETC
Power Cable Data Cable
Fuse Box Coolan
t Pump
High Voltage Hybridization Battery
Included in Cost Analysis
Not Included in Cost Analysis
Key
Low‐Voltage High‐Voltage
Figure 143 Fuel cell system wiring schematic
For both of the technology levels this worked out to be five different types of cables in each system See Figure 144 for details
2010 2015 Quantity Length (m) Quantity Length (m)
Cable Types Power Cable OOOO Gauge Power Cable 6 Gauge Power Cable 7 Gauge Power Cable 12 Gauge Data Cable 16 Gauge
2 1 4 3 10
05 025 35 3 9
2 1 3 2 7
05 025 25 2 6
Totals 20 1625 15 1125 Figure 144 Wiring details
With the exception of the heavy‐duty power cables attached to the current collectors every cable was comprised of multiple wires Each cable also required a unique type of connector of which two are needed for each cable
It is assumed that the wires and connectors would be purchased rather than manufactured in‐house and high‐volume pricing estimates were obtained for the cable components from Waytek Inc Taking into account the required length of each cable the number of wires per cable and selecting the appropriate connectors the
Directed Technologies Inc 103
component prices are applied to the wiring bill of materials and the total wiring cost is calculated for each system (see Figure 145)
Annual Production Rate 1000 30000 80000 130000 500000 Cables ($system) $3484 $2996 $2926 $2891 $2787
Connectors ($system) $7006 $6025 $5885 $5815 $5605 Total Cost ($system) $10490 $9021 $8811 $8706 $8392 Total Cost ($kWnet) $131 $113 $110 $109 $105
Cables ($system) $2780 $2391 $2335 $2308 $2224 Connectors ($system) $5846 $5028 $4911 $4852 $4677 Total Cost ($system) $8626 $7419 $7246 $7160 $6901 Total Cost ($kWnet) $108 $093 $091 $089 $086
2010
2015
Figure 145 Cost breakdown for wiring
4574 Fasteners for Wiring amp Piping A detailed DFMA analysis was not conducted for these components since the level of detailed required is well
outside the bounds of this project However these components are necessary and in aggregate are of substantial cost Consequently it was assumed that the cost and mass of the fasteners were equal to 20 of the wiring and piping The volumes were book‐kept as zero because the additional space they fill was deemed negligible
46 System Assembly A detailed analysis of system assembly was not conducted since that would require detailed specification of all
assembly steps including identification of all screws clips brackets and a definition of specific component placement within the system Such an analysis is clearly beyond the scope of this project Instead an estimate of system assembly time is obtained by breaking the system down into five categories of assembly components (major minor piping hoses wiring) estimating the number of components within each category and then postulating a time to assemble each of those components Specific assumptions and total estimated assembly time for manual assembly is shown in Figure 146
Directed Technologies Inc 104
Component Component Number of Component
Placement Time Fixation Time Components Totals (minutes)
(seconds) (seconds) Major Components (Stack motors pumps vessels etc) 19 45 60 333 Minor Components (instruments devices etc) 22 30 45 275 Piping
of pipe segments 5 bends per segment 2
time per bend 0 pipe placement time 30
welds per pipe 2
weld time 90
threaded ends per pipe 0 threading time 0
175 Hoses 21 30 105 473 Wiring (manual) 23 418 667 416 System Basic Functionality Test 100
Total System Assembly Time 1771
Figure 146 Single‐station system assembly assumptions
Two types of system assembly methods are examined single‐station and assembly line In single‐station assembly approach a single workstation is used to conduct assembly of the entire fuel cell power plant Very little custom machinery is needed to assemble the system and and the components and subsystems are arrayed around the workstation for easy access For 1000 systems per year only one such workstation is required
Annual Production Rate 1000 30000 80000 130000 500000
Assembly Method Single Station Assembly
Line Assembly
Line Assembly
Line Assembly
Line Index Time (min) 1771 142 142 142 142
Capital Cost ($Line) $50000 $150000 $150000 $150000 $150000 Simultaneous Lines 1 3 6 10 36 Laborers per Line 100 1000 1000 1000 1000
Line Utilization 8784 7027 9370 9136 9760 Effective Total Machine Rate ($hr) $5325 $47789 $46970 $47033 $46871
Cost per Stack ($) $15717 $11284 $11091 $11105 $11067
Assembly Method Single Station Assembly
Line Assembly
Line Assembly
Line Assembly
Line Index Time (min) 1471 118 118 118 118
Capital Cost ($Line) $50000 $150000 $150000 $150000 $150000 Simultaneous Lines 1 3 6 10 36 Laborers per Line 100 1000 1000 1000 1000
Line Utilization 8784 7027 9370 9136 9760 Effective Total Machine Rate ($hr) $5325 $47789 $46970 $47033 $46871
Cost per Stack ($) $13055 $9372 $9212 $9224 $9192
2010
2015
Figure 147 System assembly process parameters
The assembly for all other annual production rates uses a ten‐workstation assembly line configuration Each fuel cell system flows through the assembly line sequentially The line reduces the total cumulative time required
Directed Technologies Inc 105
for system assembly because workers at each workstation on the line have their tools and components closer at hand than they do under the single workstation approach and because tool changes are minimized due to the higher repetitive nature of an assembly line This method is approximately 20 faster than the single‐workstation approach with an assembly line index time76 of only 142 minutes The system assembly cost is detailed in Figure 148
Annual PSystem Assembly amp
Tot
T
System Assembly amp Tot
1000 $15717 $15717
$196 $13055 $13055
roduction Rate Testing ($system) al Cost ($system)
otal Cost ($kWnet) Testing ($system) al Cost ($system)
30000 $11284 $11284
$141 $9372 $9372
80000 $11091 $11091
$139 $9212 $9212
130000 $11105 $11105
$139 $9224 $9224
500000 $11067 $11067
$138 $9192 $9192
2015
2010
Total Cost ($kWnet) $163 $117 $115 $115 $115
Figure 148 Cost breakdown for system assembly amp testing
47 System Testing A ten‐minute system functionality and performance test is included in the system assembly process The stack
has separately undergone multiple hours of testing as part of stack conditioning and thus there is high confidence in the stack performance System testing is only needed to ensure that the peripheral systems are functioning properly and adequately supporting the stack Typically the only testing of gasoline engines contained within automobiles is a simple engine startup as the vehicles are driven off the assembly line Corresponding the fuel cell ldquoenginesrdquo are only minimally tested for functionality Cost for this system testing is reported under system assembly
48 Cost Contingency It is common practice in the automotive industry77 to include a 10 cost contingency to cover the cost of
procedures or materials not already explicitly covered in the analysis which serves as a guard against an underestimation of cost However no such contingency has been included in this cost analysis It was omitted upon the request of the DOE in order to present purer baseline cost estimates
76 Assembly line index time is defined as the time interval each system spends at a given workstation 77 Based on personal communication with Bob Mooradian Ford Motor Company
Directed Technologies Inc 106
5 Sensitivity Analysis In addition to the baseline cost calculations a Monte Carlo analysis and a single‐variable sensitivity analysis
were conducted Triangular probability distribution functions were applied to each of the parameters analyzed with the likeliest values (the baseline assumptions) at the peaks of the triangles Figure 149 and Figure 150 show the parameters used in the Monte Carlo analysis
2010 Technology 50000 Systemsyear Parameter Units Minimum Cost Likeliest Cost Maximum Cost
Power Density mWcm2
700 833 1000
Pt Loading mgPtcm2
01 015 02
Membrane Cost $m2
$250 $2073 $2488
GDL Cost $m2
$300 $1115 $1338
Bipolar Plate Cost Factor 075 100 125
Bipolar Plate Coating Cost Factor 0 1 2
Operating Pressure atm 15 169 2
Operating Temperature degC 80 90 95
Air Stoichiometry 15 250 275
Membrane Humidifier Cost $system $7500 $9425 $12500
Compressor Efficiency 500 638 690
Air Compressor Cost $system $51616 $64520 $77424
Balance of Air Compressor Cost $system $8343 $12515 $18773
Hydrogen Recirculation System Cost $system $10197 $15296 $22944
Figure 149 Monte Carlo parameters for 2010 technology 500k sysyr
2015 Technology 50000 Systemsyear Parameter Units Minimum Cost Likeliest Cost Maximum Cost
Power Density mWcm2
833 1000 1200
Pt Loading mgPtcm2
01 015 02
Membrane Cost $m2
$250 $2229 $3000
GDL Cost $m2
$300 $1097 $3000
Bipolar Plate Cost Factor 075 100 125
Bipolar Plate Coating Cost Factor 000 100 200
Operating Pressure atm 15 169 2
Operating Temperature degC 90 99 120
Air Stoichiometry 125 200 2
Membrane Humidifier Cost $system $000 $000 $10000
Compressor Efficiency 650 680 730
Air Compressor Cost $system $40355 $50444 $60533
Balance of Air Compressor Cost $system $6685 $10028 $15042
Hydrogen Recirculation System Cost $system $8984 $13476 $20214
Figure 150 Monte Carlo parameters for 2015 technology 500k sysyr
51 Monte Carlo Parameters
The parameters chosen for the 2010 analysis are different than those used in the 2009 analysis reflecting changes in the depth and complexity of the model Each parameter is explained in detail below
Directed Technologies Inc 107
Power Density (mWcm2) ndash The power density per cm2 of active area
Platinum Loading (mgcm2) ndashTotal Pt‐group metal loading per cm2 of active area for both anode and cathode combined
Membrane Cost ($m2) ndash Cost of the membrane (m2 on the roll not the active area)
GDL Cost ($m2) ndash Cost of the macroporous GDL material (m2 on the roll not the active area)
Bipolar Plate Cost Factor ndash A factor multiplied by the manufacturing costs (manufacturing and tooling costs but not materials costs) of the bipolar plate production Since the material costs are dependent on the area of the cell (which varies with power density pressure compressor size and power draw) it would be inappropriate to use plate cost as a Monte Carlo parameter as it would not be reflective of the other parameters related to plate sizing
Bipolar Plate Coating Cost Factor ndash This multiplier applies to the total cost of coating the Bipolar Plate Thus it applies to the total materials manufacturing and tooling associated with the plate coating (but not the bipolar plate itself)
Operating Pressure (atm) ndash Pressure at which the fuel cell stack operates
Operating Temperature (degC) ndash Average stack operating temperature
Air Stoichiometry ndash The total amount of oxygen (in air) entering the fuel cell divided by the oxygen consumed by the fuel cell reaction
Membrane Humidifier Cost ($) ndash Cost of the membrane humidifier
Compressor Efficiency () ndashThe isentropic efficiency of the air compressor including the impact of the controller efficiency
Air Compressor Cost ($) ndash Includes the cost of the air compressor expander and compressor motor controller
Balance of Air Compressor Cost ($) ndash Includes air filter air filter housing and the air mass flow sensor
Hydrogen Recirculation System Cost ($) ndash Includes all components of the fuel system such as ejectors pressure switches check valves purge valves inline filters and all associated piping and ducting
52 Monte Carlo Results The analysis was conducted using the Monte Carlo simulation package Risk a plug‐in for Microsoft Excel
The simulation ran for 10000 iterations and yielded cost outputs for each technology level (in $kWnet) for both the stack and the system The stack results are shown in the next two figures (Figure 151 and Figure 152) and the system results are shown in the two figures after that (Figure 153 through Figure 154) The solid red area in each chart indicates the middle 90 probability range of cost estimates of the Monte Carlo runs ie it is 5 likely that costs will be below this range and 5 likely that costs will be above it This provides a high degree of confidence that the actual result will be within the indicated range and is a more meaningful means of conveying the system cost than a single‐value cost estimate
Directed Technologies Inc 108
Values in $
Stack Baseline 2015
Values in $
Stack Baseline 2030
2141 3047
Probability
016
014
012
010
50 900 50
2010 StackCost
Minimum $174229 008 Maximum $371104
Mean $256982 Std Dev $27792 Values 10000006
004
002
000
$kWnet
Figure 151 Monte Carlo results for fuel cell stack cost (2010 technology 500k sysyr)
1824 2600
Probability
018
016
014
012
50 900 50
2015 StackCost
010 Minimum $148443 Maximum $315879 Mean $219202008 Std Dev $23468 Values 10000
006
004
002
000
$kWnet
Figure 152 Monte Carlo results for fuel cell stack cost (2015 technology 500k sysyr)
Directed Technologies Inc 109
4740 5688
50 900 50
Probability
016
014
012
006
008
010 Baseline 2015
Minimum $432872 Maximum $634387 Mean $519653 Std Dev $29180 Values 10000
2010 System Cost
004
002
000
Values in $ $kWnet
Figure 153 Monte Carlo results for fuel cell system cost (2010 technology 500k sysyr)
3623 4425
50 900 50 018
016
014
012
Probability
006
008
010
Baseline 2030
Minimum $320312 Maximum $510463 Mean $400415 Std Dev $24396 Values 10000
2015 System Cost
004
002
000
Values in $ $kWnet
Figure 154 Monte Carlo results for fuel cell system cost (2015 technology 500k sysyr)
53 Single‐Variable Sensitivity The parameters for the single‐variable sensitivity are similar to the parameters in the Monte Carlo analysis
Thirty different cases were run for each variable These parameters are shown in Figure 155 and Figure 157 The analysis was conducted on the 500k systemsyear case Figure 156 and Figure 158 show the results of this analysis plotted on tornado charts
Directed Technologies Inc 110
System Cost ($kWnet) 2010 Technology 500000 systemsyear Input
Variable Downside Upside Range Downside Upside Base Case
Power Density (mWcm2) $5565 $4752 $813 700 1000 833
GDL Cost ($m2) $4916 $5650 $734 $300 $3000 $1115
Pt Loading (mgPtcm2) $4860 $5415 $556 010 020 015
Membrane Cost ($m2) $4884 $5267 $383 $250 $3000 $2073
Air Compressor Cost ($system) $4976 $5299 $323 $51616 $77424 $64520 Bipolar Plate Coating Cost Factor $5004 $5271 $267 000 200 100
Bipolar Plate Cost Factor $5037 $5238 $201 075 125 100
Hydrogen Recirculation System Cost ($system) $5074 $5233 $159 $10197 $22944 $15296
Air Stoichiometry $5029 $5163 $134 150 275 250 Balance of Air Compressor Cost ($system) $5085 $5216 $130 $8343 $18773 $12515 Expert Compressor Efficiency () $5212 $5120 $092 50 69 64 Operating Temperature (degC) $5202 $5114 $088 80 95 90 Operating Pressure (atm) $5112 $5181 $069 150 200 169 Membrane Humidifier Cost ($system) $5113 $5176 $063 $7500 $12500 $9425
Figure 155 Inputs amp cost results for tornado chart (2010 technology 500k sysyr)
700
$300
01
$250
$51616
0
075
$10197
15
$8343
50
95
15
$12500
1000
$3000
02
$3000
$77424
2
125
$22944
275
$18773
69
80
2
$7500
$4500 $5000 $5500 $6000
Power Density (mWcm2)
GDL Cost ($m2)
Pt Loading (mgPtcm2)
Membrane Cost ($m2)
Air Compressor Cost ($system)
Bipolar Plate Coating Cost Factor
Bipolar Plate Cost Factor
Hydrogen Recirculation System Cost ($system)
Air Stoichiometry
Balance of Air Compressor Cost ($system)
Expert Compressor Efficiency ()
Operating Temperature (degC)
Operating Pressure (atm)
Membrane Humidifier Cost ($system)
System Cost ($kWnet) 2010 Technology 500000 systemsyear
Downside
Upside
Figure 156 Tornado chart cost results for single‐variable sensitivity analysis (2010 technology 500k sysyr)
Directed Technologies Inc 111
System Cost ($kWnet) 2015 Technology 500000 systemsyear Input Variable Downside Upside Range Downside Upside Best Case
Power Density (mWcm2) $4350 $3646 $704 833 1200 1000
GDL Cost ($m2) $3783 $4390 $607 $300 $3000 $1097
Pt Loading (mgPtcm2) $3733 $4191 $458 010 020 015
Membrane Cost ($m2) $3735 $4051 $315 $250 $3000 $2229
Air Compressor Cost ($system) $3836 $4088 $252 $40355 $60533 $50444 Bipolar Plate Coating Cost Factor $3837 $4087 $250 000 200 100 Bipolar Plate Cost Factor $3874 $4050 $176 075 125 100 Hydrogen Recirculation System Cost ($system) $3906 $4046 $140 $8984 $20214 $13476 Membrane Humidifier Cost ($system) $3962 $4087 $125 $000 $10000 $000 Balance of Air Compressor Cost ($system) $3920 $4025 $104 $6685 $15042 $10028 Operating Temperature (degC) $4000 $3907 $093 90 120 9900 Air Stoichiometry $3914 $3962 $048 125 200 200 Operating Pressure (atm) $3962 $4069 $107 150 200 150 Expert Compressor Efficiency () $3968 $3953 $015 65 73 68
Figure 157 Inputs and cost results for tornado chart (2015 technology 500k sysyr)
833
$300
010
$250
$40355
0
075
$8984
$000
$6685
120
125
15
73
1200
$3000
020
$3000
$60533
2
125
$20214
$10000
$15042
90
20
20
65
$3500 $4000 $4500
Power Density (mWcm2)
GDL Cost ($m2)
Pt Loading (mgPtcm2)
Membrane Cost ($m2)
Air Compressor Cost ($system)
Bipolar Plate Coating Cost Factor
Bipolar Plate Cost Factor
Hydrogen Recirculation System Cost ($system)
Membrane Humidifier Cost ($system)
Balance of Air Compressor Cost ($system)
Operating Temperature (degC)
Air Stoichiometry
Operating Pressure (atm)
Expert Compressor Efficiency ()
System Cost ($kWnet) 2015 Technology 500000 systemsyear
Upside
Downside
Figure 158 Tornado chart of cost results for single‐variable sensitivity analysis (2015 technology 500k sysyr)
Directed Technologies Inc 112
The single‐variable sensitivity analysis highlights some important aspects not reflected in the Monte Carlo analysis
1 The four most important factors affecting cost for both the 2010 and 2015 systems relate to the stack power density GDL cost catalyst loading and membrane cost Despite the high cost of several balance of plant items (such as the CEM) the foreseeable benefit from improvements in BOP costs is minor compared to the huge benefit achievable from changes in stack parameters Future research should focus on these issues
2 Parameters related to the gaseous thermodynamic conditions (such as pressure temperature air stoichiometry and compressor efficiency) have a surprisingly minimal effect on system cost
54 Peak Power Operating Point Analysis suggests that operating at a lower peak‐power cell voltage (06 Vcell instead of 0676 Vcell) will yield
a large cost savings due to substantially increased power density However while this shift results in a physically smaller (and thus less‐expensive) fuel cell stack it has the disadvantages of a large radiator larger compressor and decreased overall fuel economy Consequently to partially quantify these effects the cost and performance model were run at 06 Vcell
Based on recent 3M polarization curves it is expected that power density increases 34 from this voltage shift (833 mWcm2 at 0676 Vcell to 1115 mWcm2 at 06Vcell) Such a change necessitates a 29 increase in radiator size due to increased waste heat dissipation and a 14 increase in CEM size due to increased air flow Additionally it leads to a reduction in peak‐power system efficiency and a slight change (~1ndash2 mpgge) in fuel economy when averaged over the entire drive cycle However the increased power density from this decrease in voltage gives a substantial reduction in stack size and a $433kWnet savings in overall system cost Figure 159 outlines the changes between the current system and the postulated lower‐voltage system
Stack Eff Rated Power
System Eff Rated Power
Current Density (mAcm2)
Cell Voltage (V)
Areal Power Density (mWcm2)
Stack Cost Impact ($kWnet)
Radiator Cost Impact ($kWnet)
CEM Cost Impact ($kWnet)
System Cost ($kWnet)
2010 Status Alternate 55 488
501 441
1233 1859
0676 0600
833 1115
‐‐ ($520)
‐‐ $057
‐‐ $010
$5138 $4705
($433)Cost Difference ($kWnet)
Figure 159 Results of shifted power operating point
Directed Technologies Inc 113
6 Conclusions Figure 160 and Figure 161 (repeats of Figure 13 and Figure 14) graphically summarize the cost trends for the
80kWnet PEM fuel cell stacks and systems
Figure 160 Gross stack cost vs annual production rate
Figure 161 Net system cost vs annual production rate
In addition to the downward trend in the current cost projections there have been significant cost reductions compared to the previous four years of analysis a consequence of technology improvement and analysis refinement The current technology (2010) cost projection is 51 lower than the initial analysis (2006) at 500k systemsyear production level Figure 162 shows the downward trend in current technology cost since the beginning of the project Figure 163 shows that the annual updates of projections for the 2010 and 2015 systems also display a downward trend
Directed Technologies Inc 114
$300 $24000
$270
$240
$21000
$18000
$10581
$9358
$7507
$6096
$5138
2006 Study
2007 Study
2008 Study
2009 Study
2010 Study
System
Cost
($system
)
System
Cost
($kW
net)
$210
$180
$150
$120
$90
$15000
$12000
$9000
$6000
$3000
$60
$30
$0 $0
0 100000 200000 300000 400000 500000 600000
Annual Production Rate (systemsyear) Figure 162 Current‐technology cost evolution
Figure 163 System cost future projections (500k sysyr)
Directed Technologies Inc 115
It should be noted that as shown in Figure 164 current study estimates for future cost projections fall short of the DOE target costs (DOE cost targets are indicated as red dots in Figure 163) However given the overall downward trend of cost projections further significant cost reductions can likely be achieved with technology advancements that have not yet been discovered
Source Characteristic Units 2010 2015 DOE Target Stack Cost $kWe (net) $25 $15
Study Estimate Stack Cost $kWe (net) $25 $21
DOE Target System Cost $kWe (net) $45 $30
Study Estimate System Cost $kWe (net) $51 $39 Figure 164 DOE targets vs DTI estimates for the stack amp system
Key conclusions from the analysis include
System cost projections are 13 and 30 above the 2010 and 2015 DOE cost targets respectively
o Stack Cost The projections meet the 2010 DOE target but are $6kW over for 2015
o System Cost The projections are $6kW over the 2010 DOE target and $9kW over for 2015
Substantial cost reductions (factors of 3ndash5) are achievable by increasing manufacturing volume from 1000 to 500000 systems per year production rate
78 of the cost reduction between high (500000 systems per year) and low production (1000 systems per year) is achieved at the 30000 systems per year production rate 93 of the cost reduction is achieved at the 130000 systems per year production rate
Balance of plant (BOP) elements (ie everything other than the fuel cell stacks) represents a large portion of total system cost (20ndash48) Consequently RampD to reduce simplify or eliminate BOP components is needed to achieve significant overall system cost reductions
Three subsystems account for 74 of BOP costs air loop high‐temperature cooling loop and sensors
BOP costs drop significantly as technology level advances due to simplification of the air compressor humidification and H2 sensor subsystems RampD is needed to ensure that these projected advances are achieved
While only a preliminary system assembly analysis was conducted a maximum cost of $196kWnet is indicated and only half of that at 500000 systems per year A more detailed analysis is required to improve confidence in this estimate
Stamped metallic bipolar plates increasingly appear to be the industry standard However both stamped metallic and injected molded polymer bipolar plates are economically viable pathways and have a projected cost of $4ndash21kWnet across all production rates examined
o Performance and longevity issues may be a larger factor than cost in selecting between metallic plates and molded plates
o Appropriate alloy selection for bipolar plates may obviate costly anti‐corrosion coatings
Directed Technologies Inc 116
o Confidence has increased in the last year that a cost‐competitive metal plate coating system exists that provides adequate corrosion resistance
o Metal plates allow welding to be used in lieu of gaskets for plate sealing
Development of NSTF (Nanostructured Thin Film) catalysts enabled significant improvements in power density and catalyst loading between 2008 and 2009 (715 mWcm2 at 025 mgPtcm2 vs 833 mWcm2
at 015 mgPtcm2) These improvements yielded a system cost reduction of ~$10kWnet
Further modest power density improvements are expected in the future (1000 mWcm2 in 2015) and are expected to result in further cost reductions
While additional platinum catalyst usage reduction would obviously be cost beneficial we project future loadings to remain approximately constant at 015 mgPtcm2 This catalyst loading is sufficiently low that platinum cost is no longer a dominant element of the system as it once was We anticipate performance advances to instead manifest themselves in power density and durability improvements
Membrane cost is expected to drop a factor of ten due primarily to mass production methods Material cost of the Nafion ionomer (or some other ion conductive ionomer) likewise is expected to drop ten‐fold in cost Alternate membranes with reduced manufacturing complexity offer an additional route to material cost reduction
Application of the NSTF catalyst at high production rates can be quite low‐cost ~$040kWnet
The gas diffusion layer (GDL) ranges from $2ndash27kWnet and is a significant cost element within the stack While currently envisioned as a macroporous carbon electrode with a secondary microporous layer alternate materials and fabrication methods should be explored to reduce cost
Hot pressing of the MEA and cutting it to cell size are observed to be minor cost elements
A polymer framegasket insertion‐molded around the MEA is seen to be a cost viable design and manufacturing concept consistent with system operation and the economically processing of the subcomponents Costs are estimated at $3ndash6kWnet
Stack assembly using either manual or robotic assembly is relatively inexpensive $040ndash$095kWnet
Stack conditioning to improve MEA performance is estimated at lt$1kWnet based on an extrapolation of current procedures However ultimately the MEA and stack conditioning procedure must be optimized together The current analysis postulates only a generic conditioning procedure
The sensitivity analysis reveals that uncertainties in power density platinum loading and platinum cost lead to significant changes in the total system cost Uncertainties in all other parameters have much smaller potential impact
There is a 90 likelihood that the system costs are between the following values
o 2010 500000 systemsyear $4744ndash$5693kWnet (‐8 to +11 of $5138 projected value)
o 2015 500000 systemsyear $3623ndash$4425kWnet (‐8 to +12 of $3945 projected value)
o Overall the range of cost variation (generally plusmn10) while still maintaining 90 confidence is quite narrow
Directed Technologies Inc 117
- Mass Production Cost Estimation for Direct H2 PEM Fuel Cell Systems for Automotive Applications 2010 Update
- Foreward
- Table of Contents
- Table of Contents (cont)
- Table of Figures
- Table of Figures (cont)
- Table of Figures (cont)
- Table of Figures (cont)
- 1 Overview
- 2 Project Approach
- 2 Project Approach (cont)
- 3 Summary of Results
- 3 Summary of Results (cont)
- Figure 1 Changes in system costs since 2009 update
- 32 System Schematics
- Figure 3 Flow schematic for the ldquocurrent technologyrdquo fuel cell system from 2008
- 322 2009 System Schematic
- 323 2010 System Schematic
- 324 2015 System Schematic
- 33 System Cost Summaries
- 332 Cost Summary of the 2015 Technology System
- 34 Cost Comparison of the Two Systems
- Figures 13 and 14
- 4 Detailed Assumptions
- Figures 17 and 18
- 42 Manufacturing Cost
- 42 Manufacturing Cost (cont)
- 421 Machine Rate Validation
- Figure 21
- 422 Material and Part Yields
- 43 Markup Rates
- 43 Markup Rates (cont)
- Figure 25 Exploded stack view (abridged to 2 cells for clarity)
- 441 Bipolar Plates
- 4411 Injection‐Molded Bipolar Plates
- Figure 28 Bipolar plate injection‐molding process parameters
- 4412 Stamped Bipolar Plates
- Figure 32 Capital costs breakdown for a typical bipolar plate stamping production line
- Figure 33 Press speed vs press force
- Figures 34 and 35
- 44121 Alloy Selection and Corrosion Concerns
- 44122 Bipolar Plate Surface Treatments and Coatings
- 44122 Bipolar Plate Surface Treatments and Coatings (cont)
- Figure 37 Magnified chromium nitride surface conversion
- Figure 38 Impact of plate spacing on nitriding cost
- 442 Membrane
- 4422 Membrane Material Cost
- 4423 Membrane Manufacturing Cost
- 4423 Membrane Manufacturing Cost (cont)
- Figure 43 Membrane fabrication process diagram
- 4423 Membrane Manufacturing Cost (cont)
- Figure 44 Simplified membrane manufacturing cost analysis assumptions
- 4424 Total Membrane Cost and Comparison to Other Estimates
- 443 Nanostructured Thin Film (NSTF) Catalyst Application
- 4431 Application Process
- 4432 Cost and Performance Assumptions
- 4433 Results
- Comparison VertiCoater vs NSTF (at equal power density ampcatalyst loading)
- 444 Catalyst Cost
- 445 Gas Diffusion Layer
- Figures 55 and 56
- Figures 56 and 57
- 446 MEA Gaskets and MEA Assembly
- Figure 61 Hot‐pressing process diagram
- 4462 Cutting amp Slitting
- Figures 66 and 67
- 4463 Insertion‐Molding the FrameGasket
- 4463 Insertion‐Molding the FrameGasket (cont)
- 447 End Plates
- Figure 75 End plate concept US patent 6764786
- Figure 76 End plate amp current collector63
- Figures 77-79
- 448 Current Collectors
- 449 Coolant Gaskets
- 4491 Insertion‐Molded Coolant Gaskets
- Figures 84-86
- Figures 87 and 88
- 4493 Screen‐Printed Coolant Gaskets
- Figure 91 Screen printer cost vs annual production rate
- Figures 92 and 93
- 4410 End Gaskets
- 44102 Screen‐Printed End Gaskets
- 4411 Stack Compression
- Figures 103 and 104
- 4413 Stack Housing
- 4414 Stack Conditioning and Testing
- Figure 110 Stack conditioning process based on US patent 7078118 (ldquoApplied Voltage Embodimentrdquo
- 45 Balance of Plant (BOP)
- 4511 Compressor‐Expander‐Motor Unit amp Motor Controller
- Figure 115 Matrix of CEM design configurations
- Figure 116 List of Improvements for the 6 Compressor Configurations
- 4511 Compressor-Expander-Motor Unit amp Motor Controller (cont)
- 4512 Air Mass Flow Sensor
- 4514 Air Filter and Housing
- 4522 Demister
- 4523 Membrane Humidifier
- Figure 124 Membrane humidifier manufacturing process diagram
- Figure 125 Capital cost breakdown for a typical membrane humidifier manufacturing process
- 453 Coolant Loops
- 4532 Low‐Temperature Coolant Loop
- 454 Fuel Loop
- 455 System Controller
- Figure 132 System controller input amp output requirements
- 456 Sensors
- 4561 Current Sensors
- 457 Miscellaneous BOP
- 4571 Belly Pan
- Figures 140 and 141
- 5 Sensitivity Analysis
- 52 Monte Carlo Results
- Figures 151 and 152
- Figures 153 and 154
- Figures 155 and 156
- Figures 157 and 158
- 54 Peak Power Operating Point
- 6 Conclusions
- Figures 162 and 163
- 6 Conclusions (cont)
- Figure 164 DOE targets vs DTI estimates for the stack amp system
-