Mascot Town Centre Precinct TMAP - City of Botany Bay · Mascot Town Centre Precinct TMAP Appendix...
52
Mascot Town Centre Precinct TMAP Appendix A APPENDIX A Working Paper 1# Strategic Modelling Calibration Report
Transcript of Mascot Town Centre Precinct TMAP - City of Botany Bay · Mascot Town Centre Precinct TMAP Appendix...

Mascot Town Centre Precinct TMAP
Appendix A
APPENDIX A
Working Paper 1# Strategic Modelling Calibration Report

Strategic Model Development & Calibration Report (Rev A)
Page i of ii
MASCOT TMAP
Strategic Model Development &
Calibration Report
Rev No.
Date Prepared by Reviewed by
A 5/09/11 M Stephens C Wiafe
Contact for further information:
Matthew Stephens NSW Traffic & Transport Planning Manager
(02) 9925 5542 0414 236 130
© Snowy Mountains Engineering Corporation (SMEC Australia Pty Ltd)
The information within this document produced by SMEC Australia is solely for the use of the Client identified on the cover sheet for the purpose for which it has been prepared. SMEC Australia undertakes no duty to or accepts any responsibility to any third party who may rely upon this document. All rights reserved. No section or element of this document may be removed from this document, reproduced, electronically stored or transmitted in any form without the written permission of SMEC Australia.
Strategic Model Development & Calibration Report (Rev A)
Page ii of ii
TABLE OF CONTENTS
1 INTRODUCTION .............................................1
2 TRINITY MODEL INPUTS ...........................2
3 TRAVEL PATTERNS .....................................7
4 MASCOT SUB-AREA MODEL ............... 10
APPENDIX ‘A’ TRINITY Model Calibration
APPENDIX ‘B’ Sub-Area Model Network
APPENDIX ‘C’ 2011 AM & PM Peak Link Flow Plots
APPENDIX ‘D’ 2011 AM & PM Peak Network LOS
APPENDIX ‘E’ Sub-Area Model Calibration
Strategic Model Development & Calibration Report (Rev A)
Page 1 of 7
1 INTRODUCTION
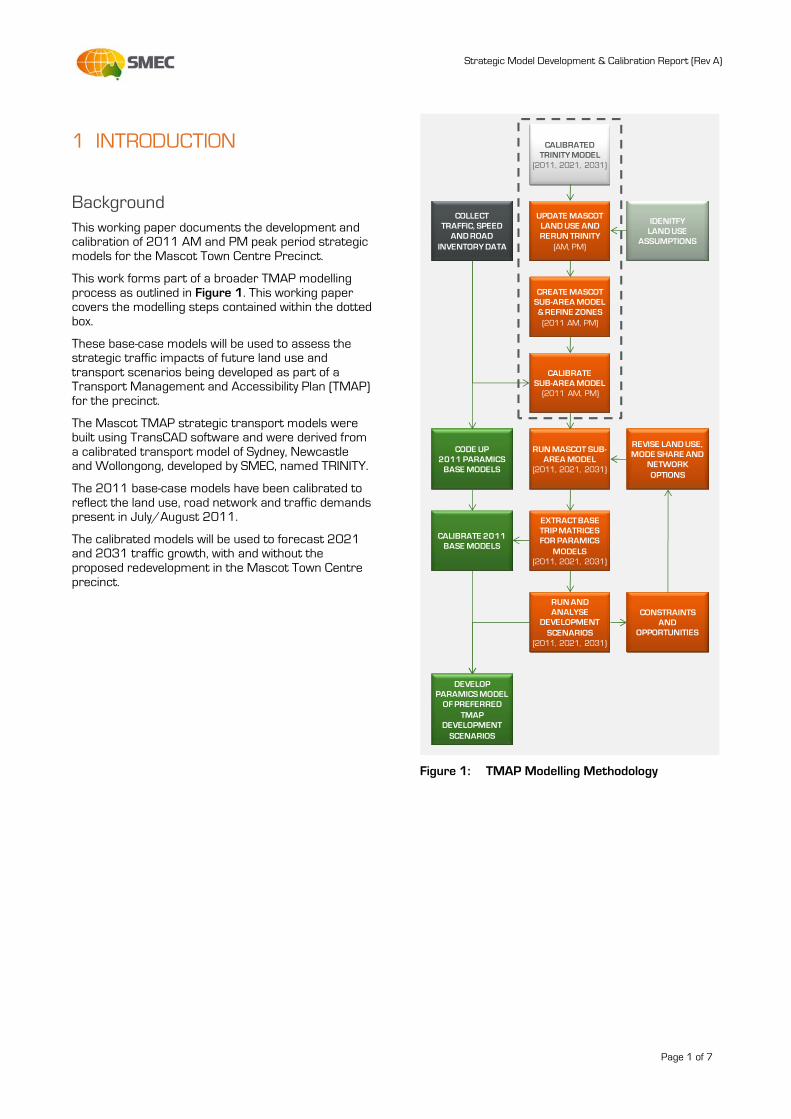
Background This working paper documents the development and calibration of 2011 AM and PM peak period strategic models for the Mascot Town Centre Precinct.
This work forms part of a broader TMAP modelling process as outlined in Figure 1. This working paper covers the modelling steps contained within the dotted box.
These base-case models will be used to assess the strategic traffic impacts of future land use and transport scenarios being developed as part of a Transport Management and Accessibility Plan (TMAP) for the precinct.
The Mascot TMAP strategic transport models were built using TransCAD software and were derived from a calibrated transport model of Sydney, Newcastle and Wollongong, developed by SMEC, named TRINITY.
The 2011 base-case models have been calibrated to reflect the land use, road network and traffic demands present in July/August 2011.
The calibrated models will be used to forecast 2021 and 2031 traffic growth, with and without the proposed redevelopment in the Mascot Town Centre precinct.
CALIBRATED TRINITY MODEL
(2011, 2021, 2031)
UPDATE MASCOT LAND USE AND RERUN TRINITY
(AM, PM)
CREATE MASCOT SUB-AREA MODEL & REFINE ZONES(2011 AM, PM)
RUN MASCOT SUB-AREA MODEL
(2011, 2021, 2031)
EXTRACT BASE TRIP MATRICES FOR PARAMICS
MODELS(2011, 2021, 2031)
RUN AND ANALYSE
DEVELOPMENT SCENARIOS
(2011, 2021, 2031)
CALIBRATE 2011 BASE MODELS
CODE UP2011 PARAMICS
BASE MODELS
IDENITFY LAND USE
ASSUMPTIONS
DEVELOP PARAMICS MODEL
OF PREFERRED TMAP
DEVELOPMENT SCENARIOS
CALIBRATE SUB-AREA MODEL
(2011 AM, PM)
CONSTRAINTS AND
OPPORTUNITIES
REVISE LAND USE, MODE SHARE AND
NETWORK OPTIONS
COLLECT TRAFFIC, SPEED
AND ROAD INVENTORY DATA
Figure 1: TMAP Modelling Methodology

Strategic Model Development & Calibration Report (Rev A)
Page 2 of 7
2 TRINITY MODEL INPUTS
Background The regional travel patterns contained within the Mascot TMAP models were derived from SMEC’s TRINITY Transport Model (TRINITY).
TRINITY is a strategic transport model of the Sydney, Newcastle and Wollongong metropolitan areas. It is a series of geospatial information layers, databases and spreadsheets embedded within a transport modelling software package. These elements combined create a mathematical representation of land use and travel patterns in the Sydney Greater Metropolitan Area (GMA).
TRINITY is a software tool for forecasting traffic growth and planning of Sydney’s future road infrastructure needs. It is unique in its socio-economic approach to travel demand, its geographic scope and the number (21) of trip purposes (work, shopping, recreational etc) it models.
TRINITY covers an area of 2.5 million hectares and contains 21,000km of road network and 20,500 intersections.
Modelling Overview The TRINITY model relies heavily on sound transport engineering practices.
The trip patterns that make up the engine room for TRINITY were developed from first principles using a well documented and established 3-step modelling process that includes:
Trip Generation
Trip Distribution
Trip Assignment
It is the first two steps in this process that have the biggest impact on model accuracy.
Trip Generation In the trip generation phase, TRINITY predicts the number of trips originating from or destined to a particular geographic area (or travel zone). In Sydney there are over 2,690 travel zones ranging in size from 0.4Ha (a city block) to over 120,000Ha (Hawkesbury region).
Trip generation mainly focuses on households. The total trips produced or attracted by a household are a function of the social and economic attributes of that household.
SMEC undertook cross classification analysis of data from BTS’s 170,000 Household Travel Surveys (HTS) collected across the Sydney GMA. The analysis identified average trip rates for 100 possible trip
purposes divided into 6 household income categories. The 20 most influential trip purposes are used in TRINITY.
The cross- classification method is widely used in transport planning. A 2007 survey of over 220 US Metropolitan Planning Organisations (MPOs) revealed that over 89% use this method for development of trip generation rates.
Trip Distribution In trip distribution TRINITY matches trip makers’ origins and destinations to develop an origin and destination matrix (or Trip Table) that displays the number of trips going from each origin to each destination. Historically, this component has been the least developed component of transport planning models.
BTSHome Travel Survey Data
Flat File
Category Analysis
• Income Categories
• Trip Rates per Income Category
• Trip Length by Purpose
• Trip Purpose by Time of Day
ABSSocio
Economic (HH Income)
ABSPopulation
DataHousehold
Data
Trip Generation
Rates (6 x 20=120)
ZonalProductions &
Attractions
Trip Zone to ZoneDistribution
(Gravity Model)
Traffic Assignment & Model Calibration
1
2
3
Figure 2: The 3-Step Modelling Process

Strategic Model Development & Calibration Report (Rev A)
Page 3 of 7
Trip distribution in TRINITY is based on the ‘Gravity’ model concept. As the name implies, this model adapts the gravitational concept, as advanced by Newton in 1686, to the problem of distributing traffic throughout an urban area.
The gravity model is one of the most widely used formulae in transportation planning, mainly because it is simple in concept and because it has been well documented. In essence, the gravity model says that trip interchange between zones is directly proportional to the relative attraction of each of the zones and inversely proportional to some function of the spatial separation between zones. This function of spatial separation adjusts the relative attraction of each zone for the ability, desire, or necessity of the trip maker to overcome the spatial separation involved.
TRINITY was calibrated for each trip purpose by comparing surveyed trip length profiles with the modelled profiles until we achieved a satisfactory match. For example average trip lengths for shopping trips (11 minutes) are significantly lower than for work trips (27minutes).
The gravity model responds by limiting the distribution of shopping trips to predominantly local shopping destinations (within 11 minutes travel time) but permits distribution of work trips to a wider range of possible work destinations.
The TRINITY model incorporates the following innovations designed to refine the trip distribution process:
K-factors
Public transport accessibility factors
K-Factors
K-factors are a specific zone-to-zone adjustment factor for work trips which incorporates travel patterns not otherwise accounted for in the gravity model.
Our review of household travel survey data identified distinct socio-economic relationships between employment and income category e.g. people in high income households tend to work in high paying white collar industries.
ORIGINZONE
IC6Households
(White Collar)
IC1Households(Blue Collar)
Primary Industry/
Manufacturing
Office
Figure 3: The K-Factor Concept
The K-factor:
reduces the ‘attractiveness’ of Office jobs to low income category work trips
reduces the ‘attractiveness’ of primary industry jobs to high income category work trips
0%
10%
20%
30%
40%
50%
60%
70%
80%
90%
100%
IC1 IC2 IC3 IC4 IC5 IC6
Primary Industry
Manufacturing
Office
Health
Recreation
Construction
Figure 4: Socio-economic Relationship between
Employment & Household Income Category (IC1 to IC61)
Public Transport Accessibility
The second innovation was the introduction of origin (O-car) and destination (D-car) public transport accessibility factors.
Whilst the earlier trip generation process develops 120 generic trip production profiles (6x 20 = 120), these profiles do not reflect the accessibility of public transport alternatives unique to each travel zone.
To address this issue, TRINITY factors the generic production and attraction profiles up or down based on the individual mode share profiles for each travel zone.
In essence, TRINITY generates close to 320,000 unique trip profiles (6 x 20 x 2,690 = 322,800).
These factors simulate the impacts of public transport and parking accessibility on car trip productions and attractions in each travel zone. For example, the D-car factor reduces the attractiveness of the Sydney CBD as a destination for car trips to reflect the excellent accessibility of public transport services and poor availability of car-parking.
1 IC1 represents an annual household income less than $25,000. IC6 represents an annual household income more than $150,000.

Strategic Model Development & Calibration Report (Rev A)
Page 4 of 7
Data Inputs TRINITY incorporates the latest land use and travel data sets available. Key inputs include:
2006 Census data
170,000 Home Travel Surveys (HTS) collected by the Bureau of Transport Statistics (BTS)
NSW Roads & Traffic Authority (RTA) road networks and traffic counts
BTS Freight Matrices
Calibration The calibration (accuracy) of transport models such as TRINITY is determined by comparing observed (counted) traffic volumes with modelled traffic volumes.
TRINITY has been vigorously calibrated and validated against the data from more than 440 RTA traffic count sites spread throughout the Sydney road network.
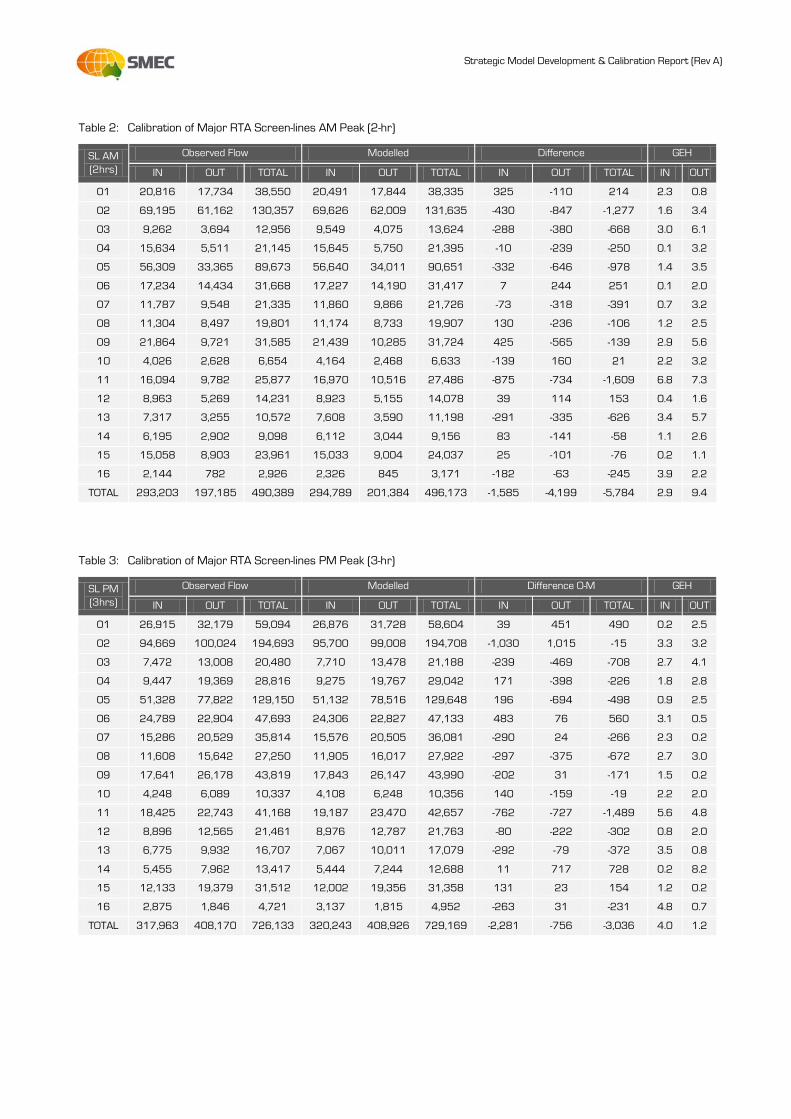
TRINITY has also been calibrated along the major RTA screen-lines. Screen-lines were established by the RTA for modeling calibration purposes. They are used to ensure that the models accurately replicate the movement of vehicles along natural corridors within the network. A plot of the RTA screen-line locations is provided below in Figure 5.
TRINITY meets or exceeds the minimum calibration targets required by the RTA.
Figure 5: RTA Screen-line Locations
The RTA has generally adopted the UK’s DMRB2 standards for model calibration. These rely heavily on a measure called the GEH statistic. The GEH statistic is a self-scaling empirical statistic with similarities to a chi-squared test. The desired target is to achieve a GEH value less than 5.0 at more than 85% of sites.
Because the GEH statistic is self-scaling, a single acceptance threshold based on GEH can be used over a fairly wide range of traffic volumes.
The formula for the "GEH Statistic" is shown below:
Where ‘M’ is the hourly traffic volume from the traffic model and ‘C’ is the real-world hourly traffic count.
Using the GEH Statistic avoids some difficulties that occur when using simple percentages to compare two sets of volumes.
For traffic calibration of the base year modelling the following is important:
GEH of less than 5.0 is considered a good match between the modelled and observed hourly volumes. When 85% of the volumes on screen lines in a traffic model have a GEH less than 5.0 model one could assume that the model is sufficiently calibrated.
If GEH values in the range of 5.0 to 10.0 are dominant this may warrant detail investigation.
If the proportion of GEH greater than 10.0 is significant, there is a high probability that there is a problem with either the travel demand model or the data (this could something as simple as a data entry error, or as complicated as a serious model calibration problem)
2 Design Manual for Roads & Bridges, Volume 12, Section 2, Traffic Appraisal Advice, May 1996

Strategic Model Development & Calibration Report (Rev A)
Page 5 of 7
Calibration Results In the 2006 AM peak, TRINITY has achieved the following excellent calibration results:
89% of sites achieved a GEH statistic less than 5.0
100% of major bridge crossings (for example, Sydney Harbour Bridge, Sydney Harbour Tunnel, Gladesville Bridge) achieved a GEH statistic less than 5.0
90% of sites on the major RTA screen-lines achieved a GEH statistic less than 5.0
In the 2006 PM peak, TRINITY has achieved the following excellent calibration results:
95% of sites achieved a GEH statistic less than 5.0
100% of major bridge crossings achieved a GEH statistic less than 5.0
94% of sites on the major RTA screen-lines achieved a GEH statistic less than 5.0.
The model matrices were also calibrated against household travel survey trip length data.
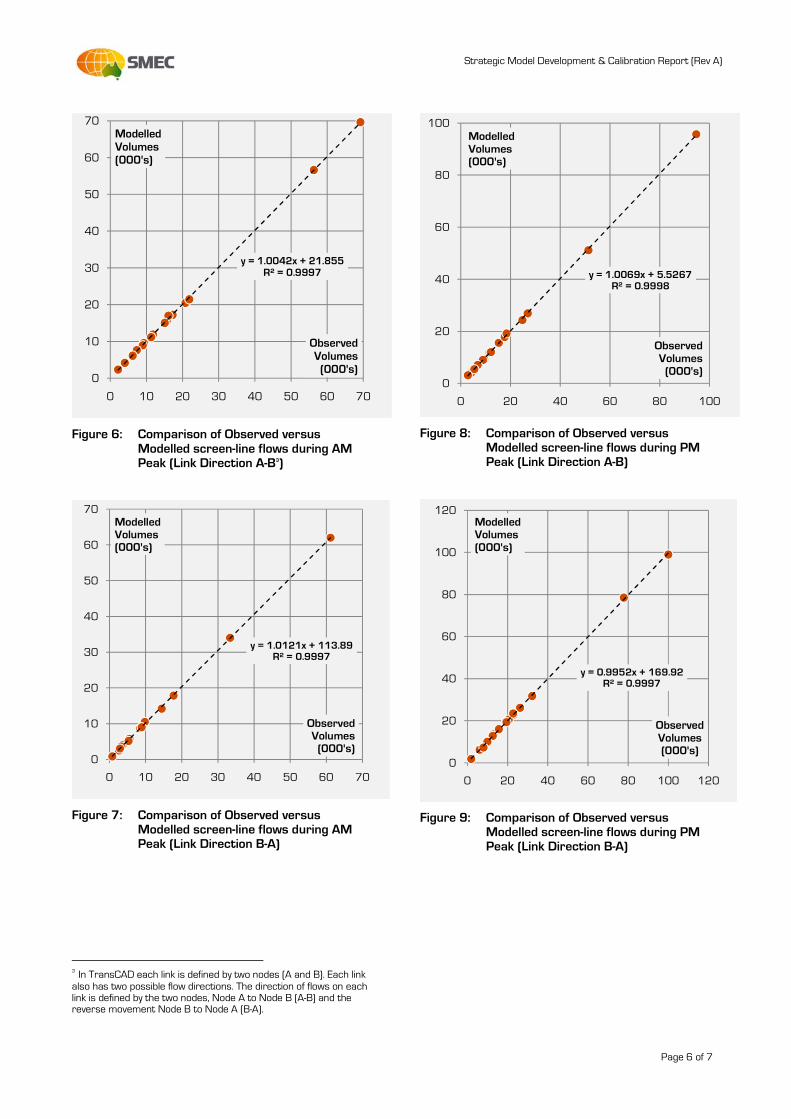
A scatter plot analysis of the modelled results for the major RTA screen-lines was undertaken to demonstrate the goodness of fit (R2) of the modelled results compared to the observed. These scatter plots are presented in Figures 6 to 9 below.
Table 1: 2006 AM Peak (7am to 9am) Calibration at All Count Sites
Road Type Total GEH Value
0-5 5-7.5 7.5-10 > 10
Freeway 39 27 5 2 5
Ramps 9 9 0 0 0
Main Roads (Arterial) 202 181 15 4 2
Secondary Roads (Sub-Arterial)
173 162 8 2 1
Secondary Roads (Collector)
18 15 1 2 0
Local Roads 2 2 0 0 0
TOTAL 443 396 29 10 8
100% 89% 7% 2% 2%
Table 2: 2006 PM Peak (3pm to 6pm) Calibration at All Count Sites
Road Type Total GEH Value
0-5 5-7.5 7.5-10 > 10
Freeway 39 32 4 2 1
Ramps 9 9 0 0 0
Main Roads (Arterial) 202 193 5 1 3
Secondary Roads (Sub-Arterial)
173 165 7 1 0
Secondary Roads (Collector)
18 18 0 0 0
Local Roads 2 2 0 0 0
TOTAL 443 419 16 4 4
100% 95% 3% 1% 1%
Strategic Model Development & Calibration Report (Rev A)
Page 6 of 7
y = 1.0042x + 21.855R² = 0.9997
0
10
20
30
40
50
60
70
0 10 20 30 40 50 60 70
ModelledVolumes(000's)
ObservedVolumes
(000's)
Figure 6: Comparison of Observed versus Modelled screen-line flows during AM Peak (Link Direction A-B3)
y = 1.0121x + 113.89R² = 0.9997
0
10
20
30
40
50
60
70
0 10 20 30 40 50 60 70
ModelledVolumes(000's)
ObservedVolumes
(000's)
Figure 7: Comparison of Observed versus Modelled screen-line flows during AM Peak (Link Direction B-A)
3 In TransCAD each link is defined by two nodes (A and B). Each link also has two possible flow directions. The direction of flows on each link is defined by the two nodes, Node A to Node B (A-B) and the reverse movement Node B to Node A (B-A).
y = 1.0069x + 5.5267R² = 0.9998
0
20
40
60
80
100
0 20 40 60 80 100
ModelledVolumes(000's)
ObservedVolumes
(000's)
Figure 8: Comparison of Observed versus Modelled screen-line flows during PM Peak (Link Direction A-B)
y = 0.9952x + 169.92R² = 0.9997
0
20
40
60
80
100
120
0 20 40 60 80 100 120
ModelledVolumes(000's)
ObservedVolumes(000's)
Figure 9: Comparison of Observed versus Modelled screen-line flows during PM Peak (Link Direction B-A)

Strategic Model Development & Calibration Report (Rev A)
Page 7 of 7
3 TRAVEL PATTERNS
The NSW Government’s HTS provides travel information for households surveyed across the Sydney GMA. These surveys tell us when, how, why and where the people in the surveyed households travelled on the day of the survey.
A major benefit of TRINITY’s first-principles approach to trip table development is access to a wealth of land use and travel pattern data relevant to TMAP development, including:
Socio Economics of households in the region
Mode share travel patterns
Trip Purposes
Trip Direction
The following sections summarise some this data for the Botany Bay LGA.
Socio- Economics Our analysis of HTS data for the Sydney GMA indicated that the number of trips generated by each household is closely related to the income of that household.
Households with an income less than $25,000 per annum generate less than 5.8 trips per day. Conversely, households with an income in excess of $150,000 generate more than 14.9 trips per day.
Household income is, therefore, a major trip production variable. A comparison of the income distribution for the Mascot Town Centre precinct (Travel Zones 404 and 406), Botany Bay LGA and the Sydney GMA is provided in Table 3.
The analysis reveals that:
Botany Bay LGA has a higher proportion of households in the lower income categories than the Sydney Average
Conversely, TZ404, which covers most of the Mascot Town Centre precinct, has a higher proportion of households in the higher income categories
Table 3: Proportion of Households in Each Income Category (ABS, 2006)
HH Income Categories (000's)
TZ404 TZ406Botany Bay LGA
Sydney GMA
<$25 9% 14% 14% 11%$25 to $50 16% 21% 22% 19%$50 to $75 22% 24% 21% 23%$75 to $100 20% 19% 18% 19%$100 to $150 21% 14% 17% 17%>$150 13% 8% 8% 10%
Source: HTS, 2006
Mode Share The mode share patterns for Botany Bay LGA are presented in Tables 4 to 6.
These patterns are derived from analysis of 2006 HTS data and are for all trip purposes. They have been broken down into outbound, inbound and internal trip purposes.
Table 4: Botany Bay LGA Mode Share for All AM (2-hr) Peak Trip Purposes
Outbound Internal Inbound
PT 19% 7% 7%Car 77% 51% 92%Bicycle 0% 2% 0%Walk 3% 38% 1%Other 1% 2% 0%Totals % 100% 100% 100%Totals Trips 14910 6410 21990
Trip TypeMode
Source: HTS, 2006
Table 5: Botany Bay LGA Mode Share for All PM (3-hr) Peak Trip Purposes
Outbound Internal Inbound
PT 5% 3% 9%Car 87% 73% 80%Bicycle 0% 0% 0%Walk 8% 24% 10%Other 0% 0% 1%Totals % 100% 100% 100%Totals Trips 45870 11620 34940
ModeTrip Type
Source: HTS, 2006

Strategic Model Development & Calibration Report (Rev A)
Page 8 of 7
Table 6: Botany Bay LGA Mode Share for All Daily Trip Purposes
Outbound Internal Inbound
PT 10% 4% 10%Car 86% 55% 86%Bicycle 0% 1% 1%Walk 3% 40% 3%Other 1% 1% 0%Totals % 100% 100% 100%Totals Trips 128350 70640 127280
ModeTrip Type
Source: HTS, 2006
The review of mode share data revealed the following:
Up to 40% of internal daily trips within the Botany Bay LGA are walking trips. Walking is also a popular mode during the AM peak
In the PM peak, the percentage of walk trips drops significantly to less than 24%
Public transport is used for less than 10% of the Botany Bay LGA’s daily inbound and outbound trips
Public transport accounts for less than 4% of Botany Bay LGA’s daily internal trips
Use of public transport peaks at 19% on the outbound journeys during the AM peak
Use of private vehicles peaks at 73% for Botany Bay LGA internal trips during the PM peak
Trip Purpose The purpose of daily trips within the Botany Bay LGA is summarised in Table 7.
These patterns are derived from analysis of 2006 HTS data and are for all trip purposes. They have been broken down into outbound, inbound and internal trip types.
Analysis of the Botany Bay LGA trip purpose data revealed the following:
13% of outbound movements and 4% of inbound movements are Home to Work
7% of outbound movements and 2% of inbound movements are Home to Shopping
5% of internal movements are Shopping to Shopping
8% of outbound movements and 5% of internal trips are Home to Serve Passenger
7% of inbound movements and 5% of outbound movements are Home to Social/Recreation
Internal trips are a lot more varied in purpose. Less than 70% of internal trips are covered in the top 20 categories.
Focusing more on the directionality of commuter trips in, out and through the Botany Bay LGA, the data reveals:
72% of daily Home to Work trips are outbound
22% of daily Home to Work trips are inbound
6% of daily Home to Work trips are internal
Table 7: Summary of Top 20 Trip Purposes for Botany Bay LGA Daily Trips
Origin Purpose
Destination Purpose
In Out Int
Work Home 18% 6% 3%
Home Work 4% 13% 2%
WR Business WR Business 8% 8% 5%
Serve Pax Home 9% 5% 5%
Home Social/Recrtn 7% 5% 7%
Home Serve Pax 4% 8% 5%
Social/Recrtn Home 4% 8% 6%
Home Shopping 2% 7% 9%
Shopping Home 5% 2% 8%
WR Business Home 6% 2% 1%
Home WR Business 2% 5% 1%
Shopping Shopping 1% 1% 5%
Serve Pax Serve 2% 2% 1%
Home Return to wk 1% 2% 0%
Social/Recrtn Social/Recrtn 1% 1% 2%
Edu/ C'care Home 0% 2% 1%
Personal Home 2% 1% 2%
Shopping Go to work 1% 1% 2%
Return to work WR Business 1% 1% 2%
WR Business Work 1% 1% 1%
Other Other 21% 18% 30%
TOTALS % 100% 100% 100%
TOTAL TRIPS 127280 128330 70660
Source: HTS, 2006
Trip Direction Analysis of the 2011 AM and PM peak sub-area matrices has been undertaken to identify the directionality of movements in/out and through the study area.
The results of the analysis are presented in Figures 7 and 8.
A similar analysis was done for movements through the smaller Mascot Town Centre precinct as defined in the PARAMICS modelling. The results are presented in Figures 9 and 10.

Strategic Model Development & Calibration Report (Rev A)
Page 9 of 7
27%36%
15%
22%
Through Inbound Internal Outbound
Figure 7: Directionality of Movements in, out and through the Mascot Sub-Area Model in 2011 AM Peak
26%25%
19%
30%
Through Inbound Internal Outbound
Figure 8: Directionality of Movements in, out and through the Mascot Sub-Area Model in 2011 PM Peak
45%
37%
1% 17%
Through Inbound Internal Outbound
Figure 9: Directionality of Movements in, out and through the Mascot Town Centre PARAMICS model in 2011 AM Peak
47%
18%
1%34%
Through Inbound Internal Outbound
Figure 10: Directionality of Movements in, out and through the Mascot Town Centre PARAMICS model in 2011 PM Peak

Strategic Model Development & Calibration Report (Rev A)
Page 10 of 7
4 MASCOT SUB-AREA MODEL
Model Scope The 2011 Mascot TMAP strategic transport models are extracts from the 2011 TRINITY Transport model of Sydney, Newcastle and Wollongong.
A smaller sub-area model was used for the TMAP for reasons of practicality, namely;
Scenario run times are significantly reduced
So that the zonal system could be refined to improve accuracy of loading required for a micro-simulation (PARAMICS) model
The traffic impacts of the proposed Mascot Town Centre precinct redevelopment are unlikely to have a significant impact on the wider Sydney GMA network
The Mascot sub-area model extends from:
Surrey Hills in the north to Botany Bay in the south
Dulwich Hill in the West to Randwick in the east
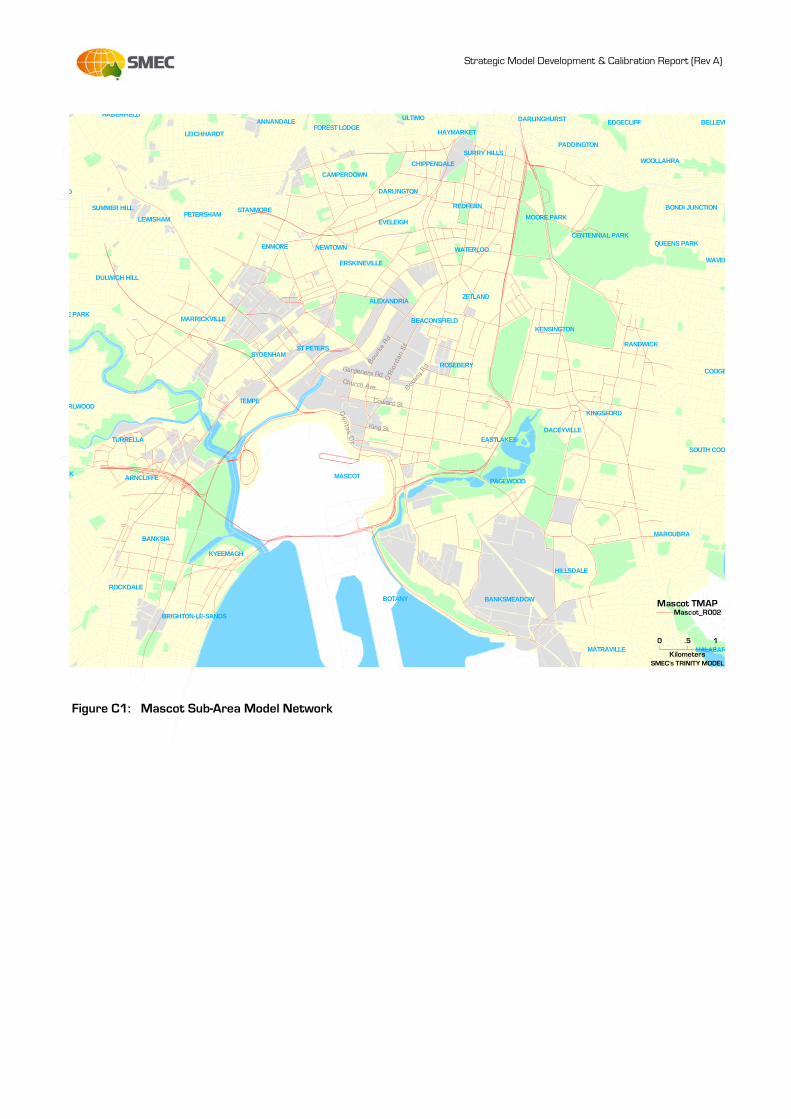
A plot of the sub-area model network and zonal system is presented in Appendix ‘B’.
The Mascot sub-area model contains:
147 Internal travel zones
78 External Travel Zones
2,764 Road links
A car, taxi and light commercial vehicle matrix
A rigid truck matrix derived from BTS commercial trip tables
A semi-trailer matrix derived from BTS commercial trip tables
A B-double matrix derived from BTS commercial trip tables and known b-double routes
The Mascot sub-area model covers the following peak periods:
AM peak (7am to 9am)
PM peak (3pm to 6pm)
Travel Zone System The travel zones adopted for the Mascot sub-area model are based on the BTS 2006 travel zone boundaries. However, travel zones TZ404 and TZ406 are the exception. These two zones have been further divided into 11 smaller zones to increase the accuracy of traffic loading to a level suitable for the PARAMICS models. The refinements are as follows:
TZ404 was divided into 8 new zones (9001 to 9008).
TZ406 was divided into 3 new zones (9009 to 9011)
Link Flow Outputs 2011 AM and PM peak link flow plots for the Mascot Town Centre precinct, extracted from the sub-area network, are presented in Appendix ‘C’.
Level of Service Outputs A level of service (LOS) analysis was undertaken of the links within the Mascot Town Centre precinct under 2011 AM & PM peak flows. The LOS estimates for the precinct network are provided in Appendix ‘D’.
This LOS estimate was determined based on:
the volume/ capacity ratio of each link
AUSTROADS standard mid-block capacity values for typical urban roads with interrupted flows
Flows extracted from the Mascot sub-area strategic model which were converted to passenger car unit equivalents (PCUs) using the conversion factors outlined in Table 8
The LOS criteria as defined in Table 9
Table 8: Vehicle to PCU Conversion Factors
Vehicle Conversion Factor (PCUs)
Cars 1.0 Rigid 2.0
Articulated 2.5 B-Double 4.0
Table 9: LOS Criteria
LOS Volume/Capacity Ratio
A < 0.34 B 0.35 to 0.5 C 0.51 to 0.74 D 0.75 to 0.89 E 0.9 to 0.99 F <1.0

Strategic Model Development & Calibration Report (Rev A)
Page 11 of 7
Sub-area Network Calibration The calibration (accuracy) of the 2011 AM and PM peak sub-area models have been determined by comparing observed (counted) traffic volumes with modelled traffic volumes.
The model has been calibrated against 70 observed link flows derived from classified intersection counts undertaken at the following 12 sites:
1. Gardeners Road and Kent Road
2. Gardeners Road and Bourke Street
3. Gardeners Road and O’Riordan Street
4. Kent Road and Ricketty Street
5. Kent Road and Coward Street
6. Bourke Street and Coward Street
7. Coward Street and O’Riordan Street
8. O’Riordan Street and Bourke Street
9. O’Riordan Street and King Street
10. O’Riordan Street and Robey Street
11. Bourke Street and Church Avenue
12. Botany Road and Robey Street
The calibration results for the 2011 AM and PM peak models in the vicinity of the Mascot Town Centre precinct are presented in Tables E1 and E2 of Appendix ‘E’.
A summary of the results is presented in Table 10.
Table 10: Summary of 2011 AM & PM Peak Link Flow Calibration
GEH Values
AM PM No.
Links % No. Links %
< 5.0 60 86% 66 94% 5.0 to 7.5 9 13% 4 6% 7.5 to 10 0 0% 0 0% 10 to 15 1 1% 0 0% TOTALS 70 100% 70 100%
The analysis suggests that the following satisfactory levels of calibration have been achieved:
86% of sites achieved a GEH statistic less than 5.0 in the AM Peak (7am to 9am)
94% of sites achieved a GEH statistic less than 5.0 in the PM peak (3pm to 6pm)
Conclusion Given the good match between observed and modelled flows, it is concluded that the Mascot AM and PM peak sub-area models are sufficiently calibrated to the level of accuracy acceptable for its intended use.

Strategic Model Development & Calibration Report (Rev A)
APPENDIX A
TRINITY Model Calibration Results
Table 1: Calibration of Major Bridge & Tunnel Crossings
Bridge-Tunnel Crossings AM (2hrs) PM(3hrs)
Count Model GEH Ratio Count Model GEH Ratio
James Ruse Dr, N 5,089 5,060 0.41 0.9943 7,868 8,073 2.30 1.0260
James Ruse Dr, S 5,850 6,215 4.69 1.0623 7,525 7,785 2.98 1.0346
Silverwater Rd, N 6,639 6,814 2.13 1.0263 6,608 6,807 2.42 1.0300
Silverwater Rd, S 4,284 4,494 3.16 1.0489 8,793 9,063 2.86 1.0307
Homebush Bay, N 5,766 5,939 2.26 1.0299 9,726 9,785 0.59 1.0060
Homebush Bay, S 7,687 7,993 3.45 1.0397 10,549 10,761 2.05 1.0201
Victoria Rd, Gladesville Bridge, N 7,845 8,070 2.53 1.0288 10,192 10,437 2.41 1.0240
Victoria Rd, Gladesville Bridge, S 7,006 6,647 4.34 0.9488 10,456 10,656 1.95 1.0192
Victoria Rd, Iron Cove Bridge, N 5,118 5,269 2.09 1.0295 9,775 9,765 0.10 0.9990
Victoria Rd, Iron Cove Bridge, S 6,159 5,996 2.09 0.9736 7,943 7,987 0.49 1.0055
Sydney Harbour Bridge N 10,166 9,830 3.36 0.9669 20,465 20,424 0.29 0.9980
Sydney Harbour Bridge S 16,588 16,067 4.08 0.9685 15,552 15,614 0.50 1.0040
Sydney Harbour Tunnel, N 7,254 7,418 1.92 1.0226 10,240 9,644 5.79 0.9436
Sydney Harbour Tunnel, S 6,967 7,216 2.96 1.0358 8,650 8,724 0.80 1.0086
Total N 47,877 48,400 2.38 1.0109 74,875 74,934 0.28 1.0010
Total S 54,542 54,628 0.36 1.0016 69,467 70,590 4.24 1.0162
Strategic Model Development & Calibration Report (Rev A)
Table 2: Calibration of Major RTA Screen-lines AM Peak (2-hr)
SL AM (2hrs)
Observed Flow Modelled Difference GEH
IN OUT TOTAL IN OUT TOTAL IN OUT TOTAL IN OUT
01 20,816 17,734 38,550 20,491 17,844 38,335 325 -110 214 2.3 0.8
02 69,195 61,162 130,357 69,626 62,009 131,635 -430 -847 -1,277 1.6 3.4
03 9,262 3,694 12,956 9,549 4,075 13,624 -288 -380 -668 3.0 6.1
04 15,634 5,511 21,145 15,645 5,750 21,395 -10 -239 -250 0.1 3.2
05 56,309 33,365 89,673 56,640 34,011 90,651 -332 -646 -978 1.4 3.5
06 17,234 14,434 31,668 17,227 14,190 31,417 7 244 251 0.1 2.0
07 11,787 9,548 21,335 11,860 9,866 21,726 -73 -318 -391 0.7 3.2
08 11,304 8,497 19,801 11,174 8,733 19,907 130 -236 -106 1.2 2.5
09 21,864 9,721 31,585 21,439 10,285 31,724 425 -565 -139 2.9 5.6
10 4,026 2,628 6,654 4,164 2,468 6,633 -139 160 21 2.2 3.2
11 16,094 9,782 25,877 16,970 10,516 27,486 -875 -734 -1,609 6.8 7.3
12 8,963 5,269 14,231 8,923 5,155 14,078 39 114 153 0.4 1.6
13 7,317 3,255 10,572 7,608 3,590 11,198 -291 -335 -626 3.4 5.7
14 6,195 2,902 9,098 6,112 3,044 9,156 83 -141 -58 1.1 2.6
15 15,058 8,903 23,961 15,033 9,004 24,037 25 -101 -76 0.2 1.1
16 2,144 782 2,926 2,326 845 3,171 -182 -63 -245 3.9 2.2
TOTAL 293,203 197,185 490,389 294,789 201,384 496,173 -1,585 -4,199 -5,784 2.9 9.4
Table 3: Calibration of Major RTA Screen-lines PM Peak (3-hr)
SL PM (3hrs)
Observed Flow Modelled Difference O-M GEH
IN OUT TOTAL IN OUT TOTAL IN OUT TOTAL IN OUT
01 26,915 32,179 59,094 26,876 31,728 58,604 39 451 490 0.2 2.5
02 94,669 100,024 194,693 95,700 99,008 194,708 -1,030 1,015 -15 3.3 3.2
03 7,472 13,008 20,480 7,710 13,478 21,188 -239 -469 -708 2.7 4.1
04 9,447 19,369 28,816 9,275 19,767 29,042 171 -398 -226 1.8 2.8
05 51,328 77,822 129,150 51,132 78,516 129,648 196 -694 -498 0.9 2.5
06 24,789 22,904 47,693 24,306 22,827 47,133 483 76 560 3.1 0.5
07 15,286 20,529 35,814 15,576 20,505 36,081 -290 24 -266 2.3 0.2
08 11,608 15,642 27,250 11,905 16,017 27,922 -297 -375 -672 2.7 3.0
09 17,641 26,178 43,819 17,843 26,147 43,990 -202 31 -171 1.5 0.2
10 4,248 6,089 10,337 4,108 6,248 10,356 140 -159 -19 2.2 2.0
11 18,425 22,743 41,168 19,187 23,470 42,657 -762 -727 -1,489 5.6 4.8
12 8,896 12,565 21,461 8,976 12,787 21,763 -80 -222 -302 0.8 2.0
13 6,775 9,932 16,707 7,067 10,011 17,079 -292 -79 -372 3.5 0.8
14 5,455 7,962 13,417 5,444 7,244 12,688 11 717 728 0.2 8.2
15 12,133 19,379 31,512 12,002 19,356 31,358 131 23 154 1.2 0.2
16 2,875 1,846 4,721 3,137 1,815 4,952 -263 31 -231 4.8 0.7
TOTAL 317,963 408,170 726,133 320,243 408,926 729,169 -2,281 -756 -3,036 4.0 1.2

Strategic Model Development & Calibration Report (Rev A)
APPENDIX B
Mascot Sub-area Strategic Model Network & Zonal System
Strategic Model Development & Calibration Report (Rev A)
Figure C1: Mascot Sub-Area Model Network
MALABARMATRAVILLE
BRIGHTON-LE-SANDS
HILLSDALE
KYEEMAGH
BANKSMEADOW
ROCKDALE
BANKSIA
BOTANY
MAROUBRA
RKPAGEWOOD
SOUTH COO
DACEYVILLETURRELLA
ARNCLIFFE
EASTLAKES
MASCOT
KINGSFORD
TEMPE
SYDENHAM
COOGE
RLWOOD
ROSEBERY
BEACONSFIELD
ST PETERS RANDWICK
ZETLAND
E PARK
KENSINGTON
WAVER
MARRICKVILLE
ERSKINEVILLE
QUEENS PARKWATERLOO
ALEXANDRIA
ENMORE
DULWICH HILL
EVELEIGH
BONDI JUNCTION
CENTENNIAL PARK
NEWTOWN
REDFERN
LEWISHAM
DARLINGTON
STANMOREPETERSHAM MOORE PARKSUMMER HILL
CHIPPENDALE WOOLLAHRA
CAMPERDOWN
PADDINGTON
EDGECLIFF
SURRY HILLS
HAYMARKETFOREST LODGE
DARLINGHURSTULTIMO
LEICHHARDT
BELLEVU
D
ANNANDALEHABERFIELD
Bourk
e Rd
O'R
iord
an S
t
Qan
tas D
r
King St
Church Ave
Gardeners Rd
Coward StBot
any R
d
Mascot TMAP
0 .5 1
KilometersSMEC's TRINITY MODEL
Mascot_R002

Strategic Model Development & Calibration Report (Rev A)
Figure C2: Mascot Sub-Area Model Zonal System
MAMATRAVILLE
BRIGHTON-LE-SANDS
HILLSDALE
KYEEMAGH
BANKSMEADOWROCKDALE
BANKSIA
BOTANY
MAROUBRA
PARKPAGEWOOD
SOU
DACEYVILLETURRELLA
ARNCLIFFE
EASTLAKES
MASCOT
KINGSFORDTEMPE
SYDENHAM
EARLWOOD
ROSEBERY
BEACONSFIELD
ST PETERS RANDWICK
ZETLAND
TONE PARK
KENSINGTONMARRICKVILLE
ERSKINEVILLE
QUEENS PARKWATERLOO
ALEXANDRIA
ENMORE
DULWICH HILL
EVELEIGH
BONDI JUNC
CENTENNIAL PARKNEWTOWN
REDFERN
LEWISHAM
DARLINGTON
STANMOREPETERSHAM MOORE PARKSUMMER HILL
CHIPPENDALE WOOLLAHRA
CAMPERDOWN
FIELD
581
411
425
423
580
393
421
413
386
414
412
420
524
514
211
540
378
290
544
286
409
426
416
532
239
596
388
418
508
525
391
589
579
575
387
415
571
407
405
417
384291
533
371
370
509
520
526
408
527390
377
392
576
287
519
9110
361
379
530
541
360
537
385
577
283 284
381
292
419
276
380
289
372
366
213281 277
367
238
389
278
282
270268
9103
269
207
263
9109
279
205
273 275
204
254
253
266
262
288
259
9106
240
256
9102
255
9111
206
570
271
280
258
9107
260
9104
265
9108
257
201
264
274
9101
199
9105
O'R
iord
an S
t
Gardeners Rd
Botany R
d
Mascot TMAP
0 .5 1
KilometersSMEC's TRINITY MODEL
Mascot_TZ11

Strategic Model Development & Calibration Report (Rev A)
APPENDIX C
Mascot Town Centre Precinct 2011 AM & PM Peak
Link Flow Plots

Strategic Model Development & Calibration Report (Rev A)
Figure C1: 2011 AM Peak (7am to 9am) All Vehicle Link Flows
MASCOT
Mascot Station
Domestic Airport Station
856
Qan
tas
Dr
4313905
613141
King St
765
5234
1856
Bota
ny R
oad
1428
2454
King St
Gardeners Rd
462562
484653
2133
2113
Ricketty St
545411
176828
43
466389
139625
14
13092135
O'Rior
dan S
t
2026
2388
Church Ave
760617
673217
Church Ave
Gardeners Rd
O'R
iord
an S
t, N
orth
3878
2606
802862
2082
1058
110
414
14
313
0
16093
4557
6
1143010
Bou
rke
Rd
982
827
16011865
4275
2091
199442
44
707191
2332
1766
Bot
any
Rd
587611
220142
2236
1623
1398
2813
1303
2667
1642161
104
1421
1104
2029
Bou
rke
St
187
128139
26056
00
26284
4307
1998
1421
1104
602713
166
3
2793
554
Ricketty St
115
5
12
91
2650
1703
1857
369
4
83 254
1856
1998
442
598
0
115
5
1291
174719
1421
1104
537
221145
14
2793
1811
1104
Mascot TMAP
0 .1 .2
KilometersSMEC's TRINITY MODEL
MFlow_2011AM
10000 5000 2500MFlow_2011AM

Strategic Model Development & Calibration Report (Rev A)
Figure C2: 2011 PM Peak (3pm to 6pm) All Vehicle Link Flows
MASCOT
Mascot Station
Domestic Airport Station
2746
Qan
tas
Dr
2169
4153
Qan
tas
Dr
742837
King St
50
29
24
14
1640
Bot
any
Roa
d
32
64
22
82
King St
Gardeners Rd
753685
1065558
4291
3073
Ricketty St
648940
378433
94
777583
34002494
35652118
O'Ri
orda
n St
4371
3253
Church Ave
1116
1267
171788
Church Ave
Gardeners Rd
O'R
iord
an S
t, N
orth
4247
6662
1119
1049
1372
2528
23
59
11
54
37
18
32
2052
48
31
3017 021
Bou
rke
Rd
1740
1067
3090
2653
35
72
528
65
33
8
41
07
648
1161
28
95
43
22
Bot
any
Rd
960877
392379
37
16
394
8
24
83
3366
3231
3144
3354254
371
1922
1732
1688
Bou
rke
St
510
33447
48358
00
172151
4477
576
3
1922
1732
1262647
40
46
30
83
68
8
15
65
17
50
3131
3353
49
26
37
35
45
86
1
1640
77
18
59
0
15
65
17
50
923
804
1922
1732
65
95
904
35
74
30
83
1371
2359
Mascot TMAP
0 .1 .2
KilometersSMEC's TRINITY MODEL
MFlow_2011PM
10000 5000 2500MFlow_2011PM

Strategic Model Development & Calibration Report (Rev A)
APPENDIX D
Mascot Town Centre Precinct 2011 AM & PM Peak
Network LOS

Strategic Model Development & Calibration Report (Rev A)
Figure D1: 2011 AM Peak Network LOS
ROSEBERY
Mascot Station
Domestic Airport Station
Qa
nt a
s D
r
King St
O'Rio
rdan S
t
Church Ave
Gardeners Rd
Coward St
Bo
ur k
e S
t
Bo tany R
dRicketty St
Mascot TMAP
0 .1 .2
KilometersSMEC's TRINITY MODEL
LEVEL OF SERVICEABCDEFMFlow_2011AM
10000 5000 2500MFlow_2011AM

Strategic Model Development & Calibration Report (Rev A)
Figure D2: 2011 PM Peak Network LOS
MASCOT
ROSEBERY
Mascot Station
Domestic Airport Station
Qa
nta
s D
r
King St
O 'Riord
an St
Church Ave
Gardeners Rd
Coward St
Bo
u rk e
St
B o tany R
dRicketty St
Mascot TMAP
0 .1 .2
KilometersSMEC's TRINITY MODEL
LEVEL OF SERVICEABCDEF
MFlow_2011PM
10000 5000 2500

Strategic Model Development & Calibration Report (Rev A)
APPENDIX E
Sub-Area Strategic Model Model Calibration

Strategic Model Development & Calibration Report (Rev A)
Table C1: Comparison of Modelled & Observed Link Flows for AM Peak (7am to 9am)
Link Road Name Observed
Vehicle Flows
Modelled Vehicle
FlowsGEH
10876 Kent Rd , South of Gardeners Rd
2295 2330 0.8
10877 Bourke St Exit, North of Gardeners Rd
790 870 2.7
10881 Gardeners Rd , West of O'Riordan St
2070 2110 0.9
10884 Gardeners Rd Exit, East of O'Riordan St
2419 2470 0.9
10892 O'Riordan St , North of Bourke St
1597 1780 4.5
10907 O'Riordan St Exit, South of King St
1803 2090 6.5
10908 Bourke St Exit, West of O'Riordan St
458 480 1.2
10909 O'Riordan St , South of Robey St
2773 2810 0.8
10910 O'Riordan St , South of Bourke St
4030 4240 3.3
10914 Coward St Exit, West of O'Riordan St
589 710 4.8
11905 Robey St Exit, West of O'Riordan St
1041 1060 0.5
14874 O'Riordan St Exit, South of Bourke St
1486 1670 4.7
21432 Bourke St , North of Church Ave
414 580 7.3
24515 Bourke St Exit, West of O'Riordan St
1836 2030 4.4
24516 Bourke St Exit, South of Coward St
997 1150 4.8
24517 Coward St Exit, West of Bourke St
1331 1420 2.4
26071 O'Riordan St Exit, South of Gardeners Rd
1555 1610 1.4
26072 Kent Rd Exit, South of Ricketty St
1710 1810 2.4
26073 Kent Rd Exit, North of Coward St
971 1100 4.1
26074 Bourke St Exit, North of Coward St
326 440 5.9
26075 Bourke St Exit, South of Church Ave
511 550 1.9
26076 O'Riordan St Exit, North of Coward St
2490 2650 3.2
40206 King St Exit, East of O'Riordan St
367 390 1.2
40212 Coward St Exit, East of Kent Rd
1104 1100 0.0
43687 Church Ave Exit, East of Bourke St
201 190 1.0
56789 Coward St , East of O'Riordan St
705 800 3.5
56791 O'Riordan St , South of Coward St
2628 2510 2.2
56916 O'Riordan St , North of Gardeners Rd
1629 1770 3.4
63008 King St Exit, West of O'Riordan St
151 140 1.0
63010 Coward St Exit, West of Kent Rd
595 670 3.1
63089 Gardeners Rd , West of Bourke St
2268 2390 2.5
63215 Ricketty St , West of Kent Rd
3611 3880 4.4
63225 Coward St , East of Bourke St
497 610 4.8
63231 O'Riordan St , North of Robey St
2250 2210 0.8
Link Road Name Observed
Vehicle Flows
Modelled Vehicle
FlowsGEH
63233 Robey St , East of O'Riordan St
357 410 2.7
10876 Kent Rd , North of Ricketty St
1698 1770 1.6
10877 Bourke St , North of Gardeners Rd
607 720 4.3
10881 Gardeners Rd , East of Bourke St
1999 2130 3.0
10884 Gardeners Rd , East of O'Riordan St
1929 2040 2.5
10892 O'Riordan St Exit, North of Bourke St
2814 3070 4.7
10907 O'Riordan St , South of King St
4075 4270 3.1
10908 Bourke St , West of O'Riordan St
626 650 1.1
10909 O'Riordan St Exit, South of Robey St
1444 1400 1.2
10910 O'Riordan St , North of King St
1701 1990 6.8
10914 Coward St , West of O'Riordan St
500 600 4.4
11905 Robey St , West of O'Riordan St
1857 2080 5.0
14874 O'Riordan St , South of Bourke St
2540 2790 4.9
21432 Bourke St , South of Gardeners Rd
235 350 6.5
24515 Bourke St , West of O'Riordan St
834 900 2.2
24516 Bourke St , South of Coward St
1197 1290 2.7
24517 Coward St , West of Bourke St
989 1100 3.6
26071 O'Riordan St , South of Gardeners Rd
3013 3130 2.1
26072 Kent Rd , South of Ricketty St
902 1100 6.4
26073 Kent Rd , North of Coward St
1284 1410 3.5
26074 Bourke St , North of Coward St
500 600 4.2
26075 Bourke St , South of Church Ave
301 510 10.3
26076 O'Riordan St , North of Coward St
1570 1700 3.3
40206 King St , East of O'Riordan St
406 470 2.9
40212 Coward St , East of Kent Rd
1227 1420 5.3
43687 Church Ave , East of Bourke St
1 0 1.4
56789 Coward St Exit, East of O'Riordan St
740 860 4.3
56791 O'Riordan St , North of Bourke St
1353 1400 1.2
56916 O'Riordan St Exit, North of Gardeners Rd
2668 2840 3.3
63008 King St , West of O'Riordan St
119 130 0.8
63010 Coward St , West of Kent Rd
208 220 0.6
63089 Gardeners Rd , East of Kent Rd
1875 2030 3.4
63215 Ricketty St Exit, West of Kent Rd
2270 2610 6.8
63225 Coward St Exit, East of Bourke St
474 590 4.9
63231 O'Riordan St Exit, North of Robey St
4306 4510 3.1
63233 Robey St Exit, East of O'Riordan St
563 550 0.8

Strategic Model Development & Calibration Report (Rev A)
Table C2: Comparison of Modelled & Observed Link Flows for PM Peak (4pm to 6pm)
Link Road Name Observed
Vehicle Flows
Modelled Vehicle
FlowsGEH
10876 Kent Rd , South of Gardeners Rd
2019 1980 0.8
10877 Bourke St Exit, North of Gardeners Rd
678 750 2.7
10881 Gardeners Rd , West of O'Riordan St
2008.5 2100 2.1
10884 Gardeners Rd Exit, East of O'Riordan St
2421 2520 1.9
10892 O'Riordan St , North of Bourke St
2856 3050 3.5
10907 O'Riordan St Exit, South of King St
3714 3620 1.5
10908 Bourke St Exit, West of O'Riordan St
726 730 0.1
10909 O'Riordan St , South of Robey St
1650 1700 1.2
10910 O'Riordan St , South of Bourke St
2597.7 2810 4.1
10914 Coward St Exit, West of O'Riordan St
416 440 1.3
11905 Robey St Exit, West of O'Riordan St
1713 1730 0.5
14874 O'Riordan St Exit, South of Bourke St
2582 2790 3.9
21432 Bourke St , North of Church Ave
450.45 570 5.3
24515 Bourke St Exit, West of O'Riordan St
1154 1160 0.1
24516 Bourke St Exit, South of Coward St
1092 1070 0.6
24517 Coward St Exit, West of Bourke St
1204 1320 3.2
26071 O'Riordan St Exit, South of Gardeners Rd
2064 2210 3.1
26072 Kent Rd Exit, South of Ricketty St
933 940 0.2
26073 Kent Rd Exit, North of Coward St
1523 1620 2.3
26074 Bourke St Exit, North of Coward St
436 530 4.2
26075 Bourke St Exit, South of Church Ave
465 470 0.3
26076 O'Riordan St Exit, North of Coward St
2186 2140 0.9
40206 King St Exit, East of O'Riordan St
414 400 0.7
40212 Coward St Exit, East of Kent Rd
998.55 1190 5.7
43687 Church Ave Exit, East of Bourke St
349 350 0.0
56789 Coward St , East of O'Riordan St
664.65 770 3.8
56791 O'Riordan St , South of Coward St
1781.5 1710 1.7
56916 O'Riordan St , North of Gardeners Rd
2479 2590 2.2
63008 King St Exit, West of O'Riordan St
33 30 0.2
63010 Coward St Exit, West of Kent Rd
115 120 0.2
63089 Gardeners Rd , West of Bourke St
2136 2230 2.0
63215 Ricketty St , West of Kent Rd
2726.9 2910 3.4
63225 Coward St , East of Bourke St
547 600 2.2
63231 O'Riordan St , North of Robey St
3869 4040 2.8
Link Road Name Observed
Vehicle Flows
Modelled Vehicle
FlowsGEH
63233 Robey St , East of O'Riordan St
636 640 0.3
10876 Kent Rd , North of Ricketty St
3057 2960 1.8
10877 Bourke St , North of Gardeners Rd
843 890 1.7
10881 Gardeners Rd , East of Bourke St
2894.5 2940 0.8
10884 Gardeners Rd , East of O'Riordan St
2637 2740 2.0
10892 O'Riordan St Exit, North of Bourke St
1847 2030 4.1
10907 O'Riordan St , South of King St
2331 2450 2.4
10908 Bourke St , West of O'Riordan St
365 380 0.9
10909 O'Riordan St Exit, South of Robey St
2653 2700 1.0
10910 O'Riordan St , North of King St
3494 3660 2.7
10914 Coward St , West of O'Riordan St
754 860 3.9
11905 Robey St , West of O'Riordan St
857 940 2.8
14874 O'Riordan St , South of Bourke St
1934 2110 3.9
21432 Bourke St , South of Gardeners Rd
269.33 360 5.1
24515 Bourke St , West of O'Riordan St
1260 1380 3.3
24516 Bourke St , South of Coward St
1170 1200 0.8
24517 Coward St , West of Bourke St
1160 1190 0.8
26071 O'Riordan St , South of Gardeners Rd
2540 2550 0.1
26072 Kent Rd , South of Ricketty St
1578 1620 0.9
26073 Kent Rd , North of Coward St
663 790 4.7
26074 Bourke St , North of Coward St
502 590 3.7
26075 Bourke St , South of Church Ave
405.3 510 5.0
26076 O'Riordan St , North of Coward St
2168 2300 2.7
40206 King St , East of O'Riordan St
488 530 2.0
40212 Coward St , East of Kent Rd
1254 1320 1.7
43687 Church Ave , East of Bourke St
3 0 2.4
56789 Coward St Exit, East of O'Riordan St
683 720 1.4
56791 O'Riordan St , North of Bourke St
2351 2330 0.5
56916 O'Riordan St Exit, North of Gardeners Rd
2203 2320 2.6
63008 King St , West of O'Riordan St
217 230 0.8
63010 Coward St , West of Kent Rd
514 540 1.1
63089 Gardeners Rd , East of Kent Rd
2938 2990 1.0
63215 Ricketty St Exit, West of Kent Rd
4280 4560 4.3
63225 Coward St Exit, East of Bourke St
647 660 0.4
63231 O'Riordan St Exit, North of Robey St
2213 2450 4.9
63233 Robey St Exit, East of O'Riordan St
433 440 0.5

Mascot Town Centre Precinct TMAP
Appendix B
APPENDIX B
Working Paper 2# Micro-simulation Modelling
Calibration Report

Mascot TMAP, Micro-simulation Model Calibration Report (Rev A)
Page i of ii
MASCOT TMAP
Micro-simulation Model Calibration Report
2011 Base Case
Rev No.
Date Prepared by Reviewed by
A 14/09/11 M Stephens C Wiafe
Contact for further information:
Matthew Stephens NSW Traffic & Transport Planning Manager
(02) 9925 5542 0414 236 130
© Snowy Mountains Engineering Corporation (SMEC Australia Pty Ltd)
The information within this document produced by SMEC Australia is solely for the use of the Client identified on the cover sheet for the purpose for which it has been prepared. SMEC Australia undertakes no duty to or accepts any responsibility to any third party who may rely upon this document. All rights reserved. No section or element of this document may be removed from this document, reproduced, electronically stored or transmitted in any form without the written permission of SMEC Australia.

Mascot TMAP, Micro-simulation Model Calibration Report (Rev A)
Page ii of ii
TABLE OF CONTENTS
1 INTRODUCTION ............................1
2 MODEL SCOPE .............................1
3 NETWORK CODING ...................2
4 TRAVEL DEMAND .......................3
5 MODEL CALIBRATION ...............5
6 CONCLUSION ................................7
APPENDIX ‘A’ - Model Network Plot
APPENDIX ‘B’ - Road Categories File
APPENDIX ‘C’ - Calibration Results

Mascot TMAP, Micro-simulation Model Calibration Report (RevA)
Page 1 of 7
1 INTRODUCTION
Background
This working paper documents the development and calibration of 2011 AM and PM peak period micro-simulation models for the Mascot Town Centre Precinct.
These models will be used to assess the impacts of future land use and transport scenarios being developed as part of a Transport Management and Accessibility Plan (TMAP) for the precinct.
The Mascot Town Centre Precinct TMAP micro-simulation models were built using PARAMICS software.
These 2011 base-case models have been calibrated to reflect the road network and traffic demands present in July/August 2011.
Figure 1: TMAP Study Area
2 MODEL SCOPE
Study Area
For the purpose of the traffic modelling, the study area is bounded by Gardeners Road in the north, Alexandria Canal in the west, Sydney Airport in the south and Botany Road in the east.
The micro-simulation model focuses on the traffic performance along the main roads and arterials within the Mascot Town Centre Precinct. In particular, it focuses on O’Riordan Street, Bourke Road, Coward Street, Gardeners Road, Kent Street and Robey Street.
A detailed plot of the model network is provided in Appendix ‘A’.
Time Periods
The model was set up to simulate the following peak hour periods:
� AM peak (7am to 9am)
� PM peak (4pm to 6pm)
The first hour in each peak is a lead-in hour and will not contribute to model statistics.
Model Statistics
The Mascot Town Centre Precinct TMAP models contain:
� 26 Zones
� 23 Sets of signals
� 307 Nodes
� 772 Links
� 126 Intersections
� 50.5km of roadway
� 13 Bus Routes
The model has been coded with fixed time traffic signal control.

Mascot TMAP, Micro-simulation Model Calibration Report (RevA)
Page 2 of 7
3 NETWORK CODING
Software
The Mascot TMAP micro-simulation models were built using PARAMICS version 6.7.2 software. No additional plug-ins or add-ons were required.
Network Build
The models were coded using spatially accurate aerial photographs. This was supplemented by on-site inspections of the network. The road network includes the following details:
� Number of lanes on the carriageway, including parking lanes
� Turning bays
� Speed zones
� Clearways, and
� Bus routes (including stops)
Signal phasing, green-splits, inter-greens and offsets were coded based on SCATS IDM data collected by the RTA.
These signal timings were initially coded into PARAMICS and then fine-tuned, where necessary, to maximise the efficiency of individual intersections.
Zone Definition
The models include 26 zones which are the origin and destinations for all movements within the models. These are divided into:
� 15 external zones linking the models to the wider road network, and
� 11 internal zones which are loading points for major retail, commercial, educational and residential land uses in the study area
A listing of the zones is presented in Table 1.
Road Categories
The standard RTA road categories file was used to define the network. A copy of the standard RTA road categories file used is provided in the Appendix ‘B’.
Each link in the model area was assigned an RTA road category that matched its number of lanes and speed limit.
Speed limits were initially based on commercial available GIS based road centre line data and confirmed by site audit.
Table 1: Micro-simulation Model Travel Zones
Zone Description
01 Airport Drive (External)
02 General Holmes Drive (External)
03 Botany Road North (External)
04 Wentworth Avenue (External)
05 King Street (External)
06 Airport, Domestic Terminal (External)
07 Airport, Long Term Car Park (External)
08 Airport, Air Centre, Service Area (External)
09 Mascot Park, King Street
10 Coleman Reserve, Stamford Plaza
11 Botany Shops, O’Riordan Street
12 Cargo International, Coward Street
13 Gardeners Road (External)
14 Botany Road South (External)
15 O’Riordan Street (External)
16 Bourke Street (External)
17 Gardeners Road Extension
18 Qantas Flight Training Centre, Kent Road
19 Holiday Inn Hotel, Bourke Street
20 Qantas Centre, Coward Street
21 Mascot Railway Station, Church Avenue
22 Airlink Business Park, Church Street
23 Hollingshed Street (External)
24 Cowards Street (External)
25 Ricketty Street (External)
26 John Curtin Reserve, Robey Street

Mascot TMAP, Micro-simulation Model Calibration Report (RevA)
Page 3 of 7
4 TRAVEL DEMAND
Regional Patterns
The regional travel patterns contained within the models were derived from SMEC’s TRINITY Transport Model (TRINITY).
TRINITY is a strategic transport model of the Sydney, Newcastle and Wollongong metropolitan areas. It is a series of geospatial information layers, databases and spreadsheets embedded within a transport modelling software package. These elements combined create a mathematical representation of land use and travel patterns in the Sydney Greater Metropolitan Area (GMA).
TRINITY is a software tool for planning Sydney’s future road infrastructure needs. It is unique in its socio-economic approach to travel demand, its geographic scope and the number (21) of trip purposes (work, shopping, recreational etc) it models.
TRINITY covers an area of 2.5 million hectares and contains 21,000 kilometres of road network and 20,500 intersections.
Development and calibration of the broader strategic modelling inputs to the Mascot Town Centre Precinct TMAP is documented in a separate report.
Matrix Development
The travel demand matrices used in these micro-simulation models were derived from the following data:
� sub-area matrices extracted from the calibrated TRINITY strategic transport model of Sydney, Newcastle and Wollongong
� Manual counts at critical intersections within the town centre precinct. This was used to calibrate cordon and turn demands
The matrix development process involved:
� Refinement of the TRINITY zonal system in the study area
� Extraction of initial light and commercial vehicle sub-area matrices
� Sub-area matrix estimation to achieve a closer match to observed flows
Vehicle Profile
The following five vehicle matrices were developed for use in the micro-simulation models:
� A car, taxi and light commercial vehicle matrix containing up to 21 trip purposes (e.g. recreational, shopping and commuter)
� A rigid truck matrix derived from Bureau of Transport Statistics (BTS) commercial trip tables
� A semi-trailer matrix derived from BTS commercial trip tables
� A B-double matrix derived from BTS commercial trip tables and know b-double routes
� Bus trips represented by fixed route demands with observed frequencies
These five demand matrices have been distributed amongst 17 vehicle type categories. The categories, dimensions and proportions of each vehicle type are specified by the RTA and are meant to be representative of the average NSW vehicle fleet characteristics.
The standard RTA vehicle file includes the following categories:
� Car/taxi (6)
� Rigid Truck (3)
� Semi-trailer (3)
� B-Double (3)
� Bus (2)
Profile Specification
The model was set up to simulate the following peak hour periods:
� AM peak (7am to 9am)
� PM peak (4pm to 6pm)
The 15-minute demand release profiles for traffic entering the road network during the lead-in and peak hour are based on observed traffic flows collected at 12 sites in July 2011.
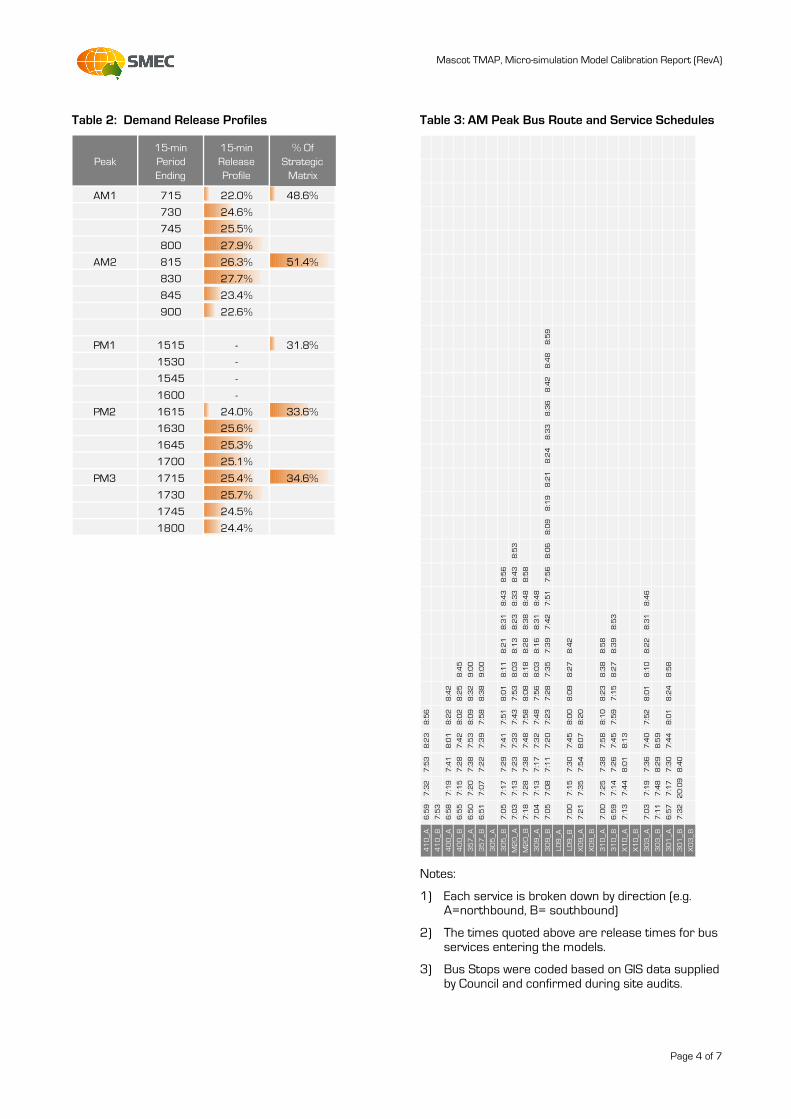
The adopted 15-minute profiles are presented below in Table 2.
Bus Routes
Bus services are explicitly coded into the models and treated as fixed route demands. There are 13 bus routes coded into the models. The service schedules used in the model are listed below in Tables 3 and 4 below.
Release times for bus services were estimated based on published time-table data for the stops closest to their entry point.
For the purposes of the simulation, the team adopted bus stop dwell times ranging between 7 and 12 seconds.
Mascot TMAP, Micro-simulation Model Calibration Report (RevA)
Page 4 of 7
Table 2: Demand Release Profiles
Peak
15-min
Period
Ending
15-min
Release
Profile
% Of
Strategic
Matrix
AM1 715 22.0% 48.6%
730 24.6%
745 25.5%
800 27.9%
AM2 815 26.3% 51.4%
830 27.7%
845 23.4%
900 22.6%
PM1 1515 - 31.8%
1530 -
1545 -
1600 -
PM2 1615 24.0% 33.6%
1630 25.6%
1645 25.3%
1700 25.1%
PM3 1715 25.4% 34.6%
1730 25.7%
1745 24.5%
1800 24.4%
Table 3: AM Peak Bus Route and Service Schedules
Notes:
1) Each service is broken down by direction (e.g. A=northbound, B= southbound)
2) The times quoted above are release times for bus services entering the models.
3) Bus Stops were coded based on GIS data supplied by Council and confirmed during site audits.
410_A
6:59
7:32
7:53
8:23
8:56
410_B
7:53
400_A
6:58
7:19
7:41
8:01
8:22
8:42
400_B
6:55
7:15
7:28
7:42
8:02
8:25
8:45
357_A
6:50
7:20
7:38
7:53
8:09
8:32
9:00
357_B
6:51
7:07
7:22
7:39
7:58
8:38
9:00
305_A
305_B
7:05
7:17
7:29
7:41
7:51
8:01
8:11
8:21
8:31
8:43
8:56
M20_A
7:03
7:13
7:23
7:33
7:43
7:53
8:03
8:13
8:23
8:33
8:43
8:53
M20_B
7:18
7:28
7:38
7:48
7:58
8:08
8:18
8:28
8:38
8:48
8:58
309_A
7:04
7:13
7:17
7:32
7:48
7:56
8:03
8:16
8:31
8:48
309_B
7:05
7:08
7:11
7:20
7:23
7:28
7:35
7:39
7:42
7:51
7:56
8:06
8:09
8:19
8:21
8:24
8:33
8:36
8:42
8:48
8:59
L09_A
L09_B
7:00
7:15
7:30
7:45
8:00
8:09
8:27
8:42
X09_A
7:21
7:35
7:54
8:07
8:20
X09_B
310_A
7:00
7:25
7:38
7:58
8:10
8:23
8:38
8:58
310_B
6:59
7:14
7:26
7:45
7:59
7:15
8:27
8:39
8:53
X10_A
7:13
7:44
8:01
8:13
X10_B
303_A
7:03
7:19
7:36
7:40
7:52
8:01
8:10
8:22
8:31
8:46
303_B
7:11
7:48
8:29
8:59
301_A
6:57
7:17
7:30
7:44
8:01
8:24
8:58
301_B
7:32
20:09
8:40
X03_B
Mascot TMAP, Micro-simulation Model Calibration Report (RevA)
Page 5 of 7
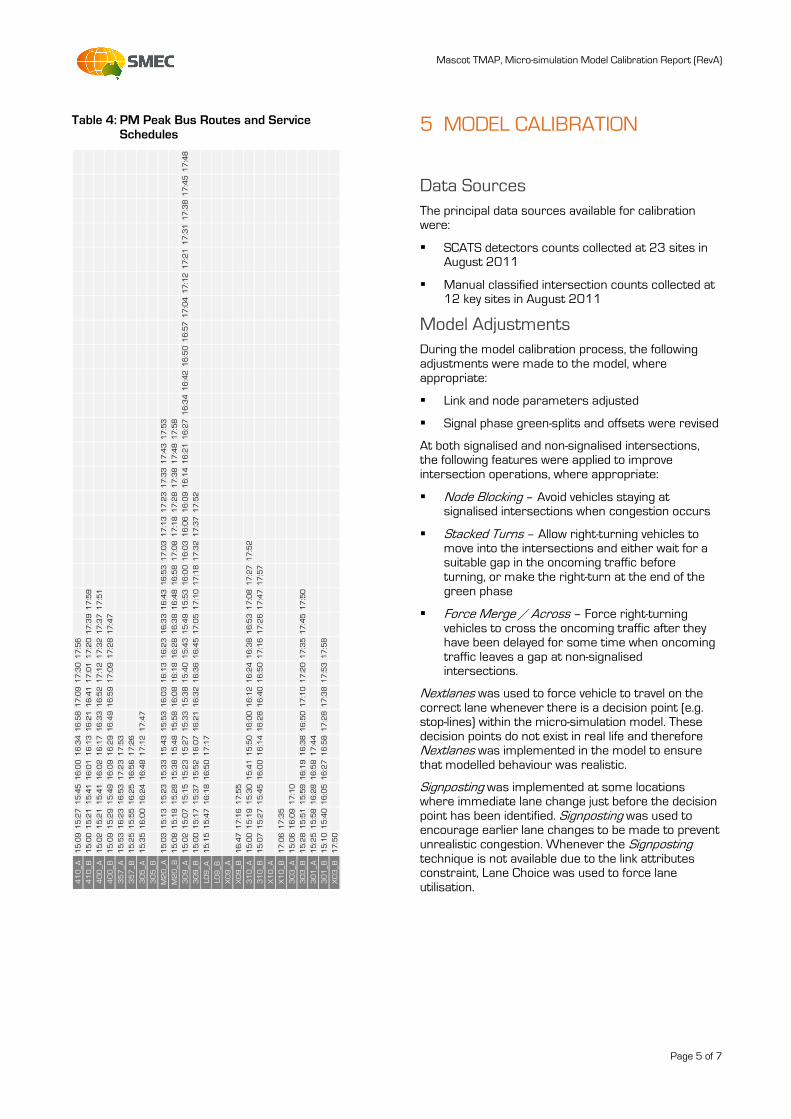
Table 4: PM Peak Bus Routes and Service Schedules
5 MODEL CALIBRATION
Data Sources
The principal data sources available for calibration were:
� SCATS detectors counts collected at 23 sites in August 2011
� Manual classified intersection counts collected at 12 key sites in August 2011
Model Adjustments
During the model calibration process, the following adjustments were made to the model, where appropriate:
� Link and node parameters adjusted
� Signal phase green-splits and offsets were revised
At both signalised and non-signalised intersections, the following features were applied to improve intersection operations, where appropriate:
� Node Blocking – Avoid vehicles staying at signalised intersections when congestion occurs
� Stacked Turns – Allow right-turning vehicles to move into the intersections and either wait for a suitable gap in the oncoming traffic before turning, or make the right-turn at the end of the green phase
� Force Merge / Across – Force right-turning vehicles to cross the oncoming traffic after they have been delayed for some time when oncoming traffic leaves a gap at non-signalised intersections.
Nextlanes was used to force vehicle to travel on the correct lane whenever there is a decision point (e.g. stop-lines) within the micro-simulation model. These decision points do not exist in real life and therefore Nextlanes was implemented in the model to ensure that modelled behaviour was realistic.
Signposting was implemented at some locations where immediate lane change just before the decision point has been identified. Signposting was used to encourage earlier lane changes to be made to prevent unrealistic congestion. Whenever the Signposting technique is not available due to the link attributes constraint, Lane Choice was used to force lane utilisation.
410_A
15:0915:2715:4516:0016:3416:5817:0917:3017:56
410_B
15:0015:2115:4116:0116:1316:2116:4117:0117:2017:3917:59
400_A
15:0215:2115:4116:0216:1716:3316:5217:1217:3217:3717:51
400_B
15:0915:2915:4916:0916:2916:4916:5917:0917:2817:47
357_A
15:5316:2316:5317:2317:53
357_B
15:2515:5516:2516:5617:26
305_A
15:3516:0016:2416:4817:1217:47
305_B
M20_A
15:0315:1315:2315:3315:4315:5316:0316:1316:2316:3316:4316:5317:0317:1317:2317:3317:4317:53
M20_B
15:0815:1815:2815:3815:4815:5816:0816:1816:2816:3816:4816:5817:0817:1817:2817:3817:4817:58
309_A
15:0215:0715:1515:2315:2715:3315:3815:4015:4315:4915:5316:0016:0316:0616:0916:1416:2116:2716:3416:4216:5016:5717:0417:1217:2117:3117:3817:4517:48
309_B
15:0015:1715:3715:5216:0716:2116:3216:3616:4517:0517:1017:1817:3217:3717:52
L09_A
15:1515:4716:1816:5017:17
L09_B
X09_A
X09_B
16:4717:1617:55
310_A
15:0015:1915:3015:4115:5016:0016:1216:2416:3816:5317:0817:2717:52
310_B
15:0715:2715:4516:0016:1416:2816:4016:5017:1617:2617:4717:57
X10_A
X10_B
17:0617:35
303_A
15:0616:0917:10
303_B
15:2815:5115:5916:1916:3816:5017:1017:2017:3517:4517:50
301_A
15:2515:5816:2816:5817:44
301_B
15:1015:4016:0516:2716:5817:2817:3817:5317:58
X03_B
17:50

Mascot TMAP, Micro-simulation Model Calibration Report (RevA)
Page 6 of 7
Seed Selection and Model Stability
The stability of the AM and PM peak models was tested using the first five seed values specified by the RTA (560, 28, 7771, 86524, 2849). The models were run and the results reported by link. The Co-efficient of Variance (CoV) was calculated for the link flows generated by the five model seeds. This coefficient represents ratio of the standard deviation to the mean of the five modelled flows for each link.
Figures 2 and 3 illustrate that the pattern of the five seeds is similar. These results suggest that the models are operating in a stable manner in the AM and PM peak periods.
The demand release curves of the AM and PM peak models were estimated using the first five seed values normally specified by the RTA (560, 28, 7771, 86524, 2849). The results were analysed to determine which of the five release curves was most representative of an average demand scenario.
The demand curves for the AM and PM peaks are presented below in Figures 2 and 3, respectively.
0
200
400
600
800
1000
1200
1400
1600
1800
7:01
7:11
7:21
7:31
7:41
7:51
8:01
8:11
8:21
8:31
8:41
8:51
No. of Vehicles
Time(h:mm)
Seed 560 Seed 28
Seed 7771 Seed 86524
Seed 2849
Figure 2: AM Peak Demand Release Profiles
0
200
400
600
800
1000
1200
16:01
16:11
16:21
16:31
16:41
16:51
17:01
17:11
17:21
17:31
17:41
17:51
No. of Vehicles
Time(h:mm)
Seed 560
Seed 28
Seed 7771
Seed 86524
Seed 2849
Figure 3: PM Peak Demand Release Profiles
The analysis suggests that the following seeds produced release curves most representative of an average demand scenario:
� AM peak = 2,849
� PM peak = 2,849
Calibration Measures
The calibration (accuracy) of the micro-simulation models is determined by comparing observed (counted) traffic volumes and intersection queue lengths with modelled traffic volumes and queuing.
The RTA has generally adopted the UK’s DMRB standards for traffic flow calibration. These rely heavily on a measure called the GEH statistic. The GEH statistic is a self-scaling empirical statistic with similarities to a chi-squared test.
The following RTA acceptability targets were adopted for the micro-simulation model calibration assessments:
� Individual flows within 100vph (flows <700vph)
� Individual flows within 15% (flows between 700 and 2,700vph)
� Individual flows within 400vph (flows > 2,700vph)
� Individual flows achieve a GEH value less than 5.0 at more than 85% of sites
A review of observed and modelled queue lengths was also undertaken during the calibration process.

Mascot TMAP, Micro-simulation Model Calibration Report (RevA)
Page 7 of 7
Calibration Results
The calibration results for the AM and PM peak models, using the selected average seed values, are presented in Tables C1 and C2 of Appendix ‘C’.
A summary of results is presented in Table 5.
Table 5: Summary of AM and PM Peak Link and Turn-Flow Calibration
GEH Values
AM PM
No. Links
% No. Links
%
< 5.0 97 92% 98 92%
5.0 to 7.5 6 6% 6 6%
7.5 to 10 3 2% 2 2%
10 to 15 0 0% 0 0%
TOTALS 106 100% 106 100%
The model achieved the following level of calibration:
� In AM peak, 92% of sites achieved a GEH statistic less than 5.0
� In PM peak, 92% of sites achieved a GEH statistic less than 5.0
6 CONCLUSION
Given the match between observed and modelled flows, the stability of the models, favourable comparisons between the modelled and observed behaviour, it is concluded that the Mascot Town Centre Precinct TMAP micro-simulation models are sufficiently calibrated and replicate existing conditions to a level of accuracy acceptable for its intended use.

Mascot TMAP, Micro-simulation Model Calibration Report (Rev A)
APPENDIX A
Plot of Model Network

Mascot TMAP, M
icro-simulation Model Calibration Report (Rev A)
Zone Description
01
Airport Drive (External)
02
General Holmes Drive (External)
03
Botany Road North (External)
04
Wentworth Avenue (External)
05
King Street (External)
06
Airport, Domestic Term
inal (External)
07
Airport, Long Term Car Park (External)
08
Airport, Air Centre, Service Area
(External)
09
Mascot Park, King Street
10
Coleman Reserve, Stamford Plaza
11
Botany Shops, O’Riordan Street
12
Cargo International, Coward Street
13
Gardeners Road (External)
14
Botany Road South (External)
15
O’Riordan Street (External)
16
Bourke Street (External)
17
Gardeners Road Extension
18
Qantas Flight Training Centre, Kent
Road
19
Holiday Inn Hotel, Bourke Street
20
Qantas Centre, Coward Street
21
Mascot Railway Station, Church
Avenue
22
Airlink Business Park, Church Street
23
Hollingshed Street (External)
24
Cowards Street (External)
25
Ricketty Street (External)
26
John Curtin Reserve, Robey Street
Figure A1: Mascot TMAP Micro-simulation Model Network

Mascot TMAP, Micro-simulation Model Calibration Report (Rev A)
APPENDIX B
Road Category File

Mascot TMAP, Micro-simulation Model Calibration Report (Rev A)
categories 1 to 78
category 1 lanes 1 speed 110 kph width 3.3 m colour 0x0000ff00 type urban major
headway factor 1.000 curve speed factor 1.0 toll 0.000 cost factor 0.80
signpost 750.0 m,1.0 m
category 2 lanes 2 speed 110 kph width 6.6 m colour 0x0000ff00 type urban major
headway factor 1.000 curve speed factor 1.0 toll 0.000 cost factor 0.80
signpost 750.0 m,1.0 m
category 3 lanes 3 speed 110 kph width 9.9 m colour 0x0000ff00 type urban major
headway factor 1.000 curve speed factor 1.0 toll 0.000 cost factor 0.80
signpost 750.0 m,1.0 m
category 4 lanes 4 speed 110 kph width 13.2 m colour 0x0000ff00 type urban major
headway factor 1.000 curve speed factor 1.0 toll 0.000 cost factor 0.80
signpost 750.0 m,1.0 m
category 5 lanes 5 speed 110 kph width 16.5 m colour 0x0000ff00 type urban major
headway factor 1.000 curve speed factor 1.0 toll 0.000 cost factor 0.80
signpost 750.0 m,1.0 m
category 6 lanes 1 speed 100 kph width 3.3 m colour 0x0000aa00 type urban major
headway factor 1.000 curve speed factor 1.0 toll 0.000 cost factor 0.80
signpost 750.0 m,1.0 m
category 7 lanes 2 speed 100 kph width 6.6 m colour 0x0000aa00 type urban major
headway factor 1.000 curve speed factor 1.0 toll 0.000 cost factor 0.80
signpost 750.0 m,1.0 m
category 8 lanes 3 speed 100 kph width 9.9 m colour 0x0000aa00 type urban major
headway factor 1.000 curve speed factor 1.0 toll 0.000 cost factor 0.80
signpost 750.0 m,1.0 m
category 9 lanes 4 speed 100 kph width 13.2 m colour 0x0000aa00 type urban major
headway factor 1.000 curve speed factor 1.0 toll 0.000 cost factor 0.80
signpost 750.0 m,1.0 m
category 10 lanes 5 speed 100 kph width 16.5 m colour 0x0000aa00 type urban major
headway factor 1.000 curve speed factor 1.0 toll 0.000 cost factor 0.80
signpost 750.0 m,1.0 m

Mascot TMAP, Micro-simulation Model Calibration Report (Rev A)
category 11 lanes 1 speed 100 kph width 3.3 m colour 0x0000ee00 type urban major
headway factor 1.000 curve speed factor 1.0 toll 0.000 cost factor 0.80
signpost 250.0 m,1.0 m
category 12 lanes 2 speed 100 kph width 6.6 m colour 0x0000ee00 type urban major
headway factor 1.000 curve speed factor 1.0 toll 0.000 cost factor 0.80
signpost 250.0 m,1.0 m
category 13 lanes 3 speed 100 kph width 9.9 m colour 0x0000ee00 type urban major
headway factor 1.000 curve speed factor 1.0 toll 0.000 cost factor 0.80
signpost 250.0 m,1.0 m
category 14 lanes 4 speed 100 kph width 13.2 m colour 0x0000ee00 type urban major
headway factor 1.000 curve speed factor 1.0 toll 0.000 cost factor 0.80
signpost 250.0 m,1.0 m
category 15 lanes 5 speed 100 kph width 16.5 m colour 0x0000ee00 type urban major
headway factor 1.000 curve speed factor 1.0 toll 0.000 cost factor 0.80
signpost 250.0 m,1.0 m
category 16 lanes 1 speed 100 kph width 3.3 m colour 0x0000ffff type urban major
headway factor 1.000 curve speed factor 1.0 toll 0.000 cost factor 1.000
signpost 250.0 m,1.0 m
category 17 lanes 2 speed 100 kph width 6.6 m colour 0x0000ffff type urban major
headway factor 1.000 curve speed factor 1.0 toll 0.000 cost factor 1.000
signpost 250.0 m,1.0 m
category 18 lanes 3 speed 100 kph width 9.9 m colour 0x0000ffff type urban major
headway factor 1.000 curve speed factor 1.0 toll 0.000 cost factor 1.000
signpost 250.0 m,1.0 m
category 19 lanes 4 speed 100 kph width 13.2 m colour 0x0000ffff type urban major
headway factor 1.000 curve speed factor 1.0 toll 0.000 cost factor 1.000
signpost 250.0 m,1.0 m
category 20 lanes 5 speed 100 kph width 16.5 m colour 0x0000ffff type urban major
headway factor 1.000 curve speed factor 1.0 toll 0.000 cost factor 1.000
signpost 250.0 m,1.0 m
category 21 lanes 1 speed 90 kph width 3.3 m colour 0x0000eeee type urban major
headway factor 1.000 curve speed factor 1.0 toll 0.000 cost factor 1.000
signpost 250.0 m,1.0 m
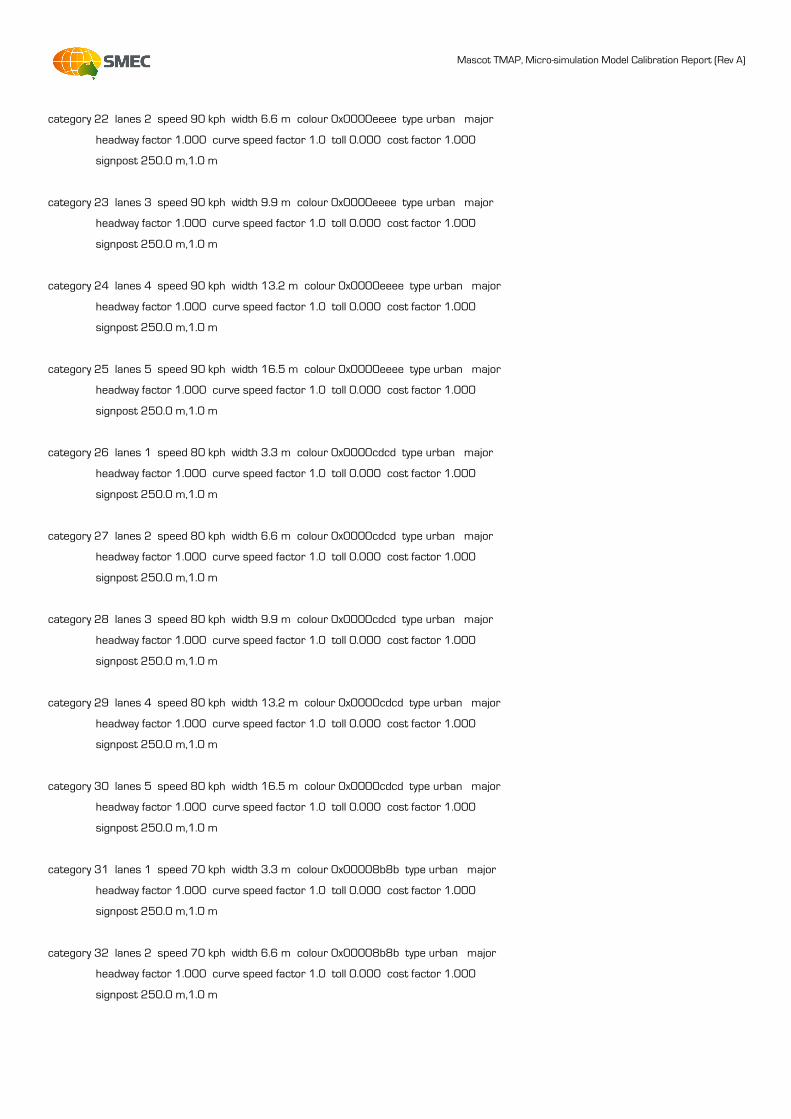
Mascot TMAP, Micro-simulation Model Calibration Report (Rev A)
category 22 lanes 2 speed 90 kph width 6.6 m colour 0x0000eeee type urban major
headway factor 1.000 curve speed factor 1.0 toll 0.000 cost factor 1.000
signpost 250.0 m,1.0 m
category 23 lanes 3 speed 90 kph width 9.9 m colour 0x0000eeee type urban major
headway factor 1.000 curve speed factor 1.0 toll 0.000 cost factor 1.000
signpost 250.0 m,1.0 m
category 24 lanes 4 speed 90 kph width 13.2 m colour 0x0000eeee type urban major
headway factor 1.000 curve speed factor 1.0 toll 0.000 cost factor 1.000
signpost 250.0 m,1.0 m
category 25 lanes 5 speed 90 kph width 16.5 m colour 0x0000eeee type urban major
headway factor 1.000 curve speed factor 1.0 toll 0.000 cost factor 1.000
signpost 250.0 m,1.0 m
category 26 lanes 1 speed 80 kph width 3.3 m colour 0x0000cdcd type urban major
headway factor 1.000 curve speed factor 1.0 toll 0.000 cost factor 1.000
signpost 250.0 m,1.0 m
category 27 lanes 2 speed 80 kph width 6.6 m colour 0x0000cdcd type urban major
headway factor 1.000 curve speed factor 1.0 toll 0.000 cost factor 1.000
signpost 250.0 m,1.0 m
category 28 lanes 3 speed 80 kph width 9.9 m colour 0x0000cdcd type urban major
headway factor 1.000 curve speed factor 1.0 toll 0.000 cost factor 1.000
signpost 250.0 m,1.0 m
category 29 lanes 4 speed 80 kph width 13.2 m colour 0x0000cdcd type urban major
headway factor 1.000 curve speed factor 1.0 toll 0.000 cost factor 1.000
signpost 250.0 m,1.0 m
category 30 lanes 5 speed 80 kph width 16.5 m colour 0x0000cdcd type urban major
headway factor 1.000 curve speed factor 1.0 toll 0.000 cost factor 1.000
signpost 250.0 m,1.0 m
category 31 lanes 1 speed 70 kph width 3.3 m colour 0x00008b8b type urban major
headway factor 1.000 curve speed factor 1.0 toll 0.000 cost factor 1.000
signpost 250.0 m,1.0 m
category 32 lanes 2 speed 70 kph width 6.6 m colour 0x00008b8b type urban major
headway factor 1.000 curve speed factor 1.0 toll 0.000 cost factor 1.000
signpost 250.0 m,1.0 m

Mascot TMAP, Micro-simulation Model Calibration Report (Rev A)
category 33 lanes 3 speed 70 kph width 9.9 m colour 0x00008b8b type urban major
headway factor 1.000 curve speed factor 1.0 toll 0.000 cost factor 1.000
signpost 250.0 m,1.0 m
category 34 lanes 4 speed 70 kph width 13.2m colour 0x00008b8b type urban major
headway factor 1.000 curve speed factor 1.0 toll 0.000 cost factor 1.000
signpost 250.0 m,1.0 m
category 35 lanes 5 speed 70 kph width 16.5 m colour 0x00008b8b type urban major
headway factor 1.000 curve speed factor 1.0 toll 0.000 cost factor 1.000
signpost 250.0 m,1.0 m
category 36 lanes 1 speed 60 kph width 3.3 m colour 0x00008b8b type urban major
headway factor 1.000 curve speed factor 1.0 toll 0.000 cost factor 1.000
signpost 250.0 m,1.0 m
category 37 lanes 2 speed 60 kph width 6.6 m colour 0x00008b8b type urban major
headway factor 1.000 curve speed factor 1.0 toll 0.000 cost factor 1.000
signpost 250.0 m,1.0 m
category 38 lanes 3 speed 60 kph width 9.9 m colour 0x00008b8b type urban major
headway factor 1.000 curve speed factor 1.0 toll 0.000 cost factor 1.000
signpost 250.0 m,1.0 m
category 39 lanes 4 speed 60 kph width 13.2 m colour 0x00008b8b type urban major
headway factor 1.000 curve speed factor 1.0 toll 0.000 cost factor 1.000
signpost 250.0 m,1.0 m
category 40 lanes 5 speed 60 kph width 16.5 m colour 0x00008b8b type urban major
headway factor 1.000 curve speed factor 1.0 toll 0.000 cost factor 1.000
signpost 250.0 m,1.0 m
category 41 lanes 1 speed 80 kph width 3.3 m colour 0x00ff0000 type urban major
headway factor 1.000 curve speed factor 0.0 toll 0.000 cost factor 1.200
signpost 250.0 m,1.0 m
category 42 lanes 2 speed 80 kph width 6.6 m colour 0x00ff0000 type urban major
headway factor 1.000 curve speed factor 0.0 toll 0.000 cost factor 1.200
signpost 250.0 m,1.0 m
category 43 lanes 3 speed 80 kph width 9.9 m colour 0x00ff0000 type urban major
headway factor 1.000 curve speed factor 1.0 toll 0.000 cost factor 1.200
signpost 250.0 m,1.0 m

Mascot TMAP, Micro-simulation Model Calibration Report (Rev A)
category 44 lanes 1 speed 80 kph width 3.3 m colour 0x00dddd00 type urban minor
headway factor 1.000 curve speed factor 1.0 toll 0.000 cost factor 1.200
signpost 250.0 m,1.0 m
category 45 lanes 2 speed 80 kph width 6.6 m colour 0x00dddd00 type urban minor
headway factor 1.000 curve speed factor 1.0 toll 0.000 cost factor 1.200
signpost 250.0 m,1.0 m
category 46 lanes 3 speed 80 kph width 9.9 m colour 0x00dddd00 type urban minor
headway factor 1.000 curve speed factor 1.0 toll 0.000 cost factor 1.200
signpost 250.0 m,1.0 m
category 47 lanes 1 speed 70 kph width 3.3 m colour 0x00ff0000 type urban major
headway factor 1.000 curve speed factor 1.0 toll 0.000 cost factor 1.200
signpost 250.0 m,1.0 m
category 48 lanes 2 speed 70 kph width 6.6 m colour 0x00ff0000 type urban major
headway factor 1.000 curve speed factor 1.0 toll 0.000 cost factor 1.200
signpost 250.0 m,1.0 m
category 49 lanes 3 speed 70 kph width 9.9 m colour 0x00ff0000 type urban major
headway factor 1.000 curve speed factor 1.0 toll 0.000 cost factor 1.200
signpost 250.0 m,1.0 m
category 50 lanes 1 speed 70 kph width 3.3 m colour 0x00dd0000 type urban minor
headway factor 1.000 curve speed factor 1.0 toll 0.000 cost factor 1.200
signpost 250.0 m,1.0 m
category 51 lanes 2 speed 70 kph width 6.6 m colour 0x00dd0000 type urban minor
headway factor 1.000 curve speed factor 1.0 toll 0.000 cost factor 1.200
signpost 250.0 m,1.0 m
category 52 lanes 3 speed 70 kph width 9.9 m colour 0x00dd0000 type urban minor
headway factor 1.000 curve speed factor 1.0 toll 0.000 cost factor 1.200
signpost 250.0 m,1.0 m
category 53 lanes 1 speed 60 kph width 3.3 m colour 0x008d0000 type urban major
headway factor 1.000 curve speed factor 1.0 toll 0.000 cost factor 1.200
signpost 250.0 m,1.0 m
category 54 lanes 2 speed 60 kph width 6.6 m colour 0x008d0000 type urban major
headway factor 1.000 curve speed factor 1.0 toll 0.000 cost factor 1.200
signpost 250.0 m,1.0 m

Mascot TMAP, Micro-simulation Model Calibration Report (Rev A)
category 55 lanes 3 speed 60 kph width 9.9 m colour 0x008d0000 type urban major
headway factor 1.000 curve speed factor 1.0 toll 0.000 cost factor 1.200
signpost 250.0 m,1.0 m
category 56 lanes 1 speed 60 kph width 3.3 m colour 0x008b0000 type urban minor
headway factor 1.000 curve speed factor 1.0 toll 0.000 cost factor 1.200
signpost 250.0 m,1.0 m
category 57 lanes 2 speed 60 kph width 6.6 m colour 0x008b0000 type urban minor
headway factor 1.000 curve speed factor 1.0 toll 0.000 cost factor 1.200
signpost 250.0 m,1.0 m
category 58 lanes 3 speed 60 kph width 9.9 m colour 0x008b0000 type urban minor
headway factor 1.000 curve speed factor 1.0 toll 0.000 cost factor 1.200
signpost 250.0 m,1.0 m
category 59 lanes 1 speed 60 kph width 3.3 m colour 0x0000a5ff type urban major
headway factor 1.000 curve speed factor 1.0 toll 0.000 cost factor 1.400
signpost 250.0 m,1.0 m
category 60 lanes 2 speed 60 kph width 6.6 m colour 0x0000a5ff type urban major
headway factor 1.000 curve speed factor 1.0 toll 0.000 cost factor 1.400
signpost 250.0 m,1.0 m
category 61 lanes 3 speed 60 kph width 9.9 m colour 0x0000a5ff type urban major
headway factor 1.000 curve speed factor 1.0 toll 0.000 cost factor 1.400
signpost 250.0 m,1.0 m
category 62 lanes 1 speed 60 kph width 3.3 m colour 0x00009aee type urban minor
headway factor 1.000 curve speed factor 1.0 toll 0.000 cost factor 1.400
signpost 250.0 m,1.0 m
category 63 lanes 2 speed 60 kph width 6.6 m colour 0x00009aee type urban minor
headway factor 1.000 curve speed factor 1.0 toll 0.000 cost factor 1.400
signpost 250.0 m,1.0 m
category 64 lanes 3 speed 60 kph width 9.9 m colour 0x00009aee type urban minor
headway factor 1.000 curve speed factor 1.0 toll 0.000 cost factor 1.400
signpost 250.0 m,1.0 m
category 65 lanes 1 speed 50 kph width 3.3 m colour 0x000085cd type urban major
headway factor 1.000 curve speed factor 1.0 toll 0.000 cost factor 1.400
signpost 250.0 m,1.0 m

Mascot TMAP, Micro-simulation Model Calibration Report (Rev A)
category 66 lanes 2 speed 50 kph width 6.6 m colour 0x000085cd type urban major
headway factor 1.000 curve speed factor 1.0 toll 0.000 cost factor 1.400
signpost 250.0 m,1.0 m
category 67 lanes 3 speed 50 kph width 9.9 m colour 0x000085cd type urban major
headway factor 1.000 curve speed factor 1.0 toll 0.000 cost factor 1.400
signpost 250.0 m,1.0 m
category 68 lanes 1 speed 50 kph width 3.3 m colour 0x000000ff type urban minor
headway factor 1.000 curve speed factor 1.0 toll 0.000 cost factor 1.400
signpost 250.0 m,1.0 m
category 69 lanes 2 speed 50 kph width 6.6 m colour 0x000000ff type urban minor
headway factor 1.000 curve speed factor 1.0 toll 0.000 cost factor 1.400
signpost 250.0 m,1.0 m
category 70 lanes 3 speed 50 kph width 9.9 m colour 0x000000ff type urban minor
headway factor 1.000 curve speed factor 1.0 toll 0.000 cost factor 1.400
signpost 250.0 m,1.0 m
category 71 lanes 1 speed 40 kph width 3.3 m colour 0x000000ee type urban major
headway factor 1.000 curve speed factor 1.0 toll 0.000 cost factor 1.400
signpost 250.0 m,1.0 m
category 72 lanes 2 speed 40 kph width 6.6 m colour 0x000000ee type urban major
headway factor 1.000 curve speed factor 1.0 toll 0.000 cost factor 1.400
signpost 250.0 m,1.0 m
category 73 lanes 3 speed 40 kph width 9.9 m colour 0x000000ee type urban major
headway factor 1.000 curve speed factor 1.0 toll 0.000 cost factor 1.400
signpost 250.0 m,1.0 m
category 74 lanes 1 speed 40 kph width 3.3 m colour 0x000000cd type urban minor
headway factor 1.000 curve speed factor 1.0 toll 0.000 cost factor 1.400
signpost 250.0 m,1.0 m
category 75 lanes 2 speed 40 kph width 6.6 m colour 0x000000cd type urban minor
headway factor 1.000 curve speed factor 1.0 toll 0.000 cost factor 1.400
signpost 250.0 m,1.0 m
category 76 lanes 3 speed 40 kph width 9.9 m colour 0x000000cd type urban minor
headway factor 1.000 curve speed factor 1.0 toll 0.000 cost factor 1.400
signpost 250.0 m,1.0 m

Mascot TMAP, Micro-simulation Model Calibration Report (Rev A)
category 77 lanes 1 speed 40 kph width 3.3 m colour 0x00ffffff type urban minor
headway factor 1.000 curve speed factor 1.0 toll 0.000 cost factor 3.000
signpost 250.0 m,1.0 m
category 78 lanes 2 speed 40 kph width 6.6 m colour 0x00ffffff type urban minor
headway factor 1.000 curve speed factor 1.0 toll 0.000 cost factor 3.000
signpost 250.0 m,1.0 m

Mascot TMAP, Micro-simulation Model Calibration Report (Rev A)
APPENDIX C
Model Calibration Results

Mascot TMAP, Micro-simulation Model Calibration Report (Rev A)
Table C1: Comparison of AM Peak Hour Modelled and observed flows
Junction Dir Link ref: observed Modelled GEH
Gardeners Road and Kent Road
R 1232:1227:1241 112 100 1.2
T 1140:1231:1139 903 894 0.3
L 1241:1227:1238 47 45 0.3
R 1241:1227:1230 23 26 0.6
T 1139:1227:1238 1083 1044 1.2
L 1138:1139:1228 81 72 1.0
Bourke Street and Gardeners Road
T 1281:1136:1134 138 129 0.8
L 1281:1136:1282 106 106 0.0
R 1281:1136:1226 132 133 0.1
T 1134:1136:1281 44 27 2.9
L 1134:1136:1226 18 8 2.8
R 1134:1136:1282 26 31 0.9
T 1321:1136:1226 865 856 0.3
L 1321:1136:1134 94 102 0.8
R 1282:1136:1281 140 139 0.1
T 1140:1136:1282 895 840 1.9
L 1140:1136:1281 235 250 1.0
O'Riordan Street and Gardeners Road
T 1213:1144:1212 583 610 1.1
L 1213:1144:1218 79 68 1.3
R 1214:1144:1323 139 134 0.4
T 1285:1144:1214 1152 1118 1.0
L 1285:1144:1323 119 121 0.2
R 1212:1144:1218 216 261 2.9
T 1217:1144:1323 841 853 0.4
L 1217:1144:1212 218 221 0.2
R 1218:1144:1214 32 29 0.5
T 1323:1144:1218 902 864 1.3
L 1323:1144:1214 124 119 0.5
Ricketty Streetand Kent Road
R 1137:1087:1088 743 773 1.1
T 1250:1087:1138 1064 1013 1.6
L 1088:1087:1137 351 442 4.6
R 1088:1087:1138 100 112 1.2
T 1138:1087:1137 791 809 0.6
L 1249:1087:1088 135 163 2.3
Kent Road and Coward Street
T 1088:1083:1035 80 84 0.4
L 1088:1083:1072 434 443 0.4
R 1088:1083:1081 166 158 0.6
T 1035:1083:1088 29 40 1.9
L 1035:1083:1081 19 18 0.2
R 1035:1083:1072 76 77 0.1
T 1072:1083:1081 199 201 0.1
L 1072:1083:1035 42 57 2.1
R 1072:1083:1088 418 453 1.7
T 1081:1083:1072 69 61 1.0
L 1081:1083:1088 54 63 1.2
R 1081:1083:1035 9 6 1.1
Bourke Street and Coward Street
T 1333:1089:1091 140 135 0.4
L 1333:1089:1092 52.25 18 5.8
R 1095:1089:1270 91 74 1.9
T 1330:1089:1095 110 157 4.1
L 1330:1270:1072 457 446 0.5
R 1091:1089:1092 58.8 108 5.4
Junction Dir Link ref: observed Modelled GEH
T 1092:1089:1270 192 213 1.5
L 1092:1089:1091 47 47 0.0
R 1092:1089:1095 56 41 2.2
T 1072:1089:1092 177 195 1.3
L 1072:1089:1095 4 2 1.2
R 1072:1089:1091 320 316 0.2
O'Riordan Street and Coward Street
T 1210:1115:1272 756 703 2.0
L 1210:1208:1117 64 49 2.0
T 1206:1115:1210 1088 1079 0.3
L 1206:1209:1207 30 17 2.7
R 1272:1115:1208 157.7 75 7.7
T 1208:1115:1209 282 277 0.3
L 1208:1115:1272 84 63 2.4
R 1208:1115:1210 27.55 0 7.4
T 1209:1115:1208 203 205 0.1
L 1209:1115:1210 52.5 95 4.9
R 1209:1115:1272 29 31 0.4
O'Riordan Street and Bourke Street
R 1113:1107:1106 145 167 1.8
T 1114:1107:1108 356 419 3.2
L 1106:1113:1114 9 3 2.4
R 1106:1107:1108 442 440 0.1
T 1108:1107:1113 1050 1014 1.1
L 1108:1336:1119 953 967 0.5
O'Riordan Street and King Street
T 1109:1110:1203 746 805 2.1
L 1109:1110:1204 52 58 0.8
T 1202:1110:1109 1842 1811 0.7
L 1202:1110:1016 49 52 0.4
R 1203:1110:1204 129 104 2.3
T 1204:1110:1016 49.4 18 5.4
L 1204:1110:1203 51 58 0.9
R 1204:1110:1109 110 117 0.7
T 1016:1110:1204 11 11 0.0
L 1016:1110:1109 17 36 3.7
R 1016:1110:1203 36 49 2.0
O'Riordan Street and Robey Street
T 1038:1197:1024 609.9 434 7.7
L 1038:1028:1030 116 85 3.1
R 1017:1197:1198 350 382 1.7
T 1298:1197:1017 1374 1422 1.3
T 1029:1197:1198 160 155 0.4
L 1029:1024:1037 46 73 3.5
T 1198:1197:1028 144 204 4.5
L 1201:1197:1017 661 691 1.2
Bourke Street and Church Avenue
T 1133:1131:1094 220 224 0.3
L 1133:1131:1120 30.4 6 5.7
T 1094:1131:1133 62.7 15 7.7
T 1132:1131:1120 34 66 4.5
L 1132:1131:1133 17.85 51 5.6
R 1132:1131:1094 47 34 2.0
Botany Road and Robey Street
R 1010:1008:1032 173 140 2.6
T 1010:1008:1196 624 748 4.7
L 1032:1008:1010 205 192 0.9
R 1032:1008:1196 125 97 2.7
T 1196:1008:1010 1334 1358 0.7
L 1005:1196:1032 79 76 0.3

Mascot TMAP, Micro-simulation Model Calibration Report (Rev A)
Table C2: Comparison of PM Peak Hour Modelled and Observed flows
Junction Dir Link ref: Observed Modelled GEH
Gardeners Road and Kent Road
R 1232:1227:1241 28 10 4.1
T 1140:1231:1139 1442 1488 1.2
L 1241:1227:1238 76 75 0.1
R 1241:1227:1230 81 84 0.3
T 1139:1227:1238 1056 976 2.5
L 1138:1139:1228 8 4 1.6
Bourke Street and Gardeners Road
T 1281:1136:1134 133 122 1.0
L 1281:1136:1282 105 120 1.4
R 1281:1136:1226 140 148 0.7
T 1134:1136:1281 83 82 0.1
L 1134:1136:1226 20 26 1.3
R 1134:1136:1282 33 10 5.0
T 1321:1136:1226 1310 1335 0.7
L 1321:1136:1134 65.1 128 6.4
R 1282:1136:1281 120 118 0.2
T 1140:1136:1282 961 896 2.1
L 1140:1136:1281 171 151 1.6
O'Riordan Street and Gardeners Road
T 1213:1144:1212 962 958 0.1
L 1213:1144:1218 121 129 0.7
R 1214:1144:1323 221 222 0.1
T 1285:1144:1214 897 895 0.1
L 1285:1144:1323 107 76 3.2
R 1212:1144:1218 292 306 0.8
T 1217:1144:1323 1159 1178 0.6
L 1217:1144:1212 92 129 3.5
R 1218:1144:1214 66 61 0.6
T 1323:1144:1218 802 905 3.5
L 1323:1144:1214 116 111 0.5
Ricketty Streetand Kent Road
R 1137:1087:1088 400 412 0.6
T 1250:1087:1138 929 897 1.1
L 1088:1087:1137 760 769 0.3
R 1088:1087:1138 128.3 79 4.8
T 1138:1087:1137 1490 1488 0.1
L 1249:1087:1088 34.65 71 5.0
Kent Road and Coward Street
T 1088:1083:1035 26 15 2.4
L 1088:1083:1072 283 363 4.5
R 1088:1083:1081 16 4 3.8
T 1035:1083:1088 99 107 0.8
L 1035:1083:1081 6 2 2.0
R 1035:1083:1072 73 75 0.2
T 1072:1083:1081 19 13 1.5
L 1072:1083:1035 53.2 23 4.9
R 1072:1083:1088 636 638 0.1
T 1081:1083:1072 132 137 0.4
L 1081:1083:1088 123 130 0.6
R 1081:1083:1035 10 11 0.3
Bourke Street and Coward Street
T 1333:1089:1091 167 176 0.7
L 1333:1089:1092 44 26 3.0
R 1095:1089:1270 47.5 4 8.6
T 1330:1089:1095 144 201 4.3
L 1330:1270:1072 383 375 0.4
R 1091:1089:1092 66 79 1.5
T 1092:1089:1270 169 171 0.2
L 1092:1089:1091 54 24 4.8
R 1092:1089:1095 48 76 3.6
T 1072:1089:1092 233 279 2.9
L 1072:1089:1095 37.05 13 4.8
R 1072:1089:1091 334 319 0.8
O'Riordan Street and
T 1210:1115:1272 1037 1087 1.5
L 1210:1208:1117 44 47 0.4
Junction Dir Link ref: Observed Modelled GEH
Coward Street
T 1206:1115:1210 968 958 0.3
L 1206:1209:1207 13 22 2.2
R 1272:1115:1208 82 73 1.0
T 1208:1115:1209 194 248 3.6
L 1208:1115:1272 109 106 0.3
R 1208:1115:1210 27.55 0 7.4
T 1209:1115:1208 251 291 2.4
L 1209:1115:1210 132.1 55 8.0
R 1209:1115:1272 42 32 1.6
O'Riordan Street and Bourke Street
R 1113:1107:1106 35 40 0.8
T 1114:1107:1108 1128 1076 1.6
L 1106:1113:1114 7 0 3.7
R 1106:1107:1108 591 587 0.2
T 1108:1107:1113 703 753 1.9
L 1108:1336:1119 547 493 2.4
O'Riordan Street and King Street
T 1109:1110:1203 1638 1589 1.2
L 1109:1110:1204 81 75 0.7
T 1202:1110:1109 1009 1030 0.7
L 1202:1110:1016 12.35 0 5.0
R 1203:1110:1204 117 96 2.0
T 1204:1110:1016 4 4 0.0
L 1204:1110:1203 132 87 4.3
R 1204:1110:1109 114.5 169 4.6
T 1016:1110:1204 32.3 5 6.3
L 1016:1110:1109 15.75 43 5.0
R 1016:1110:1203 77 98 2.2
O'Riordan Street and Robey Street
T 1038:1197:1024 1247 1170 2.2
L 1038:1028:1030 97.85 45 6.3
R 1017:1197:1198 565 545 0.8
T 1298:1197:1017 788 772 0.6
T 1029:1197:1198 291 291 0.0
L 1029:1024:1037 60 61 0.1
T 1198:1197:1028 90 114 2.4
L 1201:1197:1017 334 377 2.3
Bourke Street and Church Avenue
T 1133:1131:1094 146 175 2.3
L 1133:1131:1120 62 73 1.3
T 1094:1131:1133 113 82 3.1
T 1132:1131:1120 51 30 3.3
L 1132:1131:1133 16 43 5.0
R 1132:1131:1094 58 58 0.0
Botany Road and Robey Street
R 1010:1008:1032 264 257 0.4
T 1010:1008:1196 1227 1234 0.2
L 1032:1008:1010 61 41 2.8
R 1032:1008:1196 127 112 1.4
T 1196:1008:1010 892 890 0.1
L 1005:1196:1032 132 93 3.7