Maryland Senate Budget and Taxation Committee January 28, 2015 Federal Funds Information for States ...
20
Maryland Senate Budget and Taxation Committee January 28, 2015 Federal Funds Information for States www.ffis.org Federal Funding Update: We Live in Interesting Times
-
Upload
toby-lucas -
Category
Documents
-
view
215 -
download
2
Transcript of Maryland Senate Budget and Taxation Committee January 28, 2015 Federal Funds Information for States ...

Maryland Senate Budget and Taxation CommitteeJanuary 28, 2015
Federal Funds Information for States
www.ffis.org
Federal Funding Update: We Live in Interesting Times

Big Questions
How does FY 2015 budget play out? Is there any hope for common ground?
– FY 2016 appropriations– Budget Control Act (BCA)– Expiring programs– Tax reform– Debt limit

But first, the basics
Composition of Federal Outlays in FY 2013($ in Billions, % of Total)

Per capita federal spending flowing to Maryland, FY 2013
Source: Pew Charitable Trusts

What program areas are supported by federal grants to state/local gov’t?
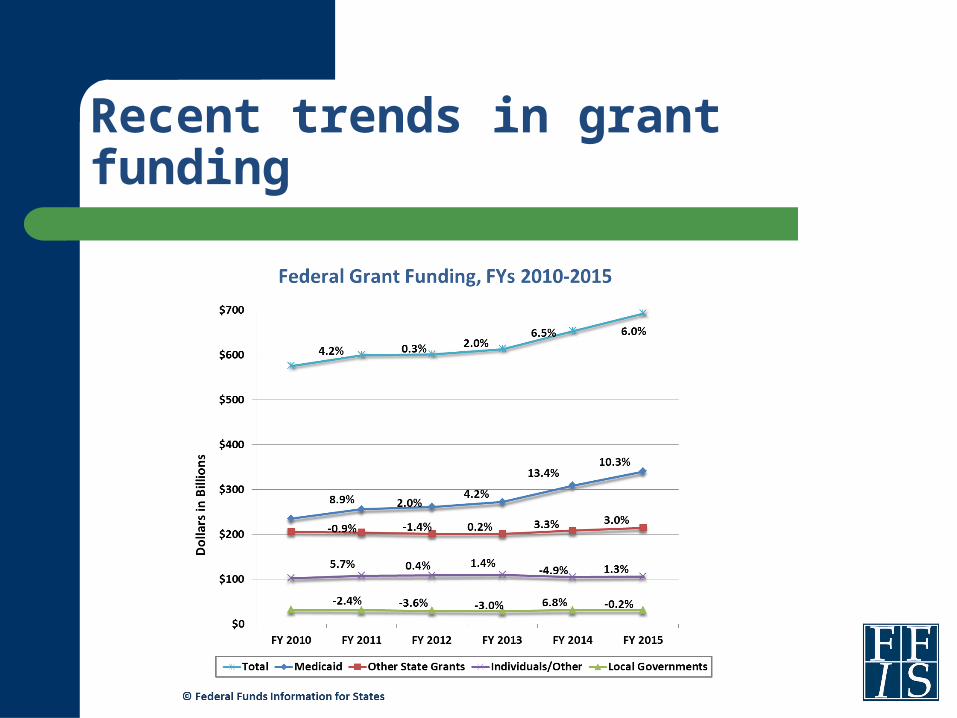
Recent trends in grant funding

Per capita federal spending on selected grants, FY 2013
$0
$1,000
$2,000
$3,000
$4,000
$5,000
$6,000
Dist
rict o
f Col
umbi
aAl
aska
Wyo
min
gNe
w Y
ork
New
Mex
icoVe
rmon
tM
ississ
ippi
Wes
t Virg
inia
Rhod
e Isl
and
Loui
siana
Mai
neM
onta
naTe
nnes
see
Arka
nsas
Dela
war
eKe
ntuc
kyM
assa
chus
etts
Ore
gon
Puer
to R
icoCa
lifor
nia
Haw
aii
Nort
h Da
kota
Arizo
naO
hio
Mich
igan
Miss
ouri
Conn
ectic
utAl
abam
aSo
uth
Dako
taPe
nnsy
lvan
iaU.
S. A
vera
geId
aho
Okl
ahom
aIn
dian
aIo
wa
Nort
h Ca
rolin
aM
inne
sota
Wisc
onsin
Illin
ois
Sout
h Ca
rolin
aGe
orgi
aTe
xas
Mar
ylan
dNe
w Je
rsey
Flor
ida
Nebr
aska
Was
hing
ton
Utah
Kans
asCo
lora
doVi
rgin
iaNe
w H
amps
hire
Neva
da
© 2014 Federal Funds Information for States
$4,815
$1,877
$1,187
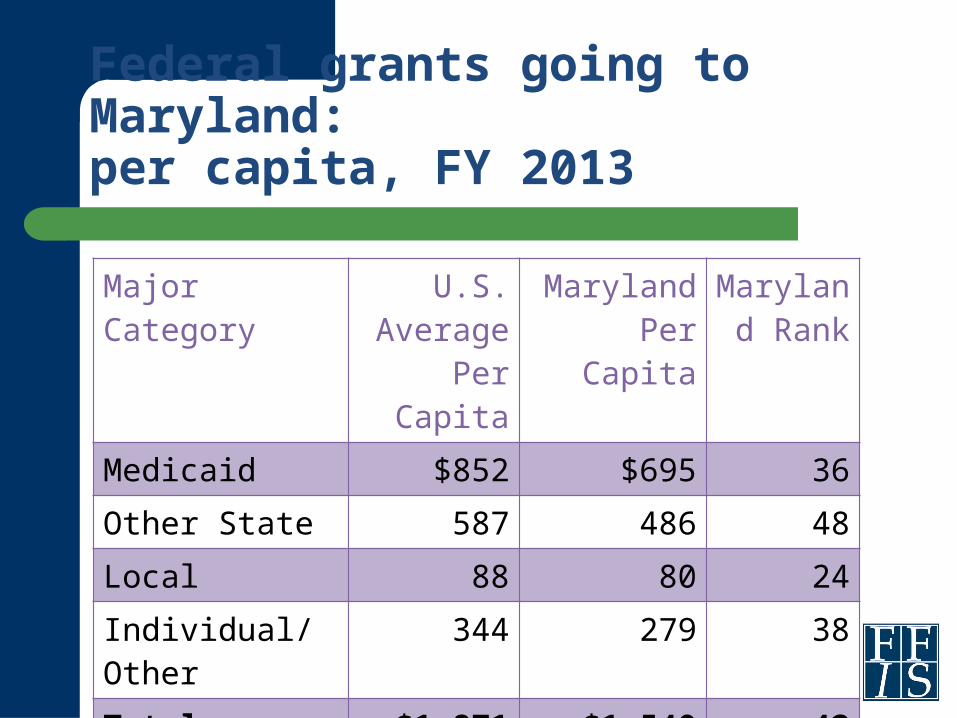
Federal grants going to Maryland: per capita, FY 2013
Major Category U.S. Average
Per Capita
MarylandPer Capita
Maryland Rank
Medicaid $852 $695 36Other State 587 486 48Local 88 80 24Individual/Other 344 279 38Total $1,871 $1,540 42

Conflicts on the horizon
FY 2015 Homeland Security/immigration FY 2016 budget; amending BCA Deficit reduction Tax reform Federal workforce Debt limit Highway Trust Fund solvency Expiring programs

The BCA is the law of the land
Discretionary sequestration persists in form of lower caps
Mandatory sequestration still occurs– Bipartisan Budget Act (BBA) extended it to FY 2023– Repeal unlikely– ATB percentages applied to current-law levels
Defense Nondefense
FY 2014 -9.8% -7.2%
FY 2015 -9.5% -7.3%
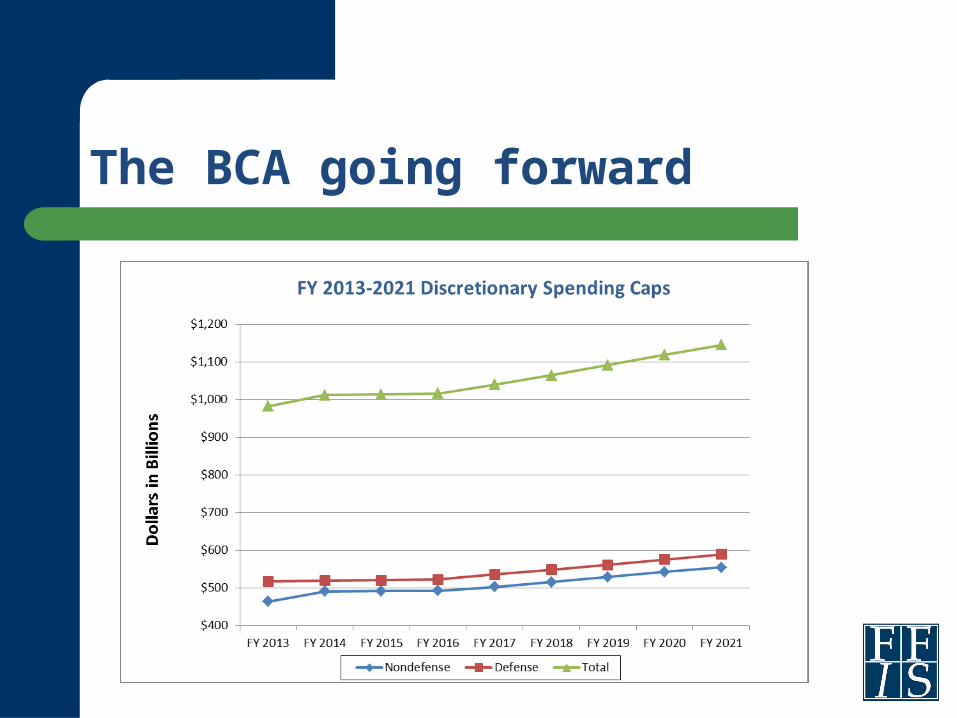
The BCA going forward

BCA projections
2013 2014 1/ 2015 1/ 2016 2017 2018 2019 2020 2021
Nondefense caps $490.9 $506.0 $520.0 $530.0 $541.0 $553.0 $566.0 $578.0 $590.0Sequestration: nondefense discretionary -26.4 -14.2 -27.6 -37.0 -37.3 -37.3 -36.3 -35.1 -34.8 Subtotal 464.5 491.8 492.4 493.0 503.7 515.7 529.7 542.9 555.2
Change from previous year ($) NA 27.3 0.6 0.6 10.7 11.9 14.0 13.2 12.3 Change from previous year (%) NA 5.9% 0.1% 0.1% 2.2% 2.4% 2.7% 2.5% 2.3%
Nondefense, mandatory sequestration -16.9 -18.1 -17.2 -17.7 -17.4 -17.3 -18.4 -19.6 -19.9
Defense caps 552.1 552.0 566.0 577.0 590.0 603.0 616.0 630.0 644.0Sequestration -34.3 -31.5 -44.7 -53.9 -53.9 -53.9 -53.9 -53.9 -53.9Subtotal 517.8 520.5 521.3 523.1 536.1 549.1 562.1 576.1 590.1
Change from previous year ($) NA 2.7 0.8 1.8 13.0 13.0 13.0 14.0 14.0Change from previous year (%) NA 0.5% 0.2% 0.3% 2.5% 2.4% 2.4% 2.5% 2.4%
Total discretionary spending $982.3 $1,012.2 $1,013.6 $1,016.1 $1,039.8 $1,064.7 $1,091.8 $1,119.0 $1,145.3 Change from previous year ($) NA 29.9 1.4 2.4 23.7 24.9 27.0 27.2 26.3 Change from previous year (%) NA 3.0% 0.1% 0.2% 2.3% 2.4% 2.5% 2.5% 2.3%
1/ FY 2013 discretionary caps reflect FY 2013 appropriations. FY 2013 sequestration includes other adjustments.
Source: Congressional Budget Office
The Budget Control Act: Sequestration and Discretionary Caps FYs 2013-2021(dollars in billions)
2/ FYs 2014 and 2015 subtotals are the revised caps in the Bipartisan Budget Act, which partially reduces the effect of sequestration on discretionary spending.

Implications of the BCA
Source: CBO Budget and Economic Outlook, 2/14

Expiring programs in an uncertain environment
Programs covering all major areas expire in 2015 Most are mandatory-funded programs
– Require congressional action
Some have been operating under short-term extensions for years
ACA programs at greatest risk

National funding at stake

Recent and upcoming deadlines
October 1, 2014
• Mandatory sequestration
• Health insurance rate review, ADRCs, College Access Challenge grants expired
January 1, 2015
• Medicaid primary care increase expired
• No new exchange grants
• Tax extenders expired
February 27, 2015
• FY 2015 CR for Homeland Security expires

Recent and upcoming deadlines
March 15, 2015
• Debt limit reinstated
April 1, 2015
• Qualifying Individual, Transitional Medical Assistance, Early Childhood Home Visiting and others expire
June 1, 2015
• Highway Trust Fund (HTF) projected to become insolvent
• Surface transportation programs expire

Recent and upcoming deadlines
July 1, 2015
• Import-Export Bank expires
October 1, 2015
• TANF and related programs expire
• No new allotments for CHIP• Many ACA programs expire• Airport improvement program
expires• Some child nutrition programs
expire• Internet tax moratorium expires

More questions than answers
Budget resolution
BCA
Deficit reduction
Tax reformProgram extensions
ACA
Debt limit increase
• Will it be total gridlock and if so, how will it affect states?