
Mary Manning, Portfolio Manager Morgan Stanley August 2019 · •Uncorrelated and offers...
17
1 1 1 1 Mary Manning, Portfolio Manager Morgan Stanley August 2019
Transcript of Mary Manning, Portfolio Manager Morgan Stanley August 2019 · •Uncorrelated and offers...
1111
Mary Manning, Portfolio Manager
Morgan Stanley August 2019
2222
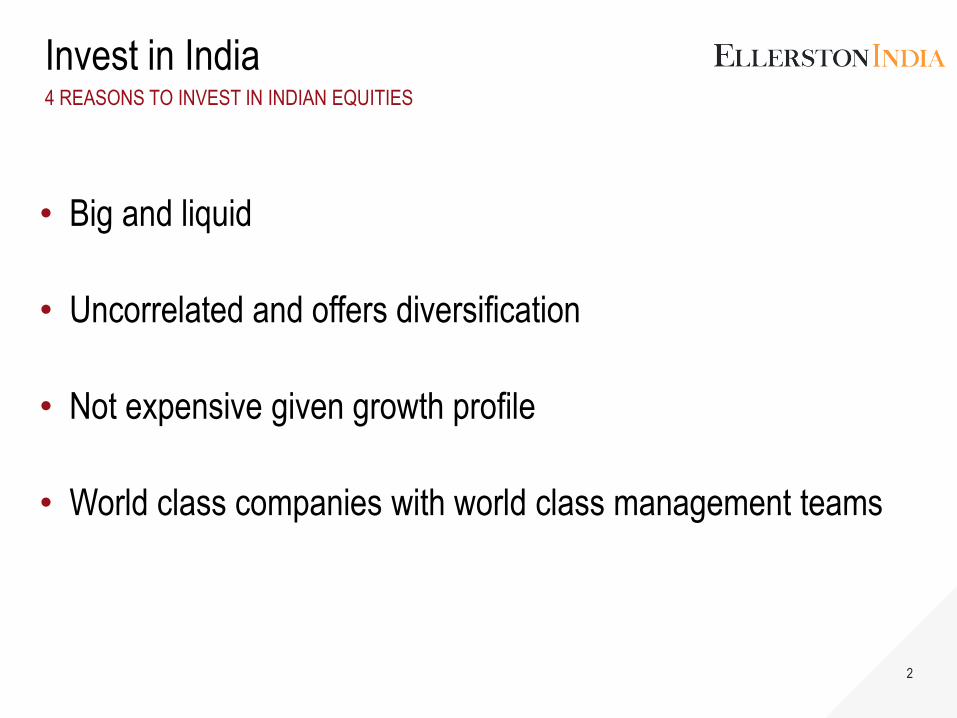
Invest in India4 REASONS TO INVEST IN INDIAN EQUITIES
2
• Big and liquid
• Uncorrelated and offers diversification
• Not expensive given growth profile
• World class companies with world class management teams
3333
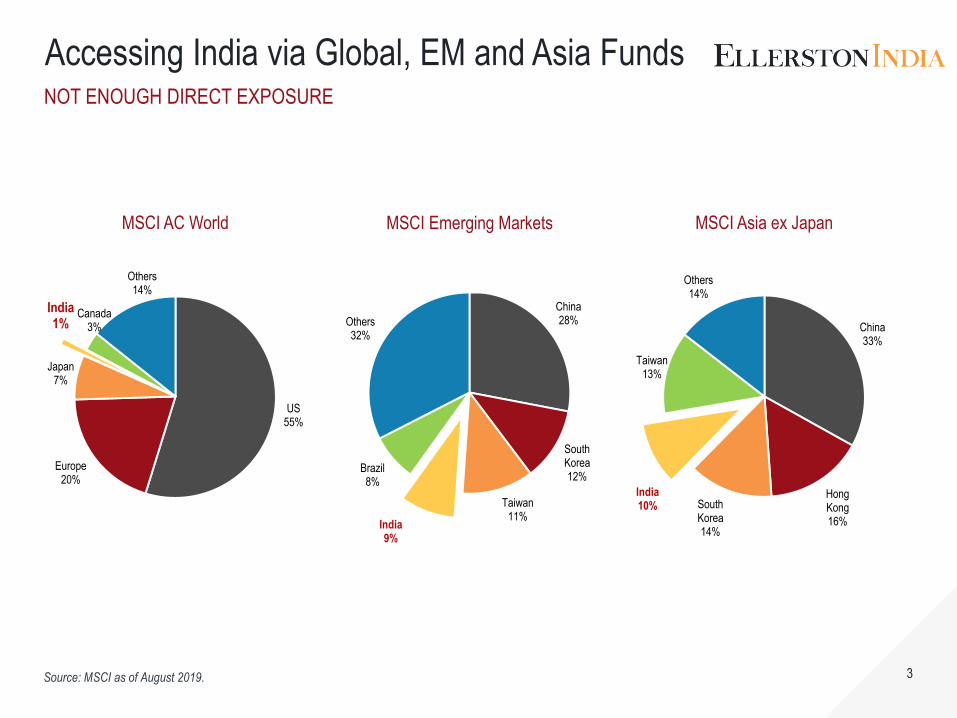
Accessing India via Global, EM and Asia FundsNOT ENOUGH DIRECT EXPOSURE
3
Source: MSCI as of August 2019.
US55%
Europe20%
Japan7%
India1%
Canada3%
Others14%
China28%
South Korea12%
Taiwan11%
India9%
Brazil8%
Others32%
China33%
Hong Kong16%
South Korea14%
India10%
Taiwan13%
Others14%
MSCI AC World MSCI Emerging Markets MSCI Asia ex Japan
4444
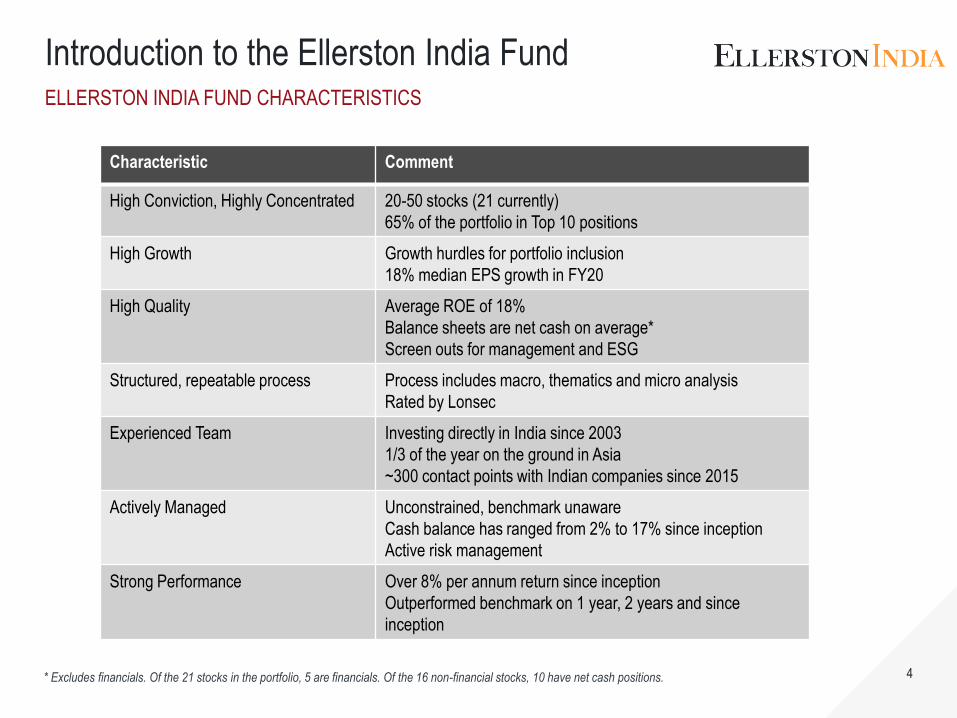
Introduction to the Ellerston India FundELLERSTON INDIA FUND CHARACTERISTICS
* Excludes financials. Of the 21 stocks in the portfolio, 5 are financials. Of the 16 non-financial stocks, 10 have net cash positions.
4
Characteristic Comment
High Conviction, Highly Concentrated 20-50 stocks (21 currently)
65% of the portfolio in Top 10 positions
High Growth Growth hurdles for portfolio inclusion
18% median EPS growth in FY20
High Quality Average ROE of 18%
Balance sheets are net cash on average*
Screen outs for management and ESG
Structured, repeatable process Process includes macro, thematics and micro analysis
Rated by Lonsec
Experienced Team Investing directly in India since 2003
1/3 of the year on the ground in Asia
~300 contact points with Indian companies since 2015
Actively Managed Unconstrained, benchmark unaware
Cash balance has ranged from 2% to 17% since inception
Active risk management
Strong Performance Over 8% per annum return since inception
Outperformed benchmark on 1 year, 2 years and since
inception

5555
Ellerston India Fund
Source: Ellerston India. As of July 2019.
PORTFOLIO AND PERFORMANCE SNAPSHOT
5
Top 10 Positions
Sector Exposure Top 10 Positions
Performance 1 Month 3 Months 6 Months 1 Year 2 Years
Since
Inception
Since
Inception
p.a.
EIF Net -2.4% -0.8% 10.0% 5.7% 19.5% 18.9% 8.0%
Benchmark* -3.5% -3.3% 10.1% 3.6% 17.2% 17.2% 7.3%
Alpha 1.1% 2.5% -0.1% 2.1% 2.3% 1.7% 0.6%
ELLERSTON INDIA FUND SNAPSHOT & PERFORMANCE

6666
Investment process: Bottom up stock selectionCONVICTION SCORECARD REDUCES INVESTMENT UNIVERSE TO A FOCUS LIST OF STOCKS
6
3 Year EPS growth. Score of 0 to 3. <10% EPS = 0, 10-20% = 1, 20-30% = 2, > 30% = 3.
Upside to 3 year Price Target. Score of 0 to 3. <50% = 0, 50-75% = 1, 75-100% = 2, >100% = 3.
Score of 0 or 1. 0 for unattractive industry, 1 for attractive.
Score of 0 or 1. 1 if the stock fits one of the 4 thematics. 0 if no thematic fit.
Score of -1 to +1. Knocked out for poor management.
Score of -1 to +1. Knocked out for poor ESG.
Growth
Upside
Industry Structure
Thematic
Mgmt
ESG
~150
~75
FOCUS LIST OF ~50 STOCKS FOR DEEP DIVE FUNDAMENTAL ANALYSIS
~250 stocks
Quantitative
Quantitative
Qualitative
Qualitative
Qualitative
Quantitative then
Qualitative

7777
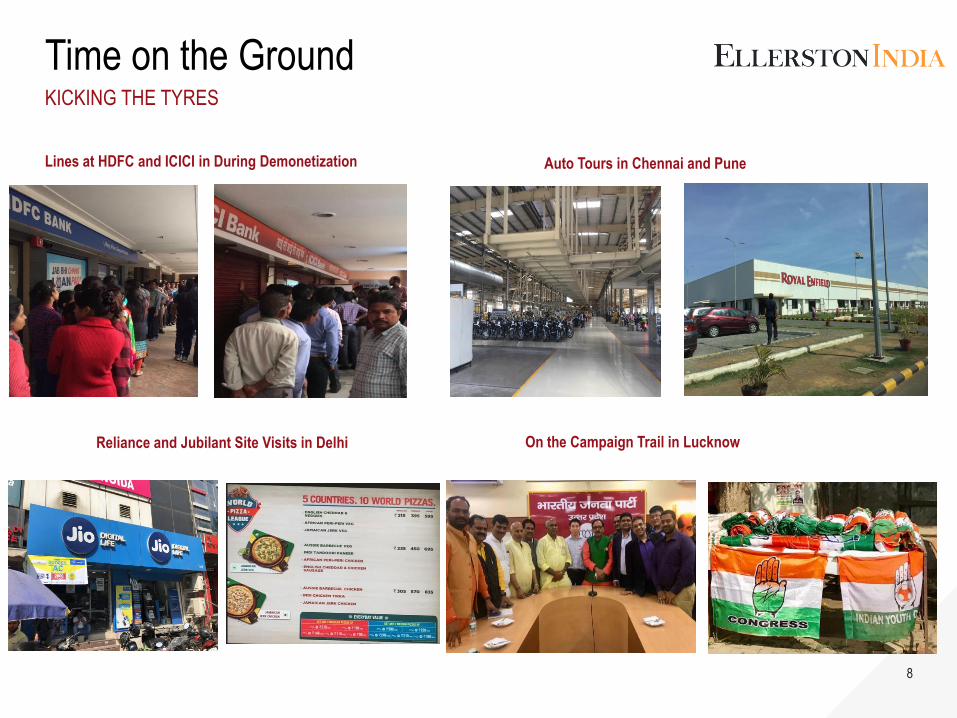
Time on the GroundGAINING INSIGHTS AND BUILDING CLOSE RELATIONSHIPS WITH COMPANIES
7
• The team spends on average over 1/3 of the year on the ground in Asia.
• Since 2015 the team has had ~300 meetings, calls and site visits with Indian companies.
• Approximately 200 of these have been since inception of the India fund in mid-2017.
Trip Date Team Member Locations No of Company Visits No of Site Visits
June 2015 Mary Manning Mumbai 22 2
May 2016 Eric Fong Pune, Mumbai 19 1
Nov 2016 Mary Manning New Delhi, Gurgaon 15 2
June 2017 Fredy Hoh Mumbai 19 1
June 2017 Eric Fong Chennai, Mumbai 22 7
Nov 2017 Mary Manning New Delhi, Gurgaon 13 4
June 2018 Vinay Narsi Mumbai 19 2
March 2019 Fredy Hoh Mumbai, Lucknow 15 6
March 2019 Vinay Narsi New Delhi, Bangalore 13 9
July 2019 Mary Manning Mumbai, Pune 15 8
Other* Whole Team Singapore/HK/Sydney 81 2
Total 253 44
* Includes calls, video conferences, meetings with Indian companies at Asia conferences or in Sydney. Other site visits include visiting Tata-JLR dealerships in China.
8888
Time on the GroundKICKING THE TYRES
Lines at HDFC and ICICI in During Demonetization Auto Tours in Chennai and Pune
Reliance and Jubilant Site Visits in Delhi On the Campaign Trail in Lucknow
9999
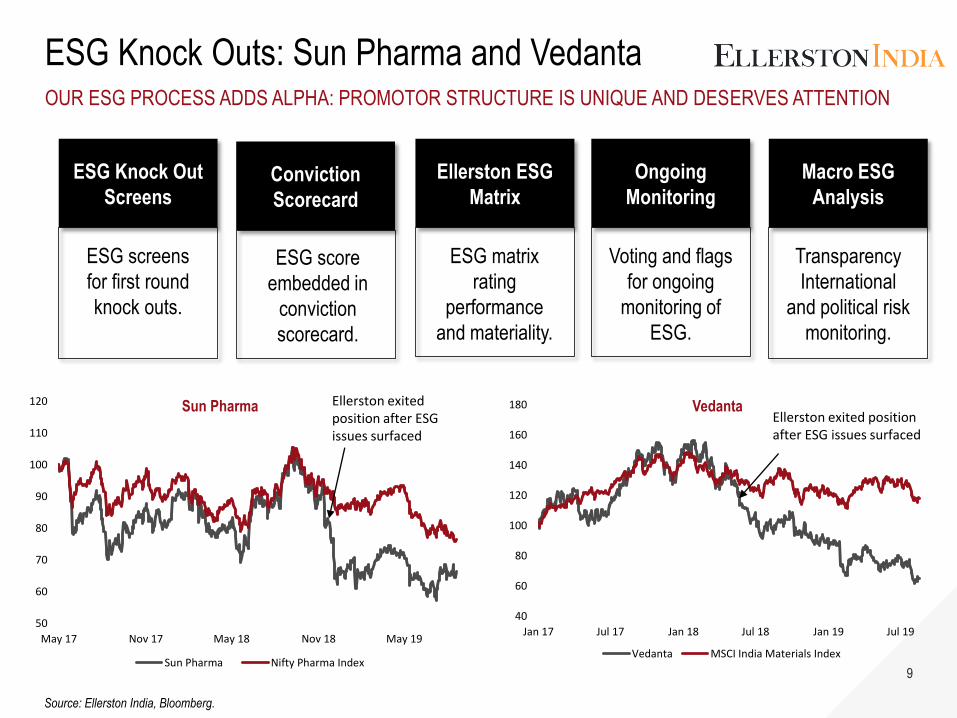
ESG Knock Outs: Sun Pharma and VedantaOUR ESG PROCESS ADDS ALPHA: PROMOTOR STRUCTURE IS UNIQUE AND DESERVES ATTENTION
9
Source: Ellerston India, Bloomberg.
Sun Pharma Vedanta
40
60
80
100
120
140
160
180
Jan 17 Jul 17 Jan 18 Jul 18 Jan 19 Jul 19
Vedanta MSCI India Materials Index
Ellerston exited position after ESG issues surfaced
50
60
70
80
90
100
110
120
May 17 Nov 17 May 18 Nov 18 May 19
Sun Pharma Nifty Pharma Index
Ellerston exited position after ESG issues surfaced
ESG Knock Out
Screens
Ellerston ESG
MatrixConviction
Scorecard
Ongoing
Monitoring
Macro ESG
Analysis
ESG screens
for first round
knock outs.
ESG matrix
rating
performance
and materiality.
ESG score
embedded in
conviction
scorecard.
Voting and flags
for ongoing
monitoring of
ESG.
Transparency
International
and political risk
monitoring.
10101010
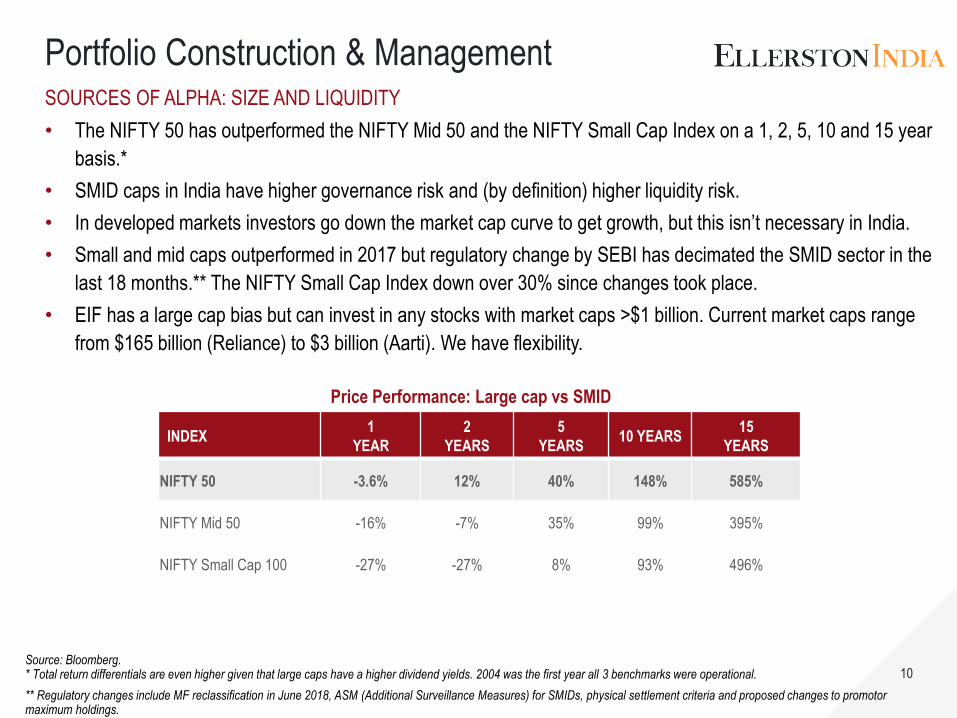
Portfolio Construction & Management SOURCES OF ALPHA: SIZE AND LIQUIDITY
• The NIFTY 50 has outperformed the NIFTY Mid 50 and the NIFTY Small Cap Index on a 1, 2, 5, 10 and 15 year
basis.*
• SMID caps in India have higher governance risk and (by definition) higher liquidity risk.
• In developed markets investors go down the market cap curve to get growth, but this isn’t necessary in India.
• Small and mid caps outperformed in 2017 but regulatory change by SEBI has decimated the SMID sector in the
last 18 months.** The NIFTY Small Cap Index down over 30% since changes took place.
• EIF has a large cap bias but can invest in any stocks with market caps >$1 billion. Current market caps range
from $165 billion (Reliance) to $3 billion (Aarti). We have flexibility.
10
Price Performance: Large cap vs SMID
INDEX1
YEAR
2
YEARS
5
YEARS10 YEARS
15
YEARS
NIFTY 50 -3.6% 12% 40% 148% 585%
NIFTY Mid 50 -16% -7% 35% 99% 395%
NIFTY Small Cap 100 -27% -27% 8% 93% 496%
Source: Bloomberg. * Total return differentials are even higher given that large caps have a higher dividend yields. 2004 was the first year all 3 benchmarks were operational.
** Regulatory changes include MF reclassification in June 2018, ASM (Additional Surveillance Measures) for SMIDs, physical settlement criteria and proposed changes to promotor maximum holdings.

11111111
Portfolio Construction & Management SOURCES OF ALPHA: SECTOR & SUB-SECTOR ALLOCATION
• India is primarily a domestic demand market. ~74% of the revenues in the benchmark and ~77% of the
revenues in our portfolio are generated domestically.
• IT and Pharma are the only 2 sectors in India that are heavy exporters. Approximately 95% of the revenues in
IT and ~73% in pharma are from overseas.
• Significant rotation occurs between domestic and exporting sectors depending on trajectory for the INR.
• Sub-sector allocation is also important: banks vs non-banks, consumer discretionary vs staples.
11
Indian Stock Market and the EIF Portfolio are
Domestic Oriented
Source: Bloomberg and Ellerston India Fund.
Sector and Sub Sector Allocation Matters

12121212
Portfolio Construction & Management SOURCES OF ALPHA: STOCK PICKING
12
• High growth consumer finance company with market
cap of $37 billion.
• Loan growth of 34%, EPS of 33%, Net Interest
Margins of 11% and ROE of 22%.
• Growth is sustainable given low credit penetration and
company commitment to fintech.
• Stock up 12x in 5 years and up 68% since investment
at inception.
0
500
1,000
1,500
2,000
2,500
3,000
3,500
4,000
2014 2015 2016 2017 2018 0
200
400
600
800
1,000
1,200
1,400
1,600
1,800
2,000
2014 2015 2016 2017 2018 2019
• India’s largest FMCG company with market cap of
$83bn. Approx. 9 out of 10 households use HUL
products.
• EPS of 15%, ROE of 80% and consistent margin
expansion ~100bps per year since 2011.
• Strong revenue & earnings growth profile due to its
superior customer reach and strong suite of products.
• Stock up 3x in 5 years and up 100% since investment
at inception.

13131313
Portfolio Construction & Management SOURCES OF ALPHA: STOCK PICKING
13
• Indian conglomerate with a market cap of $162bn.
• Multiple growth levers including refining,
petrochemicals retail and telecom.
• 340m Jio subscribers, 10K retail stores, world’s largest
refining hub (1.2m BPSD).
• 3 year EPS CAGR of 16%. ROE of 11% and growing.
• Stock has doubled in 2 years and is up 84% since
inception.
• India’s largest engineering and construction company
with market cap of $38bn.
• Order book of $US40 billion equivalent to 2 years of
revenues. 15% 3 year revenue EPS CAGR. ROE of
14%.
• Benefits from supportive government infrastructure
policies, well regarded management, strong execution
and scarcity value.
• Scarcity value as the only large cap, pure play infra
stock in India with acceptable governance.
• Stock up 13% since investment at inception.
14141414
─ Profit taking on accelerated price appreciation
─ Knock out ESG
─ Management change
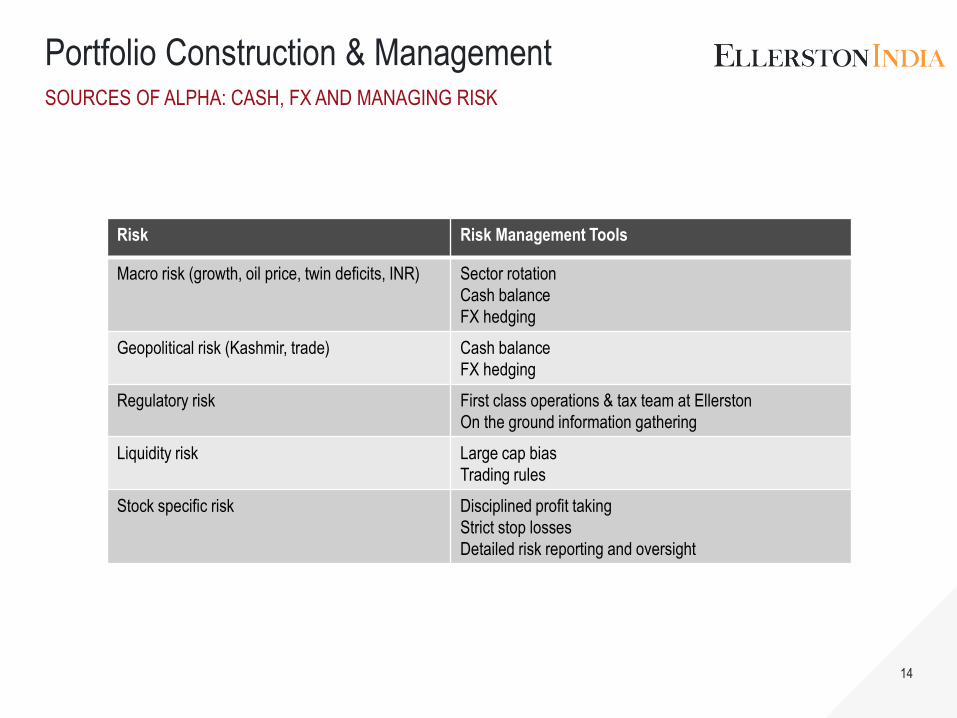
Portfolio Construction & ManagementSOURCES OF ALPHA: CASH, FX AND MANAGING RISK
14
Risk Risk Management Tools
Macro risk (growth, oil price, twin deficits, INR) Sector rotation
Cash balance
FX hedging
Geopolitical risk (Kashmir, trade) Cash balance
FX hedging
Regulatory risk First class operations & tax team at Ellerston
On the ground information gathering
Liquidity risk Large cap bias
Trading rules
Stock specific risk Disciplined profit taking
Strict stop losses
Detailed risk reporting and oversight

15151515
Gross performance as of 30 Ap9il 2018Ellerston India Fund HISTORICAL PERFORMANCE AS OF 31 JULY 2019
* Benchmark is MSCI India Net Index in AUD. ** EIF has a management fee of 1.1%. Beta Shares India ETF has a management fee of 0.80% and ETF Securities’ India ETF has a management fee of 0.85%.
15
Performance 1 Month 3 Months 6 Months 1 Year 2 Years
Since
Inception
Since
Inception
p.a.
EIF Net -2.4% -0.8% 10.0% 5.7% 19.5% 18.9% 8.0%
Benchmark* -3.5% -3.3% 10.1% 3.6% 17.2% 17.2% 7.3%
Alpha 1.1% 2.5% -0.1% 2.1% 2.3% 1.7% 0.6%
• Ellerston India Fund has delivered a 19% return (8% per annum) since inception.
• Ellerston India Fund has outperformed the benchmark on a 1 year, 2 year and since inception basis.
• EIF has significantly outperformed the fund of funds available in Australia.
• The alpha generated by the Ellerston India Fund is greater than the fee differential versus an India ETF that performs in line with the benchmark on a 1 Year, 2 Year and since inception basis.*

16161616
Summary and Conclusion
• The Indian equity market has been one of the best performing markets in the world in the last 20 years.
• Given demographics, growth trajectory, productivity improvements, Modi’s reformist policy agenda and MSCI changes, India can be the best performing market in the next 20 years.
• The Ellerston India Fund is the best way to access the Indian market from Australia.
• This market is too big and too good to ignore. Start investing in India now.
India is too big to ignore. Invest in India now.

17171717
Thank you
SYDNEY OFFICE
Level 11, 179 Elizabeth Street,
Sydney NSW 2000
+612 9021 7797
MELBOURNE OFFICE
Level 4, 75-77 Flinders Lane,
Melbourne VIC 3000
+612 9021 7797