MARVELORIGINS CS 235 Data Visualization Project 12/17/2014 Jarad Bell Ryan LaCross Stella Lee Karan...
12
MARVELORIGINS CS 235 Data Visualization Project 12/17/2014 Jarad Bell Ryan LaCross Stella Lee Karan Khare
-
Upload
mervyn-stanley -
Category
Documents
-
view
218 -
download
1
Transcript of MARVELORIGINS CS 235 Data Visualization Project 12/17/2014 Jarad Bell Ryan LaCross Stella Lee Karan...

MARVELORIGINSCS 235 Data Visualization Project
12/17/2014
Jarad BellRyan LaCross
Stella LeeKaran Khare
Library of8,000 Characters
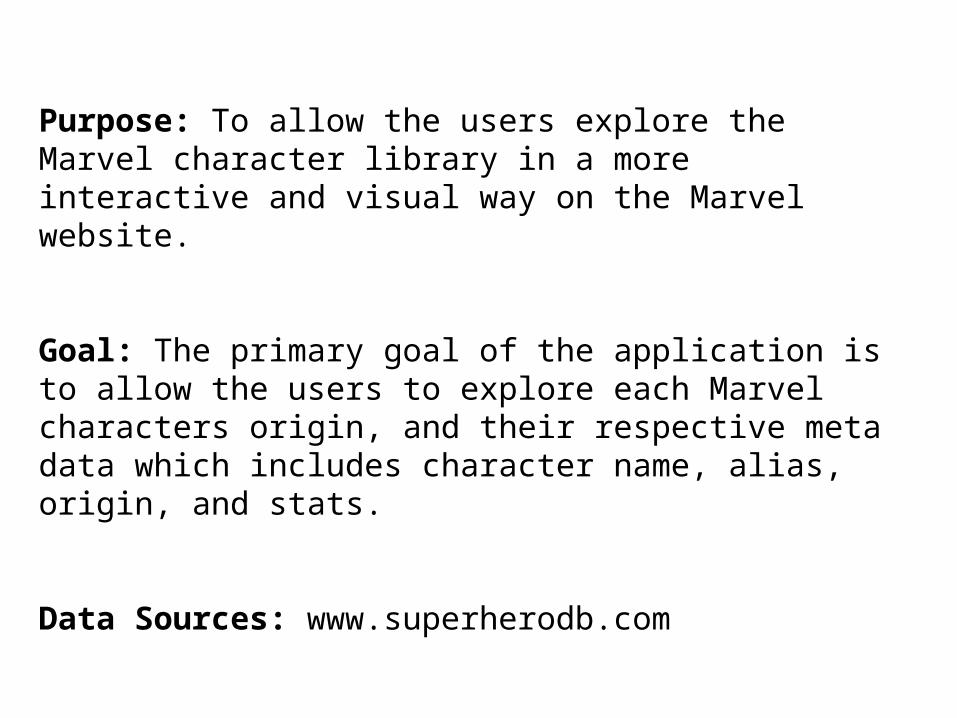
Purpose: To allow the users explore the Marvel character library in a more interactive and visual way on the Marvel website.
Goal: The primary goal of the application is to allow the users to explore each Marvel characters origin, and their respective meta data which includes character name, alias, origin, and stats.
Data Sources: www.superherodb.com

DATAVISUALISATONS
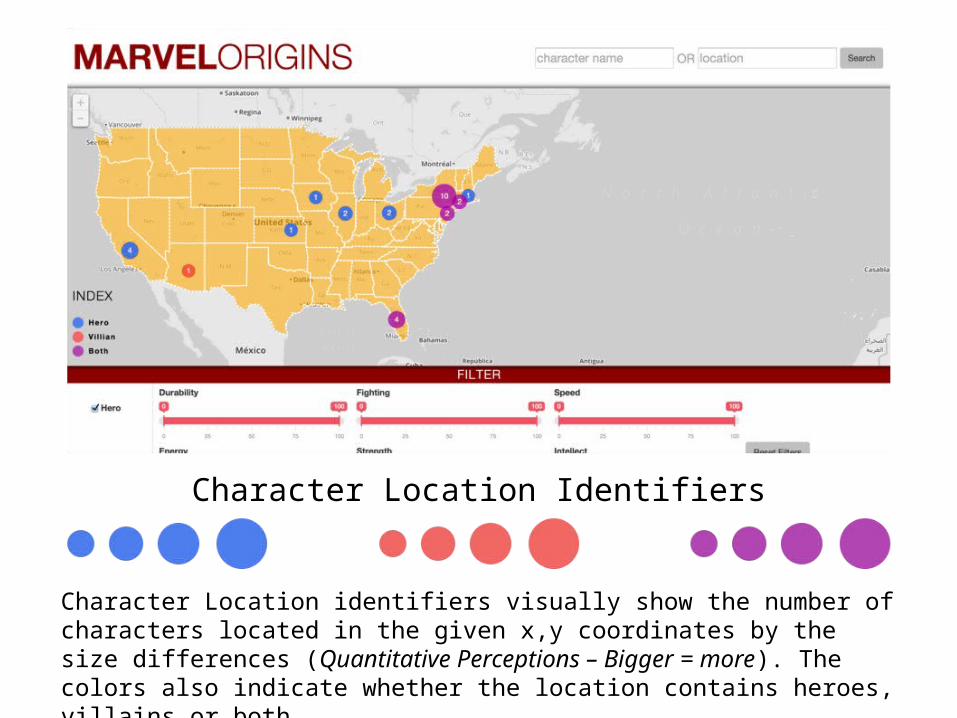
Character Location Identifiers
Character Location identifiers visually show the number of characters located in the given x,y coordinates by the size differences (Quantitative Perceptions – Bigger = more). The colors also indicate whether the location contains heroes, villains or both.

Dynamic Stat Query: The location identifiers change to reflect the parameters set by the sliders below. This allows the users to filter out the data based upon the changes made to the six stat sliders

Character Stats: The character stats are nominal data displayed in a bar chart to show each of the quantitative values that make up the character. In essence each of the stats represents parts of the whole character that can be compared and contrasted against themselves as well against other characters.

TECHNICALSPECIFICATIONS

Programing & FrameworkHTML5, CSS3, Javascript, Jquery, JSON, CSV
Plugins and other Javascript frameworks usedLeafletis (for implementing custom boundary map)Rangerslider.js (for implementing range slides to use for the dynamic query filters)HorizBarChart.js (for implementing horizontal bar charts)
How to implement the application1. Created the HTML5 markup for the given design
mockups2. Customized with Bootstrap CSS framework3. Created a custom CSS for styling4. Use leaflets to create a custom boundary map5. United State SVG data fed into us-stats-us along
with pickup from CSV file and fed into the same JS file act as Data model
6. Created elements.js to handle various functionalities such as plotting data points on the map and displaying the modal that contains the character meta data image.

Screen Shot of Character Stats in a Excel File