MARUTI SUZUKI INDIA LTD.breport.myiris.com/firstcall/MARUDYOG_20140129.pdf · Maruti Suzuki...
12
CMP 1542.00 Target Price 1681.00 ISIN: INE585B01010 JANUARY 29 th , 2014 MARUTI SUZUKI INDIA LTD. STANDALONE Result Update: Q3 FY14 HOLD HOLD HOLD HOLD Index Details Stock Data Sector Automobile BSE Code 532500 Face Value 5.00 52wk. High / Low (Rs.) 1864.00/1217.00 Volume (2wk. Avg.) 43000 Market Cap (Rs. in mn.) 465807.36 Annual Estimated Results (A*: Actual / E*: Estimated) Years FY13A FY14E FY15E Net Sales 435879.30 432556.49 454184.31 EBITDA 50420.50 59319.41 67099.49 Net Profit 23921.30 27972.36 31577.07 EPS 79.19 92.60 104.53 P/E 20.19 16.65 14.75 Shareholding Pattern (%) 1 Year Comparative Graph MARUTI SUZUKI INDIA LTD. S&P BSE SENSEX SYNOPSIS Maruti Suzuki India Ltd. is India’s largest passenger vehicle company with a market share close to 40% which offers 15 models with over 200 variants across the Industry segments like: Passenger cars, Utility vehicles and Vans. The Company has posted a net profit of Rs. 6811.50 million for the quarter ended Dec. 31, 2013 where as the same was at Rs. 5012.90 million for the quarter ended Dec. 31, 2012. Revenue for the quarter (Q3 FY14) fell 2.74% to Rs. 108938.40 million from Rs. 112003.40 million, when compared with the prior year period. Total Income is Rs. 110107.90 million for the quarter ended Dec. 31, 2013 where as the same was at Rs. 113889.60 million for the quarter ended Dec. 31, 2012. Maruti Suzuki India Limited (MSIL) sold a total no. of 288151 vehicles in Q3 FY14, a drop of 4.4 per cent as compared to 301453 in Q3 FY13 includes domestic & exports. Exports of vehicle units posted a rise of 38.6% in Q3 FY14 to 19966 with respect to 32496 in corresponding quarter of last year. The capital investment proposed for this year is approximately Rs. 35000 million. Net profit during the 9 month period stood at Rs. 19830 million, a growth of 72.10% over same period last fiscal. Net Sales and Operating Profit of the company are expected to grow at a CAGR of 8% and 24% over 2012 to 2015E respectively. PEER GROUPS CMP MARKET CAP EPS P/E (X) P/BV(X) DIVIDEND Company Name (Rs.) Rs. in mn. (Rs.) Ratio Ratio (%) Maruti Suzuki India Ltd 1542.00 465807.36 79.19 19.47 2.51 150.00 Mahindra & Mahindra Ltd 873.45 537951.20 59.31 14.73 3.67 260.00 Force Motors Ltd 312.00 4111.00 7.21 43.27 0.36 100.00
Transcript of MARUTI SUZUKI INDIA LTD.breport.myiris.com/firstcall/MARUDYOG_20140129.pdf · Maruti Suzuki...
CMP 1542.00
Target Price 1681.00
ISIN: INE585B01010
JANUARY 29th
, 2014
MARUTI SUZUKI INDIA LTD.
STANDALONE Result Update: Q3 FY14
HOLDHOLDHOLDHOLD
Index Details
Stock Data
Sector Automobile
BSE Code 532500
Face Value 5.00
52wk. High / Low (Rs.) 1864.00/1217.00
Volume (2wk. Avg.) 43000
Market Cap (Rs. in mn.) 465807.36
Annual Estimated Results (A*: Actual / E*: Estimated)
Years FY13A FY14E FY15E
Net Sales 435879.30 432556.49 454184.31
EBITDA 50420.50 59319.41 67099.49
Net Profit 23921.30 27972.36 31577.07
EPS 79.19 92.60 104.53
P/E 20.19 16.65 14.75
Shareholding Pattern (%)
1 Year Comparative Graph
MARUTI SUZUKI INDIA LTD. S&P BSE SENSEX
SYNOPSIS
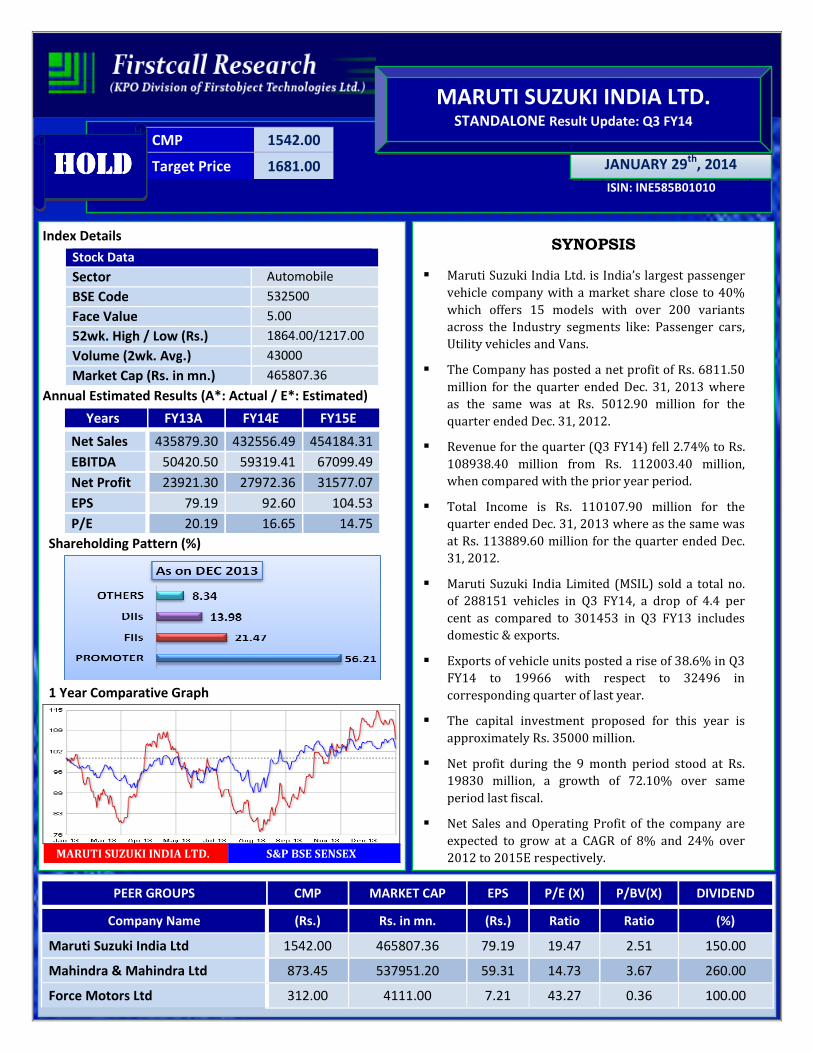
� Maruti Suzuki India Ltd. is India’s largest passenger
vehicle company with a market share close to 40%
which offers 15 models with over 200 variants
across the Industry segments like: Passenger cars,
Utility vehicles and Vans.
� The Company has posted a net profit of Rs. 6811.50
million for the quarter ended Dec. 31, 2013 where
as the same was at Rs. 5012.90 million for the
quarter ended Dec. 31, 2012.
� Revenue for the quarter (Q3 FY14) fell 2.74% to Rs.
108938.40 million from Rs. 112003.40 million,
when compared with the prior year period.
� Total Income is Rs. 110107.90 million for the
quarter ended Dec. 31, 2013 where as the same was
at Rs. 113889.60 million for the quarter ended Dec.
31, 2012.
� Maruti Suzuki India Limited (MSIL) sold a total no.
of 288151 vehicles in Q3 FY14, a drop of 4.4 per
cent as compared to 301453 in Q3 FY13 includes
domestic & exports.
� Exports of vehicle units posted a rise of 38.6% in Q3
FY14 to 19966 with respect to 32496 in
corresponding quarter of last year.
� The capital investment proposed for this year is
approximately Rs. 35000 million.
� Net profit during the 9 month period stood at Rs.
19830 million, a growth of 72.10% over same
period last fiscal.
� Net Sales and Operating Profit of the company are
expected to grow at a CAGR of 8% and 24% over
2012 to 2015E respectively.
PEER GROUPS CMP MARKET CAP EPS P/E (X) P/BV(X) DIVIDEND
Company Name (Rs.) Rs. in mn. (Rs.) Ratio Ratio (%)
Maruti Suzuki India Ltd 1542.00 465807.36 79.19 19.47 2.51 150.00
Mahindra & Mahindra Ltd 873.45 537951.20 59.31 14.73 3.67 260.00
Force Motors Ltd 312.00 4111.00 7.21 43.27 0.36 100.00

Investment Highlights STANDALONE
Results updates- Q3 FY14,
Maruti Suzuki is India’s largest passenger vehicle
company with a market share close to 40% which
offers 14 models with over 200 variants across the
Industry segments like: Passenger cars, Utility
vehicles and Vans, reported its financial results for
the quarter ended 31 DEC, 2013.
Months DEC-13 DEC-12 % Change
Net Sales 108938.40 112003.40 -2.74%
PAT 6811.50 5012.90 35.88%
EPS 22.55 17.35 29.96%
EBITDA 14717.40 10798.90 36.29%
The company’s net profit jumps to Rs. 6811.50 million against Rs. 5012.90 million in the corresponding quarter
ending of previous year, an increase of 35.88%. Revenue for the quarter rose 2.74% to Rs. 108938.40 million
from Rs.112003.40 million, when compared with the prior year period. Reported earnings per share of the
company stood at Rs.22.55 a share during the quarter, registering 29.96% increase over previous year period.
Profit before interest, depreciation and tax is Rs.14717.40 millions as against Rs.10798.90 millions in the
corresponding period of the previous year. Sales remained under stress during the period, in both domestic and
export markets.
Expenditure :
Break up of Expenditure
Rs. Millions
Q3 FY14 Q3 FY13
Cost of Material consumed 70203.60 83760.40
Depreciation 5413.80 3583.30
Employees Benefit Expenses 2996.60 2310.90
Other Expenditure 14380.10 12938.30
Purchase of Traded Goods 6176.20 5720.40
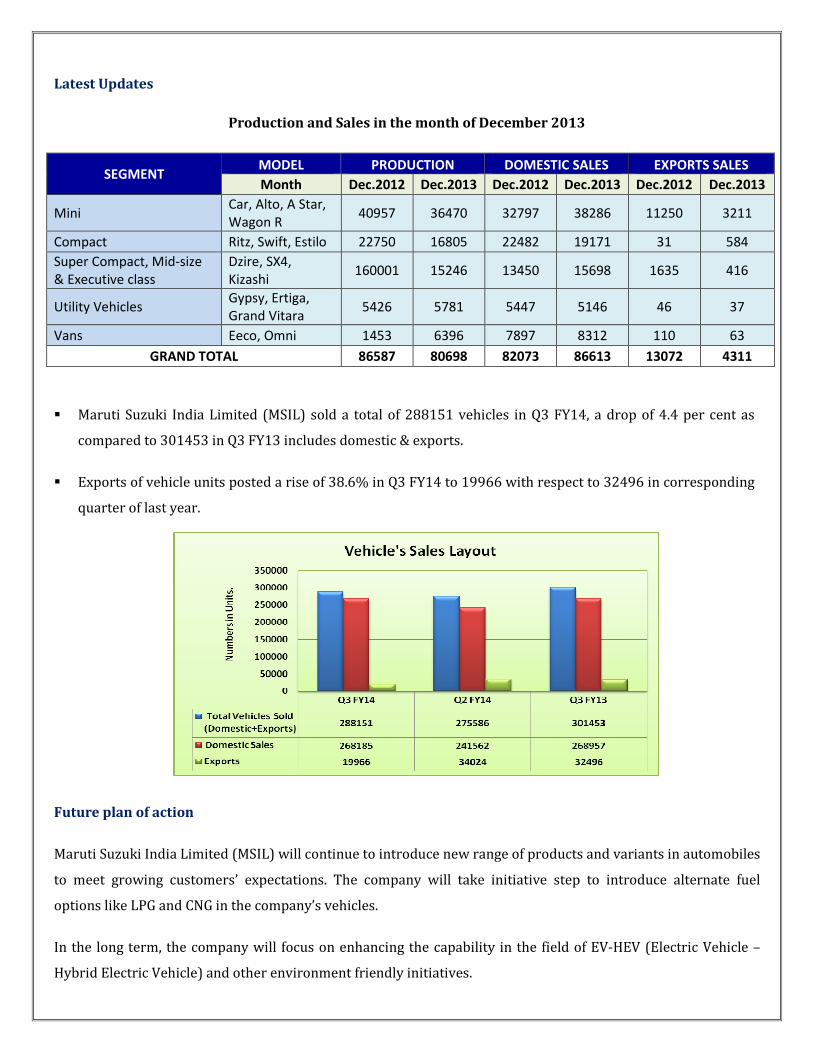
Latest Updates
Production and Sales in the month of December 2013
SEGMENT MODEL PRODUCTION DOMESTIC SALES EXPORTS SALES
Month Dec.2012 Dec.2013 Dec.2012 Dec.2013 Dec.2012 Dec.2013
Mini Car, Alto, A Star,
Wagon R 40957 36470 32797 38286 11250 3211
Compact Ritz, Swift, Estilo 22750 16805 22482 19171 31 584
Super Compact, Mid-size
& Executive class
Dzire, SX4,
Kizashi 160001 15246 13450 15698 1635 416
Utility Vehicles Gypsy, Ertiga,
Grand Vitara 5426 5781 5447 5146 46 37
Vans Eeco, Omni 1453 6396 7897 8312 110 63
GRAND TOTAL 86587 80698 82073 86613 13072 4311
� Maruti Suzuki India Limited (MSIL) sold a total of 288151 vehicles in Q3 FY14, a drop of 4.4 per cent as
compared to 301453 in Q3 FY13 includes domestic & exports.
� Exports of vehicle units posted a rise of 38.6% in Q3 FY14 to 19966 with respect to 32496 in corresponding
quarter of last year.
Future plan of action
Maruti Suzuki India Limited (MSIL) will continue to introduce new range of products and variants in automobiles
to meet growing customers’ expectations. The company will take initiative step to introduce alternate fuel
options like LPG and CNG in the company’s vehicles.
In the long term, the company will focus on enhancing the capability in the field of EV-HEV (Electric Vehicle –
Hybrid Electric Vehicle) and other environment friendly initiatives.
Company Profile
Maruti Suzuki India Limited (MSIL, formerly known as Maruti Udyog Limited) is a subsidiary of Suzuki Motor
Corporation, Japan. Maruti Suzuki has been the leader of the Indian car market for over two and a half decades.
The company has two manufacturing facilities located at Gurgaon and Manesar, south of New Delhi, India. Both
the facilities have a combined capability to produce over a 1.5 million (1,500,000) vehicles annually. The
company plans to expand its manufacturing capacity to 1.75 million by 2013. The list of other services offered by
Maruti Suzuki includes Finance, Insurance, Maruti Genuine Accessories, Maruti Genuine Parts, Maruti Driving
School and Autocard.
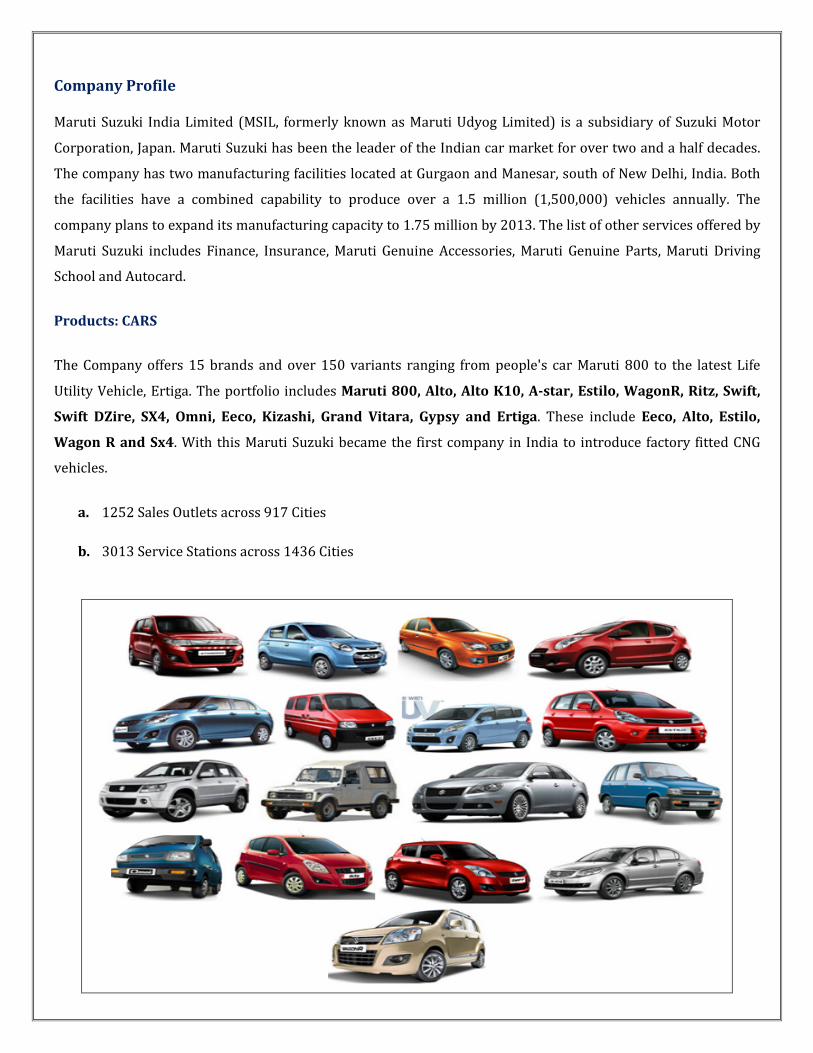
Products: CARS
The Company offers 15 brands and over 150 variants ranging from people's car Maruti 800 to the latest Life
Utility Vehicle, Ertiga. The portfolio includes Maruti 800, Alto, Alto K10, A-star, Estilo, WagonR, Ritz, Swift,
Swift DZire, SX4, Omni, Eeco, Kizashi, Grand Vitara, Gypsy and Ertiga. These include Eeco, Alto, Estilo,
Wagon R and Sx4. With this Maruti Suzuki became the first company in India to introduce factory fitted CNG
vehicles.
a. 1252 Sales Outlets across 917 Cities
b. 3013 Service Stations across 1436 Cities
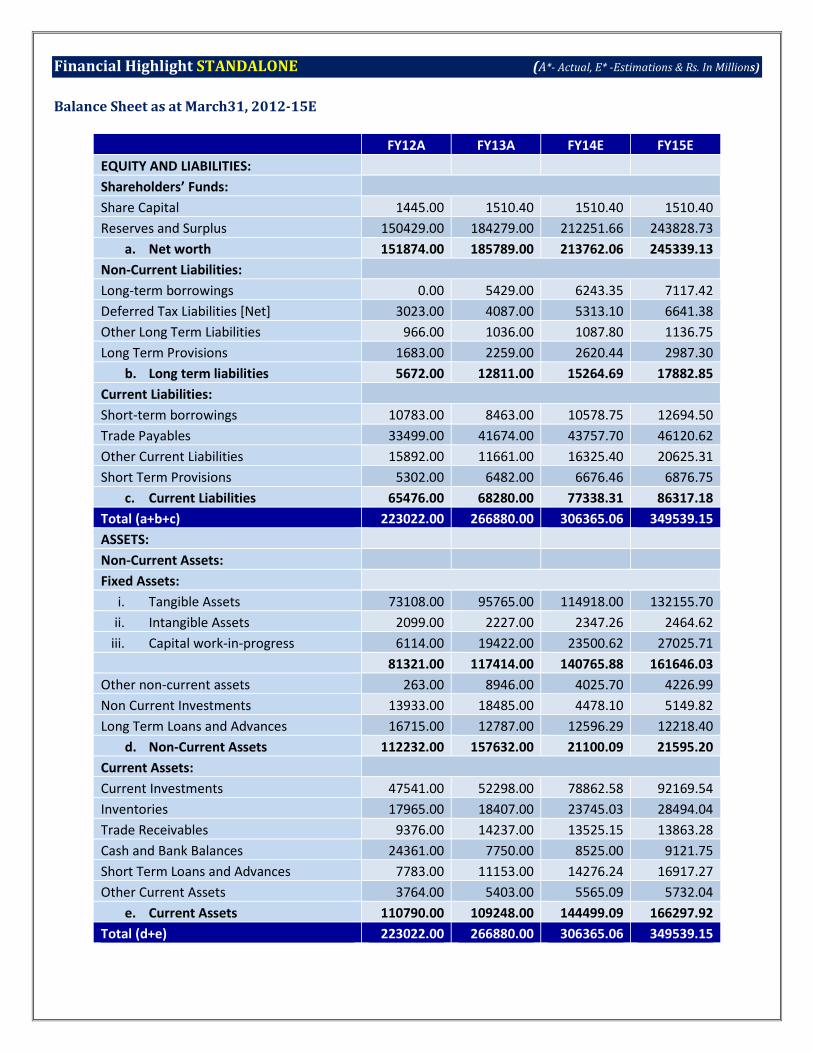
Financial Highlight STANDALONE (A*- Actual, E* -Estimations & Rs. In Millions)
Balance Sheet as at March31, 2012-15E
FY12A FY13A FY14E FY15E
EQUITY AND LIABILITIES:
Shareholders’ Funds:
Share Capital 1445.00 1510.40 1510.40 1510.40
Reserves and Surplus 150429.00 184279.00 212251.66 243828.73
a. Net worth 151874.00 185789.00 213762.06 245339.13
Non-Current Liabilities:
Long-term borrowings 0.00 5429.00 6243.35 7117.42
Deferred Tax Liabilities [Net] 3023.00 4087.00 5313.10 6641.38
Other Long Term Liabilities 966.00 1036.00 1087.80 1136.75
Long Term Provisions 1683.00 2259.00 2620.44 2987.30
b. Long term liabilities 5672.00 12811.00 15264.69 17882.85
Current Liabilities:
Short-term borrowings 10783.00 8463.00 10578.75 12694.50
Trade Payables 33499.00 41674.00 43757.70 46120.62
Other Current Liabilities 15892.00 11661.00 16325.40 20625.31
Short Term Provisions 5302.00 6482.00 6676.46 6876.75
c. Current Liabilities 65476.00 68280.00 77338.31 86317.18
Total (a+b+c) 223022.00 266880.00 306365.06 349539.15
ASSETS:
Non-Current Assets:
Fixed Assets:
i. Tangible Assets 73108.00 95765.00 114918.00 132155.70
ii. Intangible Assets 2099.00 2227.00 2347.26 2464.62
iii. Capital work-in-progress 6114.00 19422.00 23500.62 27025.71
81321.00 117414.00 140765.88 161646.03
Other non-current assets 263.00 8946.00 4025.70 4226.99
Non Current Investments 13933.00 18485.00 4478.10 5149.82
Long Term Loans and Advances 16715.00 12787.00 12596.29 12218.40
d. Non-Current Assets 112232.00 157632.00 21100.09 21595.20
Current Assets:
Current Investments 47541.00 52298.00 78862.58 92169.54
Inventories 17965.00 18407.00 23745.03 28494.04
Trade Receivables 9376.00 14237.00 13525.15 13863.28
Cash and Bank Balances 24361.00 7750.00 8525.00 9121.75
Short Term Loans and Advances 7783.00 11153.00 14276.24 16917.27
Other Current Assets 3764.00 5403.00 5565.09 5732.04
e. Current Assets 110790.00 109248.00 144499.09 166297.92
Total (d+e) 223022.00 266880.00 306365.06 349539.15
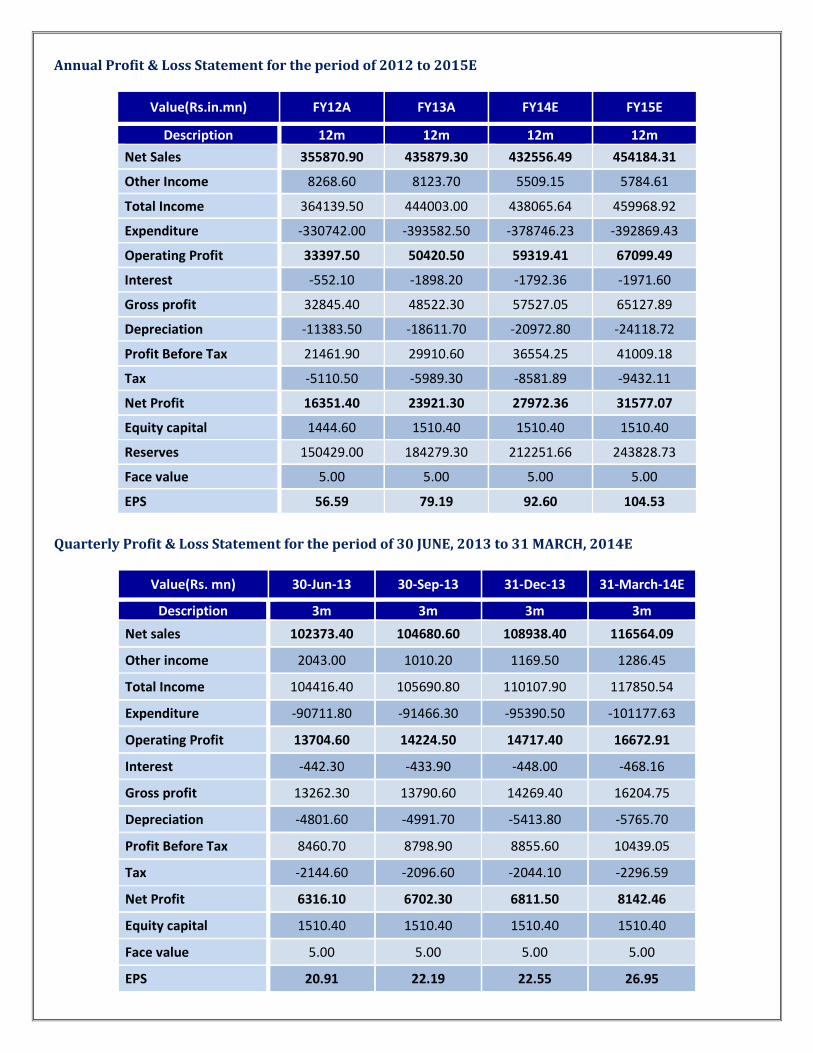
Annual Profit & Loss Statement for the period of 2012 to 2015E
Value(Rs.in.mn) FY12A FY13A FY14E FY15E
Description 12m 12m 12m 12m
Net Sales 355870.90 435879.30 432556.49 454184.31
Other Income 8268.60 8123.70 5509.15 5784.61
Total Income 364139.50 444003.00 438065.64 459968.92
Expenditure -330742.00 -393582.50 -378746.23 -392869.43
Operating Profit 33397.50 50420.50 59319.41 67099.49
Interest -552.10 -1898.20 -1792.36 -1971.60
Gross profit 32845.40 48522.30 57527.05 65127.89
Depreciation -11383.50 -18611.70 -20972.80 -24118.72
Profit Before Tax 21461.90 29910.60 36554.25 41009.18
Tax -5110.50 -5989.30 -8581.89 -9432.11
Net Profit 16351.40 23921.30 27972.36 31577.07
Equity capital 1444.60 1510.40 1510.40 1510.40
Reserves 150429.00 184279.30 212251.66 243828.73
Face value 5.00 5.00 5.00 5.00
EPS 56.59 79.19 92.60 104.53
Quarterly Profit & Loss Statement for the period of 30 JUNE, 2013 to 31 MARCH, 2014E
Value(Rs. mn) 30-Jun-13 30-Sep-13 31-Dec-13 31-March-14E
Description 3m 3m 3m 3m
Net sales 102373.40 104680.60 108938.40 116564.09
Other income 2043.00 1010.20 1169.50 1286.45
Total Income 104416.40 105690.80 110107.90 117850.54
Expenditure -90711.80 -91466.30 -95390.50 -101177.63
Operating Profit 13704.60 14224.50 14717.40 16672.91
Interest -442.30 -433.90 -448.00 -468.16
Gross profit 13262.30 13790.60 14269.40 16204.75
Depreciation -4801.60 -4991.70 -5413.80 -5765.70
Profit Before Tax 8460.70 8798.90 8855.60 10439.05
Tax -2144.60 -2096.60 -2044.10 -2296.59
Net Profit 6316.10 6702.30 6811.50 8142.46
Equity capital 1510.40 1510.40 1510.40 1510.40
Face value 5.00 5.00 5.00 5.00
EPS 20.91 22.19 22.55 26.95

Ratio Analysis
Particulars FY12A FY13A FY14E FY15E
EPS (Rs.) 56.59 79.19 92.60 104.53
EBITDA Margin (%) 9.38% 11.57% 13.71% 14.77%
PBT Margin (%) 6.03% 6.86% 8.45% 9.03%
PAT Margin (%) 4.59% 5.49% 6.47% 6.95%
P/E Ratio (x) 27.25 19.47 16.65 14.75
ROE (%) 10.77% 12.88% 13.09% 12.87%
ROCE (%) 27.53% 34.57% 34.82% 34.40%
EV/EBITDA (x) 13.34 9.24 7.85 6.94
Book Value (Rs.) 525.66 615.03 707.63 812.17
P/BV 2.93 2.51 2.18 1.90
Charts
Outlook and Conclusion
� At the current market price of Rs.1542.00, the stock P/E ratio is at 16.65 x FY14E and 14.75 x FY15E
respectively.
� Earning per share (EPS) of the company for the earnings for FY14E and FY15E is seen at Rs.92.60 and
Rs.104.53 respectively.
� Net Sales and Operating Profit of the company are expected to grow at a CAGR of 8% and 24% over 2012 to
2015E respectively.
� On the basis of EV/EBITDA, the stock trades at 7.85 x for FY14E and 6.94 x for FY15E.
� Price to Book Value of the stock is expected to be at 2.18 x and 1.90 x respectively for FY14E and FY15E.
� We recommend ‘HOLD’ in this particular scrip with a target price of Rs.1681.00 for Medium to Long term
investment.
Industry Overview
India represents one of the world’s largest automobile industries. Easy availability of finance and rising income
levels are encouraging the middle class population to upgrade their two wheelers to a car. Besides, the growing
organised used car market has also been a positive growth factor in the used car market of the country. Driven by
the above factors, the used cars market is anticipated to grow at a compound annual growth rate (CAGR) of 16
per cent during 2013–17, highlighted the RNCOS report titled, ‘Booming Used Car Market in India Outlook 2017’.
India is quietly becoming a production hub of high-end vehicles meant for export to China. The US-based
motorbike maker Harley Davidson, Austrian motorcycle manufacturer KTM and Mahindra & Mahindra have also
preferred to set up manufacturing facilities in India than in the relatively low-cost China and export the output.
Furthermore, India is set to become Mercedes Benz’s fastest-growing market worldwide ahead of China, the US
and Europe, according to internal projections. We expect growth rates to be the fastest in India globally, and
expect sales to move up by 10 per cent over the next five years or so, as per Mr Matthias Luhrs, Vice-President
(Global Sales), Mercedes Benz Cars.
Key Statistics
The passenger vehicles production in India touched 3.23 million units in 2012–13 and is expected to reach 10
million units by 2020–21. The industry is estimated to grow at a CAGR of 13 per cent during 2012–2021. In
addition, the industry recorded exports worth US$ 9.3 billion in 2012–13 and is projected to touch US$ 30 billion
by 2020–21, according to data from Automotive Component Manufacturers’ Association (ACMA).
The cumulative foreign direct investment (FDI) inflows into the Indian automobile industry during April 2000 to
October 2013 was recorded at US$ 9,079 million, amounting to 4 per cent of the total FDI inflows (in terms of
US$), as per data published by Department of Industrial Policy and Promotion (DIPP), Ministry of Commerce,
Government of India.
India is also expected to emerge as a centre for producing compact superbikes as Indian customers progress to
the next level of biking. Several global and Indian bike makers plan to utilise India's mass-production base of 16
million two-wheelers to roll out sports bikes in the 250 cc capacity.
More so, the demand for premium sports utility vehicles (SUVs) will continue to grow. The market size of
premium SUVs was estimated to be around 25,000 units annually in India.
Major Developments & Investments
• Tata Motors Ltd plans to invest about £30 million (US$ 49.17 million) in the National Automotive
Innovation Campus (NAIC) for research and development (R&D). The investment would be made through
its subsidiary Tata Motors European Technical Centre (TMETC) at the University of Warwick campus, UK.
• Volvo India Pvt Ltd plans to set up truck and bus manufacturing facility in Malur, Karnataka, with an
investment of Rs 974 crore (US$ 158.32 million). The facility is expected to give employment to about
2,125 people.
• Manufacturing companies in Japan continue to view India as the top destination for investments—over
China, Thailand, Vietnam, Brazil and Indonesia—in the next three years, according to Mr Masanori
Nakano, Consul General of Japan in Chennai.
• Tata Motors-owned Jaguar Land Rover (JLR) has entered into an agreement with the state of Rio de
Janeiro to build a manufacturing plant in Brazil with an investment of Rs 4,626 crore (US$ 751.95
million).
• JBM Auto has formed a joint venture (JV) with Italian bus maker BredaMenarinibus to manufacture
luxury buses in India. The Indo–Italian venture plans to set up a plant at Kosi, near Faridabad in Haryana,
and produce 2,000 buses every year initially, at an investment of Rs 500 crore (US$ 81.27 million).
• Mahindra & Mahindra (M&M) plans to develop the world's first hybrid technology that can be deployed
in vehicles with manual transmission and enhance fuel efficiency by almost 20 per cent.
• Amtek Auto has signed an agreement to buy Germany-based Kuepper Group of companies for about
€200 million (US$ 272.73 million) in its second big European acquisition in 2013.
• Honda Cars India will use the Ennore Port to export cars to South Africa. The infrastructure for car
exports at Ennore Port is attractive and cost effective.
Government Initiatives
The Government of India plans to introduce fuel-efficiency ratings for automobiles to encourage sale of cars that
consume less petrol or diesel, as per Mr Veerappa Moily, Union Minister for Petroleum and Natural Gas,
Government of India.
The Union Budget 2013–14 added some incentives to the industry. The analysis by Deloitte on the Union Budget
highlighted the following points:
• The period of concession available for specified part of electric and hybrid vehicles till April 2013 has
been extended up to March 31, 2015.
• The basic customs duty (BCD) on imported luxury goods such as high-end motor vehicles, motor cycles,
yachts and similar vessels was increased. The duty was raised from 75 per cent to 100 per cent on
cars/motor vehicles (irrespective of engine capacity) with CIF value more than US$ 40,000; from 60 per
cent to 75 per cent on motorcycles with engine capacity of 800 cc or more and on yachts and similar
vessels from 10 per cent to 25 per cent.
• In addition, an increase in excise duty from 27 to 30 per cent has been allowed for SUVs with engine
capacity exceeding 1,500 cc, while excise duty was decreased from 80 to 72 per cent, in case of SUVs
registered solely to be used for taxi purposes.
• An exemption from BCD will be provided to lithium ion automotive battery for manufacture of lithium
ion battery packs for supply to manufacturers of hybrid and electric vehicles.
• The excise duty on chassis of diesel motor vehicles for transport of goods reduced from 14 per cent to 13
per cent.
The Government of India allows 100 per cent FDI in the automotive industry through automatic route.
Road Ahead
The vision of Automotive Mission Plan (AMP) 2006–2016 expects India, “to emerge as the destination of choice
in the world for design and manufacture of automobiles and auto components with output reaching a level of US$
145 billion; accounting for more than 10 per cent of the gross domestic product (GDP) and providing additional
employment to 25 million people by 2016.”
With special focus on exports of small cars, multi-utility vehicles (MUVs), two and three wheelers and auto
components; the automotive sector’s contribution to the GDP is expected to double reaching a turnover worth
US$ 145 billion in 2016, according to the AMP 2006–2016.
Disclaimer:
This document prepared by our research analysts does not constitute an offer or solicitation for the purchase or sale
of any financial instrument or as an official confirmation of any transaction. The information contained herein is
from publicly available data or other sources believed to be reliable but do not represent that it is accurate or
complete and it should not be relied on as such. Firstcall India Equity Advisors Pvt. Ltd. or any of it’s affiliates shall
not be in any way responsible for any loss or damage that may arise to any person from any inadvertent error in the
information contained in this report. This document is provide for assistance only and is not intended to be and must
not alone be taken as the basis for an investment decision.
Firstcall India Equity Research: Email – [email protected]
C.V.S.L.Kameswari Pharma
U. Janaki Rao Capital Goods
Ashish.Kushwaha IT, Consumer Durable & Banking
Anil Kumar Diversified
Suhani Adilabadkar Diversified
M. Vinayak Rao Diversified
Firstcall India also provides
Firstcall India Equity Advisors Pvt.Ltd focuses on, IPO’s, QIP’s, F.P.O’s,Takeover
Offers, Offer for Sale and Buy Back Offerings.
Corporate Finance Offerings include Foreign Currency Loan Syndications,
Placement of Equity / Debt with multilateral organizations, Short Term Funds
Management Debt & Equity, Working Capital Limits, Equity & Debt
Syndications and Structured Deals.
Corporate Advisory Offerings include Mergers & Acquisitions(domestic and
cross-border), divestitures, spin-offs, valuation of business, corporate
restructuring-Capital and Debt, Turnkey Corporate Revival – Planning &
Execution, Project Financing, Venture capital, Private Equity and Financial
Joint Ventures
Firstcall India also provides Financial Advisory services with respect to raising
of capital through FCCBs, GDRs, ADRs and listing of the same on International
Stock Exchanges namely AIMs, Luxembourg, Singapore Stock Exchanges and
other international stock exchanges.
For Further Details Contact:
3rd Floor,Sankalp,The Bureau,Dr.R.C.Marg,Chembur,Mumbai 400 071
Tel. : 022-2527 2510/2527 6077/25276089 Telefax : 022-25276089
E-mail: [email protected]
www.firstcallindiaequity.com