martanto wijaya 200508 phd - Laboratory for Drug...
185
MICROINJECTION INTO SKIN USING MICRONEEDLES A Thesis Presented to The Academic Faculty by Wijaya Martanto In Partial Fulfillment of the Requirements for the Degree Doctor of Philosophy in Chemical Engineering Georgia Institute of Technology August 2005 Copyright © 2005 by Wijaya Martanto
Transcript of martanto wijaya 200508 phd - Laboratory for Drug...
MICROINJECTION INTO SKIN USING MICRONEEDLES
A Thesis
Presented to The Academic Faculty
by
Wijaya Martanto
In Partial Fulfillment of the Requirements for the Degree
Doctor of Philosophy in Chemical Engineering
Georgia Institute of Technology August 2005
Copyright © 2005 by Wijaya Martanto

MICROINJECTION INTO SKIN USING MICRONEEDLES
Approved by:
Dr. Mark R. Prausnitz, Chairman School of Biomolecular & Chemical Engineering Georgia Institute of Technology
Dr. Athanassios Sambanis School of Biomolecular & Chemical EngineeringGeorgia Institute of Technology
Dr. Mark G. Allen School of Electrical & Computer Engineering Georgia Institute of Technology
Dr. Marc K. Smith School of Mechanical Engineering Georgia Institute of Technology
Dr. Ajay K. Banga Department of Pharmaceutical Sciences Mercer University
Date Approved: 31 May 2005

To my parents and brothers,
for their love, trust and motivations

iv
ACKNOWLEDGEMENT I would like to thank my advisor, my thesis committee members, my research
colleagues and my family that made this thesis possible. I would like to thank my
advisor, Mark Prausnitz for his invaluable guidance, support and patience during the
course and completion of my study. I would also like to thank all my thesis committee
members for their willingness to serve as my thesis committee and for their intellectual
support. Specifically, I would like to thank Marc Smith for help with numerical analysis
and Mark Allen who allowed me to use his microfabrication lab.
I would like to thank my research colleagues for their insights and help in the past
few years. Specifically, I would like to thank Harvinder Gill for his thoughtful
suggestions and countless hours of help in experimental designs. I would like to thank
Shawn Davis for his help with excimer laser and hollow microneedles in general. I would
like to thank Ping Wang for help with glass microneedles; Jung-Hwan Park who
introduced me to polymer microneedles and LG Chemical; Daniel Hallow and Vladimir
Zarnitsyn for their invaluable advice. I would like to thank Suo Jin for help with
numerical simulation. I would like to thank my undergraduate collaborators: Stephen
Baisch, Elizabeth Costner, Nicholas Holiday, Rachna Kamath, Osama Kashlan, Jason
Moore, Jessica O’Neal and Jenny Wang for their invaluable laboratory help. I would also
like to thank Tracey Couse for her help with histology and Cherry Forkey for her help
with animal studies. I would like to thank Yoonsu Choi for help with side-opening
microneedle fabrication. I would like to thank Bradley Parker, Dennis Brown and Jeffrey

v
Andrews for help with machine shop work. I would like to thank Richard Shafer for help
with laser work.
I would also like to thank Donna Bondy for keeping up with my countless purchase
orders. I would like to thank Susan Brooks of Emory University Body Donor Program for
human cadaver skins supply. I would like to thank Mr. Holifield for pig skin supply. I
would also like to thank Ms. Martha Saghini and Ms. Shirley Dixon of Georgia Tech
Library for assistance with interlibrary documents. My thanks also go to my fellow lab
members: Samantha Andrews, John Bennett, Prerona Chakravarty, Harvinder Gill, Jyoti
Gupta, Pavel Kamaev, Daniel Hallow, Jason Jiang, Yeuchun Kim, Jeong-Woo Lee, Jung-
Hwan Park, Robyn Schlicher, Sean Sullivan and Vladimir Zarnitsyn. I would also like to
thank all the funding agencies: NIH, NSF and ADA.
Last but not least, I would like to thank my parents, my brothers and my sister-in-
laws for the trust, encouragement and constant motivation they give me in pursuing and
completing my Ph.D.

vi
TABLE OF CONTENTS
ACKNOWLEDGEMENT ................................................................................................. iv
LIST OF TABLES............................................................................................................. xi
LIST OF FIGURES .......................................................................................................... xii
LIST OF SYMBOLS and ABBREVIATIONS ............................................................... xxi
SUMMARY.................................................................................................................... xxv
1 INTRODUCTION ...................................................................................................... 1
2 BACKGROUND ........................................................................................................ 3
2.1 Transdermal Drug Delivery ................................................................................ 3
2.1.1 Skin Anatomy ............................................................................................. 4
2.2 Diabetes and Insulin Delivery............................................................................. 6
2.3 Microfabrication ................................................................................................. 9
2.3.1 Laser Micromachining .............................................................................. 10
2.3.2 Polymer and Micromolding Process......................................................... 11
2.4 Evolution of Microneedles................................................................................ 11
2.4.1 Solid Microneedles ................................................................................... 12
2.4.1.1 Silicon Microprobes.............................................................................. 12
2.4.1.2 Silicon Microneedles ............................................................................ 13
2.4.1.3 Polymer Microneedles .......................................................................... 15
2.4.1.3.1 Beveled Microneedles..................................................................... 15
2.4.1.3.2 Beveled Microneedles with Notch.................................................. 17
2.4.1.3.3 Tapered Polymer Microneedles ...................................................... 18

vii
2.4.1.4 Metal Microneedles .............................................................................. 19
2.4.2 Hollow Microneedles................................................................................ 21
2.4.2.1 Silicon Microtubes................................................................................ 21
2.4.2.2 Silicon Microneedles ............................................................................ 22
2.4.2.3 Polymer Microneedles .......................................................................... 24
2.4.2.4 Metal Microtubes.................................................................................. 25
2.4.2.5 Metal Microneedles .............................................................................. 26
2.4.3 Integrated Microneedle Devices ............................................................... 31
2.5 Fluid Flow through Microneedles..................................................................... 35
3 METHODS ............................................................................................................... 38
3.1 Fluid Dynamics of Microneedles...................................................................... 38
3.1.1 Experimental Methods .............................................................................. 38
3.1.2 Numerical Simulation of Fluid Flow in a Microneedle ............................ 41
3.2 Transdermal Delivery of Insulin....................................................................... 44
3.2.1 Solid Microneedles ................................................................................... 44
3.2.1.1 Microneedle Fabrication ....................................................................... 44
3.2.1.2 Diabetic Animal Model ........................................................................ 45
3.2.1.3 Insulin Delivery Experiments ............................................................... 46
3.2.1.4 Statistical Analysis................................................................................ 48
3.2.2 Hollow Microneedles................................................................................ 49
3.2.2.1 Microneedle Fabrication ....................................................................... 49
3.2.2.2 Insulin Delivery Experiments ............................................................... 50
3.3 Microinfusion Using Hollow Microneedles ..................................................... 51

viii
3.3.1 Glass Microneedle Fabrication ................................................................. 51
3.3.2 Skin Preparation........................................................................................ 52
3.3.3 Infusion Experiments ................................................................................ 53
3.3.4 Histological and Microscopic Image Analysis ......................................... 56
3.3.5 Statistical Analysis.................................................................................... 57
4 RESULTS ................................................................................................................. 58
4.1 Fluid Dynamics of Microneedles...................................................................... 58
4.1.1 Introduction............................................................................................... 58
4.1.2 Measurement of Pressure Drop versus Flow Rate.................................... 60
4.1.3 Comparison of Experimental Data to Theoretical Predictions ................. 63
4.1.4 Numerical Simulation of Fluid Flow in a Microneedle ............................ 64
4.1.4.1 Effect of Microneedle Length L ........................................................... 65
4.1.4.2 Effect of Cone Half-Angle θc and Tip Angle θt ................................... 67
4.1.4.3 Pressure Profile along Microneedle Axis ............................................. 71
4.1.4.4 Statistical Fit of Simulation Results To Predict Pressure Drop ............ 75
4.1.5 Discussion................................................................................................. 78
4.1.6 Conclusions............................................................................................... 80
4.2 Solid Microneedles for Transdermal Insulin Delivery ..................................... 81
4.2.1 Introduction............................................................................................... 82
4.2.2 Fabrication and Characterization of Microneedles ................................... 83
4.2.3 Reduced Blood Glucose Levels ................................................................ 86
4.2.4 Increased Plasma Insulin Concentration................................................... 91
4.2.5 Implications for Transdermal Drug Delivery ........................................... 93

ix
4.2.6 Conclusions............................................................................................... 94
4.3 Hollow Microneedles for Transdermal Insulin Delivery.................................. 95
4.3.1 Introduction............................................................................................... 96
4.3.2 Microneedle Design and Fabrication ........................................................ 96
4.3.2.1 Microneedle Design.............................................................................. 96
4.3.2.2 Microneedle Fabrication ....................................................................... 97
4.3.3 Insulin Delivery ........................................................................................ 98
4.3.4 Interpretation of Insulin Delivery Results............................................... 100
4.3.5 Conclusions............................................................................................. 101
4.4 Microinfusion Using Hollow Microneedles ................................................... 102
4.4.1 Introduction............................................................................................. 103
4.4.2 Fabrication and Characterization of Microneedles ................................. 106
4.4.3 Effect of Insertion and Retraction........................................................... 110
4.4.4 Effect of Infusion Pressure...................................................................... 113
4.4.5 Effect of Microneedle Tip Bevel ............................................................ 114
4.4.6 Effect of Microneedle Tip Opening Size ................................................ 115
4.4.7 Effect of Hyaluronidase .......................................................................... 116
4.4.8 Microinfusion Over Time ....................................................................... 118
4.4.9 Implications for Transdermal Drug Delivery ......................................... 120
4.4.10 Conclusions............................................................................................. 122
5 CONCLUSIONS..................................................................................................... 124
6 RECOMMENDATIONS........................................................................................ 128
APPENDIX A: Hollow Side-Opening Microneedles..................................................... 131

x
A.1 Introduction..................................................................................................... 131
A.2 Materials and Methods.................................................................................... 133
A.2.1 Micromolding Process ............................................................................ 133
A.2.2 Microneedle Fabrication ......................................................................... 137
A.3 Results and Discussion ................................................................................... 139
A.4 Conclusions..................................................................................................... 142
REFERENCES ............................................................................................................... 143
VITA............................................................................................................................... 158

xi
LIST OF TABLES
Table 1. Parameters for Equation 4.1.4, which correlates the dimensionless pressure drop with the Reynolds number as a function of the tip angle θt.................................................................................................................... 77
xii
LIST OF FIGURES
Figure 2.1 Skin anatomy .............................................................................................. 4 Figure 2.2 Solid silicon microprobes used to deliver genes to plant, nematodes and
mammalian cells (Hashmi, Ling, et al. 1995)........................................... 13 Figure 2.3 Solid silicon microneedles used for transdermal delivery and capable to
increase human epidermis permeability to calcein, insulin and bovine serum albumin (Henry, McAllister, et al. 1998)....................................... 14
Figure 2.4 Microenhancer (MEA) array for skin microabrasion during naked plasmid
DNA delivery into mice skin (Mikszta, Alarcon, et al. 2002).................. 15 Figure 2.5 Beveled solid biodegradable polymer microneedles (Park 2004). ........... 17 Figure 2.6 Beveled solid polymer microneedles with notch (Park 2004). ................. 18 Figure 2.7 Tapered solid polymer microneedles fabricated using lens technique (Park,
Yoon, et al. 2004)...................................................................................... 19 Figure 2.8 Metal microprojection arrays etched from a titanium sheet shown used to
deliver (left) protein antigen in animal (Matriano, Cormier, et al. 2002) and (right) synthetic hormone in human subjects (Gopalakrishnan, Hwang, et al. 2004). ............................................................................................... 20
Figure 2.9 Hollow silicon microtubes fabricated using deep reactive ion etching
(McAllister 2000)...................................................................................... 22 Figure 2.10 Hollow silicon microneedles fabricated using lithography and etching
techniques used to deliver dye into chicken thigh (Stoeber and Liepmann 2000). ........................................................................................................ 23
Figure 2.11 Hollow beveled silicon microneedles used to withdraw blood by capillary
action in human skin (Gardeniers, Berenschot, et al. 2002, Gardeniers, Luttge, et al. 2003). ................................................................................... 24
Figure 2.12 Hollow polymer microneedles fabricated using inclined x-ray exposure
used to extract blood in human skin (Moon, Sang-Jun, et al. 2003)......... 25 Figure 2.13 Hollow metal microtubes fabricated using photolithography or deep
reactive ion etching (McAllister 2000). .................................................... 26

xiii
Figure 2.14 In-plane hollow metal microneedle: (left) multiple needle design (Brazzle, Papautsky, et al. 1998) and (right) single needle design with multiple ports (Brazzle, Mohanty, et al. 1999). ............................................................... 28
Figure 2.15 Hollow metal microneedles fabricated using combination of lithography,
reactive ion etching and electroplating and shown to repeatedly insert and removed from human epidermis (McAllister 2000). ................................ 29
Figure 2.16 Array of tapered hollow metal microneedles shown next to the tip of a 27
gauge hypodermic needle (Davis 2003). .................................................. 30 Figure 2.17 Silver coated silicon spikes used as biopotential electrodes (Griss,
Enoksson, et al. 2001)............................................................................... 31 Figure 2.18 Prototype of microneedle-based glucose sensor which incorporates array
of 8 hollow 200-μm tall silicon microneedles with glucose sensor located in the Pyrex® flow channel underneath (Zimmermann, Fienbork, et al. 2003). ........................................................................................................ 33
Figure 2.19 Front and backside of microneedle array used for interstitial fluid
extraction (Mukerjee, Collins, et al. 2004). .............................................. 34 Figure 2.20 Integrated microfluidic device consists of micropump, microdialysis
microneedles, microvalves and glucose sensor (Zahn, Deshmukh, et al. 2001). ........................................................................................................ 35
Figure 3.1 Scanning electron micrographs of hollow microneedles. (A) An array of
microneedles is shown next to the tip of a 30-gauge hypodermic needle. (B) A single microneedle is shown from a side view. (C) The polymer mold used to make that needle is shown from above. Needle and mold dimensions are Ln = 500 μm, Di = 220 μm, Dt = 56 μm, and θc = 9˚........ 39
Figure 3.2 Schematic of experimental set up for fluid flow through microneedles... 41 Figure 3.3 (A) A sketch of the idealized microneedle geometry with relevant
dimensions and angles: cone half angle θc, tip angle θt, tip diameter Dt, inlet diameter Di, and needle length Ln. The flow enters the microneedle from the left originating from a large plenum chamber held at a pressure of p0. The flow exits at the tip to the local atmosphere held at a constant pressure of patm. (B) Microneedle wall profiles for a cone half-angle θc = 20º, a dimensionless length L = 10, and four tip angles θt = 0º, 20º, 36.05º, and 60º. The tip angle θt = 36.05º is the transition angle θp marking the transition from a parabolic profile to an elliptic profile............................ 42
Figure 3.4 (A) Schematic of experimental set up for microinfusion using
microneedles. A glass microneedle is held in place by a rotary-threaded

xiv
device. This assembly is held by a stainless steel adapter attached to a Z-stage. The end of the microneedle is connected to a metal tubing line using a flexible tubing linker. The metal tubing line is connected to a glass syringe reservoir on the other end which is connected to a high-pressure CO2 tank. (B) Stainless steel skin specimen board is placed underneath the microneedle tip (no skin is shown). .......................................................... 54
Figure 4.1 Pressure drop required for flow of water through representative
microneedles of different geometries as a function of flow rate. Three different needle geometries each with the same cone half-angle, θc = 15˚, but with different tip diameter (Dt), inlet diameter (Di), and length (Ln) are compared: (■)Dt = 42 μm, Di = 162 μm, Ln = 225 μm, (▲)Dt = 50 μm, Di = 322 μm, Ln = 500 μm, (●)Dt = 68 μm, Di = 342 μm, Ln = 500 μm........ 61
Figure 4.2 The dimensionless pressure drop versus Reynolds number for flow in
conical microneedles. The circles mark all experimental data points. The two solid lines are the results from numerical simulations for straight-sided cones with dimensionless length L = 10 and cone half-angles θc = 5º and 20º. ..................................................................................................... 62
Figure 4.3 The effect of microneedle length on dimensionless pressure drop versus
Reynolds number for a circular cylinder with θc = 0º............................... 66 Figure 4.4 The effect of microneedle length on dimensionless pressure drop versus
Reynolds number for a tapered, straight-sided cone with θc = 5º having dimensionless lengths L = 2.5, 5, 10, and 20. The three curves for dimensionless length L ≥ 5 are almost indistinguishable.......................... 67
Figure 4.5 The effect of microneedle taper on dimensionless pressure drop versus
Reynolds number for a straight-sided cone (θc = θt) with cone half-angles θc = 0º, 5º, 10º, 20º, and 30º and dimensionless length L = 10. ................ 68
Figure 4.6 The effect of microneedle taper on dimensionless pressure drop versus
Reynolds number for a microneedle with a curved profile with cone half-angles θc = 5º, 10º, 20º and 30º, a fixed tip angle θt = 20º and dimensionless length L = 10. The curves for the three larger cone half-angles are almost indistinguishable. ......................................................... 69
Figure 4.7 The effect of microneedle taper on dimensionless pressure drop versus
Reynolds number for a microneedle with a curved profile with tip angles θt = 0º, 5º, 10º, 20º, 30º, 40º, 50º, and 60º, a fixed cone half-angle θc = 20 and a dimensionless length L = 10............................................................ 70
Figure 4.8 The scaled pressure P* (see text Equation 4.1.2) versus the dimensionless
distance x along the axis for flow in microneedles showing the effect of tip angle θt = 0º, 20º, 40º and 60º. The dimensionless pressure drops for these

xv
microneedles are ΔP = 1.757, 1.288, 1.289 and 1.386, respectively. The dimensionless mass flow rates are m& = 0.7544, 0.8811, 0.8809,and 0.8494, respectively. .............................................................................................. 73
Figure 4.9 The scaled pressure P* (see text Equation 4.1.2) versus the dimensionless
distance x along the axis for flow in microneedles showing the effect of viscous losses. The solid lines are from the numerical simulations that include viscous and inertial effects, whereas the dashed lines are from the inviscid flow model with a tip resistance. The distance between the two curves in each pair represents the effect of viscous friction. These microneedles have tip angles θt = 0º, 20º and 60º. The dimensionless pressure drops for these microneedles are ΔP = 1.757, 1.288 and 1.386 respectively. The dimensionless mass flow rates are m& = 0.7544, 0.8811 and 0.8494 respectively. All geometries have fixed Reynolds number Re = 500, cone half-angle θc = 20º, and dimensionless length L = 10........... 75
Figure 4.10 Scanning electron micrograph of solid metal microneedles shown next to
the tip of a 27-gauge hypodermic needle. The complete microneedle array contains 105 needles, each measuring 1000 μm in length, 50 μm by 200 μm in cross section at the base, and tapering to a sharp tip with an angle of 20º. ............................................................................................................ 83
Figure 4.11 Cross section of an array of microneedles inserted into rat skin in vivo and
imaged by light microscopy after biopsy, fixation, and staining. The dark structures are the needles, which pierce vertically into the skin, and the base plate of the array, which is aligned horizontally along the skin surface. A portion of the base plate is missing on the right side, which corresponds to the hole in the base plate formed after cutting and bending the needle out at 90° (see text). The lightly stained tissue corresponds to the epidermis and the thicker, darkly stained tissue below corresponds to the dermis. The inset shows a side view of a single microneedle sectioned at an angle rotated 90° relative to the main image. This figure shows that the microneedles inserted to their full length into the skin....................... 85
Figure 4.12 Surface of hairless rat skin after insertion and removal of microneedles in
vivo followed by topical staining with a tissue-marking dye, as shown by light microscopy. Each stained spot corresponds to the site of microneedle penetration into the skin............................................................................ 86
Figure 4.13 Changes in blood glucose level in diabetic, hairless rats after insulin
delivery using microneedles (▲), subcutaneous hypodermic injection of 0.05 U (◊), 0.5 U (□) or 1.5 U (○) of insulin, or passive delivery across untreated skin (×). Microneedles were inserted into skin for 10 min and then removed. Insulin solution was applied to the skin immediately after microneedle insertion and left on the skin for 4 h (as shown by arrow). Subcutaneous injections took a few seconds to perform. The

xvi
pharmacodynamic effect of insulin delivery by microneedles was bounded by that of 0.05 – 0.5 U injected subcutaneously. Data are expressed as mean values (n ≥ 3) with average standard deviation associated with each data point of 14%. Blood glucose levels have been normalized relative to average pre-treatment levels. .................................................................... 87
Figure 4.14 The effects of insulin donor concentration on changes in blood glucose
level in diabetic, hairless rats. Higher insulin concentration (500 U/ml ( )) in the donor solution reduced blood glucose level to a greater extent than lower insulin concentration (100 U/ml ( )) during delivery using microneedles that were inserted into skin for 10 min and then removed. Data are expressed as mean values (n ≥ 3) with average standard deviation associated with each data point of 15%. Blood glucose levels have been normalized relative to average pre-treatment levels. There was no significant drop in blood glucose levels in control rats exposed to insulin without microneedles (Figure 4.13). In all experiments, insulin remained in contact with the skin for 4 h (as shown by arrows). ............................. 88
Figure 4.15 The effects of needle insertion time on changes in blood glucose level in
diabetic, hairless rats. To vary insertion time, microneedles were inserted into skin and then removed after 10 s ( ), 10 min ( ), or 4 h ( ). Leaving needles inserted for longer times led to smaller reductions in blood glucose level. Data are expressed as mean values (n ≥ 3) with average standard deviation associated with each data point of 12%. Blood glucose levels have been normalized relative to average pre-treatment levels. There was no significant drop in blood glucose levels in control rats exposed to insulin without microneedles (Figure 4.13). In all experiments, insulin remained in contact with the skin for 4 h (as shown by arrows). ................................................................................................ 89
Figure 4.16 The effects of number of insertions on changes in blood glucose level in
diabetic, hairless rats. Microneedles were inserted into skin and then removed after 10 s for the single insertion experiment ( ), whereas microneedles were repeatedly inserted (for 10 s) and removed five times at the same site for the multiple insertion experiment (▲). Inserting the needles multiple times led to smaller reductions in blood glucose level. Data are expressed as mean values (n ≥ 3) with average standard deviation associated with each data point of 14%. Blood glucose levels have been normalized relative to average pre-treatment levels. There was no significant drop in blood glucose levels in control rats exposed to insulin without microneedles (Figure 4.13). In all experiments, insulin remained in contact with the skin for 4 h (as shown by arrows). ............................. 90
Figure 4.17 Plasma insulin concentration in diabetic, hairless rats plotted versus donor
solution insulin concentration. Plasma insulin levels increased with insulin concentration in the donor solution The experimental conditions were the
xvii
same as in Figure 4.14. Blood samples were collected to measure plasma insulin levels immediately after the 4-h insulin delivery period............... 91
Figure 4.18 Plasma insulin concentration in diabetic, hairless rats plotted versus
microneedle insertion time. Plasma insulin levels decreased with longer microneedle insertion times. The experimental conditions were the same as in Figure 4.15. Blood samples were collected to measure plasma insulin levels immediately after the 4-h insulin delivery period. ......................... 92
Figure 4.19 Effects of transdermal insulin delivery using microneedles on blood
glucose level in diabetic, hairless rats. Blood glucose level before, during, and after transdermal insulin delivery using microneedles inserted into the skin ( ) and through intact skin (×). The arrow indicates the beginning and end of the 4-h insulin delivery period. Data are expressed as mean values (n ≥ 3) with average standard deviation associated with each data point of 24%. Blood glucose levels have been normalized relative to average pre-treatment levels. .................................................................... 99
Figure 4.20 Plasma insulin concentration in diabetic, hairless rats during (0.5 and 4 h)
and after (8 h) transdermal delivery using microneedles. Data are expressed as mean values (n ≥ 3) with average standard deviation associated with each data point of 16%. ................................................. 100
Figure 4.21 (A) Front and (B) side views of a representative hollow, glass
microneedle. The microneedle shown measures 30 μm in effective radius at the tip with a bevel angle of 38º.......................................................... 106
Figure 4.22 Histological section of human cadaver skin pierced with a hollow
microneedle in vitro. The needle was inserted to a depth of 1080 μm and then retracted 720 μm to a final insertion depth of 360 μm. The needle had a 36º beveled tip with a 32 μm effective radius opening. A small amount of blue dye was infused into the skin at a pressure of 138 kPa for 1 min and then the skin was fixed with the needle in place. Before H&E staining and histological sectioning, the needle was removed and is not present in the image shown. The site of needle insertion is evident as the triangular region missing tissue and the paths of fluid injection are indicated by the presence of blue dye................................................................................ 107
Figure 4.23 Histological section of a control human cadaver skin. ........................... 108 Figure 4.24 (A) Top and (B) bottom surfaces of human cadaver skin after infusion of
sulforhodamine solution using a hollow microneedle in vitro. Sites of sulforhodamine infusion are indicated by dark red staining. Infusion of 755 μl of solution was carried out over 104 min at 138 kPa using a microneedle with a 31 μm effective radius opening and a bevel angle of 37º inserted to a depth of 1080 μm into the skin and retracted 720 μm to a
xviii
final insertion depth of 360 μm. The site of needle penetration is shown by the arrow in (A)....................................................................................... 109
Figure 4.25 Effect of insertion depth and retraction distance on flow rate into human
cadaver skin in vitro. Microneedles were initially inserted to a maximum insertion depth of (A) 1080 μm, (B) 900 μm or (C) 720 μm and then retracted various distances back toward the skin surface to a final, net insertion depth. Pooling the data from parts (A), (B), and (C), flow rate is shown as a function of (D) retraction distance and (E) net insertion depth for maximum insertion depths of 720 μm (white bars), 900 μm (striped bars) and 1080 μm (black bars). Microneedles had tip opening effective radii of 27 – 31 μm with bevel angles of 35 – 37º. Infusion was performed for 5 min at 138 kPa without needle retraction, after which, microneedles were retracted by 180 μm every 5 min to a final insertion depth of 180 μm. Data are expressed as mean values (n ≥ 3) with standard deviation bars.................................................................................................................. 111
Figure 4.26 Effect of pressure on flow rate into human cadaver skin. Microinfusion
flow rate was measured as a function of retraction distance at three pressures: 69 kPa (white bars), 138 kPa (striped bars) and 172 kPa (black bars). Microneedles having 35 – 37º beveled tips with 27 – 32 μm effective radius openings were inserted to a maximum depth of 1080 μm. Data are expressed as mean values (n ≥ 3) with standard deviation bars.................................................................................................................. 114
Figure 4.27 Effect of tip bevel on flow rate into human cadaver skin. Microinfusion
flow rate was measured as a function of retraction distance during infusion using hollow microneedles with a blunt tip (white bars; left inset image) and a 35º beveled tip (black bars; right inset image). Microneedles with 27 – 32 μm effective radius openings were inserted to a maximum depth of 1080 μm and infusion was carried out at 138 kPa. Data are expressed as mean values (n ≥ 3) with standard deviation bars................................... 115
Figure 4.28 Effect of tip opening size on flow rate into human cadaver skin.
Microinfusion flow rate was measured as a function of retraction distance using three different tip opening sizes: 22 μm (black bars; left inset image), 30 μm (striped bars; center inset image) and 48 μm (white bars; right inset image) effective radii. Microneedles having 35 – 37º beveled tips were inserted to a maximum depth of 1080 μm and infusion was carried out at 138 kPa. Data are expressed as mean values (n ≥ 3) with standard deviation bars. .......................................................................... 116
Figure 4.29 Effect of hyaluronidase on flow rate into human cadaver skin.
Microinfusion flow rate was measured as a function of retraction distance during infusion in the absence (white bars) or presence (black bars) of hyaluronidase. Microneedles having 35 – 37º beveled tips with 27 – 32 μm
xix
effective radius openings were inserted to a maximum depth of 1080 μm and infusion was carried out at 138 kPa. Data are expressed as mean values (n ≥ 3) with standard deviation bars. ........................................... 117
Figure 4.30 Cumulative infusion volume during infusion into human cadaver skin over
time for microneedles inserted into skin to a depth of 1080 μm and then retracted 720 μm to a final insertion depth of 360 μm (solid line) and microneedles inserted to a depth of 1080 μm without retraction (dashed line). Infusion was carried out at 138 kPa using microneedles having 35 – 38º beveled tips with 30 – 32 μm effective radius openings. Data are expressed as mean values (n ≥ 3) with average standard deviation of 40% for both curves (not shown). ................................................................... 118
Figure 4.31 Effect of skin on flow rate through microneedles. Fluid flow rate was
measured as a function of pressure across microneedles with (filled symbols) and without (empty symbols) the presence of skin. Fluid flow rates through microneedles with (ο) 25 μm and (□) 34 μm radii (data from Figure 4.1) were compared to those with the skin present, in which microinfusion into skin using microneedles was performed with insertion depth of 1080 μm without retraction ( ), with insertion depth of 1080 μm and retracted 540 μm without the presence of hyaluronidase (▲) and with the presence of hyaluronidase ( ) (data from Figure 4.26 and Figure 4.29). Data are expressed as mean values (n ≥ 3) with standard deviation bars.................................................................................................................. 120
Figure A.1 Schematic of experimental set up to make a microneedle master structure
using metal probe and polycaprolactone................................................. 135 Figure A.2 An image of solid metal probe with polycaprolactone base used as
microneedle master structure. ................................................................. 135 Figure A.3 An image of solid LPLA microneedle fabricated using micromolding
technique. ................................................................................................ 136 Figure A.4 An image of solid LPLA microneedle with side skirt fabricated using
micromolding technique by directly inserting a metal probe into liquid PDMS...................................................................................................... 137
Figure A.5 An image of copper and titanium sputtered solid LPLA mold............... 138 Figure A.6 An image of nickel electroplated solid LPLA mold. .............................. 138 Figure A.7 An image of hollow metal microneedle with 30 μm side opening holes
fabricated by laser-drilling an electroplated polymer mold. ................... 140

xx
Figure A.8 An image of hollow metal microneedle with 30 μm side opening holes fabricated by laser-drilling a sputtered polymer mold and then electroplated the mold............................................................................. 141
Figure A.9 An image of hollow metal microneedle with 20 μm side opening holes
fabricated by laser-drilling a sputtered polymer mold and then electroplated the mold............................................................................. 141

xxi
LIST OF SYMBOLS and ABBREVIATIONS α alpha value (significance level)
a correlation parameter for dimensionless pressure drop
Ag silver
AgCl silver chloride
ANOVA analysis of variance
At tip area of microneedle
ATP adenosine triphosphate
BSA bovine serum albumin
b correlation parameter for dimensionless pressure drop
c correlation parameter for dimensionless pressure drop
Ca calcium
CAD Computer Aided Design
Cu copper
dB laser beam diameter
dbase base diameter of microneedle
Di inlet diameter of microneedle
DI deionized
DNA deoxyribonucleic acid
Δp dimensional pressure drop
ΔP dimensionless pressure drop
dtip tip diameter of microneedle

xxii
dtrepan trepan diameter
Dt tip diameter of microneedle
DRIE deep reactive ion etching
D(x) dimensionless local diameter
f Darcy friction factor
FDA Food and Drug Administration
GAG glycosaminoglycan
IACUC Institutional Animal Care and Use Committee
ICP-RIE Inductively Coupled Plasma - Reactive Ion Etcher
ISF interstitial fluid
K correlation parameter for dimensionless pressure drop
KOH potassium hydroxide
L dimensionless length
Le entrance length
*eL dimensionless entrance length
LIGA lithographie, galvanoformung und abformung (lithography, electroplating
and molding)
Ln microneedle length
LPLA poly (L-lactic-acid)
μ fluid viscosity
m& dimensionless mass flow rate
am& dimensional mass flow rate
MAPE mean absolute percent error

xxiii
MEA microenhancer arrays
MEMS microelectromechanical systems
Mg magnesium
maxm& maximum dimensionless mass flow rate
μ-TAS micro-total-analysis system
NaOH sodium hydroxide
NIH National Institute of Health
p probability value
p0 plenum chamber pressure
patm atmospheric pressure
P* scaled dimensionless pressure
PBS phosphate buffered saline
PCL polycaprolactone
PDMS polydimethylsiloxane
PGA poly (glycolic-acid)
PGP proteoglycan core protein
PLA poly (lactic-acid)
PLGA poly (lactide-co-glycolide)
PMMA polymethylmethacrylate
Re Reynolds number
ρ fluid density
θc cone half-angle
θp transition tip angle

xxiv
θt tip angle
Ti titanium
UV ultraviolet
V average velocity at the microneedle tip
x dimensionless distance
xxv
SUMMARY Although transdermal drug delivery provides patient convenience and sustained
delivery in contrast to painful hypodermic injections, skin’s low permeability prevents
passive delivery of most drugs. The development of microneedles that penetrate the skin
barrier, but are small enough not to stimulate nerves, has the potential to deliver drugs
across skin in a painless way. In previous studies, solid silicon microneedles have been
shown to increase skin permeability for transdermal diffusion of a wide range of
molecules. However, controlled injection by convective flow into skin using hollow
microneedles has remained a challenge. To address this challenge, the goals of this study
were (i) to provide experimental measurements coupled with numerical simulations to
quantitatively describe fluid mechanics of flow within microneedles over a range of
experimental conditions and needle geometries, (ii) to demonstrate and study the effects
of diffusion-based delivery of insulin to diabetic rats in vivo using solid and hollow
microneedles and (iii) to determine the effect of experimental parameters on
microinfusion through hollow microneedles into skin to optimize drug delivery protocols
and identify rate-limiting barriers to flow.
We first studied fluid mechanics of flow through microneedles by carrying out
experimental and theoretical studies. Experimentally, we quantified the relationship
between pressure drop and flow rate through microneedles as a function of fluid viscosity
and microneedle length, diameter, and cone half-angle. At small Reynolds number,
dimensionless pressure drop decreased steeply with increasing Reynolds number,
indicating the importance of viscous forces, and at large Reynolds number, dimensionless
pressured drop was generally independent of Reynolds number, indicating that the flow

xxvi
was almost inviscid. Microneedle tip diameter and taper angle were the primary
controlling parameters for flow through conically tapered microneedles as shown by
numerical simulations, which demonstrated good agreement with experimental data. A
favorable axial pressure gradient that accelerates fluid through the microneedle, thus
inhibiting growth of the viscous boundary layer on the microneedle wall, was shown as a
characteristic feature of flow through conically tapered microneedles. Flow rates over a
range of 1.4 – 56 µl/s were achieved through microneedles (in the absence of skin) with
pressure drops in the range of 4.6 – 196.5 kPa. This study represents the first detailed
study of fluid mechanics of flow in microneedles specifically and of developing flow in
conical channels in general.
This work also studied the use of solid microneedle arrays to insert into the skin of
diabetic hairless rats in vivo for transdermal delivery of insulin. This study used arrays
each containing 105 solid metal microneedles measuring 1000 μm long and 50 μm x 200
μm in cross section. Blood glucose levels dropped by as much as 80% in diabetic hairless
rats in vivo, indicating that solid metal microneedles were capable to increase transdermal
insulin delivery. Reduction of blood glucose levels based on microneedle insulin delivery
showed an extent similar to 0.05 – 0.5 U insulin injected subcutaneously. Direct
measurement of plasma insulin concentrations were reported in the range of 0.5 – 7.4
ng/ml. Larger drops in blood glucose level and larger plasma insulin concentrations were
shown due to higher donor solution insulin concentration, shorter microneedles insertion
time and fewer repeated insertions. This is the first study demonstrating delivery of a
therapeutic protein, i.e., insulin using microneedles in vivo.

xxvii
Transdermal insulin delivery in diabetic hairless rats in vivo was also shown using
hollow microneedles, which were fabricated using a modified-LIGA and laser-trepanning
process. Insulin delivery through an array of 16 hollow metal microneedles measuring
500 μm in length with a 75 μm tip diameter were demonstrated to reduce blood glucose
levels steadily to 47% of pre-treatment values over a 4-h insulin delivery period. Direct
measurement of plasma insulin levels showed a peak value of 0.43 ng/ml. This study is
the first demonstration of diffusion-based delivery through hollow microneedles.
The final scope of this work was to determine the effect of microneedle geometry and
infusion protocols on microinfusion flow rate into skin in vitro. Glass microneedles were
fabricated using a micropipette puller and inserted to a depth of 720-1080 μm into human
cadaver skin to microinfuse sulforhodamine. Infusion flow rates ranged from 21 to 1130
µl/h was demonstrated using these microneedles. The presence of a bevel at the
microneedle tip, larger retraction distance and insertion depth, larger infusion pressure
and the presence of hyaluronidase led to larger infusion flow rates. Longer infusion time
experiments suggest a constant flow rate after a short transient delay.
In addition to demonstrating diffusion-based delivery in vivo using solid and hollow
microneedles, this work provides an in depth study of convective delivery using hollow
microneedles. By designing microneedles with an appropriate geometry and inserting
needles and injecting fluid appropriately into the skin, hollow microneedles can be used
to microinfuse solutions at rates relevant for a variety of drug delivery scenarios.

1
1 INTRODUCTION Although sophisticated new drugs have been developed, their therapeutic delivery is
often a challenge. Drug could be transported into our body via different delivery routes:
transdermal, nasal, oral, buccal, ocular, and pulmonary delivery (Langer 2001, Senel and
Hincal 2001). Each of these routes offers some advantages and limitations. Oral delivery
remains the most common way drugs are administered however many compounds are
either degraded in the gastrointestinal tract or liver, or are poorly absorbed across the
intestine. When this occurs, the usual alternative is to use a hypodermic needle for
injection across the skin. Although hypodermic needle can effectively deliver large doses
of drugs in a short time period, it has some limitations such as the pain associated with
the injection, expertise required for injection and most importantly, difficulty for
sustained delivery (Prausnitz 2001).
Transdermal drug delivery from a patch is attractive as an alternative route because it
eliminates the limitations associated with oral delivery and hypodermic needle injection
(Prausnitz, Mitragotri, et al. 2004, Purdon, Azzi, et al. 2004). It offers good patient
compliance and the possibility of controlled release over time, while avoiding possible
degradation due to the gastrointestinal tract or first-pass liver effects (Bronaugh and
Maibach 1999, Prausnitz, Mitragotri, et al. 2004). Adult human skin with large surface
area offers a remarkable exposed area for transdermal drug delivery (Wille and
Kydonieus 2000). The complex skin structure however remains the biggest challenge for
researchers in the field. The outermost layer of skin (10 – 15 μm), stratum corneum, acts
as a barrier to foreign materials and resists passive diffusion of most drugs across the skin
2
at a therapeutic rate. Thus the $2.8 billion worldwide transdermal patch market is only
based on about a dozen drugs that share specific characteristics: low molecular mass,
optimal physicochemical properties and effectiveness at low doses because of the high
impermeability of human skin (Barry 2001, Prausnitz, Mitragotri, et al. 2004) .
The idea to simultaneously capture the potential benefits of both hypodermic needles
and transdermal patches led into the development of the micron-dimension needles
concept, usually referred to as “microneedles” by delivering drug with high patient
compliance (Henry, McAllister, et al. 1998). In previous studies, solid silicon
microneedles have been shown to increase epidermis permeability for transdermal
diffusion of a wide range of molecules (McAllister, Allen, et al. 2000). To extend
microneedle capabilities to actively deliver drugs by convection, hollow tapered
microneedles have also been fabricated (Davis 2003). However, fluid delivery into
complex skin structure using microneedles remains a challenge. The effectiveness and
potential application of microneedles as a device for fluid delivery into skin is the scope
of this thesis. In addition, the use of both solid and hollow microneedles to deliver a
therapeutic protein in vivo is also demonstrated.

3
2 BACKGROUND
2.1 Transdermal Drug Delivery
Transdermal drug delivery is the transport of drugs across skin. Injection of drugs into the
skin using a hypodermic needle remains the most common way to deliver drugs across
skin. The conventional way of drug injection across skin has been performed by using
hypodermic needles. This method of delivery proves to deliver drugs in large quantities
in a controlled fashion. However, there are some drawbacks associated with this injection
delivery method such as pain caused by the needle, lack of patient compliance, need for
medical expertise to perform the injection, risk of infection and difficulty for sustained
delivery. Transdermal drug delivery using patches, on the other hand, has the capability
of eliminating these limitations associated with hypodermic needle injection such as lack
of pain, infection, and sustained delivery (McAllister, Allen, et al. 2000, Mitragotri
2000). The use of transdermal patches has been employed for the delivery of drugs that
have optimal physicochemical properties which are compatible with stratum corneum
such as clonidine, fentanyl, lidocaine, nicotine, nitroglycerin, oestradiol, oxybutinin,
scopolamine and testosterone (Sifton 2003). Nevertheless, the rapid growth of
transdermal drug delivery using patches has been limited by the types of drugs that can
be delivered depending on their size, charge and other physicochemical properties (Naik,
Kalia, et al. 2000).
4
2.1.1 Skin Anatomy
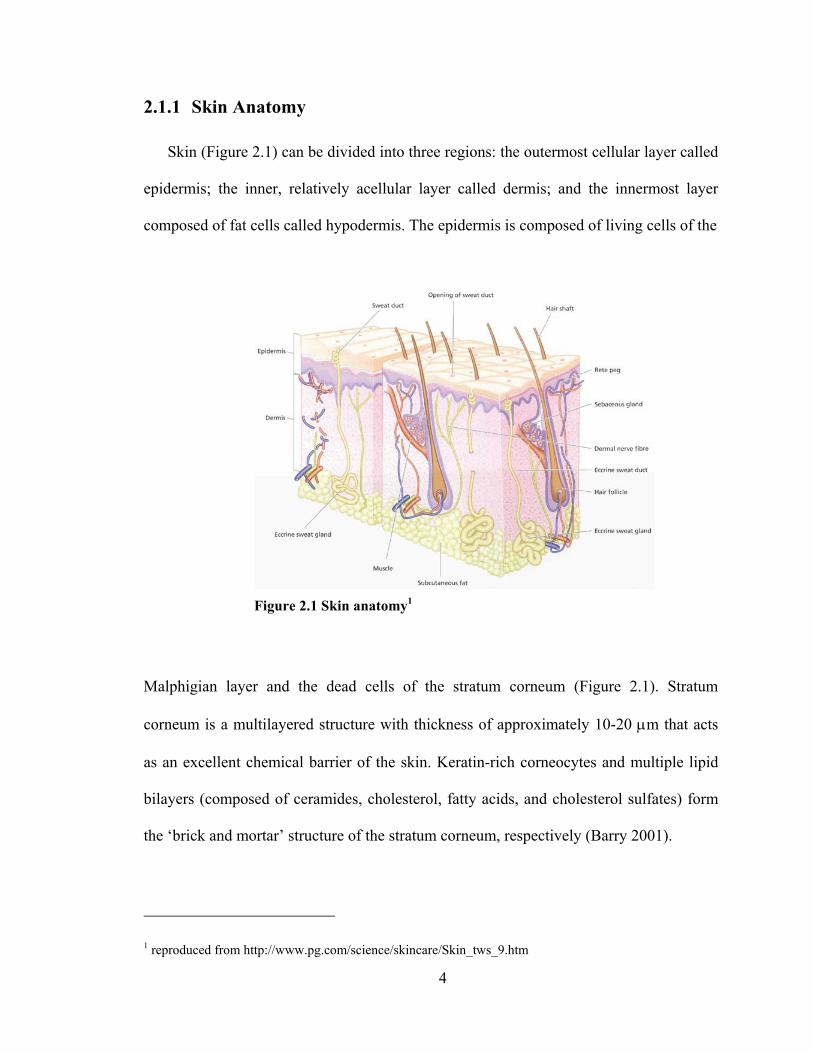
Skin (Figure 2.1) can be divided into three regions: the outermost cellular layer called
epidermis; the inner, relatively acellular layer called dermis; and the innermost layer
composed of fat cells called hypodermis. The epidermis is composed of living cells of the
Figure 2.1 Skin anatomy1
Malphigian layer and the dead cells of the stratum corneum (Figure 2.1). Stratum
corneum is a multilayered structure with thickness of approximately 10-20 μm that acts
as an excellent chemical barrier of the skin. Keratin-rich corneocytes and multiple lipid
bilayers (composed of ceramides, cholesterol, fatty acids, and cholesterol sulfates) form
the ‘brick and mortar’ structure of the stratum corneum, respectively (Barry 2001).
1 reproduced from http://www.pg.com/science/skincare/Skin_tws_9.htm

5
The next layer below the stratum corneum is the viable epidermis layer (50 – 100 μm)
that consists of keratinizing epithelial cells for the synthesis of the stratum corneum
(Schaefer and Redelmeier 1996). This viable epidermis layer contains no vascular
network and obtains its nutritional need by passive diffusion through interstitial fluid.
The epidermis is connected to the 1 – 2 mm thick dermis layer by the epidermal-dermal
junction. The dermis is an integrated fibroelastic, largely acellular structure that provides
skin mechanical strength. This dermis layer contains extensive nerves and vascular
networks.
Despite the extensive research on transdermal drug delivery, natural skin property as
an excellent barrier to foreign material remains as a challenge in this field. Many efforts
in transdermal drug delivery research have been devoted to disrupting the hindrance
provided by an intact stratum corneum. Drug enhancement by adjusting its partition
coefficient, chemical potential, or by using a prodrug is one of the various ways to
overcome the stratum corneum barrier (Barry 2001). Different types of chemical
enhancers such as surfactants, fatty acids/esters, terpenes and solvents can increase skin
permeability by various mechanisms, including enhancing solubility, increasing
partitioning into the stratum corneum, fluidizing the stratum corneum crystalline structure
and dissolving stratum corneum lipids (Finnin and Morgan 1999, French, Pouton, et al.
1993, Kanikkannan, Kandimalla, et al. 2000, Williams and Barry 2004). Some other
methods based on physical enhancement such as electroporation, iontophoresis and
ultrasound were also found to successfully create pathways for drugs entering the skin
(Barry 2001, Mitragotri, Coleman, et al. 2000, Prausnitz 1999). Electroporation involves
the application of short, high-voltage pulses to transiently increase skin permeability
6
(Prausnitz, Bose, et al. 1993, Prausnitz 1999). Iontophoresis which uses an electric field
to move both charged and uncharged species across the skin increases rates of
transdermal transport by three different mechanisms: electrophoresis, electro-osmosis,
and transiently increased skin permeability (Prausnitz, Mitragotri, et al. 2004).
Ultrasound that involves cavitation and emission of acoustic microjets is considered to
disrupt stratum corneum lipid bilayers (Mitragotri, Edwards, et al. 1995). However, low-
cost, simple, and reliable miniaturization of these latter delivery systems remains a
challenge for home usage. Modification (by hydrating) and disruption of stratum
corneum were also found to assist drug penetration into the skin (Marks, Barton, et al.
1988). Disruption of the stratum corneum using gas-based high velocity projectiles and
jet injectors has also been employed even though there is a main concern of bruising and
sometimes bleeding that is difficult to avoid (Barry 2001, Bremseth and Pass 2001,
Burkoth, Bellhouse, et al. 1999, Bykowski 1999). Thermal methods have also been used
to increase skin permeability by locally heating and ablating holes in stratum corneum, a
process called microporation (Bramson, Dayball, et al. 2003, Gebhart, Faupel, et al.
2003).
The ability to create a large enough transport pathway across stratum corneum for
molecules to pass through however small enough for high patient compliance, thus
eliminating the need of hypodermic needle, has led into the development of microneedles
for transdermal drug delivery.
2.2 Diabetes and Insulin Delivery
Diabetes mellitus is one of the leading lethal diseases in the United States and
worldwide, and is often treated by hypodermic injection of insulin. In the United States,

7
diabetes accounts for over 130 billion dollars of health care costs and is the fifth leading
cause of death (Hogan, Dall, et al. 2003). Diabetes is classified by its underlying cause:
type 1 diabetes, an autoimmune disease in which the body's own immune system attacks
the pancreas, rendering it unable to produce insulin and type 2 diabetes that is caused by
combination of insulin resistance with insulin deficiency (2003). These abnormalities
lead to metabolism alterations of carbohydrates, lipids, ketones and amino acid as well as
increased level of blood glucose (hyperglycemia). Hyperglycemia resulting from diabetes
could eventually lead into further complications such as heart disease, blindness, kidney
failure and pregnancy complications (Davidson 1998).
Diabetes management involves tight control of blood glucose levels by keeping
patient’s blood glucose levels as close as possible to normal levels. Glucose regulation
within our body is controlled by the competing effects of two glucoregulatory hormones:
insulin and glucagon. Insulin stimulates the glucose uptake and metabolism by muscle
and adipose tissue and also inhibits the hepatic glucose production thereby reducing
glucose concentration in blood. On the other hand, glucagon increases blood glucose by
stimulating the conversion of glycogen (short-term energy reserve) into glucose.
Subcutaneous insulin injection using hypodermic needle has remained the common way
to administer insulin despite its limitations to restore normal glucose level in diabetic
patients as well as discomfort associated with the pain and frequency of injection. The
kinetics of injected insulin do not mimic the natural rise and fall of nutrient-related and
basal insulin secretion.
The need for daily multiple insulin doses and inconvenience associated with multiple
needle injections has led into the development of insulin-infusion pumps. Available
8
insulin pumps in the market have some limitations including presently unavailable
automatic glucose sensor feedback system, insulin aggregation in infusion line, pump
failures and potential risk for subcutaneous cellulitis and abscesses (Goodman, Gilman, et
al. 1996). There have been many efforts to develop alternative routes of delivery for
insulin administration: peroral, buccal/sublingual, rectal, transdermal, intranasal, and
pulmonary. Combined effects of the relatively thick multilayered buccal barrier and
constant saliva flow limit the effectiveness of insulin delivery via mucosa of mouth
(Aungst and Rogers 1988). High insulin doses and different strategies were employed to
increase the permeability of intestinal mucosa such as enhancement of insulin stability,
protection against proteolytic enzymes and use of surfactants (Shah, Ahsan, et al. 2002).
Recently, there has been some success with oral insulin delivery system (Arbit 2004,
Whitehead, Shen, et al. 2004). Rectally-injected insulin has limitations such as the need
for enhancers (Chetty and Chien 1998, Matsuda and Arima 1999, Yun, Choi, et al. 1999)
and its low bioavailability (Yamasaki, Shichiri, et al. 1981). The use of iontophoresis
(Langkjaer, Brange, et al. 1998), low-frequency ultrasound (Mitragotri, Blankschtein, et
al. 1995), and transfersomes (Cevc 2004) to increase skin permeability of large
hydrophilic polypeptides such as insulin has had limited success. However transdermal
route still remains as an attractive route for insulin delivery. Nasally-administered insulin
with similar pharmacokinetic profile of intravenous insulin has some drawbacks
including its low bioavailability (Drejer, Vaag, et al. 1992, Hinchcliffe and Illum 1999),
short duration action (Bruce, Chisholm, et al. 1991, Hilsted, Madsbad, et al. 1995) and
variable absorptions (Gizurarson and Bechgaard 1991). Large surface area, highly
permeable epithelium (Weibel 1964, Weiss, Berger, et al. 1999, Weiss, Cheng, et al.
9
2003), and lung immunotolerance (Patton and Platz 1992) are advantageous for
pulmonary insulin delivery. Despite low bioavailability (Patton, Bukar, et al. 2004, Rave,
Nosek, et al. 2004) and the possibility of pulmonary hypotension and oedema due to high
insulin concentration (Weiss, Berger, et al. 1999), recently, there has been significant and
promising progress of inhaled insulin delivery system (Hollander, Blonde, et al. 2004,
Quattrin, Belanger, et al. 2004, Rave, Nosek, et al. 2004, Rosenstock, Cappelleri, et al.
2004).
Given the large surface area of skin available for transdermal drug delivery, thus
arrays of microneedles have the potential to provide transport pathways for insulin
delivery into skin. These needles can pierce the skin and create micron-scale openings, in
the case of solid microneedles, or provide a conduit for insulin transport across the skin in
the case of hollow microneedles. While still extremely small on a clinical level, channels
of microns dimensions are much larger than macromolecules and thereby should
dramatically increase skin permeability to large drug molecules such as insulin. Given the
very low diffusivity of many drug molecules, including insulin, in stratum corneum,
microneedles can also increase drug molecules diffusivity across the skin. Microneedles
also eliminate the pain associated with multiple hypodermic needle injection of insulin
and offer the potential for controlled and automated insulin delivery, i.e., integrated with
micropumps and glucose microsensors.
2.3 Microfabrication
Desired microneedle properties such as small dimension, sharpness and strength to
insert into skin in a painless fashion suggests the use of microfabrication as a primary
method to make these microneedles. Microfabrication, i.e., micro-machining or micro-

10
electromechanical systems (MEMS), is a rapidly growing field that applies tools
developed in microelectronics field to create mechanical or electrical devices.
Fundamentally, microfabrication involves material deposition (additive), material etching
(subtractive) and patterning processes (Madou 2002).
The potential application of MEMS for the development of microfeatures in
biomedical field led into the birth of BioMEMS. Drug delivery, DNA sequencing devices
(Katsuma and Tsujimoto 2001), biosensors and chemical analysis systems (Lindner
2001) are few among many other applications that benefit from the advances in
BioMEMS technology. The compelling factor to fabricate devices with the same size as
the biological entity of interest has led into the development of wide variety of
biologically-relevant micron size devices such as micro-total-analysis system (μ-TAS)
(Wang, Lu, et al. 2000), microreservoir for drug delivery (Ahmed, Bonner, et al. 2002)
and silicon immunoisolating biocapsules (Leoni and Desai 2004).
2.3.1 Laser Micromachining
Laser micromachining that involves material ablation offers high quality three-
dimensional features fabrication in a single step and dry process (Harvey, Rumsby, et al.
1995, Rizvi, Rumsby, et al. 1999). The use of laser micromachining has emerged from its
application in microvias drilling in chip interconnection packages in early 1980s to being
a key player nowadays in the development of micro structures in MEMS (Gower 2000)
for diverse industrial applications including ink jet printer nozzles (Dyer 2003), arterial
blood gases sensors (Gower 1999), lab-on-chips components (Pugmire, Waddell, et al.
2002), and micro diffractive lenses (Lippert, David, et al. 2001).

11
2.3.2 Polymer and Micromolding Process
The development of SU-8, an epoxy-derivative of bis-phenol-A novolak has
benefited the MEMS field, especially in the area of photolithography in which
previously, low resolution, low aspect ratio and high optical absorbency were among the
disadvantageous characteristics of photoresist materials. SU-8’s unique properties such as
low optical absorption in the UV range, good adhesion properties and low cost have led
its use in the fabrication of high aspect ratio, three dimensional MEMS structures
(Bertsch, Lorenz, et al. 1999).
The use of polydimethylsiloxane (PDMS) in micromolding process has been widely
used to replicate microstructures (Xia and Whitesides 1998) due to its low cost,
durability, and transparency. Polymers in general and biodegradable and biocompatible
polymers in specific have been extensively studied and used in both MEMS and drug
delivery areas. Despite the large number of available degradable polymers, there is only a
handful of these polymers which are considered safe for internal human use such as poly
(lactic-acid) / PLA, poly (glycolic-acid) / PGA and their copolymers (Ratner 2004).
2.4 Evolution of Microneedles
The idea of combining the benefits of needle injection and transdermal patches while
eliminating the drawbacks associated with each technique resulted in the creation of the
microneedles concept. This concept involves micron-size needles, generally hundreds of
microns long, ones to tens of microns wide at the tip, and on the order of 100 μm wide at
the base. These needles are sufficiently long to penetrate skin’s outer permeability
barrier, deep enough to allow capillaries uptake but short enough to avoid nerve endings
12
(Henry, McAllister, et al. 1998, McAllister, Allen, et al. 2000). The idea behind the
development of microneedles is to pierce into skin and to create molecular or liquid
transport pathways across the skin. Microneedles have evolved from their simplest form
of solid spikes to hollow microneedles that could be integrated with micropumps or other
microfeatures with different functionality.
2.4.1 Solid Microneedles
Early design microneedles were in the form of solid microneedles. These
microneedles have been designed and used to create micron-size openings in the skin and
thus allow molecular transport into skin. Solid microneedles tend to be sharp and simpler
to fabricate compared to hollow microneedles.
2.4.1.1 Silicon Microprobes
One of the earliest solid microneedle design was in the form of pyramidal silicon
microprobes, shown in Figure 2.2 (Hashmi, Ling, et al. 1995). The fabrication step
involves spin-casting a photoresist (photosensitive polymer) onto a silicon-dioxide coated
wafer, bringing the wafer into contact with a photomask (glass plate with chromium
pattern on it) and exposing it to UV light. The exposed photoresist portions (not covered
by chromium pattern) are eventually removed during the development step. The
transferred pattern (from photomask to photoresist) is then etched into the silicon dioxide
masking layer. Subsequently, the photoresist is removed and the wafer is anisotropically
wet-etched in potassium hydroxide solution to create arrays of pyramidal probes. These
micropobes are ten to several hundred microns in height and are extremely sharp (tip

13
radii < 0.1 μm) and have been used to deliver genes to plant, nematodes, and mammalian
cells.
Figure 2.2 Solid silicon microprobes used to deliver genes to plant, nematodes and mammalian cells (Hashmi, Ling, et al. 1995).
2.4.1.2 Silicon Microneedles
The use of solid microneedles for transdermal drug delivery was first demonstrated
soon after the development of the silicon microprobes (Henry, McAllister, et al. 1998).
These solid microneedles were fabricated using deep reactive ion etching method. The
fabrication steps include depositing a chromium masking layer onto a silicon wafer,
patterning it using photolithography into dots with the size of the desired needle base.
The wafer is then etched by an oxygen/fluorine plasma mixture in a reactive ion etcher to
create high aspect ratio solid silicon microneedles. These needles measure approximately
80 μm at the base, 150 μm tall, and approximately 1 μm radius of curvature at the tip and
shown in Figure 2.3. These needles were capable to insert into skin without breaking and

14
increase the permeability of human epidermis to calcein (623 Da; r = 0.6 nm), insulin
(hexameric form: 35 kDa; 2.5 nm), and bovine serum albumin / BSA (66 kDa; 3.5 nm) in
vitro by orders of magnitude (McAllister 2000).
Figure 2.3 Solid silicon microneedles used for transdermal delivery and capable to increase human epidermis permeability to calcein, insulin and bovine serum albumin (Henry, McAllister, et al. 1998).
Another type of solid silicon microneedles called microenhancer arrays (MEA) was
fabricated using lithography and isotropic potassium hydroxide etch techniques and
shown to deliver naked plasmid DNA into mice skin. The needle arrays were placed in
contact with DNA solution and scraped multiple times across the skin thus creating
microabrasion effects and increase in reporter gene activity up to 2,800-fold above
topical controls. These needles measure 50 – 200 μm in length and have blunt tip, shown
in Figure 2.8 (Mikszta, Alarcon, et al. 2002).

15
Figure 2.4 Microenhancer (MEA) array for skin microabrasion during naked plasmid DNA delivery into mice skin (Mikszta, Alarcon, et al. 2002).
2.4.1.3 Polymer Microneedles
High material and fabrication costs associated with the fabrication of silicon
microneedles have led into the use of other materials for microneedles fabrication.
Polymer microneedles offer several benefits such as ease of manufacture, higher safety
efficacy and ability to act as drug carrier (in the case of implanted biodegradable
polymer). Different types of polymer have been used as basic materials to fabricate
microneedles.
2.4.1.3.1 Beveled Microneedles
Beveled needles exert asymmetric forces into tissue thus allows easier penetration
into skin. Beveled polymer microneedles made of biodegradable polymer, poly (glycolic
acid) / PGA were fabricated using combinations of photolithography, metal coating for
masking, reactive ion etching and micromolding techniques (Park 2004). The fabrication
steps include coating SU-8 photoresist onto a silicon wafer, lithographically patterning
16
into cylinders, filling the space between the cylinders with a sacrificial polymer,
depositing copper masking layer, partially removing the sacrificial layer and
asymmetrically etching the tip of the cylinders. After removing the remaining sacrificial
layer, it leaves behind an array of beveled SU-8 microneedles. In order to make the final
PGA needles, the next step is to replicate these SU-8 needles by coating
polydimethylsiloxane onto the needles to make an inverse mold, filling this mold with
PGA polymer powder and melting it under vacuum.
With 600 μm in height, 100 μm at their bases, and 10 μm at their tips, these PGA
needles are positioned in a 20 by 6 array with a center-to-center spacing of 400 μm and
1400 μm (shown in Figure 2.4). Similar needles made of other biodegradable polymer,
poly (lactide-co-glycolide) / PLGA were loaded with calcein and BSA and shown to
insert into skin without breaking. The release pattern and rate of calcein and BSA in
phosphate buffered saline solution (PBS) were shown to be different. The release pattern
of calcein depended on calcein bulk diffusion rather than slower polymer degradation, on
the other hand, the release pattern of BSA depended on slower BSA diffusion and
polymer needle surface erosion (Park, Davis, et al. 2003). In addition, these needles were
shown to increase the skin permeability to calcein by up to three orders of magnitude
(Park 2004).
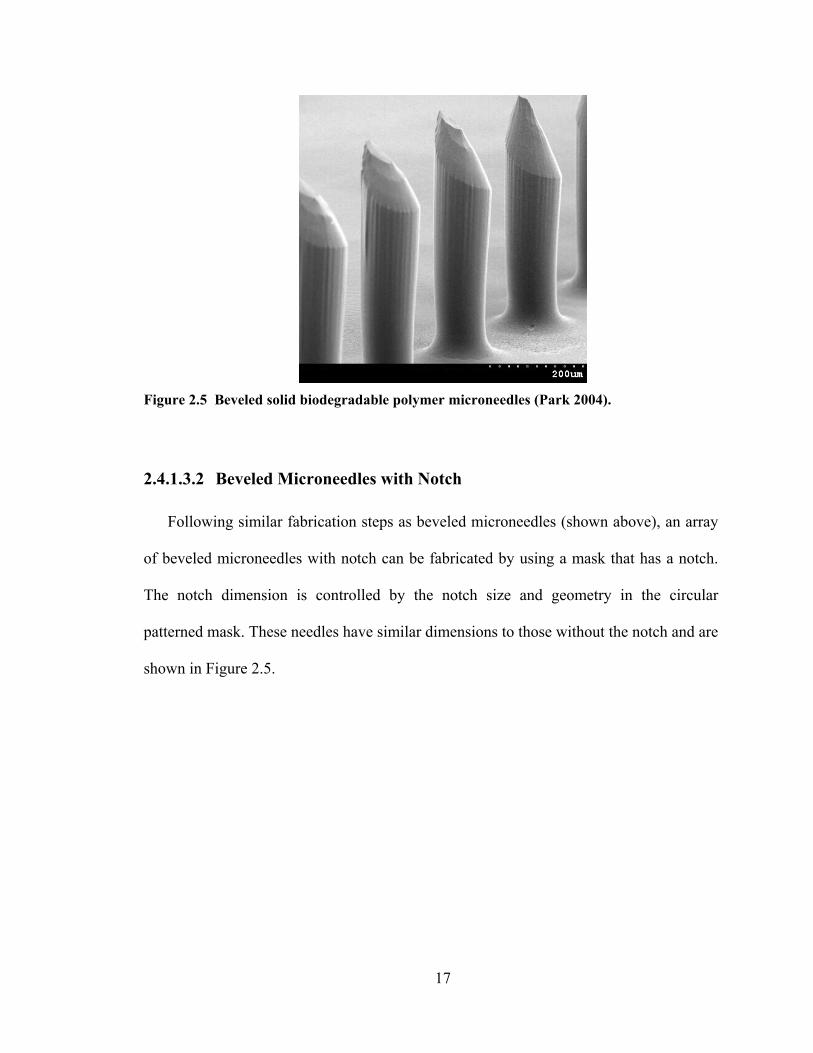
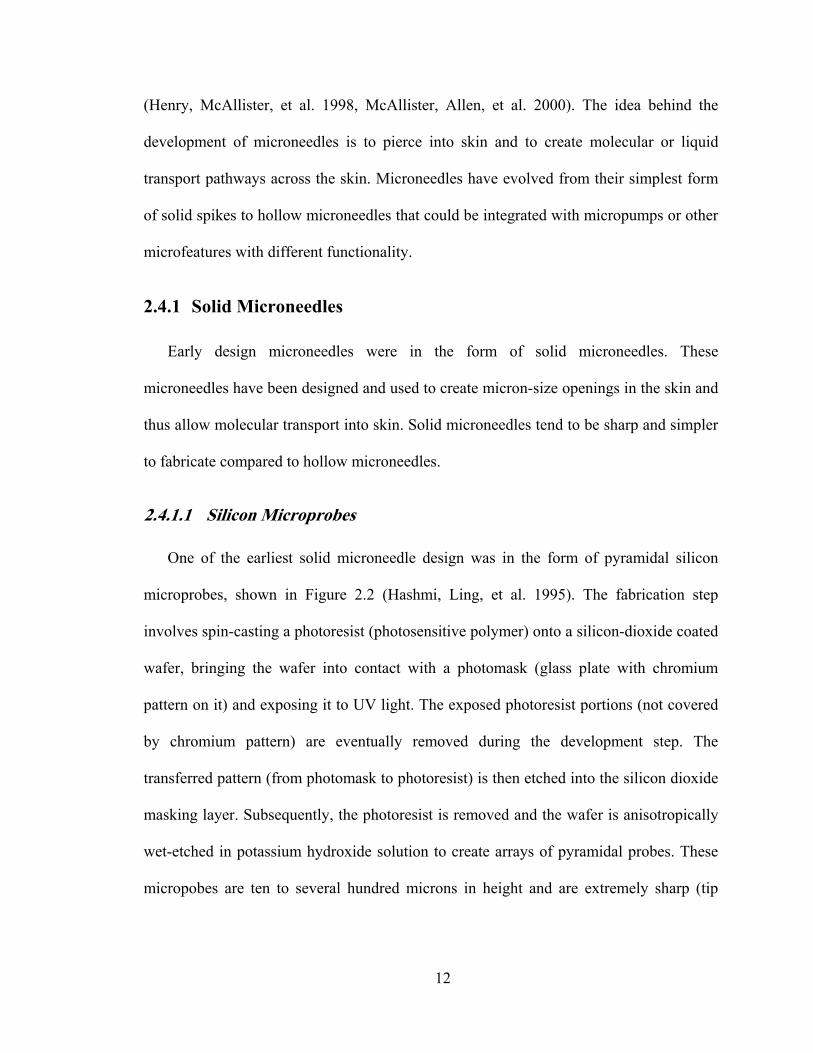
17
Figure 2.5 Beveled solid biodegradable polymer microneedles (Park 2004).
2.4.1.3.2 Beveled Microneedles with Notch
Following similar fabrication steps as beveled microneedles (shown above), an array
of beveled microneedles with notch can be fabricated by using a mask that has a notch.
The notch dimension is controlled by the notch size and geometry in the circular
patterned mask. These needles have similar dimensions to those without the notch and are
shown in Figure 2.5.
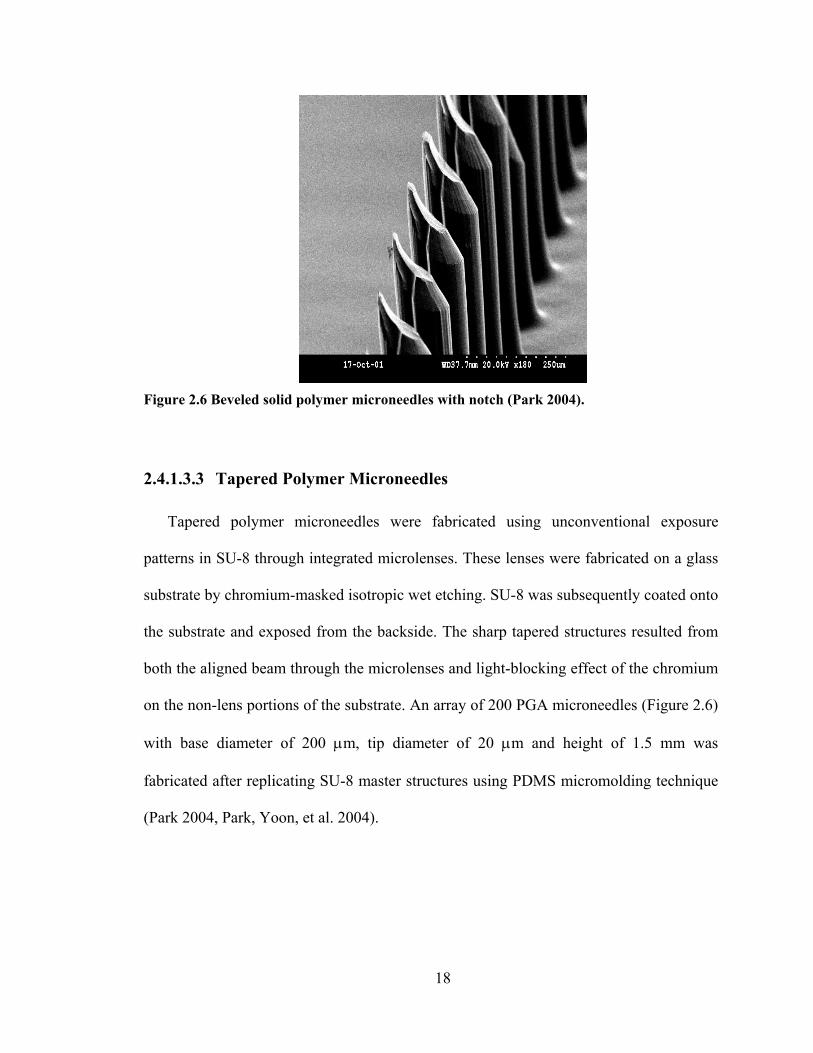
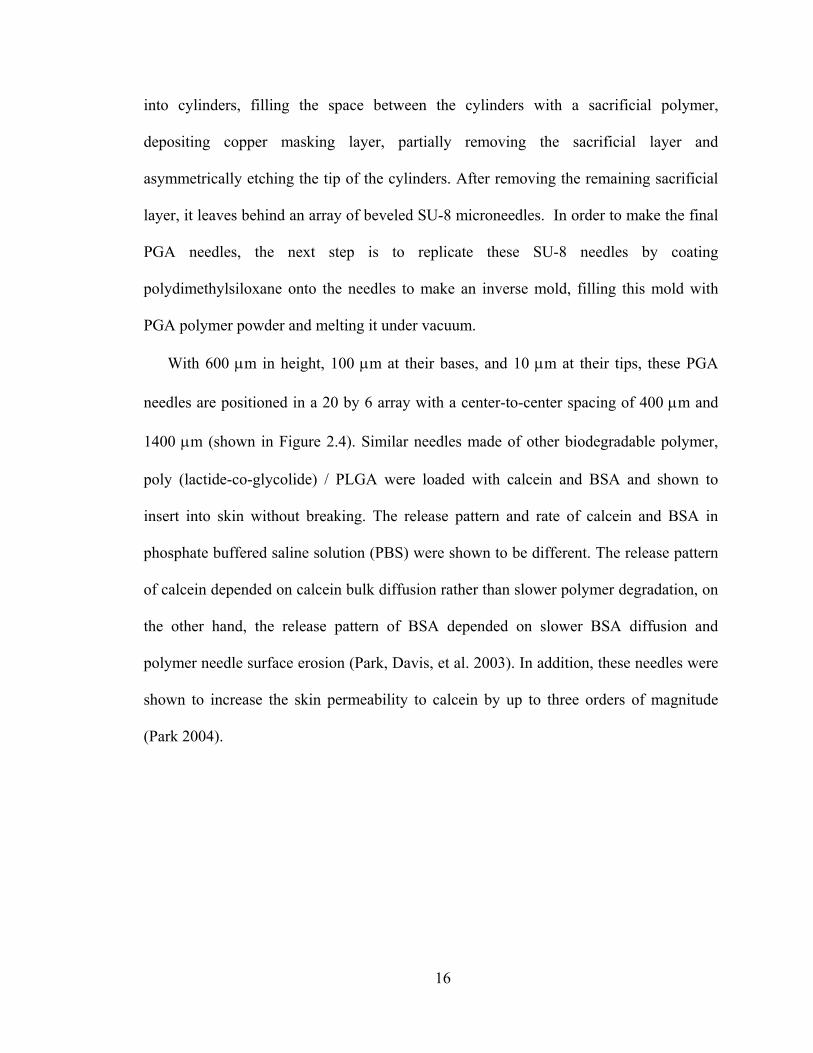
18
Figure 2.6 Beveled solid polymer microneedles with notch (Park 2004).
2.4.1.3.3 Tapered Polymer Microneedles
Tapered polymer microneedles were fabricated using unconventional exposure
patterns in SU-8 through integrated microlenses. These lenses were fabricated on a glass
substrate by chromium-masked isotropic wet etching. SU-8 was subsequently coated onto
the substrate and exposed from the backside. The sharp tapered structures resulted from
both the aligned beam through the microlenses and light-blocking effect of the chromium
on the non-lens portions of the substrate. An array of 200 PGA microneedles (Figure 2.6)
with base diameter of 200 μm, tip diameter of 20 μm and height of 1.5 mm was
fabricated after replicating SU-8 master structures using PDMS micromolding technique
(Park 2004, Park, Yoon, et al. 2004).

19
Figure 2.7 Tapered solid polymer microneedles fabricated using lens technique (Park, Yoon, et al. 2004).
2.4.1.4 Metal Microneedles
Metal is considered to be another candidate for microneedles because it offers added
mechanical strength, ease of fabrication, relatively inexpensive cost and established
safety records in medical applications.
Different styles of solid metal microneedles have been developed for transdermal
drug delivery. Microprojection titanium arrays (Macroflux®) are fabricated by applying a
thin layer of photoresist onto a titanium or stainless steel sheet, contact-exposing and
developing the resist with the desired pattern and bending the arrays to a 90º angle
(relative to the horizontal plane). These microprojections (alone or in combination with
iontophoresis) which measure 175-430 μm in length and arranged in an array with
density of 190-320 microprojections/cm2 were shown to deliver oligodeoxynucleotides
and human growth hormone across hairless guinea pigs skin (Cormier and Daddona
2003, Lin, Cormier, et al. 2001).
20
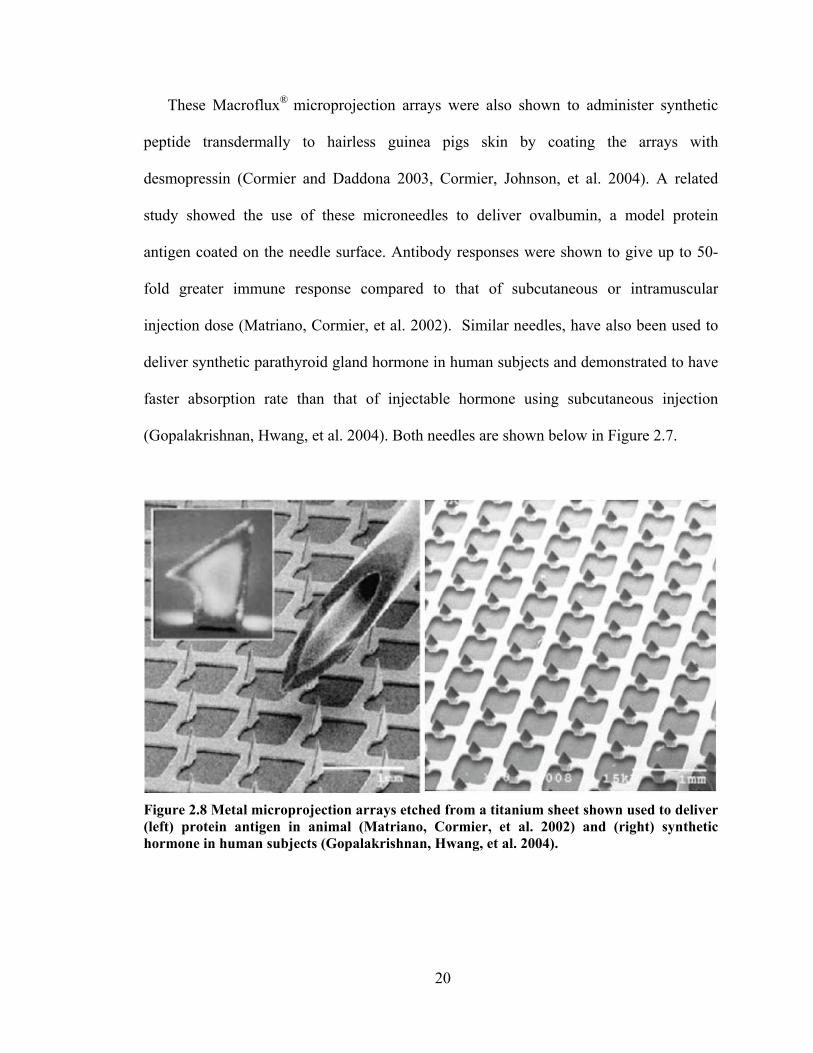
These Macroflux® microprojection arrays were also shown to administer synthetic
peptide transdermally to hairless guinea pigs skin by coating the arrays with
desmopressin (Cormier and Daddona 2003, Cormier, Johnson, et al. 2004). A related
study showed the use of these microneedles to deliver ovalbumin, a model protein
antigen coated on the needle surface. Antibody responses were shown to give up to 50-
fold greater immune response compared to that of subcutaneous or intramuscular
injection dose (Matriano, Cormier, et al. 2002). Similar needles, have also been used to
deliver synthetic parathyroid gland hormone in human subjects and demonstrated to have
faster absorption rate than that of injectable hormone using subcutaneous injection
(Gopalakrishnan, Hwang, et al. 2004). Both needles are shown below in Figure 2.7.
Figure 2.8 Metal microprojection arrays etched from a titanium sheet shown used to deliver (left) protein antigen in animal (Matriano, Cormier, et al. 2002) and (right) synthetic hormone in human subjects (Gopalakrishnan, Hwang, et al. 2004).

21
2.4.2 Hollow Microneedles
Skin permeability can be dramatically increased by the holes created from solid
microneedle insertion or abrasion. However, it is necessary to have more controlled and
reproducible transport pathways to deliver drugs into the skin. The fabrication of hollow
microneedles that allows drug transport through the bore of the needle was based on this
need. Hollow microneedles allow the increase of fluid pathway into the skin through the
bore of the needle and offer the potential for larger molecules to be delivered into skin in
a controlled fashion. Solid microneedles diffusion-based delivery could be expanded to
convective delivery using hollow microneedles, i.e., by pressure-driven flow or by
incorporating syringe pump with microneedle arrays.
2.4.2.1 Silicon Microtubes
The inclusion of a lumen in solid silicon microneedles seems to be a logical step
during the early design of hollow microneedles. Hollow silicon microtubes were
fabricated by first defining the lumen by etching through silicon wafer thickness using
deep reactive ion etching (DRIE) technique in an inductively coupled plasma reactive ion
etcher (ICP-RIE) (McAllister 2000). This DRIE process involves a deposition step in
which all surfaces including the trench sidewalls are coated with a teflon-like protective
layer, etching step in which protective layer is selectively removed from the trench floors
by high ion bombardment and a subsequent etch step to remove the silicon. Thus, it
allows a deep and anisotropic etching process. After the lumen is defined, a concentric
hole surrounding the lumen must be etched to create hollow microtubes using ICP-RIE
(shown below in Figure 2.9).

22
Figure 2.9 Hollow silicon microtubes fabricated using deep reactive ion etching (McAllister 2000).
The microtubes measure 150 μm in height, with 80 μm outer diameter, 40 μm inner
diameter and 300 μm center-to-center spacing.
2.4.2.2 Silicon Microneedles
Arrays of hollow silicon microneedles (as further refinement of hollow tubes
presented above) were fabricated using standard photolithography and isotropic-
anisotropic etching combination (Stoeber and Liepmann 2000). The fabrications steps
started with silicon dioxide coating on a silicon wafer, patterning the backside of the
wafer with circular mask and etching all the way through the wafer stopping on the upper
oxide layer to define the needle lumen. Silicon nitride was then deposited to act as etch
stop within the lumen. A larger circular mask was patterned on the frontside and then
underetched to create the tapering effect of the needle. Both silicon dioxide and silicon
nitride layers were then removed. Symmetrical and asymmetrical (tapered) needle
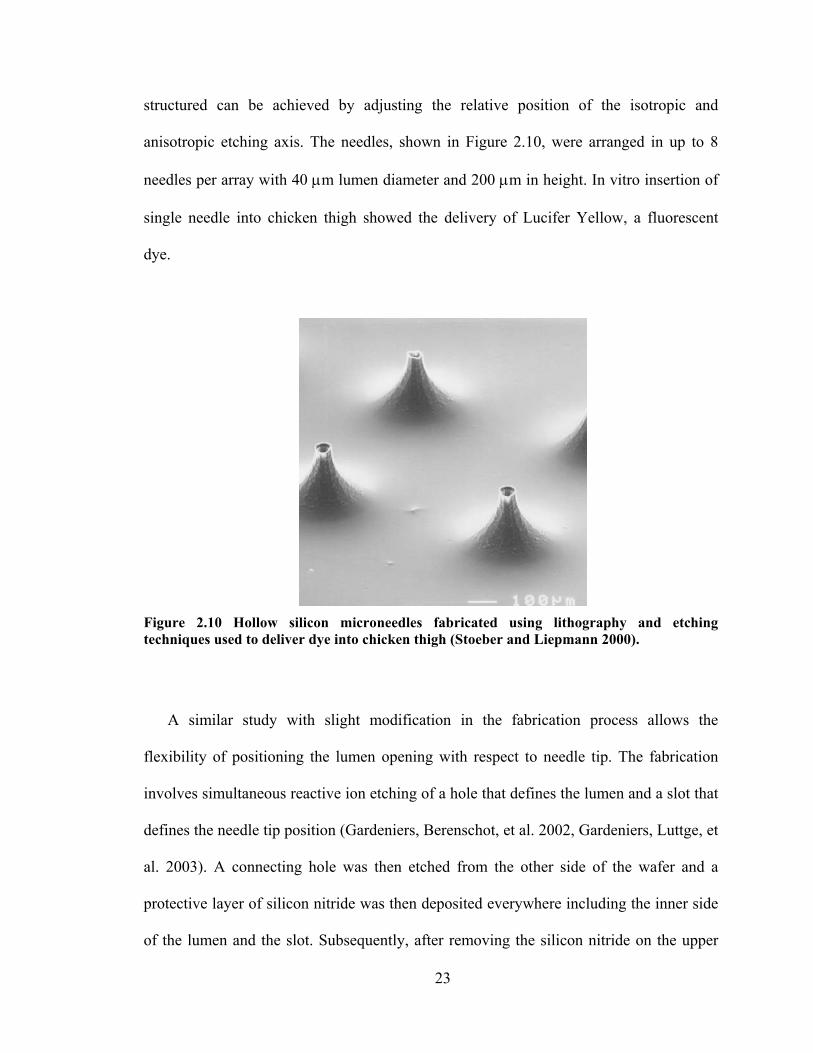
23
structured can be achieved by adjusting the relative position of the isotropic and
anisotropic etching axis. The needles, shown in Figure 2.10, were arranged in up to 8
needles per array with 40 μm lumen diameter and 200 μm in height. In vitro insertion of
single needle into chicken thigh showed the delivery of Lucifer Yellow, a fluorescent
dye.
Figure 2.10 Hollow silicon microneedles fabricated using lithography and etching techniques used to deliver dye into chicken thigh (Stoeber and Liepmann 2000).
A similar study with slight modification in the fabrication process allows the
flexibility of positioning the lumen opening with respect to needle tip. The fabrication
involves simultaneous reactive ion etching of a hole that defines the lumen and a slot that
defines the needle tip position (Gardeniers, Berenschot, et al. 2002, Gardeniers, Luttge, et
al. 2003). A connecting hole was then etched from the other side of the wafer and a
protective layer of silicon nitride was then deposited everywhere including the inner side
of the lumen and the slot. Subsequently, after removing the silicon nitride on the upper

24
layer, wet-etching in basic solution creates taper structure bound by slow-etching {111}
silicon plane. The protective layer was then removed to leave hollow beveled silicon
needle structures (shown in Figure 2.11) which measure 400 μm tall, 70 μm hole
opening, 250 μm base and approximately 40 μm center hole distance from the needle tip.
These needles were shown to insert into human skin and withdraw blood by capillary
action.
Figure 2.11 Hollow beveled silicon microneedles used to withdraw blood by capillary action in human skin (Gardeniers, Berenschot, et al. 2002, Gardeniers, Luttge, et al. 2003).
2.4.2.3 Polymer Microneedles
Hollow polymer microneedles were fabricated using the combination of conventional
LIGA (lithography, electroplating and molding) and inclined hard x-ray exposure (Moon,
Sang-Jun, et al. 2003). The first step involved the mask fabrication for hard x-ray
patterning. The x-ray exposure composed of two steps: standard vertical exposure that
defined the needle base and vertical structure and inclined x-ray exposure that created the

25
sharp needle tip. These PMMA (polymethylmethacrylate) needles are 470 μm in base,
900 μm in height, has 20° side-wall angle, 750 μm center-to-center spacing and arranged
in an 120 needles/cm2 density array. These needles, shown in Figure 2.12, were reported
to insert into human skin for blood extraction purpose.
Figure 2.12 Hollow polymer microneedles fabricated using inclined x-ray exposure used to extract blood in human skin (Moon, Sang-Jun, et al. 2003).
2.4.2.4 Metal Microtubes
Hollow metal microtubes were fabricated either by photolithographically defining
holes in SU-8 or by using silicon micromolds consisting of cylindrical holes created by
DRIE through silicon wafers (McAllister 2000). The first method consisted of few
different steps including depositing a thin titanium adhesion layer onto a substrate
(silicon wafer or glass slide) before coating the substrate with SU-8. The SU-8 was then
lithographically patterned into arrays of circular holes and eventually separated from the
substrate by removing the titanium layer to yield SU-8 molds of cylindrical holes.
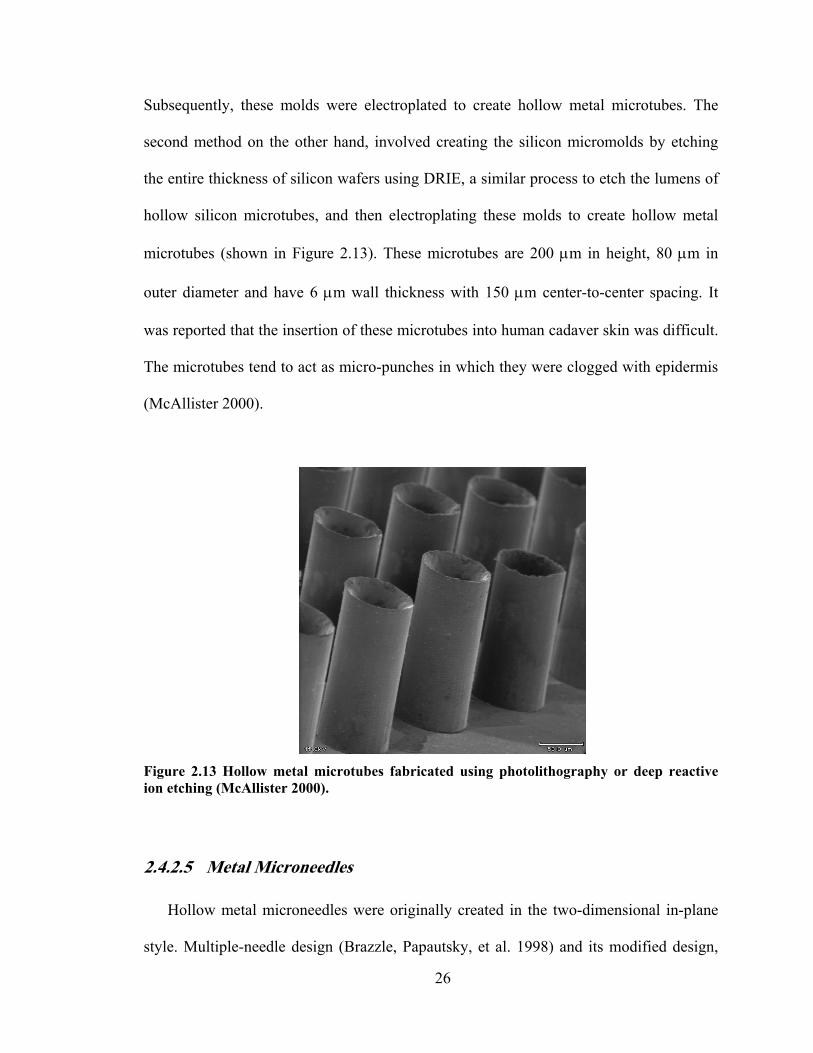
26
Subsequently, these molds were electroplated to create hollow metal microtubes. The
second method on the other hand, involved creating the silicon micromolds by etching
the entire thickness of silicon wafers using DRIE, a similar process to etch the lumens of
hollow silicon microtubes, and then electroplating these molds to create hollow metal
microtubes (shown in Figure 2.13). These microtubes are 200 μm in height, 80 μm in
outer diameter and have 6 μm wall thickness with 150 μm center-to-center spacing. It
was reported that the insertion of these microtubes into human cadaver skin was difficult.
The microtubes tend to act as micro-punches in which they were clogged with epidermis
(McAllister 2000).
Figure 2.13 Hollow metal microtubes fabricated using photolithography or deep reactive ion etching (McAllister 2000).
2.4.2.5 Metal Microneedles
Hollow metal microneedles were originally created in the two-dimensional in-plane
style. Multiple-needle design (Brazzle, Papautsky, et al. 1998) and its modified design,
27
single-needle design with multiple output ports (Brazzle, Mohanty, et al. 1999), were
both fabricated in similar fashion. The underside of the needles was formed by selectively
electroplating palladium onto a silicon wafer. The inner dimension of the needles was
defined by patterning a thick photoresist sacrificial layer. The sidewalls and top surfaces
of the needles were defined by first coating a seed layer onto the photoresist continued by
the electroplating of palladium onto this seed layer. To yield the final needle structures,
the photoresist and the underlying seed layer were then removed. The multiple-needle
design had 20 μm by 40 μm microchannels with 20 μm wall thickness and arranged in a
25-needle linear arrays with 200 μm center-to-center spacing. These needles were
proposed both as microhypodermic needles and for use in sustained transdermal drug
delivery, although not shown. The single-design with multiple ports had 140 μm by 20
μm channel size, shaft dimensions of 200 μm by 60 μm, tip dimensions of less than 15
μm by 15 μm, a distance of 300 μm from tip to first outlet port and was 6 mm in length
(both designs are shown in Figure 2.14).
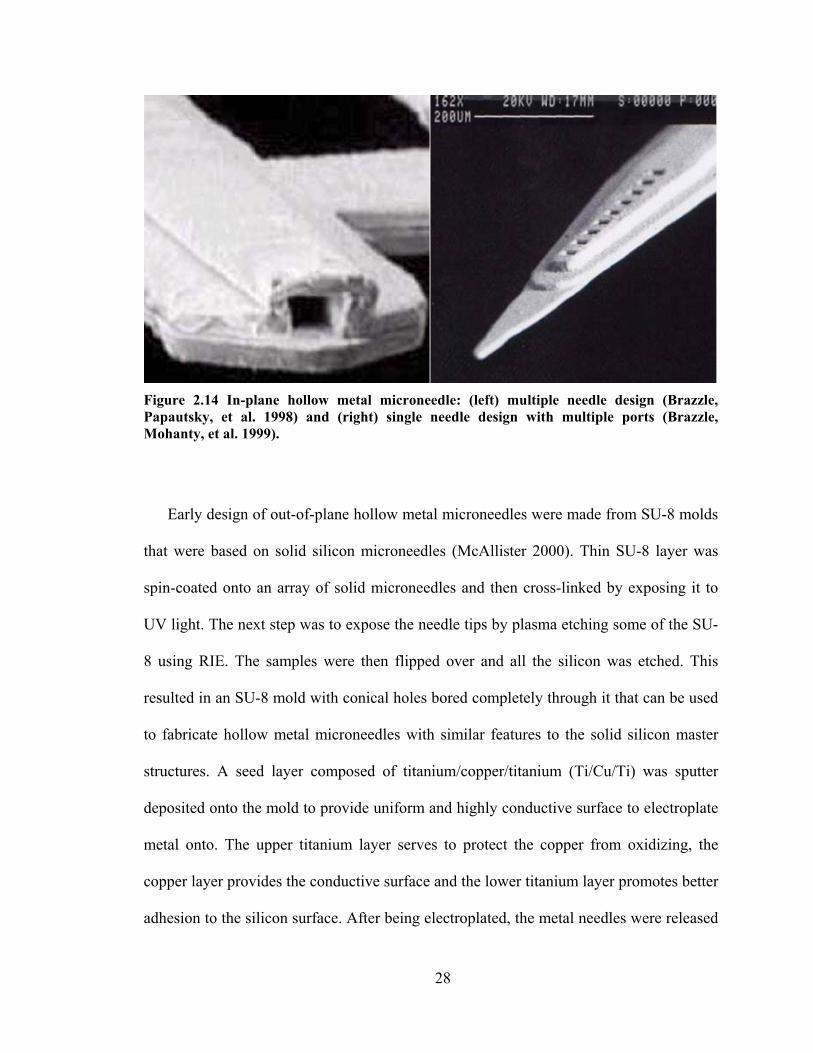
28
Figure 2.14 In-plane hollow metal microneedle: (left) multiple needle design (Brazzle, Papautsky, et al. 1998) and (right) single needle design with multiple ports (Brazzle, Mohanty, et al. 1999).
Early design of out-of-plane hollow metal microneedles were made from SU-8 molds
that were based on solid silicon microneedles (McAllister 2000). Thin SU-8 layer was
spin-coated onto an array of solid microneedles and then cross-linked by exposing it to
UV light. The next step was to expose the needle tips by plasma etching some of the SU-
8 using RIE. The samples were then flipped over and all the silicon was etched. This
resulted in an SU-8 mold with conical holes bored completely through it that can be used
to fabricate hollow metal microneedles with similar features to the solid silicon master
structures. A seed layer composed of titanium/copper/titanium (Ti/Cu/Ti) was sputter
deposited onto the mold to provide uniform and highly conductive surface to electroplate
metal onto. The upper titanium layer serves to protect the copper from oxidizing, the
copper layer provides the conductive surface and the lower titanium layer promotes better
adhesion to the silicon surface. After being electroplated, the metal needles were released
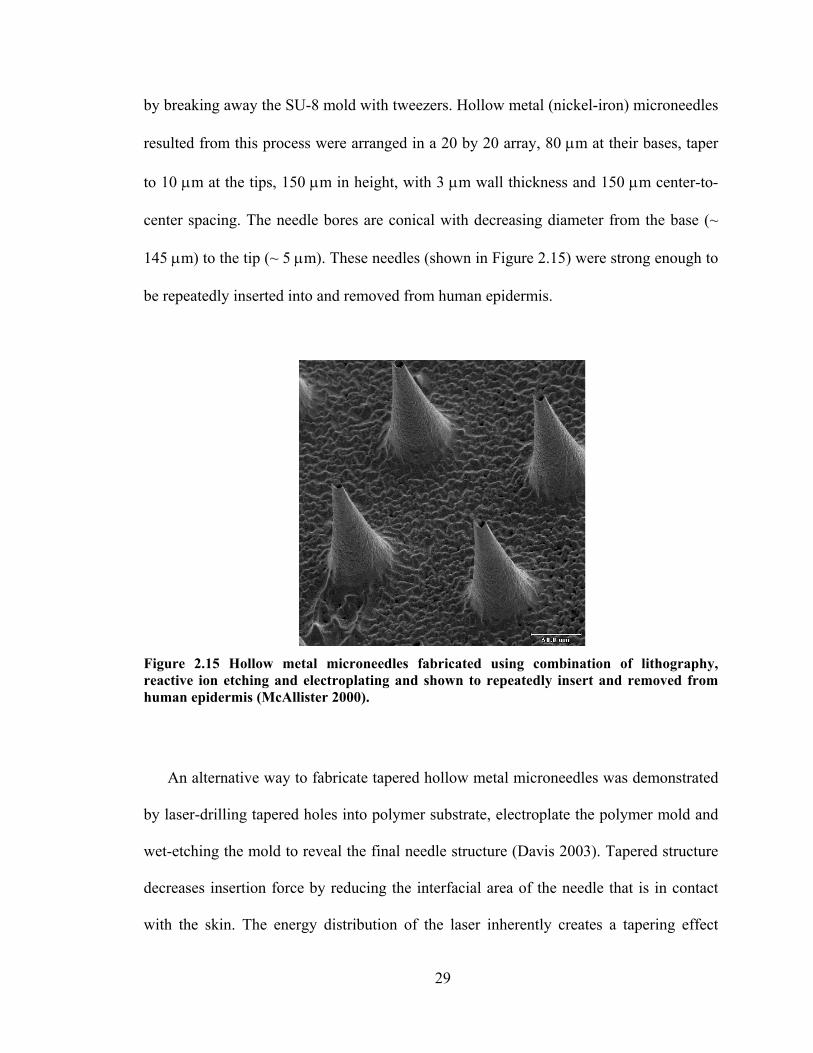
29
by breaking away the SU-8 mold with tweezers. Hollow metal (nickel-iron) microneedles
resulted from this process were arranged in a 20 by 20 array, 80 μm at their bases, taper
to 10 μm at the tips, 150 μm in height, with 3 μm wall thickness and 150 μm center-to-
center spacing. The needle bores are conical with decreasing diameter from the base (~
145 μm) to the tip (~ 5 μm). These needles (shown in Figure 2.15) were strong enough to
be repeatedly inserted into and removed from human epidermis.
Figure 2.15 Hollow metal microneedles fabricated using combination of lithography, reactive ion etching and electroplating and shown to repeatedly insert and removed from human epidermis (McAllister 2000).
An alternative way to fabricate tapered hollow metal microneedles was demonstrated
by laser-drilling tapered holes into polymer substrate, electroplate the polymer mold and
wet-etching the mold to reveal the final needle structure (Davis 2003). Tapered structure
decreases insertion force by reducing the interfacial area of the needle that is in contact
with the skin. The energy distribution of the laser inherently creates a tapering effect

30
during the drilling of the polymer substrate. A Ti/Cu/Ti seed layer was then sputter-
deposited onto the mold prior to nickel electroplating. The sacrificial mold was then
removed by wet-etching process in basic (KOH or NaOH) solution to yield tapered
hollow metal microneedles (shown in Figure 2.16). For many applications, multi-needle
microneedle arrays are especially interesting, because they can deliver more drug and
provide redundancy not offered by single needles. Figure 2.16 shows an array of
microneedles each with a height of 500 μm, base diameter of 300 μm, tip diameter of 75
μm, and wall thickness of 10 μm arranged in a 4 x 4 (i.e., 16-needle) array with 600-μm
needle-to-needle spacing. As shown in the image, the height of each microneedle is
similar to the width of a conventional hypodermic needle.
Figure 2.16 Array of tapered hollow metal microneedles shown next to the tip of a 27 gauge hypodermic needle (Davis 2003).

31
2.4.3 Integrated Microneedle Devices
Advancements in microfabrication field, especially in MEMS led into the possibility
of creating an integrated device in which additional functionality such as sensing or
pumping unit is incorporated with microneedles. Biopotential electrodes that consists of
silver-silver chloride (Ag/AgCl)-coated silicon microneedle arrays (2 mm by 2 mm) were
fabricated using deep reactive ion etching process (Griss, Enoksson, et al. 2001). These
needle electrodes demonstrated low electrode-skin-electrode impedance thus allowing
high quality recording of low-level biopotentials without the need of an electrolytic gel.
Figure 2.17 Silver coated silicon spikes used as biopotential electrodes (Griss, Enoksson, et al. 2001).
Another type of integrated microneedle device was fabricated by adding a sensing
unit to an in-plane needle. A similar in-plane single-needle design with multiple outlet
ports (Brazzle, Mohanty, et al. 1999) described above was incorporated with a
bioluminescence biosensor located in inner side of the needles (Brazzle, Bartholomeusz,

32
et al. 2000). Bioluminescence that reflects metabolic reaction is based on the light change
intensity that is stoichiometrically related to time-dependent adenosine triphosphate
(ATP) change (Chandrasekaran and Frazier 2002, Chandrasekaran, Mohanty, et al.
2003).
There are few other examples of integrated microneedle devices. Hollow silicon
microneedles (Stoeber and Liepmann 2000) described above were incorporated with blue
and polystyrene fluorescent beads-contained PDMS reservoir on the backside of the
needles. These needles were inserted into chicken breast to demonstrate the delivery of
the beads into different target depths. The deflection of the PDMS reservoir driven by
thumb push allowed the fluid to flow (Stoeber and Liepmann 2002). A further extension
for the use of these hollow silicon microneedles was demonstrated in a minimally-
invasive self-calibrating glucose monitoring system (Zimmermann, Fienbork, et al.
2003). Once the needle was filled with interstitial fluid (ISF), glucose diffused through
the integrated porous dialysis membrane into dialysis fluid and this fluid pumped past an
integrated flow-through enzyme-based glucose sensor (the integrated device is shown in
Figure 2.18).

33
Figure 2.18 Prototype of microneedle-based glucose sensor which incorporates array of 8 hollow 200-μm tall silicon microneedles with glucose sensor located in the Pyrex® flow channel underneath (Zimmermann, Fienbork, et al. 2003).
Another type of hollow silicon microneedles integrated with microfluidic channels
(shown in Figure 2.19) was used in transdermal ISF extraction (Mukerjee, Collins, et al.
2004, Mukerjee, Isseroff, et al. 2003). The needles were fabricated using the combination
of wet and dry etching, wafer sawing and anodic bonding to glass. The needles were 15
μm2 in tip opening, 250 μm tall, with center-to-center spacing of 300 μm. The
microchannels were also made using DRIE technique with 80 μm in width. Insertion into
human skin showed needles’ ability to withdraw ISF by capillary action.
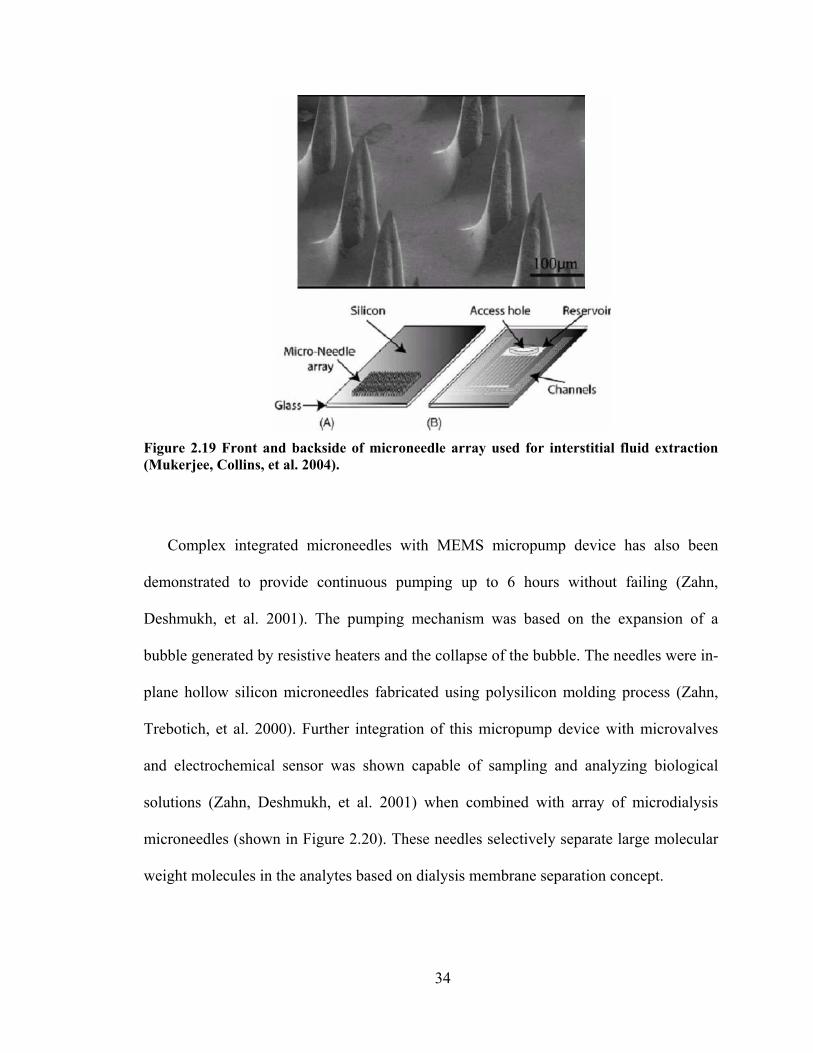
34
Figure 2.19 Front and backside of microneedle array used for interstitial fluid extraction (Mukerjee, Collins, et al. 2004).
Complex integrated microneedles with MEMS micropump device has also been
demonstrated to provide continuous pumping up to 6 hours without failing (Zahn,
Deshmukh, et al. 2001). The pumping mechanism was based on the expansion of a
bubble generated by resistive heaters and the collapse of the bubble. The needles were in-
plane hollow silicon microneedles fabricated using polysilicon molding process (Zahn,
Trebotich, et al. 2000). Further integration of this micropump device with microvalves
and electrochemical sensor was shown capable of sampling and analyzing biological
solutions (Zahn, Deshmukh, et al. 2001) when combined with array of microdialysis
microneedles (shown in Figure 2.20). These needles selectively separate large molecular
weight molecules in the analytes based on dialysis membrane separation concept.

35
Figure 2.20 Integrated microfluidic device consists of micropump, microdialysis microneedles, microvalves and glucose sensor (Zahn, Deshmukh, et al. 2001).
2.5 Fluid Flow through Microneedles
Understanding the fluid dynamics of microneedles is important because microneedles
can be used to flow drug solutions into skin or flow other fluids for other microfluidic
applications. Hollow microneedles can increase drug transport by allowing fluid flow
through their lumens. The pressure drop required to flow fluid through a microneedle
depends on needle geometry and fluid viscosity and density. Needles of micron
dimensions can exhibit significant resistance to flow. In the context of transdermal drug
delivery applications, measurement and prediction of microneedle fluid dynamics is
needed to design needles that balance between geometries small enough to avoid pain,
sharp enough to easily insert into skin, and large enough to permit useful flow rates at
reasonable pressures. A preliminary study of fluid flow using hollow microneedles
showed that a large flow rate of water (10 – 50 ml/min) can be flowed through an array of
100 hollow silicon microneedles at modest pressure (0.8 – 3.2 psi) (McAllister 2000).

36
Hollow metal microtubes mounted on standard 1 ml syringes have also been used to
lower the blood glucose level in diabetic rats in vivo by the injection of insulin (data not
shown) (McAllister 2000).
Nevertheless, there have been some limitations of using microneedles for flowing
fluids through into skin. Needle clogging with tissue, fluid leaking back out of skin
through parallel pathways along the outer needle shaft, and fluid blocking due to rigid
microstructure of skin were observed. Needle clogging caused by tissue pieces prevented
fluid passage into skin. Fluid leaking during injection causes ineffective injection. Fluid
passage and absorption can also be prevented because of rigid microstructure of skin.
There has been a growing interest in characteristic studies of fluid flow inside small
microchannels in general (Gad-el-Hak 1999, Mala and Li 1999, Papautsky, Brazzle, et al.
1998, Stone and Kim 2001) as well as inside microneedles (Brazzle, Papautsky, et al.
1998, Chandrasekaran and Frazier 2003, Griss and Stemme 2003, Stoeber and Liepmann
2000) . However, none of these studies considered fluid flow through a conical structure
channel. The study of fluid flow through conical macro-scale channels has been of
interest for a century. Approximate analytical solutions have been derived with the
assumption of creeping flow, limited contraction factor, and small taper angle (Kwon,
Shen, et al. 1986, Oka 1964, Sutterby 1964). Despite some experimental study
(Kemblowski and Kiljanski 1975) and extensive numerical analysis study of fluids in
macro-scale conical channels (Garrioch and James 1997, Jarzebski and Wilkinson 1981),
there has been no experimental study associated with fluids in a micro-scale conical
structure. In addition to that, the experimental study of fluid flow through conical

37
channels at a high Reynolds number in which inertial effect dominates viscous effect is
very limited.

38
3 METHODS
3.1 Fluid Dynamics of Microneedles2
3.1.1 Experimental Methods
To quantify the relationship between applied pressure drop and flow rate as a function
of microneedle geometry, polyester films (Mylar, DuPont Teijin Films, Wilmington, DE)
were drilled using a 248-nm wavelength UV Excimer Laser (ATLEX 300i, Resonetics
Micromaster, Nashua, NH) operated at 200 Hz and an energy density of 2.0 J/cm2 to
create microneedle molds of defined length Ln, inlet diameter Di, tip diameter Dt, and
cone half-angle θc. Mylar was chosen as material of interest for the mold because of its
relatively low cost and ease of removal during processing. The molds were then cleaned
by wiping the surface with methanol (Sigma Aldrich, St. Louis, MO) to remove residual
surface contamination from the laser drilling process. Mold dimensions were determined
using a digital stereomicroscope (Quadra Chek 200, Metronics Incorporated, Bedford,
NH). To account for imperfections in geometry, effective needle tip diameter was
calculated based on the area of the needle bore at the tip, assuming a circular geometry
(LSM 510 Image Browser, Zeiss, Germany). The creation of a conical structure with a
bigger entrance than its exit is made possible by tracing a pattern with the beam that will
have a greater fluence, or energy density, at the center of the circle than that at the
2 This work was carried out in collaboration with Prof. Marc Smith and was published in Martanto, W., Smith, M. K., Baisch, S. M., Costner, E. A. and Prausnitz, M. R. Fluid dynamics in conically tapered microneedles. AIChE J 51: 1599-1607 (2005).

39
exterior (Davis, Martanto, et al. 2005). Scanning electron micrographs of hollow
microneedles and the polymer mold used to make a microneedle are shown in Figure 3.1.
Figure 3.1 Scanning electron micrographs of hollow microneedles. (A) An array of microneedles is shown next to the tip of a 30-gauge hypodermic needle. (B) A single microneedle is shown from a side view. (C) The polymer mold used to make that needle is shown from above. Needle and mold dimensions are Ln = 500 μm, Di = 220 μm, Dt = 56 μm, and θc = 9˚
To simplify the experimental protocol, fluid flow measurements were not made on
microneedles, but were made on the molds used to fabricate microneedles. Although
details of surface properties and orifice geometries differ between polymer molds and
metal needles, we expect that molds and needles having the same internal geometry will
still produce similar flow fields when given the same pressure drop.

40
The fluids used in this study were filtered deionized water, glycerin solutions, and
bovine calf blood (in Alsevers anticoagulant, Rockland Immunochemicals, Gilbertsville,
PA). The pressure drop measurement for deionized water was performed at room
temperature (~22°C). Because the viscosity of glycerin solutions and blood is sensitive to
temperature, studies with these fluids were performed in controlled-temperature rooms
(4°C for glycerin solutions and 37°C for blood to model body temperature). Glycerin
solutions were prepared by mixing filtered deionized water with glycerin (Fisher
Scientific, Suwanee, GA) to yield 0, 7, 36, and 48 wt% glycerin solutions.
The viscosity (Cannon Ubbelohde Viscometer, Cannon Instrument, State College,
PA) and density (BP 210S digital balance, Sartorius, Goettingen, Germany) of the
glycerin solutions with increasing glycerin content were determined at 4°C to be 1.0, 2.1,
5.1, and 9.8 mPa·s and 1.00, 1.00, 1.06, and 1.12 × 10³ kg/m3, respectively. Viscosity and
density of deionized water at 22°C was 1.0 mPa·s and 998 kg/m3, respectively, and blood
at 37°C was 1.7 mPa·s and 1.04 × 10³ kg/m3, respectively. Although blood exhibits non-
Newtonian behavior, comparison with previous measurements suggests that this viscosity
value is representative over the range of shear rates encountered in this study (Sushil,
Peach, et al. 2001) (1.3 × 10³ – 6.9 × 10⁴ s-1).
Pressure drop measurements were performed by flowing the solution of interest at a
constant flow rate from a syringe pump (Genie YA-12, Kent Scientific, Torrington, CT)
past a digital pressure gauge (Merigauge 3900-GI0100, Meriam Instrument, Cleveland,
OH) and through microneedle molds. The lower limit of flow rate used in the study was
determined by the minimum flow rate at which a continuous liquid jet was formed (i.e.,
not discrete droplets). The upper limit was determined by the flow rate at the maximum
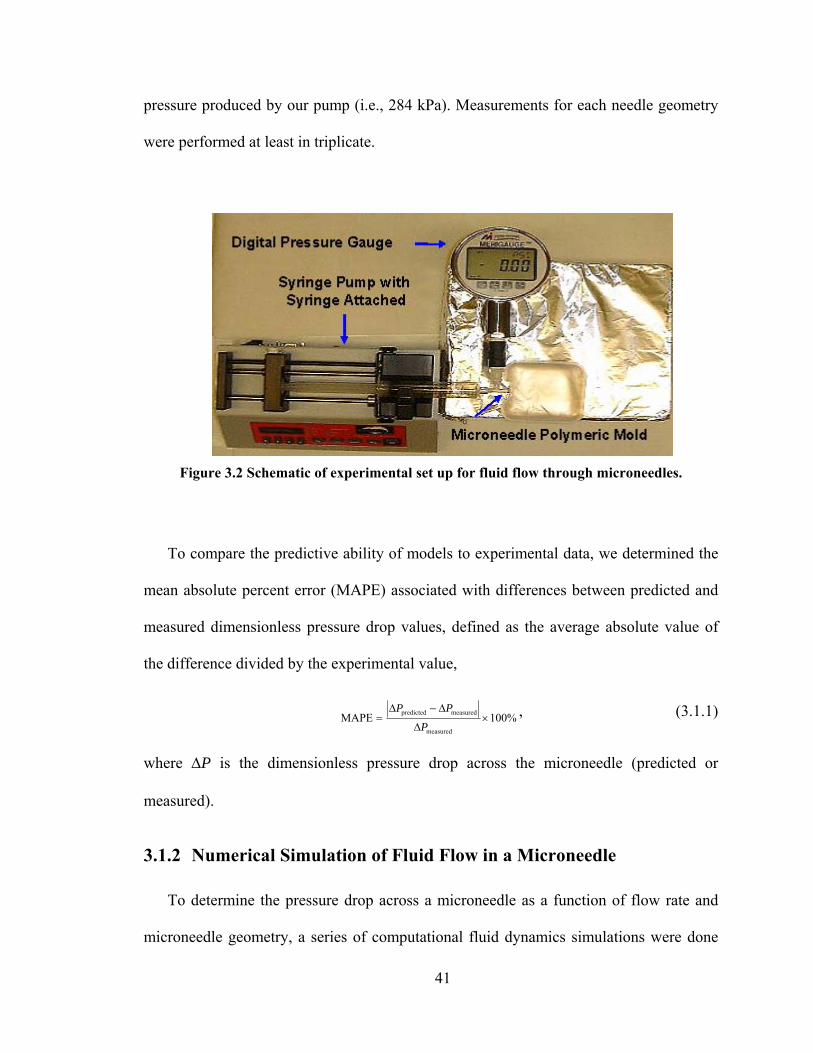
41
pressure produced by our pump (i.e., 284 kPa). Measurements for each needle geometry
were performed at least in triplicate.
Figure 3.2 Schematic of experimental set up for fluid flow through microneedles.
To compare the predictive ability of models to experimental data, we determined the
mean absolute percent error (MAPE) associated with differences between predicted and
measured dimensionless pressure drop values, defined as the average absolute value of
the difference divided by the experimental value,
%100MAPEmeasured
measuredpredicted ×Δ
Δ−Δ=
PPP , (3.1.1)
where ΔP is the dimensionless pressure drop across the microneedle (predicted or
measured).
3.1.2 Numerical Simulation of Fluid Flow in a Microneedle
To determine the pressure drop across a microneedle as a function of flow rate and
microneedle geometry, a series of computational fluid dynamics simulations were done
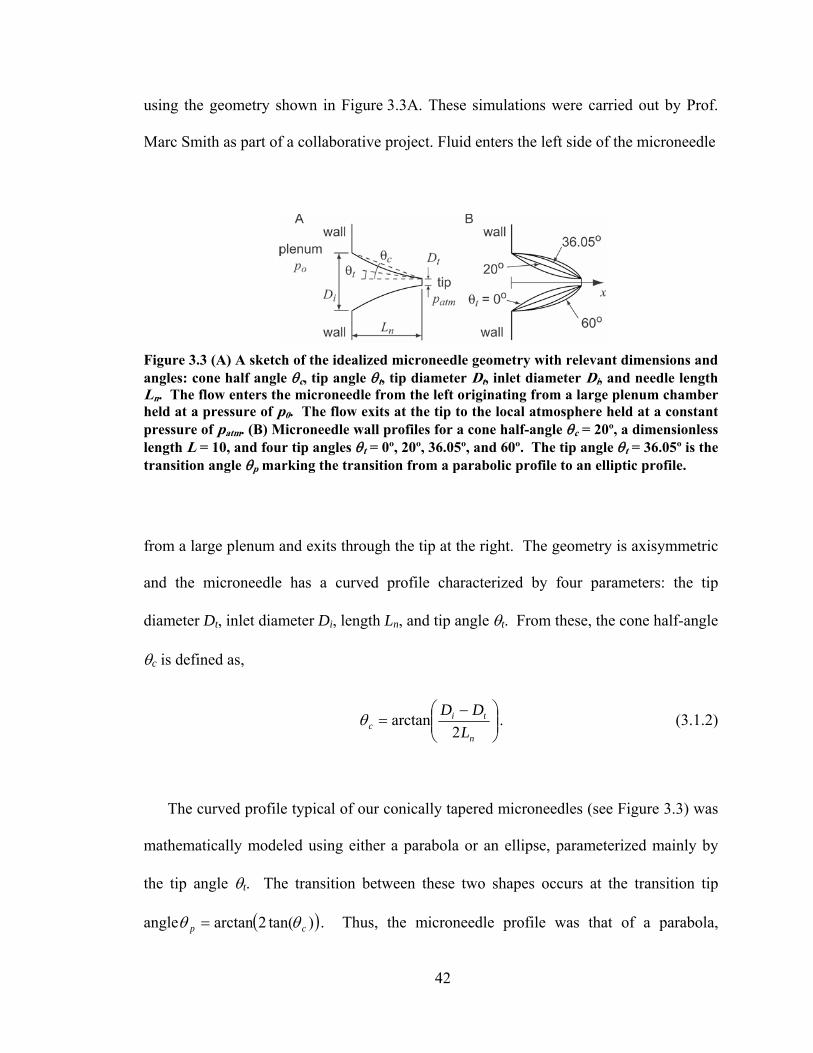
42
using the geometry shown in Figure 3.3A. These simulations were carried out by Prof.
Marc Smith as part of a collaborative project. Fluid enters the left side of the microneedle
Figure 3.3 (A) A sketch of the idealized microneedle geometry with relevant dimensions and angles: cone half angle θc, tip angle θt, tip diameter Dt, inlet diameter Di, and needle length Ln. The flow enters the microneedle from the left originating from a large plenum chamber held at a pressure of p0. The flow exits at the tip to the local atmosphere held at a constant pressure of patm. (B) Microneedle wall profiles for a cone half-angle θc = 20º, a dimensionless length L = 10, and four tip angles θt = 0º, 20º, 36.05º, and 60º. The tip angle θt = 36.05º is the transition angle θp marking the transition from a parabolic profile to an elliptic profile.
from a large plenum and exits through the tip at the right. The geometry is axisymmetric
and the microneedle has a curved profile characterized by four parameters: the tip
diameter Dt, inlet diameter Di, length Ln, and tip angle θt. From these, the cone half-angle
θc is defined as,
⎟⎟⎠
⎞⎜⎜⎝
⎛ −=
n
tic L
DD2
arctanθ . (3.1.2)
The curved profile typical of our conically tapered microneedles (see Figure 3.3) was
mathematically modeled using either a parabola or an ellipse, parameterized mainly by
the tip angle θt. The transition between these two shapes occurs at the transition tip
angle ( ))tan(2arctan cp θθ = . Thus, the microneedle profile was that of a parabola,
43
ellipse, or straight-sided cone when the tip angle satisfied the relations pt θθ ≤≤0 ,
pt θθ > , or ct θθ = , respectively. Examples of each of these profiles are shown in
Figure 3.3B. The tip diameter was used to scale the geometric parameters and so three
dimensionless parameters uniquely define this geometry: the dimensionless
length tn DLL /= , the cone half-angle θc, and the microneedle tip angle θt.
The flow model was axisymmetric, steady, incompressible, laminar, and Newtonian.
The viscosity μ and density ρ of the fluid were constant. The curved inlet to the flow
domain in the large plenum chamber to the left of the microneedle (not shown in Figure
3.3A) was held at the constant pressure p0. The flow outlet at the tip was held at a
constant atmospheric pressure patm. Two dimensionless groups characterize the flow in
the microneedle: the Reynolds number,
μ
ρ tDVRe = , (3.1.3)
and the dimensionless pressure drop,
2
21
0
V
ppP atm
ρ
−=Δ , (3.1.4)
where V is the average velocity at the microneedle tip.
The simulations were done using the computational fluid dynamics software
FLUENT (version 6.0, Lebanon, NH). The dimensionless parameters describing the
geometry of the microneedle – the length L, tip angle θt, and cone half-angle θc – were
varied over a wide range that included all experimental values. For each microneedle
profile, approximately 100 different flow rates were simulated so that the Reynolds

44
number varied over the range 10000 ≤≤ Re . The plenum size was selected as two inlet
diameters along the microneedle axis and along the wall, which was large enough so that
the pressure drop and mass flow rate through the needle were independent of plenum
size. Similarly, the mesh size selected was 80 elements per unit length in the
microneedle, which was large enough that the flow simulations were independent of
mesh size. The results reported here are accurate to less than 0.6% uncertainty for Re <
1, and the error rises to about 3% for Re = 1000.
3.2 Transdermal Delivery of Insulin
3.2.1 Solid Microneedles3
3.2.1.1 Microneedle Fabrication
Arrays of solid microneedles were fabricated by cutting needle structures from
stainless steel sheets (SS 304, 75 μm thick; McMaster-Carr, Atlanta, GA) using an
infrared laser (Resonetics Maestro). Initially, the shape and orientation of the arrays were
drafted in a CAD file (AutoCAD; Autodesk, Cupertino, CA), which was then converted
to the file type required by the laser control software (Oregon Microsystems, Beaverton,
OR). The laser beam traced the desired shape of the needle, which ablated the metal sheet
and created the needles in the plane of the sheet. The pattern was traced at a rate of 1
mm/s with a constant 30 psi airflow for cooling and debris removal. The laser was
3 This work was published in Martanto, W., Davis, S. P., Holiday, N. R., Wang, J., Gill, H. S. and Prausnitz, M. R. Transdermal delivery of insulin using microneedles in vivo. Pharm Res 21: 947-952 (2004).
45
operated at 1000 Hz at an energy density of 20 J/cm2 and required approximately 4 min
to cut an array.
The metal sheet with needles on it was cleaned in hot soapy water (Alconox, White
Plains, NY) and rinsed with DI water. Each needle was then manually bent at 90º out of
the plane of the sheet. The needles were electropolished in a bath containing a 6:3:1
mixture by volume of glycerin, phosphoric acid, and water (Fisher Scientific) to remove
debris (Graham 1971, Hensel 2000). It was operated at 110o C and the sample was
manually agitated during the polishing process. The sample was biased with a positive
charge relative to a copper electrode to generate a current density of 130 mA/cm2. The
sample was polished for 2.5 minutes and then rinsed for 15 seconds in DI water followed
by 15 seconds in 15% nitric acid. This rinse cycle was repeated and then the entire cycle
(polishing and rinsing) was repeated for a total polishing time of 5 minutes. After
polishing the sample was rinsed with hot water for 1 minute followed by a thorough
rinsing in DI water. This electropolishing process reduced the needle thickness to 50 μm.
3.2.1.2 Diabetic Animal Model
To generate a diabetic animal model, Sprague-Dawley hairless rats (male, 250-350 g,
Charles River Laboratories, Wilmington, MA) were injected with 100 mg/kg
streptozotocin (Sigma) in sterile Dulbecco’s phosphate buffered saline without Ca or Mg
(PBS, pH 7.4; Mediatech, Herndon, VA) by tail vein injection. Over the next day,
diabetes developed due to destruction of pancreatic islet cells by streptozotocin
(Tomlinson, Gardiner, et al. 1992). The use of hairless rats in this study was approved by
the Georgia Tech IACUC and adhered to the NIH "Principles of Laboratory Animal
Care." The next day, successful induction of diabetes was verified by checking that blood
46
glucose levels were at least 300 mg/dl (Accu-Chek Compact; Roche Diagnostics,
Indianapolis, IN). Diabetic rats were then anesthetized by intraperitoneal injection of
1300 mg/kg urethane (Sigma) at a concentration of 200 mg/ml in PBS. Blood glucose
measurements were obtained using blood samples collected by lateral tail vein laceration.
After establishing a stable baseline blood glucose level between 300 – 475 mg/dl with
less than 20% variation over the course of approximately 1 h, the experiments were
started.
3.2.1.3 Insulin Delivery Experiments
To test the ability of microneedles to increase skin permeability to insulin, a
microneedle array was inserted into the skin at a site on the rat’s lower back using a
pneumatically-driven insertion device at 30 psi (~ 10 m/s) (Bionic Technologies, Salt
Lake City, UT). This device was developed to minimize damage during insertion of
microelectrode arrays into neural tissue and adapted for use on skin (Rousche and
Normann 1992). Previous studies of microneedles for transdermal drug delivery have
used similar insertion devices (Matriano, Cormier, et al. 2002). In some cases, the needle
array was repeatedly inserted (for 10 s) and removed, five times at the same site. A 6-mm
diameter flanged glass chamber was then adhered to the skin around the array using
cyanoacrylate glue (Loctite, Rocky Hill, CT) and filled with a solution containing
Humulin-R insulin (Eli Lilly, Indianapolis, IN) at a concentration of 100 U/ml unless
otherwise noted. Microneedles were removed using forceps 10 s, 10 min, or 4 h after
adding the insulin solution. The insulin solution was kept in the chamber in contact with
the rat’s skin for 4 h in all experiments. Blood glucose measurements were made every
30 min by lateral tail vein laceration (Accu-Chek Compact).
47
After the 4-h insulin delivery period, the insulin solution was removed from the skin.
In some cases, the skin was cleaned with DI water and blood glucose measurements were
continued every 30 min for another 4 h. In most cases, 0.2 – 0.5 ml of blood was
collected using intracardiac puncture or orbital puncture immediately before euthanasia
using 0.22 ml/kg Beuthanasia (Schering-Plough Animal Health Corporation, Omaha,
NE). These blood samples were centrifuged at 2040 × g (Eppendorf Centrifuge 5415 C,
Westbury, NY) for 5 min to collect plasma, which was then stored at -70°C until analysis
using a human insulin-specific radioimmunoassay (Linco Research, St. Charles, MO) to
determine plasma levels of insulin delivered to the rats. Because the assay was specific to
human insulin, it measured only the exogenous insulin delivered to the rat and not the
rat’s endogenous insulin.
As a negative control experiment, the same protocol was followed, except no
microneedles were applied to the skin (i.e., insulin solution was placed passively on the
skin for 4 h). As positive control experiments, 50 μl of Humulin-R insulin diluted with
PBS to different concentrations (0.05 U/ml, 0.5 U/ml, and 1.5 U/ml) was administered
subcutaneously with an insulin syringe and hypodermic needle (29G U-100; Terumo
Medical, Elkton, MD).
To facilitate imaging needle penetration pathways within skin, additional experiments
were performed in which a solution of blue dye (Tissue Marking Dye; Shandon,
Pittsburg, PA) was placed onto the skin instead of insulin and a 10 s microneedle
insertion time was used. After 2 min, the dye was washed off the skin surface and a skin
biopsy was obtained with an 8-mm punch (Tru-Punch; Sklar Instruments, West Chester,
PA) around the microneedle insertion site and imaged using bright field microscopy

48
(Leica DC 300; Leica Microsystems, Bannockburn, IL). In other experiments,
microneedles were inserted into skin and a biopsy was taken with the needles remaining
in the skin. These samples were fixed using 10% neutral buffered formalin for at least 24
h, dehydrated using ethanol and xylene, and incubated in methyl methacrylate infiltration
solution (Fisher Scientific) for 72 h before being embedded in methyl methacrylate and
submerged in water for 48 h (Bancroft and Gamble 2002). Samples were coarse-trimmed
(Isomet 1000 Precision Saw; Buehler, Lake Bluff, IL) and then sectioned into 200 μm
strips (Ecomet 3 Variable Speed Grinder; Buehler) before surface staining for 10 s at 55
ºC (Sanderson’s Rapid Bone; Surgipath Medical Industries, Richmond, IL) and
examination by bright field microscopy.
3.2.1.4 Statistical Analysis
At each condition and time point tested, replicate blood glucose samples from at least
three different rats were measured, from which the mean and standard deviation were
calculated. A two-tailed Student’s t-test (α = 0.05) was performed when comparing two
experimental conditions. When comparing three or more experimental conditions, a one-
way analysis of variance (ANOVA α = 0.05) was performed. A two-way analysis of
variance (ANOVA α = 0.05) was performed when comparing two factors. In all cases, a
value of p < 0.05 was considered statistically significant.

49
3.2.2 Hollow Microneedles4
3.2.2.1 Microneedle Fabrication
Using the method developed by Dr. Shawn Davis (Davis 2003), hollow metal
microneedles were fabricated by first creating the molds. Following a similar process to
make polymer molds (shown in Section 3.1.1), an ultraviolet laser (Resonetics
Micromaster) operating at 200 Hz with a 248-nm wavelength and a typical energy
density of 2.0 J/cm2 was used to drill holes through sheets of polyethylene terephthalate
(Mylar, Dupont).
To create a tapered geometry hole, the drilling program was set to trepan, or trace, a
circular path with a diameter less than the diameter of the laser beam. Strong laser
fluence generated in the center and an annular region of weaker fluence generated around
it, produced a tapered hole. To achieve a needle mold with a desired base diameter (dbase)
and tip diameter (dtip), the following expressions were used to determine the required
laser beam diameter (dbeam) and trepan diameter (dtrepan):
2basetip
beam
ddd
+= (3.2.1)
tipbeamtrepan ddd −= (3.2.2)
These parameters, combined with the thickness of the Mylar substrate, which
governed the needle mold length, determined the final microneedle geometry. The
geometry used for in vivo experiments in this study had a 300-μm base diameter and a
4 This work was carried out in collaboration with Dr. Shawn Davis and was published in Davis, S. P., Martanto, W., Allen, M. G. and Prausnitz, M. R. Hollow metal microneedles for insulin delivery to diabetic rats. IEEE Trans Biomed Eng 52: 909-915 (2005).

50
75-μm tip diameter through a 500-μm sheet. This corresponded to a 187.5-μm beam
diameter and a 112.5-μm trepan diameter.
To allow electroplating of the insulating polymer mold, a titanium-copper-titanium
(with 35 nm, 650 nm and 35 nm thickness, respectively) seed layer was then deposited on
the top and sidewalls of the polymer molds using direct current sputtering (CVC 601,
Rochester, NY). Nickel was electroplated onto the mold to create a microneedle using a
Watts formulation bath (Technic, Cranston, RI) at 54oC (Schlesinger and Paunovic 2000)
at a nickel deposition rate of approximately 10 μm/hr. The voltage was adjusted to
maintain a constant current density of 10 mA/cm2. Plating proceeded for 5 min under
these conditions to form the initial “strike” layer on the mold. The mold was then
removed from the bath and rinsed in DI water. A sheet of powder coating tape (Shercon,
Santa Fe Springs, CA) was then placed across the bottom of the mold to prevent over-
plating at the microneedle tip due to current crowding. The duration of plating
determined the thickness of the microneedle walls and the array’s base.
Metal microneedle arrays were released from polymer molds in the final step of
fabrication. Mylar molds were removed in a concentrated caustic solution (1 N, NaOH,
boiling) after approximately 20 min for a 500-μm thick mold.
3.2.2.2 Insulin Delivery Experiments
To assess the ability of hollow microneedles to delivery insulin and modulate blood
sugar levels in a diabetic animal (diabetic induction is the same as the one described in
Section 3.2.1.2), an array of hollow microneedles (fabricated methods described in
Section 3.2.2.1) was inserted into the skin of an anesthetized, diabetic, hairless rat
(insertion method described in Section 3.2.1.3). In this set-up, drug solution was not in
51
direct contact with skin; insulin could transport into the skin only through the hollow
bores of the microneedles. As a negative control experiment, the same protocol was
followed, except no microneedles were applied to the skin (i.e., insulin solution was
placed passively on the skin for 4 h). As positive controls, 0.05 and 0.5 U of insulin were
injected subcutaneously using a 29-gauge hypodermic needle and syringe. To measure
changes in blood glucose level, 10-μl blood samples were collected by tail vein laceration
every 30 min for 8 h and assayed using a glucose test strip (Accu-Chek Compact).
Insulin was kept in the reservoir during a 4-h delivery period, after which the reservoir
was emptied and rats were monitored for an additional 4 h.
In a separate set of experiments, plasma insulin concentration was measured by
collecting two 0.5-ml blood samples: an orbital collection 30 min after starting insulin
delivery and an intracardiac collection at 4 h. Blood samples were immediately
centrifuged at 2040×g (Eppendorf Centrifuge 5415C) for 5 min and the plasma was
stored at -70 oC. The concentration of human insulin (i.e., Humulin R) was determined
by radioimmunoassay (Linco Research).
3.3 Microinfusion Using Hollow Microneedles
3.3.1 Glass Microneedle Fabrication
Although microneedles can be mass-fabricated using a variety of different methods as
single needles and multi-needle arrays made of a variety of different materials
(McAllister, Allen, et al. 2000, Reed and Lye 2004), we used single, glass microneedles
in this study because they can be quickly produced in various geometries for small-scale
laboratory use, are physiologically inert, and permit easy visualization of fluid flow.

52
Glass microneedles were fabricated by pulling fire-polished borosilicate glass pipettes
(o.d. 1.5 mm, i.d. 0.86 mm, BF150-86-15, Sutter Instrument, Novato, CA) using a
micropipette puller (P-97, Sutter Instrument). In most cases, the resulting blunt-tip
microneedles were then beveled (BV-10, Sutter Instrument) and cleaned using chromic
acid (Mallinckrodt, Hazelwood, MO), followed by filtered DI water and acetone (J. T.
Baker, Phillipsburg, NJ) rinses. Microneedle geometries were determined by bright-field
microscopy (Leica DC 300) and image analysis (Image Pro Plus, version 4.5, Media
Cybernetics, Silver Spring, MD). Microfabricated microneedles used in this study
typically had an effective tip opening radius of 22 – 48 μm with a tip bevel angle of 35 –
38º. Because the opening of a bevel-tip microneedle is oval in shape, the effective radius
was determined as the average of the half-lengths of the long and short axes of the
ellipse.
3.3.2 Skin Preparation
Human abdominal skin was obtained from cadavers from the Emory University Body
Donor Program and stored at -80 °C (Revco Ultima II, Kendro Laboratory Products,
Asheville, NC). After warming to room temperature and removing subcutaneous fat, skin
was hydrated in a Pyrex dish filled with phosphate-buffered saline (PBS; Sigma) for at
least 15 min prior to use. The skin was then cut into 4 cm x 4 cm pieces and stretched
onto a stainless steel specimen board with eight tissue-mounting pins on it to mimic the
tension of living human skin.

53
3.3.3 Infusion Experiments
To measure flow rate into skin during microneedle infusion, a single microneedle was
inserted into human cadaver skin to microinfuse sulforhodamine solution and the infusion
flow rate was measured over time. As an aid to visualizing flow into skin,
sulforhodamine-B dye (Molecular Probes, Eugene, OR) was added to PBS, stirred, and
filtered (0.2 μm pore size, Nalge Nunc International, Rochester, NY) to make 1 x 10⁻³ M
sulforhodamine solution. Either a 250 μl or 1 ml glass syringe (Gastight Syringe,
Hamilton Company, Reno, NV) was used as the reservoir for sulforhodamine solution
and connected to a high-pressure CO2 gas tank (Airgas, Radnor, PA) on one end and
connected to a 2.1-mm i.d. metal tubing line on the other end, which was then connected
to the end of a microneedle using a short, flexible tubing linker. A custom-made, rotary-
threaded device (Wang, Cornwell, et al. 2005) was used to hold the microneedle and
allow microneedle insertion into and retraction out of the skin in a controlled fashion
calibrated by the number of rotations of the device (i.e., 1 full rotation = 1440 μm needle
displacement). This assembly was held by a stainless steel adapter attached to a Z-stage
(Graduated Knob Unislide, Velmex, Bloomfield, NY) to control vertical motion of the
microneedle holder with ±10 μm resolution.
The flow rate of sulforhodamine solution microinjection was determined by following
movement of the gas-liquid meniscus in the syringe reservoir over time with a digital
video camera (DCR–TRV460, Sony, Tokyo, Japan) and image analysis software (Adobe
Photoshop 7.0, Adobe Systems, San Jose, CA) after converting the captured movie into
sequences of still images (Adobe Premiere 6.0, Adobe Systems). After initially
positioning the gas-liquid meniscus at the top of the glass syringe by injecting an

54
appropriate amount of air upstream from the syringe, the microneedle was lowered until
its tip touched the skin sample. The microneedle holder was then rotated clockwise to
insert the microneedle to the desired insertion depth and sometimes rotated
counterclockwise to retract the microneedle to the desired retraction distance. The
experimental setup is shown in Figure 3.4 below.
The gas pressure was then set to the desired infusion pressure using a pressure
regulator (Two-Stage Regulator, Fisher Scientific) on the CO2 cylinder and the
experiment began.
BBAA
Figure 3.4 (A) Schematic of experimental set up for microinfusion using microneedles. A glass microneedle is held in place by a rotary-threaded device. This assembly is held by a stainless steel adapter attached to a Z-stage. The end of the microneedle is connected to a metal tubing line using a flexible tubing linker. The metal tubing line is connected to a glass syringe reservoir on the other end which is connected to a high-pressure CO2 tank. (B) Stainless steel skin specimen board is placed underneath the microneedle tip (no skin is shown).

55
During the experiment, the skin was examined for fluid leakage, which was easily visible
due to the presence of sulforhodamine dye in the fluid. If there was no leakage, then the
flow rate within the glass syringe was assumed to be the same as the flow rate into the
skin. This assumption was validated by preliminary experiments that quantified the
sulforhodamine content of skin after microinjection using spectrofluorimetry after
chemically digesting the skin. These measurements demonstrated that the amount of
sulforhodamine within the skin was approximately the same as the amount displaced in
the syringe source (data not shown). Data were discarded in those few cases (< 5%)
where leakage was observed.
To serve as a base case experiment, a bevel-tip microneedle with 30-μm effective
opening radius was inserted to a depth of 1080 μm into the skin and microinfusion flow
was initiated by applying a constant infusion pressure of 138 kPa. Every 5 min, the
needle was retracted 180 μm back toward the skin surface to a final insertion depth of
180 μm (relative to its initial position prior to insertion). The infusion flow rate was
measured every minute with a 5 s offset at the beginning and the end of each period at a
given retraction position (i.e., at 5 s, 60 s, 120 s, 180 s, 240 s, and 295 s).
To determine the effect of microneedle insertion depth and retraction distance on flow
rate, the base case experiment was compared to otherwise identical experiments using
900-μm and 720-μm initial insertion depths followed by 180-μm retraction every 5 min.
The effect of infusion pressure was determined by comparing to pressures of 69 and 172
kPa. The effect of tip bevel was determined by comparing to a blunt-tip microneedle with
the same opening (i.e., 31 μm radius) as the bevel-tip microneedle. The effect of

56
microneedle tip opening size was determined by comparing to needles with smaller (22
μm radius) and larger (48 μm radius) tip openings. The effect of hyaluronidase was
determined by comparing to an infusion fluid containing 200 U/ml hyaluronidase
prepared by mixing 3 ml of hyaluronidase solution (Vitrase®, 200 U/ml, ISTA
Pharmaceuticals, Irvine, CA) with 7 ml of 1 x 10⁻³ M sulforhodamine solution. Finally,
the effect of infusion time was determined over longer times by inserting the microneedle
to a depth of 1080 μm and either leaving it in place or retracting 720 μm to a final
insertion depth of 360 μm and measuring flow rate for 104 min.
3.3.4 Histological and Microscopic Image Analysis
After each infusion experiment, the top surfaces and undersides of the skin were
imaged using bright-field microscopy (Leica DC 300) to visualize the distribution of
sulforhodamine infusion. Additional experiments were performed for detailed
histological imaging of microneedle penetration pathways and injection within skin. For
these experiments, a microneedle with 30-μm effective radius opening and 38º bevel
angle was externally spray-coated (Testor Corporation, Rockford, IL) using a solution of
red dye (Tissue Marking Dye; Triangle Biomedical Sciences, Durham, NC ) thickened
using 2 x 10⁻² M polyvinylpyrrolidone (Aldrich, St. Louis, MO). The needle was then
inserted to a depth of 1080 μm into the skin and retracted 720 μm to a final insertion
depth of 360 μm. A solution containing 2.1 x 10⁸ particles/ml of 6-μm yellow-green
fluorescence-labeled polystyrene microspheres (Fluoresbrite® YG, Polysciences,
Warrington, PA) mixed with blue-green dye (Triangle Biomedical Sciences) was injected
at 138 kPa infusion pressure until the dye became visible within the skin (~1 min infusion
time). These skin samples, with microneedles in place, were fixed using 10% neutral

57
buffered formalin (Fisher Scientific) or a mixture of 2% paraformaldehyde and 2%
glutaraldehyde (Electron Microscopy Sciences, Hatfield, PA) for at least 24 h before
rinsing thoroughly with PBS and then submerging in sterilized, filtered, 30% sucrose
overnight (Bancroft and Gamble 2002). The skin samples were frozen in liquid nitrogen
with optimal cutting temperature compound (Tissue-Tek, Sakura Finetek, Torrance, CA)
in an embedding mold container and later sectioned into 10-μm thick slices using a
cryostat (Cryo-star HM 560MV, Microm, Waldorf, Germany). Histological sections were
surface stained with hematoxylin and eosin (Autostainer XL, Leica Microsystems) and
examined by bright field (Leica DC 300) and fluorescence microscopy (Eclipse E600W,
Nikon, Melville, NY).
3.3.5 Statistical Analysis
Flow rate measurements at each condition and time point were performed using at
least three skin specimens, from which the mean and standard deviation were calculated.
A two-tailed Student’s t-test (α = 0.05) was performed when comparing two
experimental conditions. When comparing three or more experimental conditions, a one-
way analysis of variance (ANOVA α = 0.05) was performed. A two-way analysis of
variance (ANOVA α = 0.05) was performed when comparing two factors. In all cases, a
value p < 0.05 was considered statistically significant.
58
4 RESULTS
4.1 Fluid Dynamics of Microneedles5
Toward achieving painless injections and other microfluidic applications, we
microfabricated conically tapered needles of micron dimensions. The relationship
between pressure drop and flow rate through microneedles was experimentally quantified
as a function of fluid viscosity and microneedle length, diameter, and cone half-angle. At
Reynolds numbers less than approximately 100, dimensionless pressure drop (2ΔP/ρv2)
decreased steeply with increasing Reynolds number, indicating the importance of viscous
forces. At larger Reynolds numbers, the flow was almost inviscid, as indicated by a weak
dependence of dimensionless pressure drop on Reynolds number. Numerical simulations
showed good agreement with experimental data and predicted that flow through conically
tapered microneedles is primarily controlled by the diameter and taper angle at the
microneedle tip. A characteristic feature of flow through conically tapered microneedles
is a favorable axial pressure gradient that accelerates fluid through the microneedle, thus
inhibiting growth of the viscous boundary layer on the microneedle wall.
4.1.1 Introduction
To extend microneedle capabilities to actively deliver drugs by convection, we more
recently fabricated hollow microneedles that could be coupled with a pump or syringe for
5 This work was carried out in collaboration with Prof. Marc Smith and was published in Martanto, W., Smith, M. K., Baisch, S. M., Costner, E. A. and Prausnitz, M. R. Fluid dynamics in conically tapered microneedles. AIChE J 51: 1599-1607 (2005).

59
injection. Hollow microneedles were initially made by photolithography and plasma
etching (McAllister 2000), but our current approach involves laser drilling polymeric
molds and electrodepositing metal onto the molds (Davis, Prausnitz, et al. 2003). These
microneedles have been shown to permit flow of fluid and insert into skin (Davis, Landis,
et al. 2004, McAllister, Wang, et al. 2003). Others have also studied fabrication and
applications of hollow microneedles (Gardeniers, Luttge, et al. 2003, Stoeber and
Liepmann 2000).
The pressure drop required to flow fluid through a microneedle depends on needle
geometry and fluid viscosity and density. Needles of micron dimensions can exhibit
significant resistance to flow. Measurement and prediction of microneedle fluid dynamics
is needed to design needles that balance between geometries small enough to avoid pain,
sharp enough to easily insert into skin, and large enough to permit useful flow rates at
reasonable pressures. To address this need, this study sought to experimentally quantify
the relationship between pressure drop and flow rate as a function of microneedle
geometry and fluid viscosity, and to use computer simulations to model fluid dynamics in
microneedles.
Flow through microneedles is characterized by (i) micron dimensions, (ii) conically
tapered channels, and (iii) flow over a broad range of Reynolds numbers that can span at
least 1 – 1000. To gain perspective from the literature, there are numerous studies of fluid
flow inside microchannels (Stone and Kim 2001, Trebotich, Zahn, et al. 2003), but we
are not aware of any that address flow through conically tapered geometries. Fluid flow
through macroscopic conical channels has been addressed in the literature, but primarily
for developed flow in long channels. Approximate analytical solutions have been derived

60
for short channels with the assumption of creeping flow, limited contraction factor, and
small taper angle (Kwon, Shen, et al. 1986, Nishimura and Oka 1965, Oka 1964, Sutterby
1964), which may not apply to microneedles.
These theoretical approaches have been validated macroscopically using only limited
or no data and have not been validated at microscopic dimensions. The experimental data
that do exist (Kemblowski and Kiljanski 1975), as well as the more extensive numerical
analysis of fluids in conical channels (Garrioch and James 1997, Jarzebski and Wilkinson
1981), is almost exclusively at low Reynolds numbers, where viscous effects dominate
inertial effects. For this reason, our data can also be used to validate previous analytical
and numerical predictions from the literature.
To determine if needles of micron dimensions can be used to transfer fluids for
injecting drug solutions into skin or for other microfluidic applications, we flowed liquids
through microneedle molds and measured the pressure drop required as a function of
microneedle geometry and fluid viscosity. Conically tapered microneedle molds used in
this study were laser drilled using microfabrication techniques, as shown in Figure 3.1.
4.1.2 Measurement of Pressure Drop versus Flow Rate
One of the goals for this study was to quantify the relationship between flow rate and
pressure drop as a function of microneedle geometry. We made these measurements
using 22 different needle geometries each at 4 – 7 different flow rates for a total of 153
measurements. The range of geometries considered spanned inlet diameters of Di = 102
– 412 µm, tip diameters of Dt = 20 – 96 µm, cone half-angles of θc = 5 – 20º and lengths
of Ln = 100 – 500 µm.

61
Figure 4.1 shows the raw data measured from a representative set of individual
microneedles (each having the same cone half-angle, but different diameters and lengths).
It shows that pressure drop increased in a nonlinear manner with increasing flow rate and
with decreasing tip diameter Dt. For this representative set of microneedle geometries,
only modest pressures were required to achieve flow rates of many microliters per second
per needle, which may be of interest for drug delivery applications. Over the full range
of microneedle geometries considered, pressure drops of 4.6 – 196.5 kPa were required to
achieve flow rates of 1.4 –56 µl/s.
Figure 4.1 Pressure drop required for flow of water through representative microneedles of different geometries as a function of flow rate. Three different needle geometries each with the same cone half-angle, θc = 15˚, but with different tip diameter (Dt), inlet diameter (Di), and length (Ln) are compared: (■)Dt = 42 μm, Di = 162 μm, Ln = 225 μm, (▲)Dt = 50 μm, Di
= 322 μm, Ln = 500 μm, (●)Dt = 68 μm, Di = 342 μm, Ln = 500 μm.
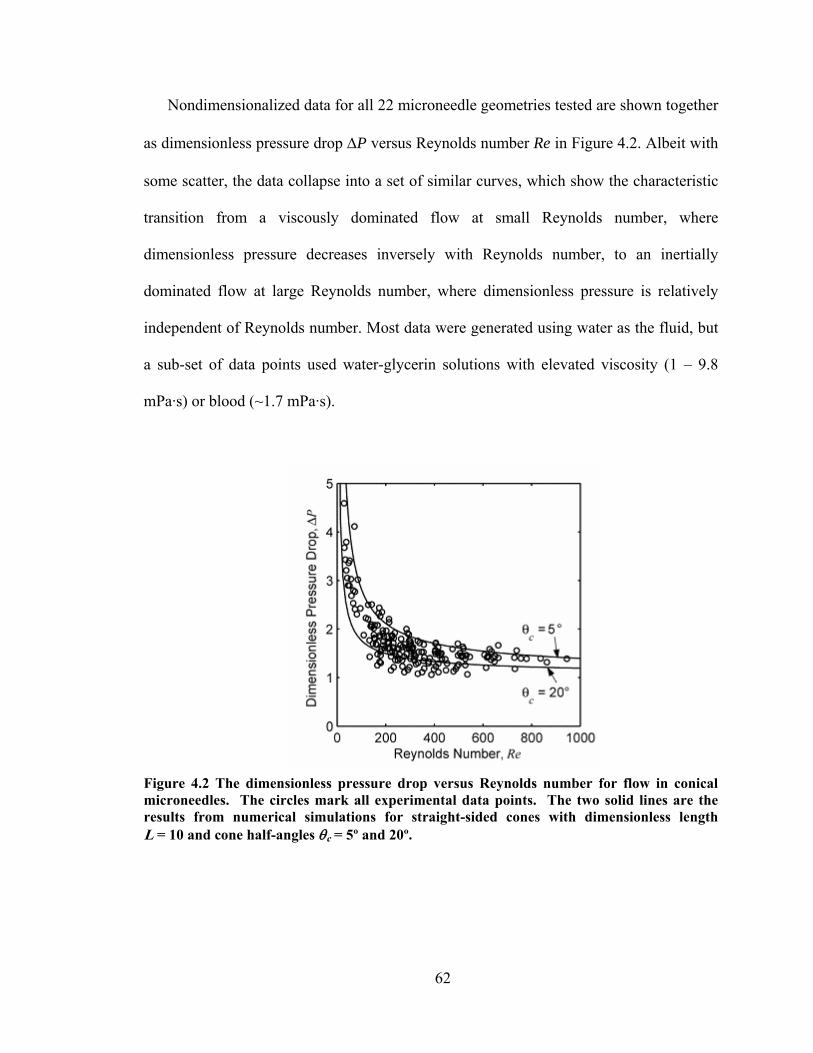
62
Nondimensionalized data for all 22 microneedle geometries tested are shown together
as dimensionless pressure drop ΔP versus Reynolds number Re in Figure 4.2. Albeit with
some scatter, the data collapse into a set of similar curves, which show the characteristic
transition from a viscously dominated flow at small Reynolds number, where
dimensionless pressure decreases inversely with Reynolds number, to an inertially
dominated flow at large Reynolds number, where dimensionless pressure is relatively
independent of Reynolds number. Most data were generated using water as the fluid, but
a sub-set of data points used water-glycerin solutions with elevated viscosity (1 – 9.8
mPa·s) or blood (~1.7 mPa·s).
Figure 4.2 The dimensionless pressure drop versus Reynolds number for flow in conical microneedles. The circles mark all experimental data points. The two solid lines are the results from numerical simulations for straight-sided cones with dimensionless length L = 10 and cone half-angles θc = 5º and 20º.
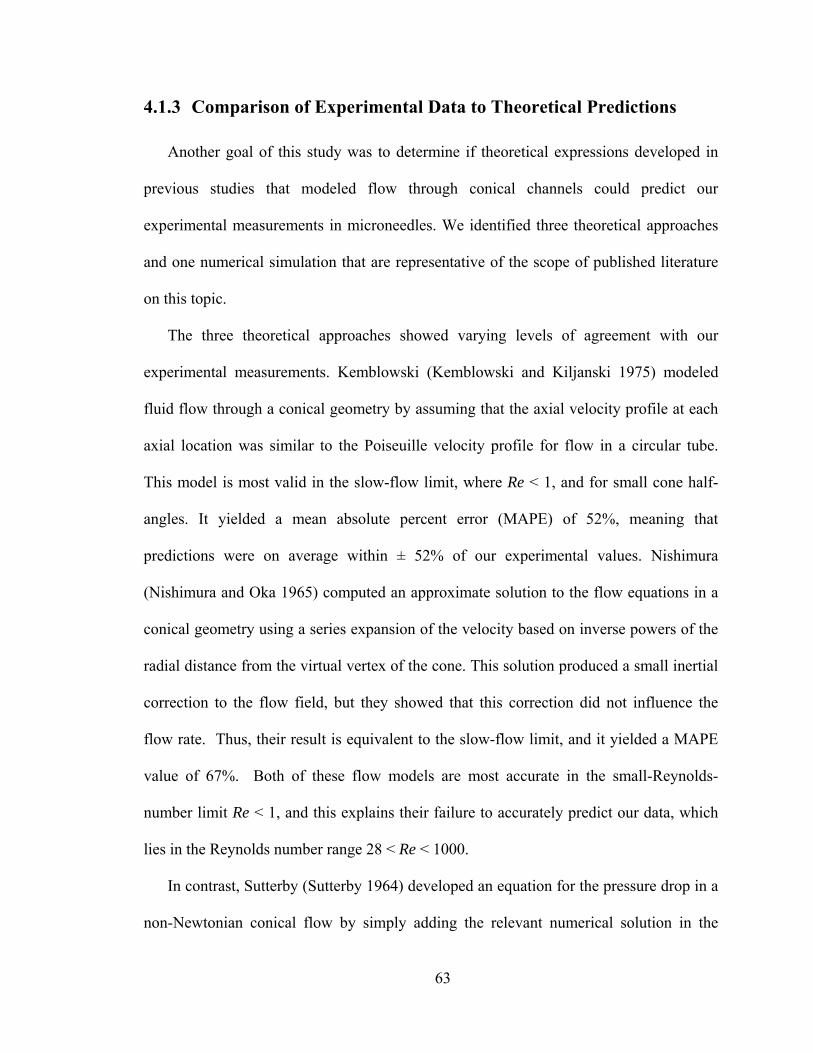
63
4.1.3 Comparison of Experimental Data to Theoretical Predictions
Another goal of this study was to determine if theoretical expressions developed in
previous studies that modeled flow through conical channels could predict our
experimental measurements in microneedles. We identified three theoretical approaches
and one numerical simulation that are representative of the scope of published literature
on this topic.
The three theoretical approaches showed varying levels of agreement with our
experimental measurements. Kemblowski (Kemblowski and Kiljanski 1975) modeled
fluid flow through a conical geometry by assuming that the axial velocity profile at each
axial location was similar to the Poiseuille velocity profile for flow in a circular tube.
This model is most valid in the slow-flow limit, where Re < 1, and for small cone half-
angles. It yielded a mean absolute percent error (MAPE) of 52%, meaning that
predictions were on average within ± 52% of our experimental values. Nishimura
(Nishimura and Oka 1965) computed an approximate solution to the flow equations in a
conical geometry using a series expansion of the velocity based on inverse powers of the
radial distance from the virtual vertex of the cone. This solution produced a small inertial
correction to the flow field, but they showed that this correction did not influence the
flow rate. Thus, their result is equivalent to the slow-flow limit, and it yielded a MAPE
value of 67%. Both of these flow models are most accurate in the small-Reynolds-
number limit Re < 1, and this explains their failure to accurately predict our data, which
lies in the Reynolds number range 28 < Re < 1000.
In contrast, Sutterby (Sutterby 1964) developed an equation for the pressure drop in a
non-Newtonian conical flow by simply adding the relevant numerical solution in the
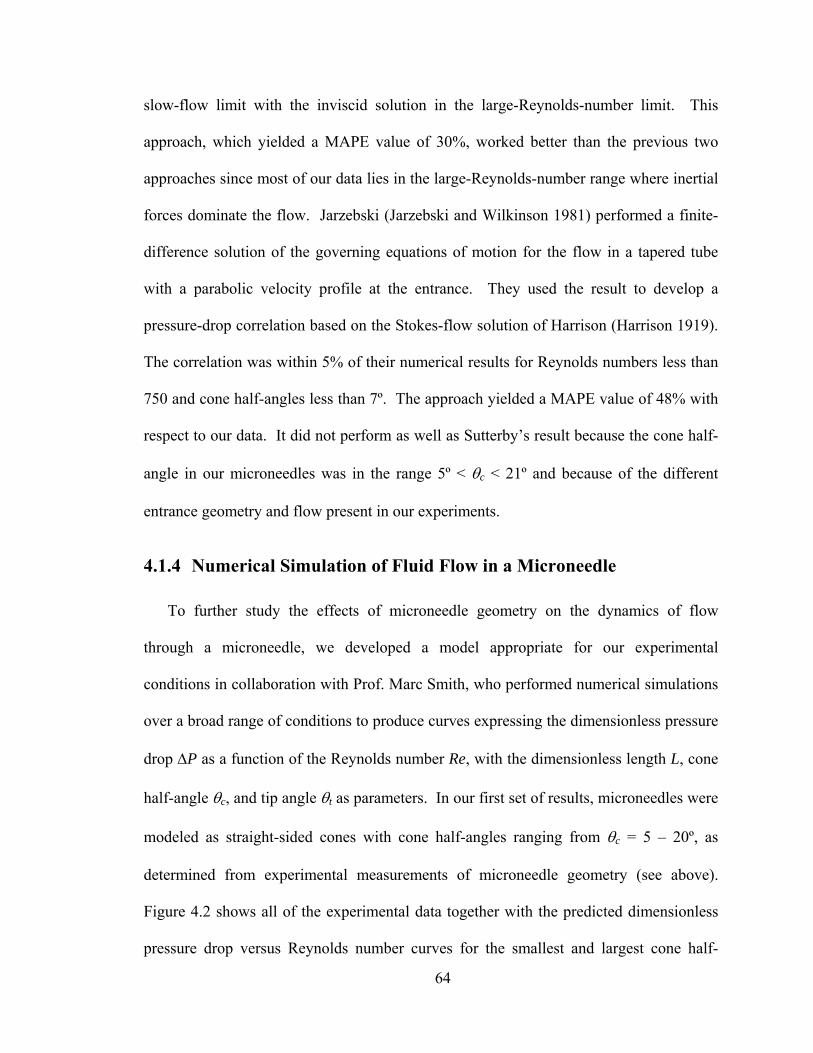
64
slow-flow limit with the inviscid solution in the large-Reynolds-number limit. This
approach, which yielded a MAPE value of 30%, worked better than the previous two
approaches since most of our data lies in the large-Reynolds-number range where inertial
forces dominate the flow. Jarzebski (Jarzebski and Wilkinson 1981) performed a finite-
difference solution of the governing equations of motion for the flow in a tapered tube
with a parabolic velocity profile at the entrance. They used the result to develop a
pressure-drop correlation based on the Stokes-flow solution of Harrison (Harrison 1919).
The correlation was within 5% of their numerical results for Reynolds numbers less than
750 and cone half-angles less than 7º. The approach yielded a MAPE value of 48% with
respect to our data. It did not perform as well as Sutterby’s result because the cone half-
angle in our microneedles was in the range 5º < θc < 21º and because of the different
entrance geometry and flow present in our experiments.
4.1.4 Numerical Simulation of Fluid Flow in a Microneedle
To further study the effects of microneedle geometry on the dynamics of flow
through a microneedle, we developed a model appropriate for our experimental
conditions in collaboration with Prof. Marc Smith, who performed numerical simulations
over a broad range of conditions to produce curves expressing the dimensionless pressure
drop ΔP as a function of the Reynolds number Re, with the dimensionless length L, cone
half-angle θc, and tip angle θt as parameters. In our first set of results, microneedles were
modeled as straight-sided cones with cone half-angles ranging from θc = 5 – 20º, as
determined from experimental measurements of microneedle geometry (see above).
Figure 4.2 shows all of the experimental data together with the predicted dimensionless
pressure drop versus Reynolds number curves for the smallest and largest cone half-

65
angles. These numerical curves approximately bound the experimental data. A more
quantitative assessment of the simulation’s predictive ability was produced by comparing
errors between each individual predicted data point and its corresponding measured
value, which yielded a MAPE of 11% for the whole data set.
4.1.4.1 Effect of Microneedle Length L
Simulation results were next used to predict the effect of microneedle geometry on
dimensionless pressure drop at different Reynolds numbers in greater detail. The effect
of needle length was considered first. As a base case, the dimensionless pressure drop for
a cylindrical microneedle (i.e., not tapered, θc = 0) is shown at four different lengths in
Figure 4.3. The dimensionless pressure drop decreases monotonically with Reynolds
number and increases with length. As 0→Re , each curve approaches the well-known,
Hagen-Poiseuille result of ( )LReLfP /64==Δ for fully developed, laminar pipe flow,
where f is the Darcy friction factor (Munson, Young, et al. 2002). As ∞→Re , all curves
approach the limiting value of one for purely inviscid flow. However, for Reynolds
numbers as large as 1000, the dimensionless pressure drop continues to vary with length
and is significantly greater than the purely inviscid result. This is due to the developing
entrance flow in these microneedles. The dimensionless distance required to establish a
fully developed, laminar flow in a cylindrical pipe is the dimensionless entrance length
(Munson, Young, et al. 2002) tee DLL /* = = 0.06 Re. For Re = 1000, the entrance length
is 60* =eL , which is three times longer than the longest needle considered (L = 20). Thus,

66
Figure 4.3 The effect of microneedle length on dimensionless pressure drop versus Reynolds number for a circular cylinder with θc = 0º
the large Reynolds number behavior in Figure 4.3 is due to the developing boundary
layer in the needle.
In contrast to cylindrical microneedles, there is very little effect of needle length
on flow through microneedles with tapered sides (Figure 4.4). Tapered microneedles are
of interest because their sharper tips permit easier insertion into skin (Davis, Landis, et al.
2004). Figure 4.4 shows the results for a cone-shaped microneedle with a straight-sided
taper (θt = θc), a cone half-angle θc = 5º, and four different lengths. There is still a
significant variation in the dimensionless pressure drop with Reynolds number, but the
dependence on needle length L is small. At larger cone half-angles, the curves for the
four different lengths are indistinguishable (data not shown). The reason why
dimensionless pressure drop in tapered needles is largely independent of needle length L
is discussed below.

67
Figure 4.4 The effect of microneedle length on dimensionless pressure drop versus Reynolds number for a tapered, straight-sided cone with θc = 5º having dimensionless lengths L = 2.5, 5, 10, and 20. The three curves for dimensionless length L ≥ 5 are almost indistinguishable.
4.1.4.2 Effect of Cone Half-Angle θc and Tip Angle θt
To assess the effect of cone half-angle θc on microneedle fluid dynamics, Figure 4.5
shows the dimensionless pressure drop for microneedles with a straight-sided profile (θt =
θc) and with various values for the cone half-angle θc. Because dimensionless pressure
drop is almost independent of microneedle length for geometries of interest (i.e., θc ≥ 5º),
microneedle length was set to a representative value of L = 10. The simulations show
that dimensionless pressure drop decreases with increasing Reynolds number and
increasing cone half-angle, especially between θc = 0º (a straight cylinder) and θc = 5º
(gently tapered).

68
Figure 4.5 The effect of microneedle taper on dimensionless pressure drop versus Reynolds number for a straight-sided cone (θc = θt) with cone half-angles θc = 0º, 5º, 10º, 20º, and 30º and dimensionless length L = 10.
The data from Figure 4.5 indicate that the cone half-angle for a straight-sided conical
microneedle is an important parameter. However, the geometry of a straight-sided cone
(θt = θc) is not representative of most microneedles used in this study, which have tapered
sides with curved profiles (Figure 3.1B). To address this complexity, microneedle
sidewall profiles were modeled as either parabolas or ellipses with a specified tip angle θt
that could be varied independently from the cone half-angle θc, as described in the
numerical methods section (see Figure 3.3). Tip angle is explicit in this model, because
of our expectation that most of the pressure drop occurs near the tip of the microneedle,
which is validated and discussed below.
To de-couple the effects of cone half-angle and needle tip angle, the tip angle was
held constant (θt = 20º), while the cone half-angle was varied (Figure 4.6).
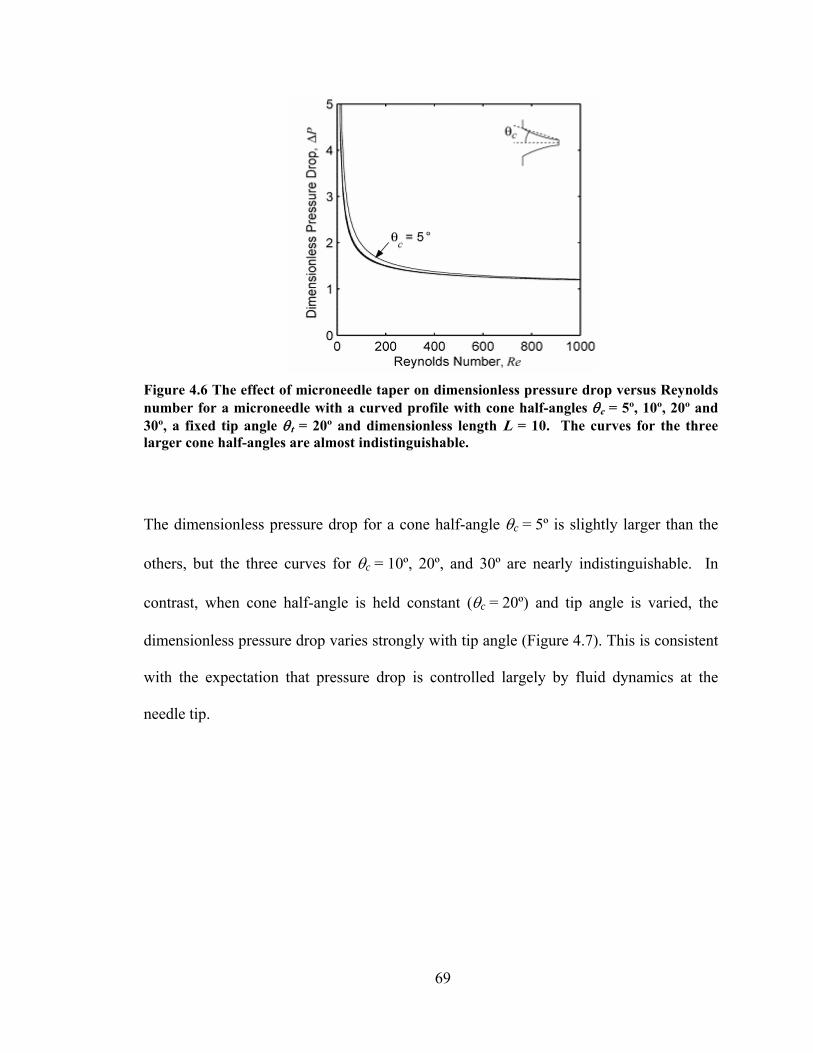
69
Figure 4.6 The effect of microneedle taper on dimensionless pressure drop versus Reynolds number for a microneedle with a curved profile with cone half-angles θc = 5º, 10º, 20º and 30º, a fixed tip angle θt = 20º and dimensionless length L = 10. The curves for the three larger cone half-angles are almost indistinguishable.
The dimensionless pressure drop for a cone half-angle θc = 5º is slightly larger than the
others, but the three curves for θc = 10º, 20º, and 30º are nearly indistinguishable. In
contrast, when cone half-angle is held constant (θc = 20º) and tip angle is varied, the
dimensionless pressure drop varies strongly with tip angle (Figure 4.7). This is consistent
with the expectation that pressure drop is controlled largely by fluid dynamics at the
needle tip.
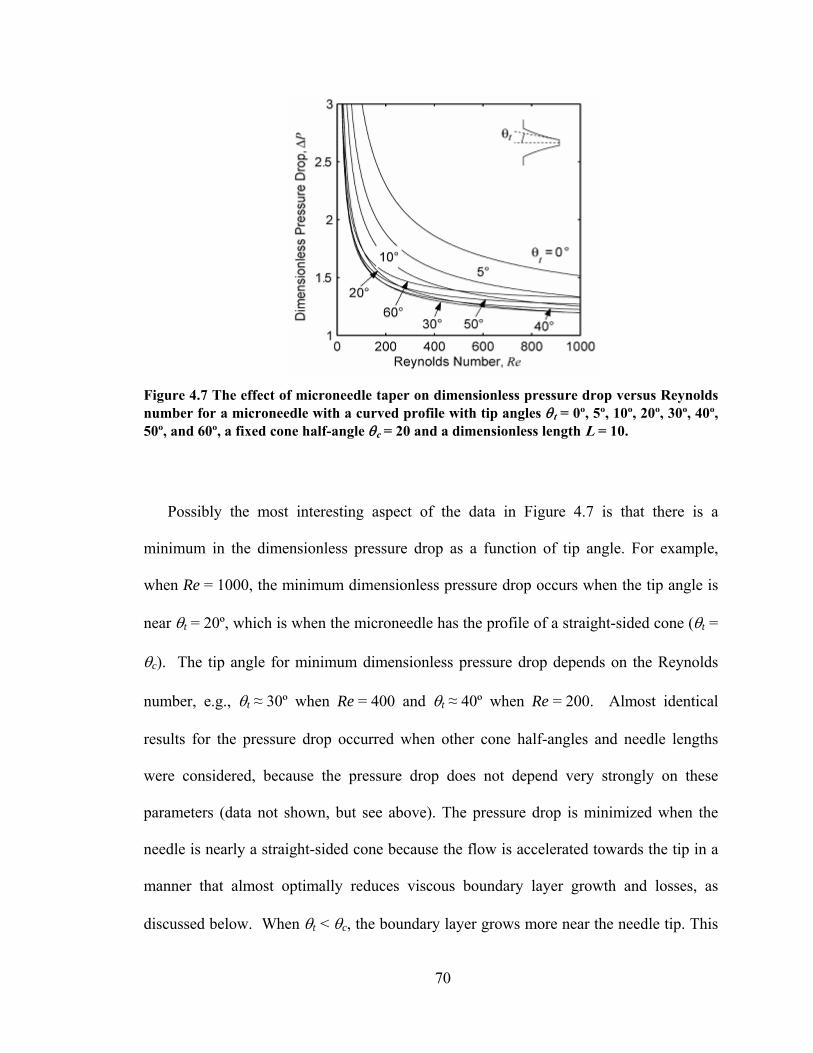
70
Figure 4.7 The effect of microneedle taper on dimensionless pressure drop versus Reynolds number for a microneedle with a curved profile with tip angles θt = 0º, 5º, 10º, 20º, 30º, 40º, 50º, and 60º, a fixed cone half-angle θc = 20 and a dimensionless length L = 10.
Possibly the most interesting aspect of the data in Figure 4.7 is that there is a
minimum in the dimensionless pressure drop as a function of tip angle. For example,
when Re = 1000, the minimum dimensionless pressure drop occurs when the tip angle is
near θt = 20º, which is when the microneedle has the profile of a straight-sided cone (θt =
θc). The tip angle for minimum dimensionless pressure drop depends on the Reynolds
number, e.g., θt ≈ 30º when Re = 400 and θt ≈ 40º when Re = 200. Almost identical
results for the pressure drop occurred when other cone half-angles and needle lengths
were considered, because the pressure drop does not depend very strongly on these
parameters (data not shown, but see above). The pressure drop is minimized when the
needle is nearly a straight-sided cone because the flow is accelerated towards the tip in a
manner that almost optimally reduces viscous boundary layer growth and losses, as
discussed below. When θt < θc, the boundary layer grows more near the needle tip. This
71
increases viscous friction and pressure drop in the microneedle. When θt > θc, viscous
friction and pressure drop increase because of the more abrupt transition for the exit flow.
This same conclusion can be obtained by computing the dimensionless mass flow rate
through the microneedle m& , defined as
ρρ /2 pA
mm
t
a
Δ=
&& , (4.1.1)
where am& is the dimensional mass flow rate, At is the tip area, and atmppp −=Δ 0 is the
dimensional pressure drop across the microneedle. For four representative tip angles
plotted in Figure 4.7, the dimensionless mass flow rates are m& = 0.7544, 0.8811, 0.8809,
and 0.8494 corresponding to θt = 0º, 20º, 40º, and 60º, respectively. The peak in the mass
flow rate is rather broad, but the maximum value occurs near the tip angle of 20º, which
corresponds to the geometry of a straight-sided cone (θt = θc).
4.1.4.3 Pressure Profile along Microneedle Axis
Altogether, the results from Figure 4.3 – Figure 4.7 show that the dimensionless
pressure drop in a tapered microneedle depends weakly on the dimensionless length L
and the cone half-angle θc, depends strongly on the tip angle θt, and is minimized when
the needle profile is nearly a straight-sided cone (θt = θc). The reasons for this can be
better understood by examining the pressure variation along the axis of the microneedle,
which is most conveniently discussed in terms of a different scaling than that used for the
dimensionless pressure drop PΔ defined in Equation 3.1.4.
72
This new dimensionless pressure is scaled with the total pressure drop across the
microneedle as follows,
atm
atm
ppppP
−−
=0
* (4.1.2)
Figure 4.8 shows this dimensionless pressure versus the dimensionless distance x
(nondimensionalized relative to needle tip diameter, Dt) along the axis of the microneedle
for four different tip angles, with constant cone half-angle θc = 20º, dimensionless length
L = 10, and Reynolds number Re = 500. Over 95% of the total pressure drop occurs in
the last 40% of the length of the microneedle when θt = 0º and in the last 20% or less
when θt ≥ 20º. These results show that the largest pressure variations in the microneedle
are determined primarily by flow near the tip. In our model, tip geometry is strongly
dependent on the tip angle θt and only weakly dependent on the dimensionless length L
and cone half-angle θc. This explains why the tip angle is the primary parameter
determining pressure variations in the microneedle.

73
Figure 4.8 The scaled pressure P* (see text Equation 4.1.2) versus the dimensionless distance x along the axis for flow in microneedles showing the effect of tip angle θt = 0º, 20º, 40º and 60º. The dimensionless pressure drops for these microneedles are ΔP = 1.757, 1.288, 1.289 and 1.386, respectively. The dimensionless mass flow rates are m& = 0.7544, 0.8811, 0.8809,and 0.8494, respectively.
The pressure profile in the microneedle for an incompressible, large Reynolds number
flow (as shown in Figure 4.8) is primarily an inviscid flow effect. As the cross-sectional
area of the microneedle decreases, fluid velocity increases and pressure decreases. The
inviscid portion of this pressure drop is a result of fluid acceleration. The viscous portion
results from the growth of the viscous boundary layer along the wall of the microneedle.
Near the tip of the microneedle, the large pressure variation causes a favorable pressure
gradient that slows the growth of the boundary layer, thereby confining viscous effects
closer to the wall and reducing the viscous portion of the pressure drop. However, if the
tip angle is too large, the abrupt change in flow geometry at the tip introduces additional
frictional effects that increase the viscous portion of the pressure drop (simulation data
not shown).

74
The relative importance of viscous effects on pressure drop across a microneedle was
determined using an inviscid flow model with a concentrated tip resistance. In this
model, the flow is steady, the fluid density is constant, and the velocity is unidirectional
and uniform across each cross-section of the microneedle. The flow is inviscid from
inside the plenum to just before the tip of the microneedle. The concentrated tip
resistance produces a discrete pressure drop at the tip whose value is chosen so that the
mass flow rate in the inviscid model is the same as that of the viscous flow in the
numerical simulations for a given Reynolds number. Writing the fluid velocity in the
microneedle in terms of the mass flow rate and using Bernoulli’s equation for the
pressure gives the following result for the scaled pressure profile,
)(
1)( 4
2*
xDmxP&
−= , (4.1.3)
where D(x) is the dimensionless local diameter of the microneedle (scaled on the tip
diameter Dt) and m& is the dimensionless mass flow rate defined in Equation 4.1.1. The
largest dimensionless mass flow rate, 1max =m& , occurs when the tip resistance is zero
(i.e., the flow is inviscid) and it is independent of the shape or length of the microneedle.
Viscous friction, as represented by the tip resistance, always decreases the flow rate.
Figure 4.9 shows a comparison of the pressure profiles in a microneedle obtained
from the numerical simulations (solid curves) and from the inviscid flow model (dashed
curves) for three tip angles. The distance between the two curves for each tip angle
represents the reduction in pressure caused by viscous friction. Viscous effects increase
in magnitude and extend farther from the tip when the tip angle is close to zero. Viscous
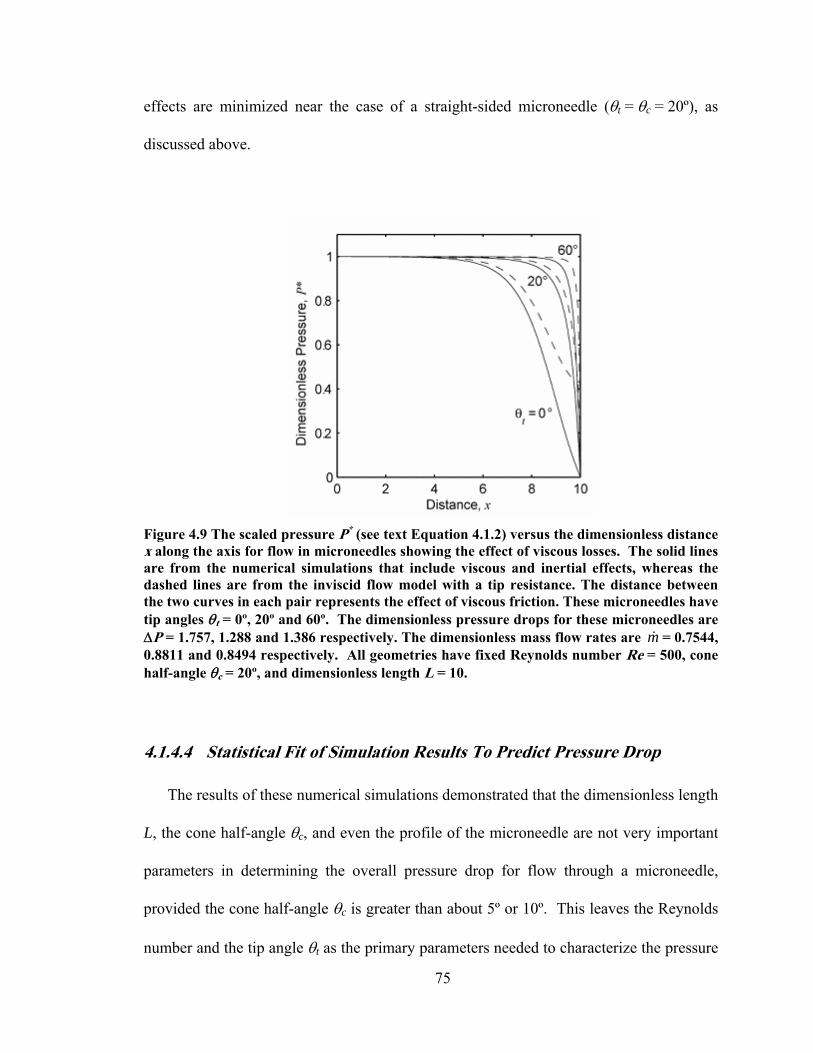
75
effects are minimized near the case of a straight-sided microneedle (θt = θc = 20º), as
discussed above.
Figure 4.9 The scaled pressure P* (see text Equation 4.1.2) versus the dimensionless distance x along the axis for flow in microneedles showing the effect of viscous losses. The solid lines are from the numerical simulations that include viscous and inertial effects, whereas the dashed lines are from the inviscid flow model with a tip resistance. The distance between the two curves in each pair represents the effect of viscous friction. These microneedles have tip angles θt = 0º, 20º and 60º. The dimensionless pressure drops for these microneedles are ΔP = 1.757, 1.288 and 1.386 respectively. The dimensionless mass flow rates are m& = 0.7544, 0.8811 and 0.8494 respectively. All geometries have fixed Reynolds number Re = 500, cone half-angle θc = 20º, and dimensionless length L = 10.
4.1.4.4 Statistical Fit of Simulation Results To Predict Pressure Drop
The results of these numerical simulations demonstrated that the dimensionless length
L, the cone half-angle θc, and even the profile of the microneedle are not very important
parameters in determining the overall pressure drop for flow through a microneedle,
provided the cone half-angle θc is greater than about 5º or 10º. This leaves the Reynolds
number and the tip angle θt as the primary parameters needed to characterize the pressure

76
drop, as shown in Figure 4.7. To make these results more useful for the design of
microneedles, simulation data from Figure 4.7 were fitted to the following functional
form,
( ) 11 ++=ΔcbaRe
ReKP , (4.1.4)
where K, a, b, and c are parameters that depend only on the tip angle θt. The values of
these four parameters are given in Table 1 for microneedles with tip angles in the range
0 ≤ θt ≤ 60º, a cone half-angle θc = 20º, and a dimensionless length L = 10. Over the
Reynolds number range 0.1 ≤ Re ≤ 1000, this correlation is accurate with respect to the
numerical results to less than 1% uncertainty for tip angles in the range 0º ≤ θt ≤ 35º and
to no more than 1.7% for tip angles in the range 35º < θt ≤ 60º. For the restricted
dimensionless pressure drop range 1 ≤ ΔP ≤ 2, the correlation is accurate to less than
0.5% for tip angles in the range 0º ≤ θt ≤ 30º and to no more than 1% for tip angles in the
range 30 < θt ≤60º.

77
Table 1. Parameters for Equation 4.1.4, which correlates the dimensionless pressure drop with the Reynolds number as a function of the tip angle θt.
θt K a b c
0º 118.33 0.0181 1.065 0.435 5º 75.69 0.0280 1.040 0.408 10º 54.67 0.0372 1.029 0.399 15º 43.00 0.0447 1.007 0.412 20º 36.05 0.0496 0.969 0.452 25º 31.74 0.0514 0.922 0.518 30º 29.06 0.0507 0.877 0.607 35º 27.47 0.0486 0.839 0.710 40º 26.78 0.0459 0.810 0.816 45º 26.67 0.0435 0.791 0.912 50º 27.01 0.0417 0.779 0.993 55º 27.75 0.0407 0.772 1.053 60º 28.89 0.0404 0.767 1.094
78
4.1.5 Discussion
Overall, the experimental data from this study of conically tapered microneedles were
consistent with the well-known behavior of internal flows. When all of the pressure-drop
data for different needle geometries and fluid viscosities were nondimensionalized, they
collapsed into a set of similar curves that were a function of the Reynolds number (Figure
4.2). These curves exhibited the characteristic creeping-flow limit at small Reynolds
number, in which the dimensionless pressure drop is inversely proportional to the
Reynolds number, and the characteristic inviscid-flow limit at large Reynolds number, in
which the dimensionless pressure is independent of Reynolds number.
Numerical simulations revealed additional complexities to the flow due to the
needle’s tapered geometry and short length. The most significant finding is that the
pressure drop required to flow fluid through a microneedle is controlled primarily by the
tip angle θt (Figures 4.5 – 4.7) and tip diameter Dt (found in the Reynolds number). This
is because the microneedle flows in this study were not fully developed. Each
microneedle was so short that the viscous boundary layer on the interior wall did not
grow to the point of merger. This behavior was also aided by the tapered geometry that
created a favorable axial-pressure gradient that inhibited boundary-layer growth. The
numerical simulations further showed that the pressure drop across the microneedle was
minimized when its geometry was near that of a straight-sided cone.
Agreement between our experimental data and numerical simulations is good (MAPE
= 11%). The discrepancies are most probably the result of our idealization of microneedle
geometry as a straight-sided cone. Due to the limitations of fabrication and measurement
at the micron scale, actual microneedles did not always have perfectly circular cross
79
sections and needle diameters were estimated with an experimental uncertainty of
approximately ± 3 µm (data not shown). Microneedles were not uniformly tapered either,
often exhibiting a “Coke bottle” shape (Figure 3.1B). Although the simulations could
account for some curvature in the needle taper, we did not simulate the complex
curvature of these actual microneedles. As discussed above, such inaccuracies in the
representation of the needle-tip geometry would then be a major factor contributing to the
discrepancies between simulations and experiments. Finally, microneedle walls had
surface roughness features on the order of 0.1 µm (data not shown). Simulations assumed
smooth walls.
This study was motivated by applications in drug delivery and microfluidics. The
observation that tip geometry generally controls flow within tapered microneedles
provides significant flexibility in needle design. This is important when balancing design
constraints to make needles that have the appropriate geometry and material properties to
insert into skin without breaking or bending, avoid causing pain, and inject useful
quantities of drug. We also observed that only kilopascal pressure drops were needed to
flow many microliters per second through a micron-scale needle. Battery-powered
micropumps in a handheld or wearable device could easily apply such pressures and
achieve flow rates of medical significance, especially if multi-needle arrays were used to
increase throughput and add redundancy. Not considered in this analysis is the resistance
to fluid dispersion in the tissue into which a microneedle injection might be performed.
Based on our preliminary measurements, this resistance can be considerable (data not
shown) and, given the relatively low pressure drops across microneedles, tissue resistance
is likely to be the dominant resistance to flow during a microneedle injection into skin.
80
4.1.6 Conclusions
To develop microneedles for painless injection and other microfluidic applications,
we experimentally determined the relationship between pressure drop and flow rate as a
function of microneedle geometry and fluid viscosity. Pressure drops in the range of 4.6 –
196.5 kPa were sufficient to flow liquids at rates of 1.4 – 56 µl/s, which suggests that
micropumps could be used to deliver medically useful quantities of fluid from a patch-
like device. Numerical simulation showed that needle tip diameter and tip angle are the
primary control parameters for flow through conically tapered microneedles, whereas
other geometric features, such as needle length and inlet diameter, are much less
important. The curvature of the taper also plays a small role, with straight-sided needles
exhibiting the least resistance to flow due to the nearly optimal development of the
viscous boundary layers for this geometry and range of Reynolds numbers. Altogether,
the experimental and numerical results from this work suggest that a microneedle
designed to deliver a maximum flow rate with minimum pressure drop would have the
shape of a straight-sided cone with a cone half-angle of about 20 – 30º and a large tip
diameter. This work also shows that fluid can flow through microneedles for drug
delivery and other microfluidic applications with only modest pressure drops that can be
predicted and optimized using a numerical model.

81
4.2 Solid Microneedles for Transdermal Insulin Delivery6
The purpose of this study were to design and fabricate arrays of solid microneedles
and insert them into the skin of diabetic hairless rats for transdermal delivery of insulin to
lower blood glucose level. Arrays containing 105 microneedles were laser-cut from
stainless steel metal sheets and inserted into the skin of anesthetized hairless rats with
streptozotocin-induced diabetes. During and after microneedle treatment, an insulin
solution (100 or 500 U/ml) was placed in contact with the skin for 4 h. Microneedles
were removed 10 s, 10 min or 4 h after initiating transdermal insulin delivery. Blood
glucose levels were measured electrochemically every 30 min. Plasma insulin
concentration was determined by radioimmunoassay at the end of most experiments.
As results, arrays of microneedles were fabricated and demonstrated to insert fully
into hairless rat skin in vivo. Microneedles increased skin permeability to insulin, which
rapidly and steadily reduced blood glucose levels to an extent similar to 0.05 – 0.5 U
insulin injected subcutaneously. Plasma insulin concentrations were directly measured to
be 0.5 – 7.4 ng/ml. Higher donor solution insulin concentration, shorter insertion time,
and fewer repeated insertions resulted in larger drops in blood glucose level and larger
plasma insulin concentrations. In conclusions, Solid metal microneedles are capable of
increasing transdermal insulin delivery and lowering blood glucose levels by as much as
80% in diabetic hairless rats in vivo.
6 This work was published in Martanto, W., Davis, S. P., Holiday, N. R., Wang, J., Gill, H. S. and Prausnitz, M. R. Transdermal delivery of insulin using microneedles in vivo. Pharm Res 21: 947-952 (2004).
82
4.2.1 Introduction
Previous work has demonstrated that microneedles are capable of piercing human
skin (Davis, Landis, et al. 2004) and increasing skin permeability by orders of magnitude
to small molecules (Henry, McAllister, et al. 1998) and proteins (McAllister, Wang, et al.
2003) in vitro. Moreover, insertion of microneedles into human subjects is reported as
painless (Kaushik, Hord, et al. 2001). Injection into chicken thigh in vitro using
microneedles was shown by Stoeber and Liepmann (Stoeber and Liepmann 2000). Using
hairless guinea pig skin in vivo, Lin et al. (Lin, Cormier, et al. 2001) studied the use of
microneedles to deliver oligonucleotides with and without the addition of iontophoresis.
Vaccine delivery has also received attention using antigen-coated microneedles, where
Matriano et al. (Matriano, Cormier, et al. 2002) showed increased antibody titers to
ovalbumin in hairless guinea pigs and Mikszta et al. (Mikszta, Alarcon, et al. 2002)
demonstrated enhanced immune response to a DNA vaccine in mice.
Building off these previous studies, we sought to investigate the use of microneedles
to deliver a therapeutic protein and study the pharmacodynamic response in vivo. The
specific aim of this study was to determine and study the effects of diffusion-based
delivery of insulin to diabetic rats using solid microneedles. We therefore used
microfabricated needle arrays to deliver insulin to diabetic hairless rats and measured
insulin delivery and resulting changes in blood glucose levels. We selected insulin as a
model drug because of its clinical relevance and great difficulty to deliver across intact
skin (Owens 2002). Diabetes mellitus is one of the leading lethal diseases in the United
States and worldwide, and is often treated by hypodermic injection of insulin. Due to

83
patient discomfort that leads to poor patient compliance, alternative methods to
administer insulin are of great interest.
4.2.2 Fabrication and Characterization of Microneedles
To develop a minimally invasive means to administer insulin across the skin and offer
the possibility to continuously control the delivery rate, we designed and fabricated
arrays of solid microneedles. These needles were made by laser-cutting needle structures
from stainless steel sheets and bending the needles out of the sheet into an array
containing 7 rows of 15 needles each, for a total of 105 needles. As shown in Figure 4.10,
each needle measured 50 μm by 200 μm in width at the base, and tapered over a 1000-μm
length to a sharp tip with 20º angle.
Figure 4.10 Scanning electron micrograph of solid metal microneedles shown next to the tip of a 27-gauge hypodermic needle. The complete microneedle array contains 105 needles, each measuring 1000 μm in length, 50 μm by 200 μm in cross section at the base, and tapering to a sharp tip with an angle of 20º.

84
The dark region visible behind each needle is the hole in the stainless steel sheet out of
which each needle was bent. Figure 4.10 also shows a 27-gauge hypodermic needle for
size comparison.
We used relatively long (i.e., 1 mm) microneedles in this study to facilitate easy
insertion into the highly deformable skin of a rat, although shorter needles can also be
inserted (Lin, Cormier, et al. 2001, Matriano, Cormier, et al. 2002, McAllister, Wang, et
al. 2003). Even though human skin is thicker, still shorter needles may insert into human
skin because it is less deformable on many parts of the body. On-going studies suggest
that arrays of needles as large as 1 mm in length can be designed to avoid pain (data not
shown).
After making microneedles, we tested their ability to insert into hairless rat skin in
vivo. We found that insertion of this large array of needles by hand was difficult.
However, with the aid of a high-velocity insertion device designed specifically for
microneedle insertion, microneedles readily penetrated into the skin. As shown in Figure
4.11, microneedles were inserted to their full length into the skin, piercing across the
epidermis and terminating within the dermis. In Figure 4.11, the black material
corresponds to the stainless steel needles, the lightly stained region adjacent to the needle
array base is the epidermis, the darkly stained tissue below that is dermis, and the light
tissue at the bottom of the image is subcutaneous tissue.
Closer examination of Figure 4.11 indicates that some skin deformation occurred
around each needle, as shown by the epidermal surface dimpled downward along the
needle shaft (especially evident in the inset image). Due to the angle of tissue sectioning,
the left portion of the needle array has a continuous base, whereas the right portion shows

85
the holes in the base out of which each needle was bent. To supplement the side view
shown in the main image, the inset image displays a section rotated by 90º to show the
front view of a needle.
Figure 4.11 Cross section of an array of microneedles inserted into rat skin in vivo and imaged by light microscopy after biopsy, fixation, and staining. The dark structures are the needles, which pierce vertically into the skin, and the base plate of the array, which is aligned horizontally along the skin surface. A portion of the base plate is missing on the right side, which corresponds to the hole in the base plate formed after cutting and bending the needle out at 90° (see text). The lightly stained tissue corresponds to the epidermis and the thicker, darkly stained tissue below corresponds to the dermis. The inset shows a side view of a single microneedle sectioned at an angle rotated 90° relative to the main image. This figure shows that the microneedles inserted to their full length into the skin.
To qualitatively assess the ability of microneedles to increase transdermal transport, a
needle array was inserted and then removed from hairless rat skin in vivo, after which a
dye solution was placed on the skin and then wiped off to stain the sites of needle
penetration. Figure 4.12 provides an image of the skin surface, which indicates that
essentially all microneedles were inserted into the skin to create pathways for transdermal
transport.

86
Figure 4.12 Surface of hairless rat skin after insertion and removal of microneedles in vivo followed by topical staining with a tissue-marking dye, as shown by light microscopy. Each stained spot corresponds to the site of microneedle penetration into the skin.
4.2.3 Reduced Blood Glucose Levels
We next tested the ability of microneedles to increase transdermal delivery of insulin
to diabetic hairless rats. In these initial experiments, insulin was delivered for 4 h during
and after a 10-min microneedle treatment. Then, insulin was removed from the skin and
blood glucose levels were monitored for another 4 h. Figure 4.13 shows that blood
glucose dropped rapidly and continuously during the 4-h insulin delivery period and
eventually stabilized after insulin was removed (black symbols). In contrast, there was no
significant drop in blood glucose levels in negative control rats (X symbols), in which
insulin was applied to the rat’s skin without microneedles (ANOVA; p < 0.0001). In
comparison to positive control experiments using subcutaneous injection with a
hypodermic needle (white symbols), changes in blood glucose level induced by
microneedles were greater than those caused by injection of 0.05 U but less than 0.5 or
1.5 U of insulin. This indicates that microneedles can increase skin permeability in a

87
long-lived manner to deliver physiologically relevant amounts of pharmacologically
active insulin.
0
25
50
75
100
-1 0 1 2 3 4 5 6 7 8Time (h)
Nor
mal
ized
Blo
od G
luco
se L
evel
(%)
Figure 4.13 Changes in blood glucose level in diabetic, hairless rats after insulin delivery using microneedles (▲), subcutaneous hypodermic injection of 0.05 U (◊), 0.5 U (□) or 1.5 U (○) of insulin, or passive delivery across untreated skin (×). Microneedles were inserted into skin for 10 min and then removed. Insulin solution was applied to the skin immediately after microneedle insertion and left on the skin for 4 h (as shown by arrow). Subcutaneous injections took a few seconds to perform. The pharmacodynamic effect of insulin delivery by microneedles was bounded by that of 0.05 – 0.5 U injected subcutaneously. Data are expressed as mean values (n ≥ 3) with average standard deviation associated with each data point of 14%. Blood glucose levels have been normalized relative to average pre-treatment levels.
To further understand the effects of microneedles on transdermal insulin delivery, we
examined the effect of delivery conditions on insulin delivery rate by varying three
parameters: insulin concentration, needle insertion time, and number of insertions. Figure
4.14 shows the effect of varying insulin donor solution concentration, where higher

88
insulin concentration (500 U/ml) reduced blood glucose levels to a greater extent than
lower insulin concentration (100 U/ml) (ANOVA; p < 0.05), which is consistent with the
expected dose-response relationship.
0
25
50
75
100
-1 0 1 2 3 4Time (h)
Nor
mal
ized
Blo
od G
luco
se L
evel
(%)
Figure 4.14 The effects of insulin donor concentration on changes in blood glucose level in diabetic, hairless rats. Higher insulin concentration (500 U/ml ( )) in the donor solution reduced blood glucose level to a greater extent than lower insulin concentration (100 U/ml ( )) during delivery using microneedles that were inserted into skin for 10 min and then removed. Data are expressed as mean values (n ≥ 3) with average standard deviation associated with each data point of 15%. Blood glucose levels have been normalized relative to average pre-treatment levels. There was no significant drop in blood glucose levels in control rats exposed to insulin without microneedles (Figure 4.13). In all experiments, insulin remained in contact with the skin for 4 h (as shown by arrows).
The effect of inserting microneedle arrays into the skin for different amounts of time
is shown in Figure 4.15. Microneedles inserted and then removed after just 10 s
(followed by 4 h of insulin delivery across the skin) yielded larger drops in blood glucose
level compared to that of removing the needles after 10 min, which in turn yielded larger
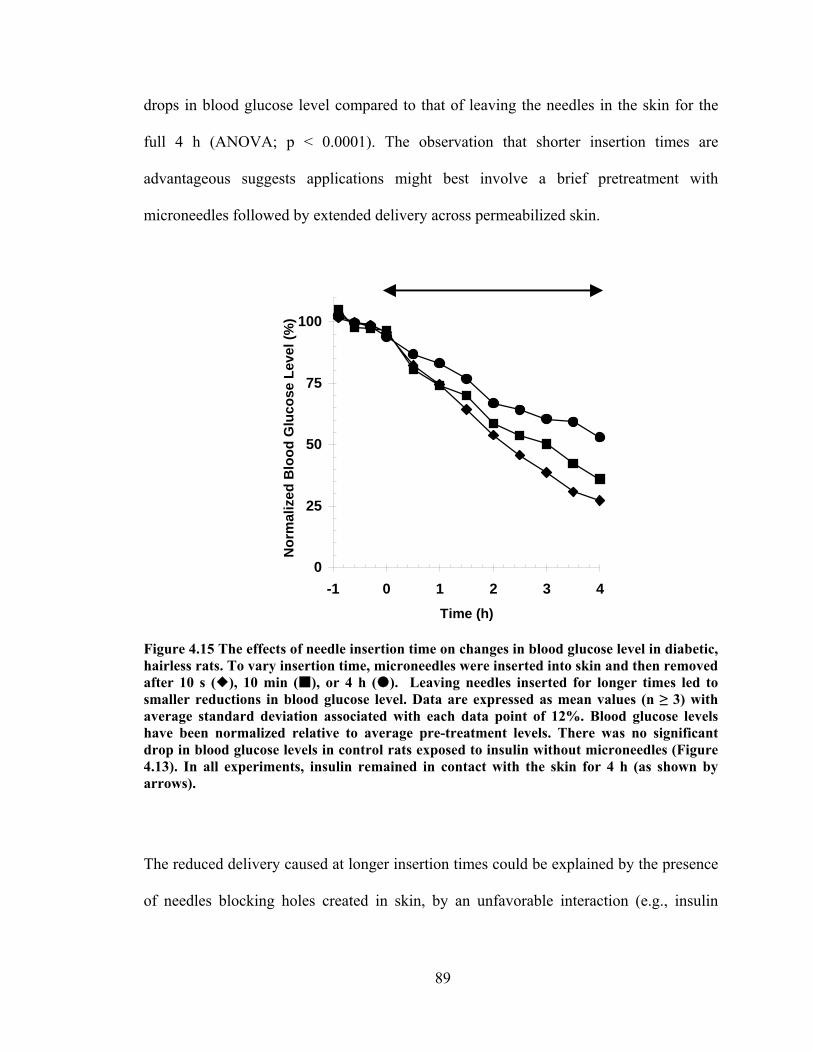
89
drops in blood glucose level compared to that of leaving the needles in the skin for the
full 4 h (ANOVA; p < 0.0001). The observation that shorter insertion times are
advantageous suggests applications might best involve a brief pretreatment with
microneedles followed by extended delivery across permeabilized skin.
0
25
50
75
100
-1 0 1 2 3 4Time (h)
Nor
mal
ized
Blo
od G
luco
se L
evel
(%)
Figure 4.15 The effects of needle insertion time on changes in blood glucose level in diabetic, hairless rats. To vary insertion time, microneedles were inserted into skin and then removed after 10 s ( ), 10 min ( ), or 4 h ( ). Leaving needles inserted for longer times led to smaller reductions in blood glucose level. Data are expressed as mean values (n ≥ 3) with average standard deviation associated with each data point of 12%. Blood glucose levels have been normalized relative to average pre-treatment levels. There was no significant drop in blood glucose levels in control rats exposed to insulin without microneedles (Figure 4.13). In all experiments, insulin remained in contact with the skin for 4 h (as shown by arrows).
The reduced delivery caused at longer insertion times could be explained by the presence
of needles blocking holes created in skin, by an unfavorable interaction (e.g., insulin

90
aggregation) between needles and insulin (McAllister, Wang, et al. 2003), or other
effects.
As shown in Figure 4.16, the number of needle insertions also affected blood glucose
levels. Inserting the needles multiple times (5 times) led to smaller reductions in blood
0
25
50
75
100
-1 0 1 2 3 4Time (h)
Nor
mal
ized
Blo
od G
luco
se L
evel
(%)
Figure 4.16 The effects of number of insertions on changes in blood glucose level in diabetic, hairless rats. Microneedles were inserted into skin and then removed after 10 s for the single insertion experiment ( ), whereas microneedles were repeatedly inserted (for 10 s) and removed five times at the same site for the multiple insertion experiment (▲). Inserting the needles multiple times led to smaller reductions in blood glucose level. Data are expressed as mean values (n ≥ 3) with average standard deviation associated with each data point of 14%. Blood glucose levels have been normalized relative to average pre-treatment levels. There was no significant drop in blood glucose levels in control rats exposed to insulin without microneedles (Figure 4.13). In all experiments, insulin remained in contact with the skin for 4 h (as shown by arrows).
glucose levels compared to that of a single insertion prior to insulin delivery (ANOVA; p
< 0.001). The observation that repeated insertions resulted in smaller changes in blood
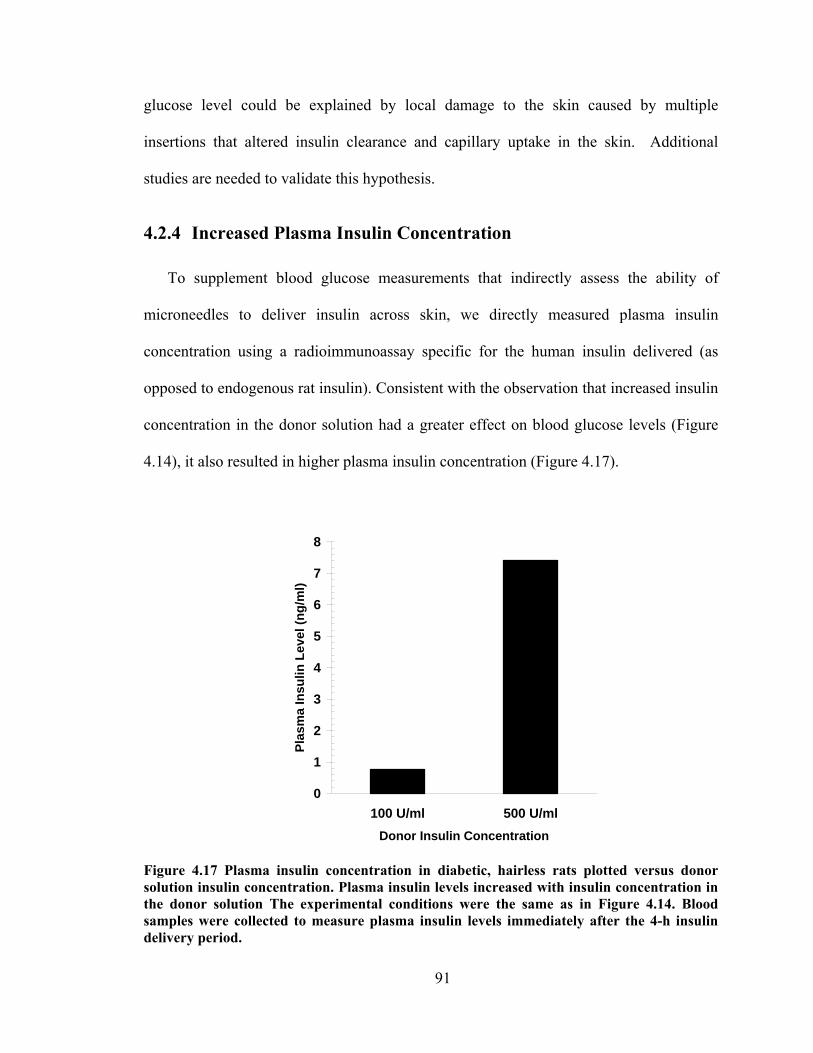
91
glucose level could be explained by local damage to the skin caused by multiple
insertions that altered insulin clearance and capillary uptake in the skin. Additional
studies are needed to validate this hypothesis.
4.2.4 Increased Plasma Insulin Concentration
To supplement blood glucose measurements that indirectly assess the ability of
microneedles to deliver insulin across skin, we directly measured plasma insulin
concentration using a radioimmunoassay specific for the human insulin delivered (as
opposed to endogenous rat insulin). Consistent with the observation that increased insulin
concentration in the donor solution had a greater effect on blood glucose levels (Figure
4.14), it also resulted in higher plasma insulin concentration (Figure 4.17).
0
1
2
3
4
5
6
7
8
100 U/ml 500 U/mlDonor Insulin Concentration
Plas
ma
Insu
lin L
evel
(ng/
ml)
Figure 4.17 Plasma insulin concentration in diabetic, hairless rats plotted versus donor solution insulin concentration. Plasma insulin levels increased with insulin concentration in the donor solution The experimental conditions were the same as in Figure 4.14. Blood samples were collected to measure plasma insulin levels immediately after the 4-h insulin delivery period.
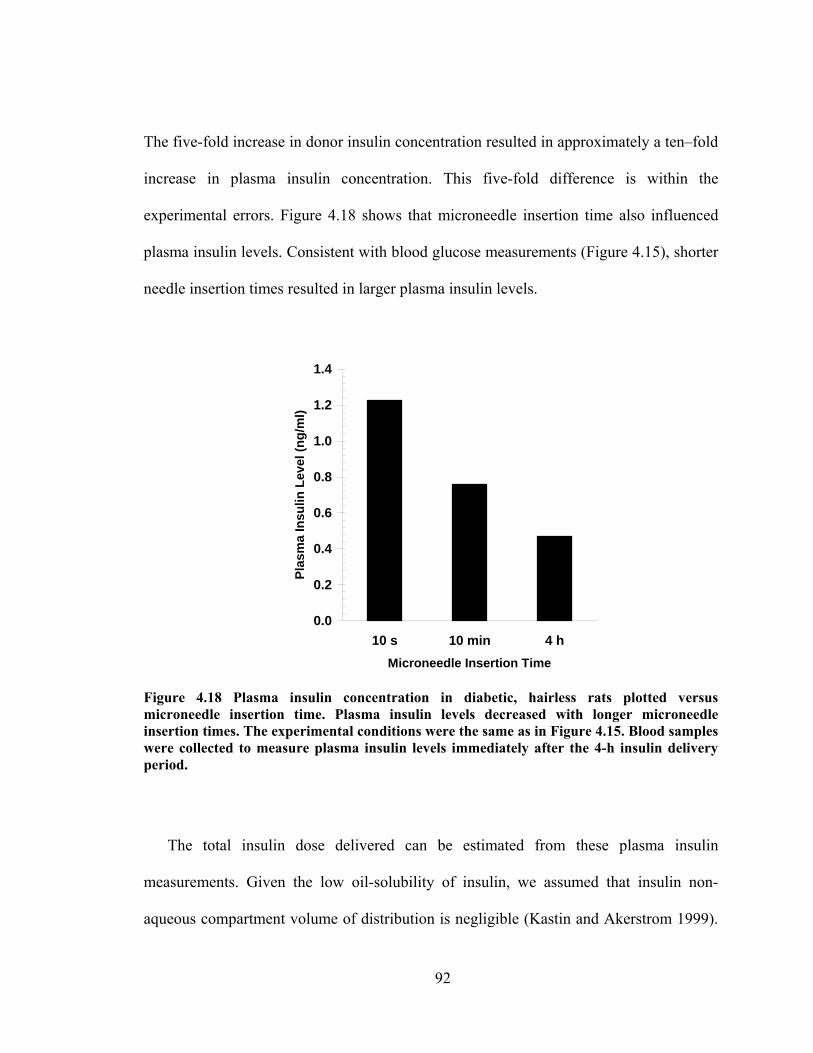
92
The five-fold increase in donor insulin concentration resulted in approximately a ten–fold
increase in plasma insulin concentration. This five-fold difference is within the
experimental errors. Figure 4.18 shows that microneedle insertion time also influenced
plasma insulin levels. Consistent with blood glucose measurements (Figure 4.15), shorter
needle insertion times resulted in larger plasma insulin levels.
0.0
0.2
0.4
0.6
0.8
1.0
1.2
1.4
10 s 10 min 4 hMicroneedle Insertion Time
Plas
ma
Insu
lin L
evel
(ng/
ml)
Figure 4.18 Plasma insulin concentration in diabetic, hairless rats plotted versus microneedle insertion time. Plasma insulin levels decreased with longer microneedle insertion times. The experimental conditions were the same as in Figure 4.15. Blood samples were collected to measure plasma insulin levels immediately after the 4-h insulin delivery period.
The total insulin dose delivered can be estimated from these plasma insulin
measurements. Given the low oil-solubility of insulin, we assumed that insulin non-
aqueous compartment volume of distribution is negligible (Kastin and Akerstrom 1999).

93
Based on an aqueous compartment volume of distribution in rats of 0.4 l/kg (Bachmann,
Pardoe, et al. 1996, Sifton 2003), the total insulin dose delivered was 1.6 – 4.1 mU (0.06
– 0.15 μg) using the 100 U/ml insulin formulation (Figure 4.18). In contrast, Figure 4.13
shows that microneedles lowered blood glucose levels to an extent bounded by
subcutaneous injection of 0.05 – 0.5 U insulin. This discrepancy could be explained by
slower absorption or lower bioavailability of insulin injected subcutaneously compared to
insulin delivered into the skin using microneedles.
The results in Figure 4.13 – Figure 4.16 should be interpreted in the context of the
effects of anesthesia on blood glucose level. Urethane, which was used to anesthetize the
rats, is well known to influence blood glucose levels in rodents (Sanchez-Pozo, Alados, et
al. 1988). Although glycemic levels are not altered in untreated diabetic rats, urethane is
known to reduce the hypoglycemic effect of injected insulin by as much as 50% (Wang,
Ren, et al. 2000). This suggests that the blood glucose level reduction reported in this
work may be similarly muted by the use of urethane.
4.2.5 Implications for Transdermal Drug Delivery
The ability of microneedles to create pathways across skin for delivery of insulin has
potential significance for transdermal delivery of macromolecules. Using a relatively
simple procedure, this study showed that microneedles are capable of delivering
physiologically relevant amounts of biologically active insulin in vivo with no apparent
lag time to onset of action. As a convenient and effective procedure, this study indicated
that the skin could be briefly pretreated with microneedles and followed by application of
a drug formulation to the treated site for many hours of transdermal delivery. When
considered in combination with previous in vitro studies showing transdermal delivery of
94
compounds covering a broad range of molecular sizes (McAllister, Wang, et al. 2003)
and in vivo studies showing delivery of oligonucleotides (Lin, Cormier, et al. 2001), as
well as protein and DNA antigens (Lin, Cormier, et al. 2001, Matriano, Cormier, et al.
2002), microneedles appear to be a broadly applicable technology for transdermal
delivery.
Of practical significance, microneedles can be fabricated using a number of different
low-cost, mass-production technologies (McAllister, Wang, et al. 2003), including the
laser-cutting approach used in this study. As a purely mechanical device that does not
require electronic controls or a power supply, microneedles are expected to be less
expensive, easier to use, and less likely to suffer from FDA-approval hurdles to validate
manufacturing as compared to other approaches involving electrical, ultrasonic, thermal
or other energy-based mechanisms.
4.2.6 Conclusions
Microfabricated arrays of solid metal microneedles were capable of fully inserting
into the skin of hairless rats. These microneedles increased transdermal insulin delivery
and thereby lowered blood glucose levels by as much as 80% in diabetic hairless rats in
vivo. Shorter microneedle insertion times, fewer insertions, and larger insulin
concentration in the donor solution all led to more insulin delivery and larger drops in
blood glucose level. For the conditions used in this study, the pharmacodynamic response
to insulin delivery using microneedles showed reduction in blood glucose levels similar
to subcutaneous hypodermic injection of 0.05 – 0.5 U insulin. Direct measurements
showed blood insulin concentrations of 0.5 – 7.4 ng/ml. Altogether, this study shows that

95
microneedles can be used to deliver biologically active protein in vivo, which suggests
future uses for minimally invasive protein delivery in clinical applications.
4.3 Hollow Microneedles for Transdermal Insulin Delivery7
The goal of this study was to design, fabricate, and test arrays of hollow microneedles
for minimally invasive and continuous delivery of insulin in vivo. As a simple, robust
fabrication method suitable for inexpensive mass production, we developed a modified-
LIGA process to micromachine molds out of polyethylene terephthalate using an
ultraviolet laser, coated those molds with nickel by electrodeposition onto a sputter-
deposited seed layer, and released the resulting metal microneedle arrays by selectively
etching the polymer mold. Mechanical testing showed that these microneedles were
sufficiently strong to pierce living skin without breaking (data not shown in this thesis).
Arrays containing 16 microneedles measuring 500 μm in length with a 75 μm tip
diameter were then inserted into the skin of anesthetized, diabetic, hairless rats. Insulin
delivery through microneedles caused blood glucose levels to drop steadily to 47% of
pre-treatment values over a 4-h insulin delivery period and were then approximately
constant over a 4-h post-delivery monitoring period. Direct measurement of plasma
insulin levels showed a peak value of 0.43 ng/ml. Together, these data suggest that
microneedles can be fabricated and used for in vivo insulin delivery.
7 This work was carried out in collaboration with Dr. Shawn Davis and was published in Davis, S. P., Martanto, W., Allen, M. G. and Prausnitz, M. R. Hollow metal microneedles for insulin delivery to diabetic rats. IEEE Trans Biomed Eng 52: 909-915 (2005).

96
4.3.1 Introduction
To extend solid microneedles capabilities for transdermal insulin delivery, tapered
hollow metal microneedles (Prausnitz 2004) were used to deliver insulin to diabetic rats
in vivo. Hollow microneedles offer delivery pathways in which insulin can be transported
into the skin via the needle lumen, which provides a transport pathway with a controlled
geometry that facilitates controlled delivery into the skin. The specific aim of this study
was to determine and study the effects of diffusion-based delivery of insulin to diabetic
rats using hollow microneedles.
4.3.2 Microneedle Design and Fabrication
4.3.2.1 Microneedle Design
Microneedles used for insulin delivery have a number of different design constraints:
they must be strong enough to insert into skin without breaking, simple to fabricate and
large enough to efficiently deliver clinically relevant amounts of insulin. Additional
features such as lack of pain and biocompatibility were also taken into account.
Microneedle insertion into skin depends on needle tip, length, spacing, wall thickness
and needle material. Force of insertion into skin was shown to depend linearly on the
interfacial area of the needle tip (Davis, Landis, et al. 2004) thus a needle with small tip
diameter was preferable. Short and closely spaced needles cannot overcome the elastic
deformation of skin and just dimple the skin without piercing. Using similar high
velocity insertion device for solid microneedle insertion, this limitation can be partially
overcome (Rousche and Normann 1992). Therefore, an optimal needle spacing and
length were selected based on these constraints. Wall thickness and needle material were

97
shown to affect fracture force of microneedle, thus a thin wall thickness and strong
material were preferred. Fabrication process offered a constraint as well in which tapered
mold is required to allow complete sputtering exposure for uniform electrodeposition.
Taking into account all these constraints, hollow microneedles used for transdermal
insulin delivery was made of nickel, 75 μm in outer tip diameter, 10 μm in wall
thickness, an outer diameter of 300 μm at the needle base, taper angle of 12.7º relative to
the central needle axis, 500 μm in length, had needle-to-needle spacing of 600 μm and
inserted using a commercial device operating at approximately 10 m/s. Although nickel
does not pose significant safety concerns, it can cause skin irritation for individuals with
nickel allergy (Hostýnek and Maibach 2002, Maibach and Menné 1989, Storrs,
Rosenthal, et al. 1989).
4.3.2.2 Microneedle Fabrication
Microneedles with the geometry described above were fabricated using a process
involving laser drilling a polymer mold, coating the mold with a conductive seed layer,
electroplating the mold with metal, and finally releasing the resulting metal microneedle
array by selectively wet etching the mold.
Similar tapered needle molds used in fluid study experiments were laser-drilled by
tracing the laser beam in a circular path whose diameter was less than the diameter of the
circular beam. Electrodeposition onto these molds shown in Figure 3.1C yielded metal
microneedles. An example of a hollow metal tapered microneedle is shown in Figure
3.1B. Needle arrays of this geometry (shown in Figure 2.16) were used for the insulin
delivery experiments described below.
98
4.3.3 Insulin Delivery
To test the ability of microneedles to administer drugs, the arrays of hollow
microneedles (Figure 2.16) were used to deliver insulin to diabetic rats. Changes in
blood glucose level and plasma insulin concentration were monitored during and after
delivery of insulin through the microneedle arrays.
Figure 4.19 shows the effect of microneedles on transdermal insulin delivery. After
application of the microneedle “patch” and an approximately 30 minute lag time, blood
glucose level was steadily reduced over 4 h of insulin delivery to 47% of its original
value (ANOVA, p < 0.001). When insulin was subsequently removed from the skin,
blood glucose level remained approximately constant during 4 h of post-delivery
monitoring (ANOVA, p > 0.99). Animals receiving topical insulin without microneedles
as a negative control did not show statistically significant changes in blood glucose level
(ANOVA, p > 0.99). This pharmacodynamic response was similar to that seen following
subcutaneous hypodermic injection of 0.05 U of insulin and less than that seen for
injection of 0.5 U of insulin, which were used as positive controls (positive controls are
shown in Figure 4.13) (Davis, Martanto, et al. 2005)

99
0
25
50
75
100
-1 0 1 2 3 4 5 6 7 8
Time (h)
Nor
mal
ized
Blo
od G
luco
se L
evel
(%)
Figure 4.19 Effects of transdermal insulin delivery using microneedles on blood glucose level in diabetic, hairless rats. Blood glucose level before, during, and after transdermal insulin delivery using microneedles inserted into the skin ( ) and through intact skin (×). The arrow indicates the beginning and end of the 4-h insulin delivery period. Data are expressed as mean values (n ≥ 3) with average standard deviation associated with each data point of 24%. Blood glucose levels have been normalized relative to average pre-treatment levels.
As a direct measure of insulin delivery, Figure 4.20 shows plasma insulin
concentration as a function of time. The radioimmunoassay used to determine insulin
concentration was specific to the human insulin delivered, so that endogenous rat insulin
was not detected. Consistent with the blood glucose measurements, insulin was detected
in plasma at the 30-min time point and at a higher concentration at the end of the 4-h
delivery period. Four hours after insulin was removed from the skin, plasma insulin
levels did not change, which suggests slow release from a drug depot within the skin.
Negative control experiments showed that topical insulin without microneedles produced
undetectable levels of plasma insulin (data not shown).

100
0.0
0.1
0.2
0.3
0.4
0.5
30 min 4 h 8 h
Time
Plas
ma
Insu
lin L
evel
(ng/
ml)
Figure 4.20 Plasma insulin concentration in diabetic, hairless rats during (0.5 and 4 h) and after (8 h) transdermal delivery using microneedles. Data are expressed as mean values (n ≥ 3) with average standard deviation associated with each data point of 16%.
4.3.4 Interpretation of Insulin Delivery Results
We refer to the microneedle device as a “patch” because its operation is similar to a
transdermal patch. Microneedles were used to pierce across the skin’s outer barrier layer,
stratum corneum, and provide conduits for insulin transport into the skin for capillary
absorption and systemic distribution. Insulin delivery was by diffusion over time from a
reservoir on the skin surface. Although not done in this study, microneedles can also be
used in a manner more like an injection, where a drug solution is actively flowed through
the needles and into the skin (McAllister, Wang, et al. 2003).

101
The results in Figure 4.19 should be interpreted in the context of the effects of
anesthesia on blood glucose level. Urethane, which was used to anesthetize the rats, is
well known to influence blood glucose levels in rodents (Sanchez-Pozo, Alados, et al.
1988). Although glycemic levels are not altered in untreated diabetic rats, urethane is
known to reduce the hypoglycemic effect of injected insulin by as much as 50% (Wang,
Ren, et al. 2000). This suggests that the blood glucose level reduction reported in this
work may be similarly muted by the use of urethane.
Given the low oil-solubility of insulin, we used the assumption that insulin non-
aqueous compartment volume of distribution is negligible (Kastin and Akerstrom 1999).
Blood glucose pharmacodynamic measurements (Figure 4.19) suggest that on the order
of 50 mU of insulin was delivered by microneedles. In contrast, direct pharmacokinetic
measurements (Figure 4.20) demonstrating 0.43 ng/ml (12 μU/ml) of plasma insulin
corresponds to a dose of 1.4 mU, based on a 0.4 l/kg volume of distribution (Bachmann,
Pardoe, et al. 1996, Sifton 2003). This order-of-magnitude difference may be explained
by slower absorption of insulin injected into the subcutaneous space compared to delivery
near the capillary loops at the dermal-epidermal junction using microneedles.
4.3.5 Conclusions
To provide arrays of hollow metal microneedles that could be mass produced for
minimally invasive drug delivery, we developed a fabrication method to laser-drill a
polymer mold, coat the mold with a conductive seed layer, electroplate the mold with
metal, and release the metal microneedles by selectively etching the mold. Using this
approach, combined with a laser-trepanning technique to produce tapered holes,
microneedles were fabricated with a wide range of different geometries. The needle
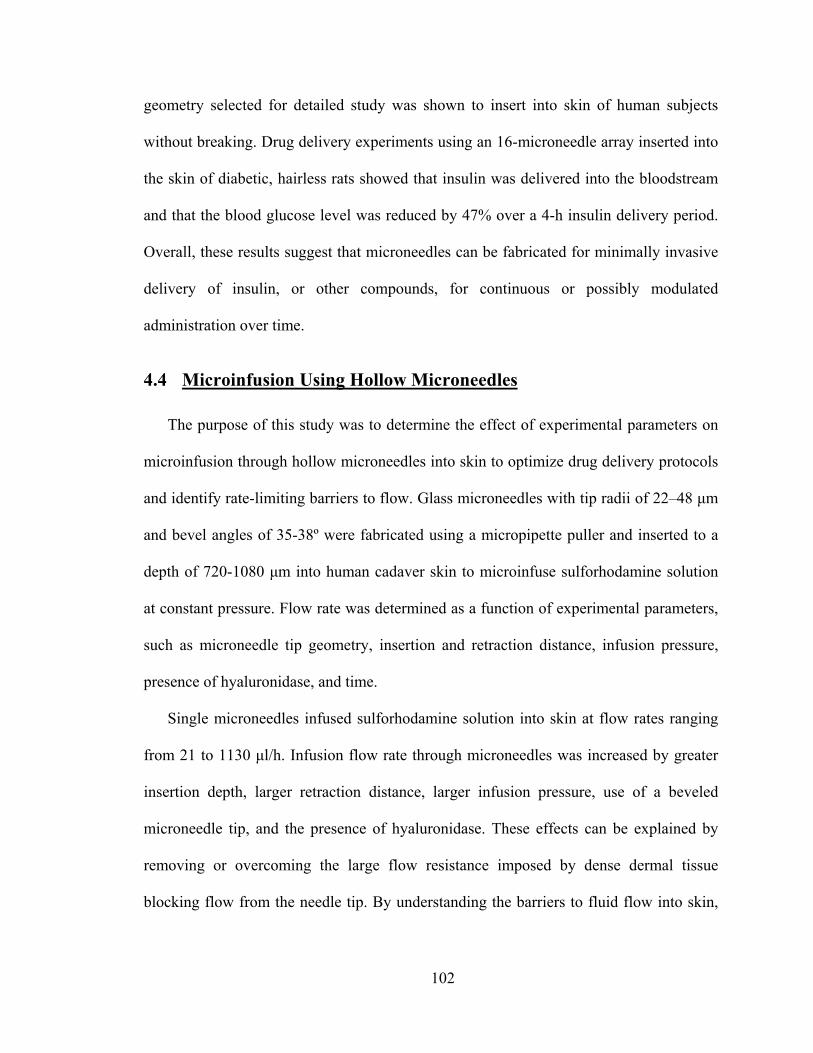
102
geometry selected for detailed study was shown to insert into skin of human subjects
without breaking. Drug delivery experiments using an 16-microneedle array inserted into
the skin of diabetic, hairless rats showed that insulin was delivered into the bloodstream
and that the blood glucose level was reduced by 47% over a 4-h insulin delivery period.
Overall, these results suggest that microneedles can be fabricated for minimally invasive
delivery of insulin, or other compounds, for continuous or possibly modulated
administration over time.
4.4 Microinfusion Using Hollow Microneedles
The purpose of this study was to determine the effect of experimental parameters on
microinfusion through hollow microneedles into skin to optimize drug delivery protocols
and identify rate-limiting barriers to flow. Glass microneedles with tip radii of 22–48 μm
and bevel angles of 35-38º were fabricated using a micropipette puller and inserted to a
depth of 720-1080 μm into human cadaver skin to microinfuse sulforhodamine solution
at constant pressure. Flow rate was determined as a function of experimental parameters,
such as microneedle tip geometry, insertion and retraction distance, infusion pressure,
presence of hyaluronidase, and time.
Single microneedles infused sulforhodamine solution into skin at flow rates ranging
from 21 to 1130 μl/h. Infusion flow rate through microneedles was increased by greater
insertion depth, larger retraction distance, larger infusion pressure, use of a beveled
microneedle tip, and the presence of hyaluronidase. These effects can be explained by
removing or overcoming the large flow resistance imposed by dense dermal tissue
blocking flow from the needle tip. By understanding the barriers to fluid flow into skin,
103
protocols can be designed for hollow microneedles to microinfuse fluid at therapeutically
relevant rates.
4.4.1 Introduction
Infusion pumps are used for many clinical applications, including intravenous,
epidural, and subcutaneous delivery of analgesics and anesthetics, antibiotics,
cardiovascular drugs, and insulin (Bode, Sabbah, et al. 2002, Doyle, Weinzimer, et al.
2004, Findley and Chamberlain 1999, Fox and Rowbotham 1999, Herndon and Fike
2001, Lenhard and Reeves 2001, Moulin and Kreeft 1991, Pasero 2002, Pickup, Mattock,
et al. 2002). Drug delivery via infusion reduces the plasma drug concentration fluctuation
associated with oral delivery and the slow onset and long depot effect associated with
transdermal patch delivery. Infusion pumps are commonly used when continuous,
intermittent or pulsatile delivery of drug is needed. They also provide an alternative for
patients intolerant to oral administration and can be programmed to achieve special
delivery profiles. The use of infusion pumps outside the clinical setting has been limited
by the device’s bulky size and expensive cost (Colquitt, Green, et al. 2004) as well as its
low patient compliance due to the inconvenience of an indwelling catheter that has a
relatively large infusion set and the expertise required to properly use it (Liebl 2002,
Moulin and Kreeft 1991)
Recently, a compact, disposable drug delivery device that incorporates a relatively
short, 5-mm long hypodermic needle has been shown to continuously and subcutaneously
infuse drug solutions, such as heparin to prevent thrombosis (Meehan, Gross, et al. 1997)
and morphine sulfate for management of cancer pain (Gross and Kelly 1996, Gross, Lavi,
et al. 2002, Gross, Tsals, et al. 2003, Lynch, Butler, et al. 2000, Meehan, Gross, et al.

104
1997). This type of device can be worn on the skin in a discrete and convenient manner
and deliver drug from a pressure-driven reservoir through the needle into the skin.
Despite its minimally invasive approach, local erythema, edema, and contact dermatitis at
the injection site have been reported with the use of this device (Jolanki, Kanerva, et al.
2001). As a further improvement, needles could be made still smaller to provide an even
less invasive and painless needle to increase patient compliance.
To address this need, we and others have adapted microfabrication technology to
produce needles of micron dimensions. Microneedles can be coupled with a micropump
to make a wearable infusion device that is highly patient friendly and can serve as a
potential replacement for conventional hypodermic needles and infusion sets.
Microneedles are expected to be safe, because they are minimally invasive devices that
are inserted only into skin’s superficial layers and are typically bloodless and painless.
Microneedles are also expected to be effective, as a hybrid between transdermal patches
and injection/infusion.
Microneedles were originally designed to increase skin permeability for patch-based
delivery by diffusion. In this application, solid microneedles have been shown to increase
transdermal transport by orders of magnitude in vitro for a variety of compounds (Chabri,
Bouris, et al. 2004, McAllister 2000). In vivo studies have demonstrated delivery of
insulin (Davis, Martanto, et al. 2005), oligonucleotides (Lin, Cormier, et al. 2001), human
growth hormone (Cormier and Daddona 2003), and desmopressin (Cormier, Johnson, et
al. 2004), as well as ovalbumin (Matriano, Cormier, et al. 2002), DNA (Mikszta,
Alarcon, et al. 2002) and anthrax (Mikszta, Sullivan, et al. 2005) vaccines. Human pain

105
studies have shown that insertion of microneedles can be painless and does not cause skin
irritation (Kaushik, Hord, et al. 2001, Mikszta, Alarcon, et al. 2002)
Of greater relevance to infusion, microneedles containing a hollow bore have also
been made using a variety of different microfabrication approaches (McAllister, Allen, et
al. 2000, Reed and Lye 2004). Active injection using hollow microneedles coupled to a
syringe or pump has been demonstrated for insulin delivery to diabetic hairless rats in
vivo (Gardeniers, Luttge, et al. 2003, McAllister, Wang, et al. 2003), administration of
chemical stimuli into brain tissue in vivo (Chen, Wise, et al. 1997), and injection of
fluorescent dye into chicken thigh in vitro (Stoeber and Liepmann 2002). Hollow
microneedles have also been used to passively deliver insulin by diffusion to diabetic rats
(Davis, Martanto, et al. 2005) and to extract nanoliter quantities of blood for glucose
measurement in human (Smart and Subramanian 2000).
Motivated by these studies demonstrating microinjection of drugs into skin using
hollow microneedles, there is a need for systematic study of the effects of infusion
parameters, and their optimization, on flow rate using hollow microneedles. Previous
studies in the literature report delivery of relatively small volumes of drug solution into
the skin, which were enough to have effects on rodents, but may not be sufficient to
accommodate many human doses. To address the need to increase and control infusion
rate, this study sought to experimentally quantify the relationship between infusion flow
rate and different experimental parameters, such as needle insertion depth, retraction
distance, infusion pressure, needle geometry, and the presence of hyaluronidase. We
therefore used single glass microneedles to infuse sulforhodamine solution into human
cadaver skin and measured the infusion flow rate as a function of various experimental

106
parameters. The resulting data were used to determine optimal infusion protocols and
identify rate-limiting barriers to flow. Analysis was guided by the hypothesis that
infusion through hollow microneedles into skin is limited by the resistance to flow
offered by dense dermal tissue compressed during microneedle insertion.
4.4.2 Fabrication and Characterization of Microneedles
Although clinical applications of microneedles are envisioned using multi-needle
arrays made of metal that are mass-produced by microfabrication, we used hand-drawn
glass microneedles in this study to facilitate easy visualization of microinfusion into the
skin and because of their versatility to be rapidly fabricated in various geometries. A
representative glass microneedle is shown in Figure 4.21. These needles could be
repeatedly inserted into skin without breaking.
250
μm
A B
250
μm
A B
250
μm25
0 μm
A B
Figure 4.21 (A) Front and (B) side views of a representative hollow, glass microneedle. The microneedle shown measures 30 μm in effective radius at the tip with a bevel angle of 38º.
Single microneedles were inserted into human cadaver skin in vitro to a controlled
depth and then, sometimes, partially retracted. Figure 4.22 shows a cross section of a

107
piece of skin pierced with a microneedle and then chemically fixed for histological
sectioning and staining. The hole made by the microneedle is evident, measuring 300 –
350 μm deep and having the same shape as the microneedle. Some deformation of the
skin surface is also evident, due to skin deflection during insertion. A small volume of
dye was injected into the skin and its infusion trajectory is also shown in Figure 4.22.
More dye is present on the right side of the image, presumably because the needle bevel
was on the right and channeled flow in that direction. The directional nature of the flow
further appears to be influenced by skin microstructure, where infusion pathways follow
dermal collagen fiber orientation. As a comparison, Figure 4.23 shows a cross section of
control skin (after chemically fixed and stained).
400 μm400 μm400 μm
Figure 4.22 Histological section of human cadaver skin pierced with a hollow microneedle in vitro. The needle was inserted to a depth of 1080 μm and then retracted 720 μm to a final insertion depth of 360 μm. The needle had a 36º beveled tip with a 32 μm effective radius opening. A small amount of blue dye was infused into the skin at a pressure of 138 kPa for 1 min and then the skin was fixed with the needle in place. Before H&E staining and histological sectioning, the needle was removed and is not present in the image shown. The site of needle insertion is evident as the triangular region missing tissue and the paths of fluid injection are indicated by the presence of blue dye.

108
400 μm400 μm400 μm
Figure 4.23 Histological section of a control human cadaver skin.
In a typical experiment, hundreds of microliters of fluid were infused into skin, which
was distributed over an area measuring millimeters to centimeters across. Figure 4.24
shows representative images of the top and bottom surfaces of human cadaver skin after
sulforhodamine infusion using a microneedle. All dye was contained within the skin and
did not represent surface staining; leakage onto the skin surface during infusion was
rarely seen. Dye distribution observed from the skin surface, shown as the circular dark
area in Figure 4.24A, was generally more constrained than when viewed from underneath
the skin, as shown by the widespread staining in Figure 4.24B. Additional studies showed
that microneedles could also be inserted into pig and rat cadaver skin to microinfuse
sulforhodamine solution in a similar manner (data not shown).
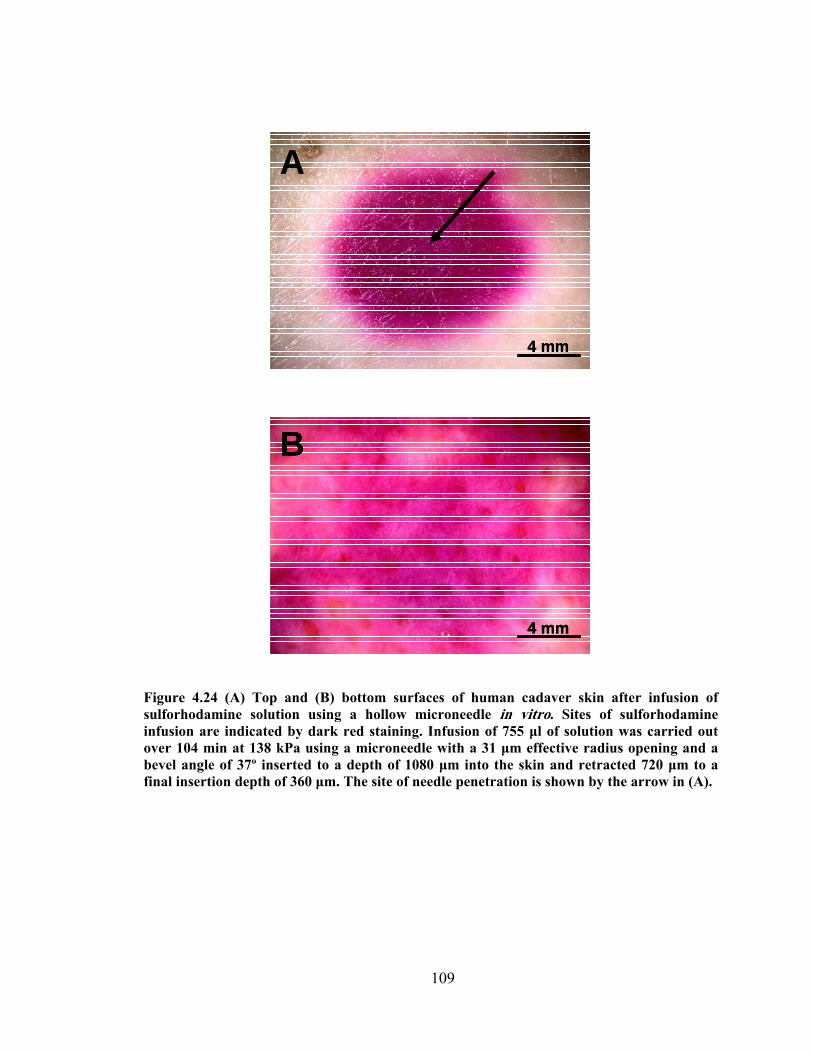
109
A
4 mm
A
4 mm
A
4 mm4 mm
B
4 mm
B
4 mm
B
4 mm4 mm
Figure 4.24 (A) Top and (B) bottom surfaces of human cadaver skin after infusion of sulforhodamine solution using a hollow microneedle in vitro. Sites of sulforhodamine infusion are indicated by dark red staining. Infusion of 755 μl of solution was carried out over 104 min at 138 kPa using a microneedle with a 31 μm effective radius opening and a bevel angle of 37º inserted to a depth of 1080 μm into the skin and retracted 720 μm to a final insertion depth of 360 μm. The site of needle penetration is shown by the arrow in (A).
110
4.4.3 Effect of Insertion and Retraction
To determine the effects of infusion parameters, microneedle infusion flow rates were
measured over a range of different experimental conditions. Considering the most
straightforward scenario of microneedle insertion without retraction, microneedle
insertion to a depth of 1080 μm permitted sulforhodamine solution flow into the skin at a
rate of 28 μl/h (Figure 4.25A). Retraction of the needle led to progressively larger flow
rates, where a 900 μm retraction, corresponding to a net insertion of 180 μm, produced a
flow rate of 326 μl/h. Initial insertion to lesser depths similarly produced low flow rates
that were progressively increased with needle retraction (Figure 4.25B and Figure 4.25C).
When these data from different insertion and retraction combinations are combined, a
significant increase in flow rate with increasing retraction distance is apparent (Figure
4.25D; ANOVA, p < 0.05). Further analysis also shows a significant increase in flow rate
with increasing initial insertion depth (ANOVA; p < 0.001). Decreasing the net insertion
depth, which corresponds to the initial insertion depth minus the retraction distance, also
resulted in a larger flow rate (Figure 4.25E; ANOVA, p < 0.05).
Considered together, these findings demonstrate that flow rate is largest when
retraction distance is maximized by inserting deeply and retracting almost completely.
This is consistent with our hypothesis that compressed dermal tissue blocks flow from
microneedles, since needle retraction should relieve compressive forces applied to the
tissue by the microneedle and permit compressed dermal tissue to expand.

111
0 250 500
()
Flow Rate (∠l/h)0 250 500
Flow Rate (ξ l/h)0 250 500
(
Flow Rate (μl/h)
Net
Inse
rtio
n D
epth
(μm
)
A
1080
900
720
540
360
180
B C
0 250 500
()
Flow Rate (∠l/h)0 250 500
Flow Rate (ξ l/h)0 250 500
(
Flow Rate (μl/h)
Net
Inse
rtio
n D
epth
(μm
)
A
1080
900
720
540
360
180
1080
900
720
540
360
180
B C
0
100
200
300
400
500
0 180 360 540 720 900Retraction Distance (μm)
Flow
Rat
e ( μ
l/h)
D
0
100
200
300
400
500
0 180 360 540 720 900Retraction Distance (μm)
Flow
Rat
e ( μ
l/h)
D
0
100
200
300
400
500
180 360 540 720 900 1080Net Insertion Depth (μm)
Flow
Rat
e ( μ
l/h)
E
0
100
200
300
400
500
180 360 540 720 900 1080Net Insertion Depth (μm)
Flow
Rat
e ( μ
l/h)
E
Figure 4.25 Effect of insertion depth and retraction distance on flow rate into human cadaver skin in vitro. Microneedles were initially inserted to a maximum insertion depth of (A) 1080 μm, (B) 900 μm or (C) 720 μm and then retracted various distances back toward the skin surface to a final, net insertion depth. Pooling the data from parts (A), (B), and (C), flow rate is shown as a function of (D) retraction distance and (E) net insertion depth for maximum insertion depths of 720 μm (white bars), 900 μm (striped bars) and 1080 μm (black bars). Microneedles had tip opening effective radii of 27 – 31 μm with bevel angles of 35 – 37º. Infusion was performed for 5 min at 138 kPa without needle retraction, after which, microneedles were retracted by 180 μm every 5 min to a final insertion depth of 180 μm. Data are expressed as mean values (n ≥ 3) with standard deviation bars.
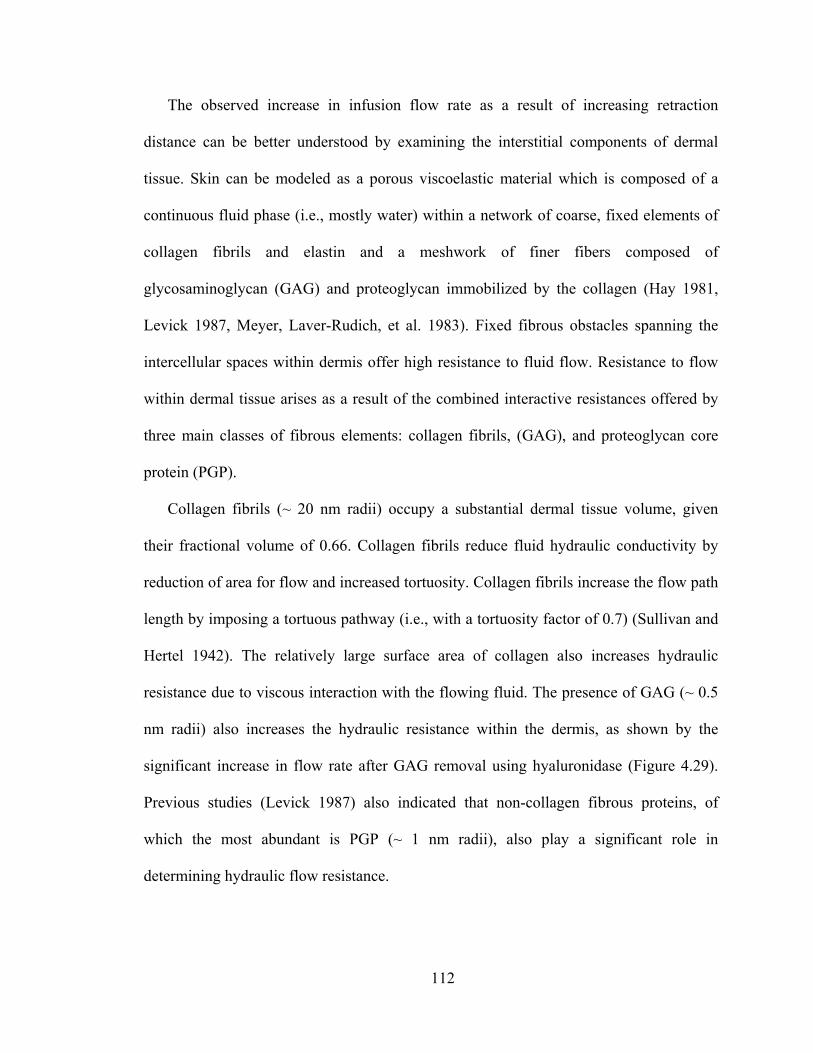
112
The observed increase in infusion flow rate as a result of increasing retraction
distance can be better understood by examining the interstitial components of dermal
tissue. Skin can be modeled as a porous viscoelastic material which is composed of a
continuous fluid phase (i.e., mostly water) within a network of coarse, fixed elements of
collagen fibrils and elastin and a meshwork of finer fibers composed of
glycosaminoglycan (GAG) and proteoglycan immobilized by the collagen (Hay 1981,
Levick 1987, Meyer, Laver-Rudich, et al. 1983). Fixed fibrous obstacles spanning the
intercellular spaces within dermis offer high resistance to fluid flow. Resistance to flow
within dermal tissue arises as a result of the combined interactive resistances offered by
three main classes of fibrous elements: collagen fibrils, (GAG), and proteoglycan core
protein (PGP).
Collagen fibrils (~ 20 nm radii) occupy a substantial dermal tissue volume, given
their fractional volume of 0.66. Collagen fibrils reduce fluid hydraulic conductivity by
reduction of area for flow and increased tortuosity. Collagen fibrils increase the flow path
length by imposing a tortuous pathway (i.e., with a tortuosity factor of 0.7) (Sullivan and
Hertel 1942). The relatively large surface area of collagen also increases hydraulic
resistance due to viscous interaction with the flowing fluid. The presence of GAG (~ 0.5
nm radii) also increases the hydraulic resistance within the dermis, as shown by the
significant increase in flow rate after GAG removal using hyaluronidase (Figure 4.29).
Previous studies (Levick 1987) also indicated that non-collagen fibrous proteins, of
which the most abundant is PGP (~ 1 nm radii), also play a significant role in
determining hydraulic flow resistance.
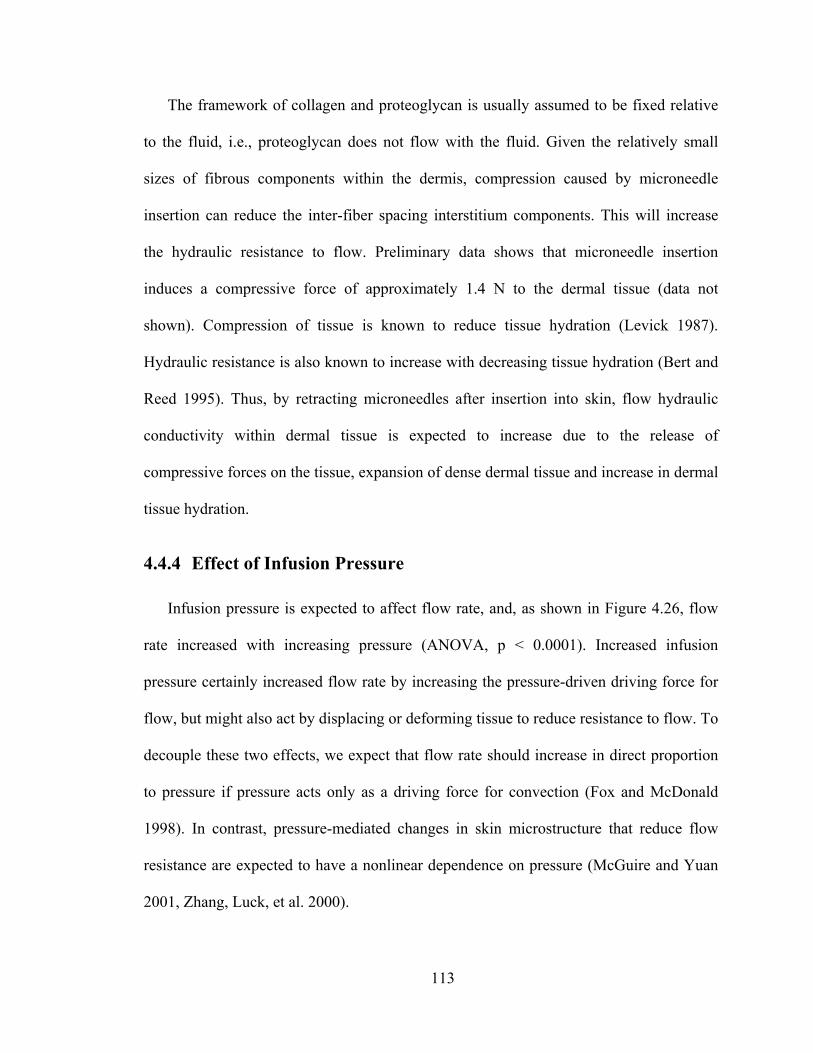
113
The framework of collagen and proteoglycan is usually assumed to be fixed relative
to the fluid, i.e., proteoglycan does not flow with the fluid. Given the relatively small
sizes of fibrous components within the dermis, compression caused by microneedle
insertion can reduce the inter-fiber spacing interstitium components. This will increase
the hydraulic resistance to flow. Preliminary data shows that microneedle insertion
induces a compressive force of approximately 1.4 N to the dermal tissue (data not
shown). Compression of tissue is known to reduce tissue hydration (Levick 1987).
Hydraulic resistance is also known to increase with decreasing tissue hydration (Bert and
Reed 1995). Thus, by retracting microneedles after insertion into skin, flow hydraulic
conductivity within dermal tissue is expected to increase due to the release of
compressive forces on the tissue, expansion of dense dermal tissue and increase in dermal
tissue hydration.
4.4.4 Effect of Infusion Pressure
Infusion pressure is expected to affect flow rate, and, as shown in Figure 4.26, flow
rate increased with increasing pressure (ANOVA, p < 0.0001). Increased infusion
pressure certainly increased flow rate by increasing the pressure-driven driving force for
flow, but might also act by displacing or deforming tissue to reduce resistance to flow. To
decouple these two effects, we expect that flow rate should increase in direct proportion
to pressure if pressure acts only as a driving force for convection (Fox and McDonald
1998). In contrast, pressure-mediated changes in skin microstructure that reduce flow
resistance are expected to have a nonlinear dependence on pressure (McGuire and Yuan
2001, Zhang, Luck, et al. 2000).
114
0
200
400
600
800
1000
1200
0 180 360 540 720 900Retraction Distance (μm)
Flow
Rat
e ( μ
l/h)
Figure 4.26 Effect of pressure on flow rate into human cadaver skin. Microinfusion flow rate was measured as a function of retraction distance at three pressures: 69 kPa (white bars), 138 kPa (striped bars) and 172 kPa (black bars). Microneedles having 35 – 37º beveled tips with 27 – 32 μm effective radius openings were inserted to a maximum depth of 1080 μm. Data are expressed as mean values (n ≥ 3) with standard deviation bars.
Guided by these expected behaviors, the flow rate data shown in Figure 4.26 were
normalized by the infusion pressure. From 69 to 138 kPa, the increase in flow rate was
proportional to the increase in pressure (ANOVA, p = 0.14). However, at 172 kPa, the
flow rate showed a disproportionately large increase relative to the pressure increase
(ANOVA, p < 0.001). This nonlinearity suggests that elevated pressure reduced flow
resistance by displacing or deforming the dense dermal tissue impeding flow.
4.4.5 Effect of Microneedle Tip Bevel
Dermal tissue compressed by needle insertion should be most dense at the needle tip.
Thus, flow from a blunt-tip microneedle, where the hole is located at the needle tip,
115
should encounter greater resistance than flow from a bevel-tip microneedle, where the
hole is off to the side. Consistent with this hypothesis, infusion flow rate from a bevel-tip
microneedle was on average 3-fold greater than from a blunt-tip microneedle (Figure
4.27; ANOVA, p < 0.0001).
0
100
200
300
400
500
0 180 360 540 720 900Retraction Distance (μm)
Flow
Rat
e ( μ
l/h)
0
100
200
300
400
500
0 180 360 540 720 900Retraction Distance (μm)
Flow
Rat
e ( μ
l/h)
Figure 4.27 Effect of tip bevel on flow rate into human cadaver skin. Microinfusion flow rate was measured as a function of retraction distance during infusion using hollow microneedles with a blunt tip (white bars; left inset image) and a 35º beveled tip (black bars; right inset image). Microneedles with 27 – 32 μm effective radius openings were inserted to a maximum depth of 1080 μm and infusion was carried out at 138 kPa. Data are expressed as mean values (n ≥ 3) with standard deviation bars.
4.4.6 Effect of Microneedle Tip Opening Size
If dense dermal tissue is the main barrier to flow, the size of the microneedle tip
opening is expected to have only small effects since the microneedle itself does not
impose the rate-limiting barrier. Consistent with this expectation, varying tip openings
with effective radii ranging from 22 to 48 μm (i.e., tip areas ranging from 1462 to 7400

116
μm2) had no significant effect on infusion flow rate (Figure 4.28; ANOVA, p = 0.27).
This suggests that the primary resistance to flow is not at the needle tip–to–skin interface,
which would be heavily influenced by a 5-fold change in area. Instead, the volume of
dense dermal tissue surrounding the tip appears to limit flow, where the size and density
of this tissue is probably governed primarily by the depth of needle insertion and
retraction, with little influence from tip opening size.
0
100
200
300
400
500
600
0 180 360 540 720 900Retraction Distance (μm)
Flow
Rat
e ( μ
l/h)
0
100
200
300
400
500
600
0 180 360 540 720 900Retraction Distance (μm)
Flow
Rat
e ( μ
l/h)
Figure 4.28 Effect of tip opening size on flow rate into human cadaver skin. Microinfusion flow rate was measured as a function of retraction distance using three different tip opening sizes: 22 μm (black bars; left inset image), 30 μm (striped bars; center inset image) and 48 μm (white bars; right inset image) effective radii. Microneedles having 35 – 37º beveled tips were inserted to a maximum depth of 1080 μm and infusion was carried out at 138 kPa. Data are expressed as mean values (n ≥ 3) with standard deviation bars.
4.4.7 Effect of Hyaluronidase
Hyaluronidase is known to reduce flow resistance in the skin by breaking down
hyaluronan, a glycosaminoglycan within skin collagen fibers (Bruera, Neumann, et al.
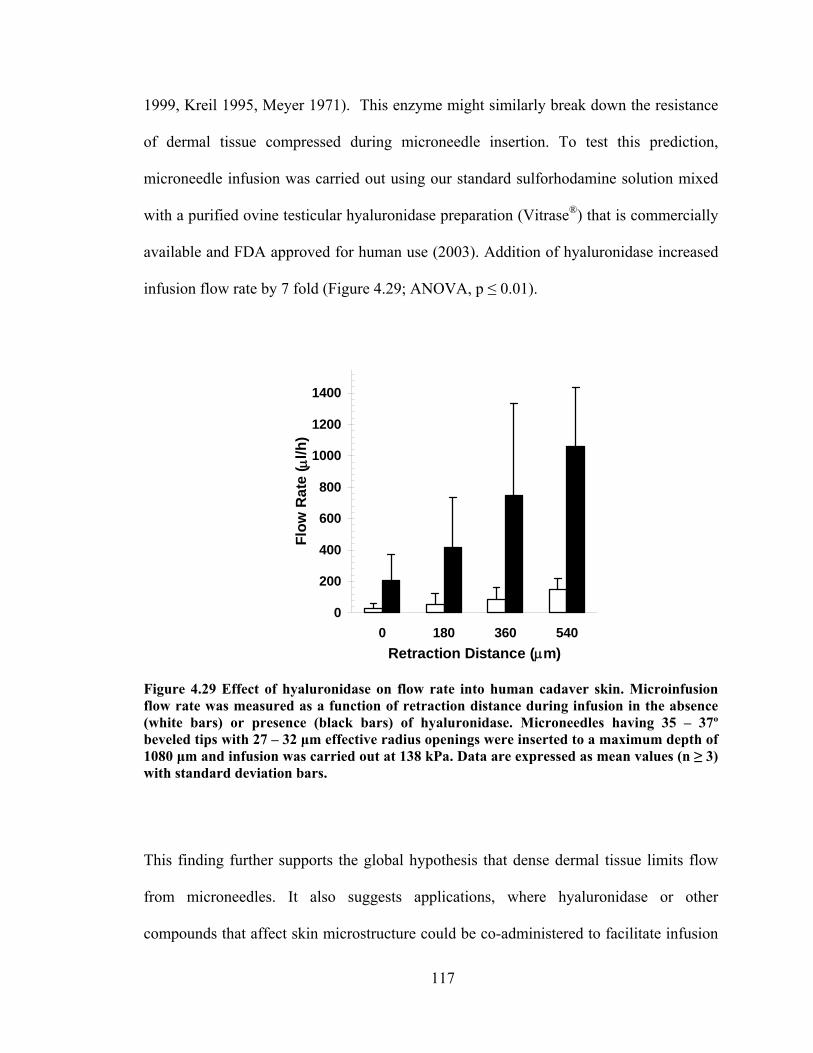
117
1999, Kreil 1995, Meyer 1971). This enzyme might similarly break down the resistance
of dermal tissue compressed during microneedle insertion. To test this prediction,
microneedle infusion was carried out using our standard sulforhodamine solution mixed
with a purified ovine testicular hyaluronidase preparation (Vitrase®) that is commercially
available and FDA approved for human use (2003). Addition of hyaluronidase increased
infusion flow rate by 7 fold (Figure 4.29; ANOVA, p ≤ 0.01).
0
200
400
600
800
1000
1200
1400
0 180 360 540Retraction Distance (μm)
Flow
Rat
e ( μ
l/h)
Figure 4.29 Effect of hyaluronidase on flow rate into human cadaver skin. Microinfusion flow rate was measured as a function of retraction distance during infusion in the absence (white bars) or presence (black bars) of hyaluronidase. Microneedles having 35 – 37º beveled tips with 27 – 32 μm effective radius openings were inserted to a maximum depth of 1080 μm and infusion was carried out at 138 kPa. Data are expressed as mean values (n ≥ 3) with standard deviation bars.
This finding further supports the global hypothesis that dense dermal tissue limits flow
from microneedles. It also suggests applications, where hyaluronidase or other
compounds that affect skin microstructure could be co-administered to facilitate infusion
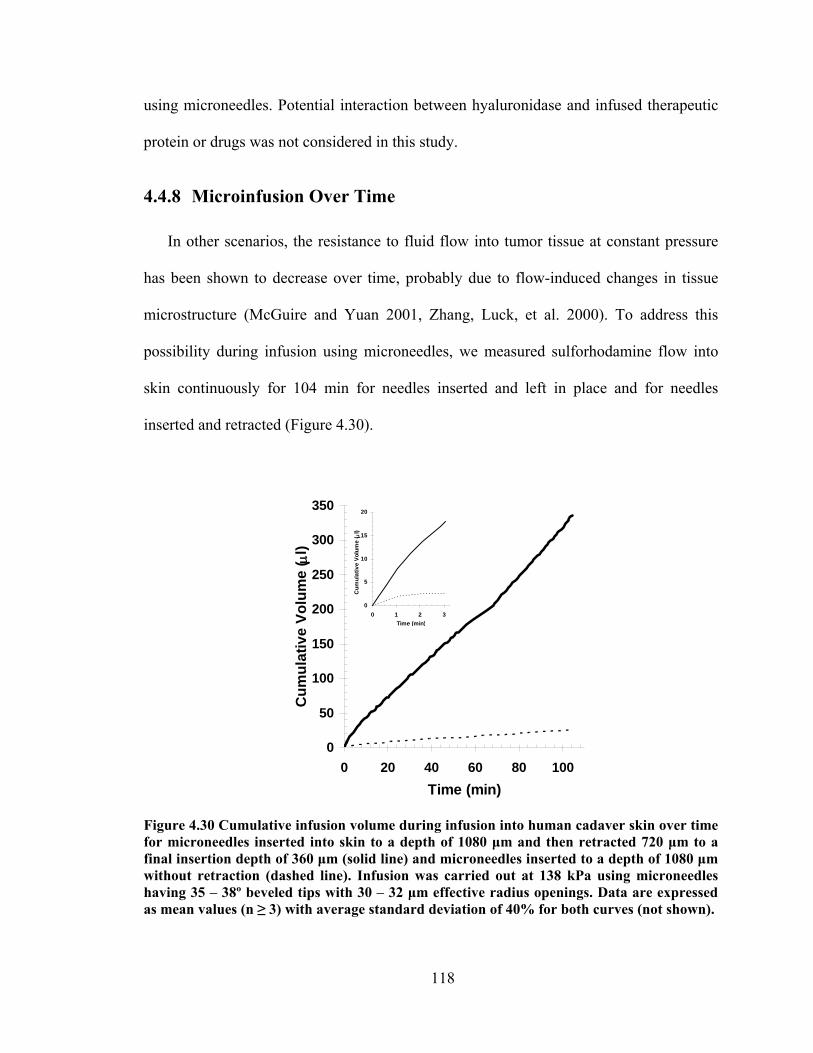
118
using microneedles. Potential interaction between hyaluronidase and infused therapeutic
protein or drugs was not considered in this study.
4.4.8 Microinfusion Over Time
In other scenarios, the resistance to fluid flow into tumor tissue at constant pressure
has been shown to decrease over time, probably due to flow-induced changes in tissue
microstructure (McGuire and Yuan 2001, Zhang, Luck, et al. 2000). To address this
possibility during infusion using microneedles, we measured sulforhodamine flow into
skin continuously for 104 min for needles inserted and left in place and for needles
inserted and retracted (Figure 4.30).
0
50
100
150
200
250
300
350
0 20 40 60 80 100Time (min)
Cum
ulat
ive
Volu
me
( μl)
Figure 4.30 Cumulative infusion volume during infusion into human cadaver skin over time for microneedles inserted into skin to a depth of 1080 μm and then retracted 720 μm to a final insertion depth of 360 μm (solid line) and microneedles inserted to a depth of 1080 μm without retraction (dashed line). Infusion was carried out at 138 kPa using microneedles having 35 – 38º beveled tips with 30 – 32 μm effective radius openings. Data are expressed as mean values (n ≥ 3) with average standard deviation of 40% for both curves (not shown).
0
5
10
15
20
0 1 2 3Time (min)
Cum
ulat
ive
Volu
me
( μl)
119
In both cases, the cumulative volume of fluid infused into skin increased linearly with
time (linear regression correlation coefficient, R2 > 0.99), suggesting that skin resistance
to flow did not change over the timescale studied. Note that the pressure used in this
experiment was less than the pressure identified previously to induce non-linear changes
in flow rate (Figure 4.26), which is consistent with this observation that flow rate did not
change with time. Despite the generally linear trend, the flow rate was transiently higher
at the onset of flow and then decayed within a few minutes to a steady state (Figure 4.30
inset). This effect might be explained by the rapid filling of a small cavity in the skin at
the needle tip formed by the insertion/retraction process, followed by slower infusion into
and across intact, compressed tissue.
Given the relatively low pressure drop across the microneedles, tissue resistance is
expected to be the dominant resistance to flow during a microneedle injection into skin.
To test this hypothesis, flow rate measurement from Figure 4.1, which corresponds to
flow of fluid through microneedles into the air (i.e., without the presence of skin for
microneedles with radii of 25 and 34 μm), was plotted together with a subset of flow rate
measurements in Figure 4.26, which correspond to flow of fluid through microneedles
during microinfusion into skin (i.e., at infusion pressures of 69, 138, 172 kPa with and
without the presence of hyaluronidase). This comparison is shown in Figure 4.31, which
indicates that the presence of skin tissue decreases the flow rate by one or more orders of
magnitude. Overall this result suggests that dermal tissue offers significant resistance to
flow during microinfusion using microneedles into skin.
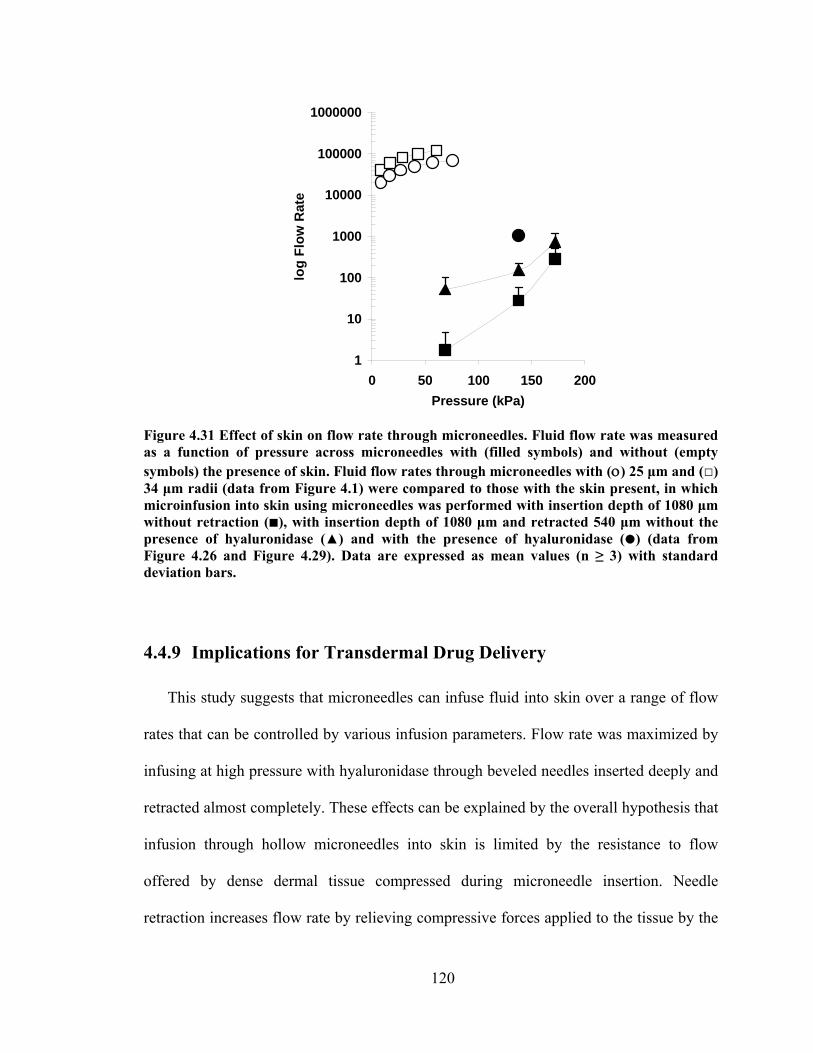
120
1
10
100
1000
10000
100000
1000000
0 50 100 150 200Pressure (kPa)
log
Flow
Rat
e
Figure 4.31 Effect of skin on flow rate through microneedles. Fluid flow rate was measured as a function of pressure across microneedles with (filled symbols) and without (empty symbols) the presence of skin. Fluid flow rates through microneedles with (ο) 25 μm and (□) 34 μm radii (data from Figure 4.1) were compared to those with the skin present, in which microinfusion into skin using microneedles was performed with insertion depth of 1080 μm without retraction ( ), with insertion depth of 1080 μm and retracted 540 μm without the presence of hyaluronidase (▲) and with the presence of hyaluronidase ( ) (data from Figure 4.26 and Figure 4.29). Data are expressed as mean values (n ≥ 3) with standard deviation bars.
4.4.9 Implications for Transdermal Drug Delivery
This study suggests that microneedles can infuse fluid into skin over a range of flow
rates that can be controlled by various infusion parameters. Flow rate was maximized by
infusing at high pressure with hyaluronidase through beveled needles inserted deeply and
retracted almost completely. These effects can be explained by the overall hypothesis that
infusion through hollow microneedles into skin is limited by the resistance to flow
offered by dense dermal tissue compressed during microneedle insertion. Needle
retraction increases flow rate by relieving compressive forces applied to the tissue by the
121
microneedle and allowing compressed tissue to expand. Increased pressure also increases
flow rate by increasing the driving force and by displacing or deforming tissue to reduce
resistance to flow. A beveled microneedle reduces flow resistance by infusing to the side
of the dense tissue formed at the needle tip. Hyaluronidase attacks glycosaminoglycan
structure within skin to break down the barriers to flow. Needle tip opening size did not
affect infusion, because the compression of tissue at the needle tip is governed primarily
by the depth of needle insertion and retraction.
The study is significant because it is the first to systematically examine the effects of
infusion parameters and optimize them to increase flow rate into skin using hollow
microneedles. In contrast to previous studies that infused relatively small volumes using
non-optimized protocols, this study provides strategies to increase flow rate using
appropriate insertion protocols and needle design. In addition to these experimental
observations, the mechanistic interpretation that compressed tissue is a rate-limiting
barrier to flow provides a rational approach to further optimize infusion methods and
design new approaches.
Single microneedles can infuse fluid into skin at flow rates up to 1 ml/h, which is
sufficient for many applications. Delivery from an array containing multiple needles
should increase flow rates further, possibly increasing linearly with the number of
needles. In this way, hollow microneedles can be envisioned as a minimally invasive
alternative to conventional infusion sets based on hypodermic needles and catheters. In
one scenario, microneedles could be coupled with a commercially-available infusion
pump to provide a patient-friendly needle alternative that could be especially attractive
for home use by patients. Due to their low profile, microneedles could also be mounted

122
on the base of a small, “wearable” pump that could be applied to the skin much like an
oversized patch for still greater patient convenience. Potential applications of this
technology include insulin, hormonal therapies requiring pulsatile delivery, and drugs
with short half lives that require frequency administration.
Despite these opportunities, there are limitations to infusion using microneedles. The
maximum flow rate observed in this study is much slower than hypodermic injection,
suggesting that microneedles are not appropriate when rapid bolus delivery is needed, for
example, in emergency situations. Moreover, some infusion protocols require intravenous
administration, which microneedles cannot achieve, inherent to their design. Although
average flow rate over extended time was stable for 104 min in this study, instantaneous
flow rate showed some instability using a constant pressure driving force (e.g., Figure
4.30). This problem could be addressed by using a constant flow rate pump instead.
Finally, cost-effective applications will require replacing the single, hand-drawn, glass
needles used in this study with arrays of metal microneedles mass-produced by adapting
existing microfabrication technology and integrating them into user-friendly devices
containing a drug reservoir, micropump, and microelectronic controls.
4.4.10 Conclusions
Guided by the hypothesis that infusion through hollow microneedles into skin is
limited by the resistance to flow offered by dense dermal tissue compressed during
microneedle insertion, this study systematically examined the effects of infusion
parameters and optimized them to increase flow rate into skin. Overall, flow rate was
optimized by inserting needles deeply and then retracting almost completely, infusing at
high pressure, using microneedles with a beveled tip, and adding hyaluronidase to the
123
infusion fluid. Microneedle tip opening size did not significantly affect flow rate.
Infusion over longer times demonstrated a constant flow rate after a short, transient burst
at constant pressure. Altogether, this study shows that hollow microneedles can be
designed to infuse milliliter quantities of fluid into skin to make transdermal delivery of
many drugs possible and to provide a minimally invasive alternative to conventional
infusion sets based on hypodermic needles and catheters.
124
5 CONCLUSIONS
Transdermal drug delivery offers a less invasive way to deliver drug across the skin
compared to painful injection using hypodermic needles. In addition, it also overcomes
problems with oral delivery such as poor absorption and enzymatic degradation of drugs.
Despite these advantages, passive transdermal drug delivery using patches is limited to a
dozen FDA-approved drugs which have certain desired transport properties across the
skin. Microneedles were previously fabricated to address the problems associated with
hypodermic injection, transdermal patches and oral delivery.
To develop an optimized design of microneedles for painless injection and other
microfluidic applications, in this study, we used hollow microneedles to determine the
relationship between pressure drop and flow rate as a function of microneedle geometry
and fluid viscosity. Hollow microneedles can be used to flow liquids at rates of 1.4 – 56
µl/s with pressure drops in the range of 4.6 – 196.5 kPa, which suggests that
microneedles could be coupled with micropumps to deliver therapeutically useful
quantities of fluid from a patch-like device. Needle tip diameter and tip angle are the
primary control parameters for flow through conically tapered microneedles, whereas
other geometric features, such as needle length and inlet diameter, are much less
important as shown by numerical simulation. The curvature of the taper also plays a
small role, with straight-sided needles exhibiting the least resistance to flow due to the
nearly optimal development of the viscous boundary layers for this geometry and range
of Reynolds numbers. This study suggests that a maximum flow rate and minimum
pressure drop can be achieved using microneedles with a straight-sided cone, a cone half-
angle of about 20 – 30º and a large tip diameter. This work also shows that microneedles

125
can be used to flow fluid for drug delivery and other microfluidic applications with only
modest pressure drops that can be predicted and optimized using a numerical model. This
study provided the first detailed study of flow through microneedles specifically and of
developing flow through conical channels in general. Given the relatively low pressure
drops across microneedles, tissue resistance is likely to be the dominant resistance to flow
during a microneedle injection into skin.
In this study, we also demonstrated the use of solid metal microneedle arrays to insert
into the skin of hairless rats to increase transdermal insulin delivery and thereby lower
blood glucose levels by as much as 80% in diabetic hairless rats in vivo. More insulin
delivery and larger drops in blood glucose level were achieved by shorter microneedle
insertion times, fewer repeated insertions and larger insulin concentration in the donor
solution. Microneedle-based insulin delivery showed reduction in blood glucose levels
similar to subcutaneous hypodermic injection of 0.05 – 0.5 U insulin. Direct
measurements showed blood insulin concentrations of 0.5 – 7.4 ng/ml. Solid
microneedles were capable to fully insert into skin and deliver insulin due to their
relatively long length (i.e., 1 mm) and sharp tips which facilitate easy insertion with
minimal skin deformation. Altogether, this study demonstrated, for the first time, that
microneedles can be used to deliver a biologically active, therapeutic protein in vivo,
which suggests future uses for minimally invasive protein delivery in clinical
applications.
To extend microneedle delivery capabilities, we used hollow tapered microneedles to
insert into the skin of diabetic, hairless rats and deliver insulin that resulted in blood
glucose level reduction by 47% over a 4-h insulin delivery period. Given that the tips of

126
hollow microneedles were not as sharp as those in solid microneedles, greater skin
deflection was encountered during their insertion into skin when compared to that of
solid microneedle insertion. Despite significant skin deflection, the tips of hollow
microneedles were capable to create transport pathways across the stratum corneum to
allow insulin diffusion. This study represented the first demonstration of diffusion-based
delivery through hollow microneedles. Overall, these results suggest that solid and
hollow microneedles can be fabricated for minimally invasive delivery of insulin, or
other compounds, for continuous or possibly modulated administration over time.
To further optimize the design and use of hollow microneedles for microinfusion, we
determined the effect of microneedle geometry and various infusion parameters on
infusion flow rate using glass microneedle injections into skin. Larger infusion flow rate
could be achieved by a microneedle with beveled tip which was inserted deeper into the
skin. In addition, larger infusion pressure and the presence of hyaluronidase led to a
larger infusion flow rate as well. Increased flow rate during infusion using bevel tip
microneedles could be explained as a result of less probability of tissue coring and/or
flow to the side of dense dermal tissue. Deeper needle insertion followed by a large
retraction distance allowed the expansion of compressed dermal tissue and also provided
a larger void space for injected fluid within the skin thus resulted in increased infusion
flow rate. Larger infusion pressure induced more tissue disruption thus created a larger
fluid pathway within dense microstructure of skin. The dispersion of injected solution
was enhanced by the presence of co-injected hyaluronidase, which temporarily decreased
skin collagen matrix viscosity. Constant flow rate after elevated flow rate during a brief
transient was also shown. Altogether, this study shows that microneedles can be

127
fabricated and used in optimized ways to microinfuse therapeutically useful amounts of
solution into skin with flow rates up to 1 ml/h, which suggests future uses for minimally
invasive drug delivery via infusion for various clinical applications.
128
6 RECOMMENDATIONS
Building off the results presented in this thesis, I would recommend continuing the
research effort to exploit the use of hollow microneedles for transdermal drug delivery.
Hollow microneedles offer additional delivery capabilities beyond diffusion-based solid
microneedles and allow convective-based injection. Few key issues however remain to be
answered to effectively use hollow microneedles for microinjection. Fundamental
understanding of barriers to flow offered by dense dermal tissues is needed to effectively
use microneedles for injection. Thus, future studies of needle tip optimization and the
interaction between needle and resistances offered by skin during injection should be
carried out. The ultimate goal of microneedle research is to build an integrated drug
delivery device that couples hollow microneedles with a micropump to microinfuse
therapeutic amounts of drug solutions into skin.
Fluid delivery through microneedles and into the skin has been demonstrated to be
strongly dependent on needle tip geometry and tissue resistances. Further refinement of
needle tip geometry including proper positioning of needle opening (i.e., side opening) is
crucial to achieve optimal microneedle design to inject into skin and thereby circumvent
resistances offered by skin tissues such as needle coring, fluid leaking and fluid blocking
due to rigid skin microstructure. Fundamental understanding of skin anatomy and its
interaction with the intruding needle has the same importance to allow successful
injection into skin. Numerical modeling of skin injection using microneedles, which
emphasizes both needle tip geometry optimization and the presence of rigid skin
microstructure barriers will serve as a good guidance for further microneedle use as a
means for fluid delivery. Experimental study which involves detailed real-time imaging
129
(i.e., using fiber optics or x-ray based imaging system) during skin injection and
microneedle-based infusion would be ideal to complement numerical modeling results to
provide clear answers to challenges encountered during microneedle injection.
Combining the mechanistic understanding of infusion parameters on flow rate
presented in this thesis and the findings of skin-needle interaction during microneedle-
based injection, the next step would be to demonstrate the capabilities of microneedles to
deliver therapeutic amounts of drugs into living animals and human subjects in a
controlled fashion when coupled with a micropump. As a short-term in vitro study, a
further refinement in the control of fluid delivery could be carried out using a constant
flow rate delivery system (i.e., using syringe pump) based on the constant pressure
microneedle-based delivery system presented in this study. In addition to protocol that
involves maximizing retraction distance during infusion described in this thesis, other
strategies should be pursued to optimize flow rate. One possibility might involve the
concept of spike-inside-needle device in which an injection can be initiated by inserting
both a sharp solid spike and a hollow microneedle into the skin, after which the solid
spike is retracted, after creating an opening for fluid flow into the skin, and the hollow
microneedle that is still attached to the skin can then act as a delivery channel for fluid
flow into skin. Rapid insertion of microneedles using high-velocity insertion device could
potentially minimize skin deflection, thus it can reduce dermal tissue compression and
resistance to flow. The use of microneedles is envisioned to be in multiple needle arrays
arrangement, thus, transitioning the results of single glass needle infusion presented in
this thesis will be necessary to achieve cost-effective and mass-producible microneedle-
based delivery.
130
Preliminary studies shown by others (Smart and Subramanian 2000, Wang, Cornwell,
et al. 2005) have demonstrated that hollow microneedles could also be used to extract
fluid. To further demonstrate microneedles capabilities and real clinical applications,
thus, ultimately, a compact easy-to-use and reliable microneedle-based device could be
built that has the capabilities to extract interstitial fluid, measure blood glucose levels,
operate a pump and administer insulin to the body based on blood glucose measurements
in a controlled and minimally-invasive fashion.
131
APPENDIX A:
Hollow Side-Opening Microneedles
A.1 Introduction
As a novel hybrid drug delivery device that captures the benefit of the transdermal
patch and hypodermic needle, microneedles have been fabricated from different materials
including silicon (Gardeniers, Luttge, et al. 2003, Henry, McAllister, et al. 1998), metal
(Davis, Martanto, et al. 2005, Matriano, Cormier, et al. 2002, Mikszta, Sullivan, et al.
2005) and polymers (Park, Allen, et al. 2005) with different tip geometries. To be useful
as a minimally invasive drug delivery device, there are three important microneedles
design constraints: the needle geometry and material must permit insertion into skin
without breakage, the fabrication method should be inexpensive and easily scaled up, and
the microneedle must be capable to transport therapeutically effective amounts of drug
(Davis, Martanto, et al. 2005). Choice of needle materials and needle tip design
determine needle strength. Needle materials also govern the complexity and cost of the
fabrication process. Despite its extensive use in microelectronics processes, silicon tends
to be fragile, is not known to be biocompatible and is relatively expensive (Mikszta,
Sullivan, et al. 2005, Runyan and Bean 1990). Metals are better materials for microneedle
fabrication because of their mechanical strength, relatively inexpensive cost and known
biocompatibility (Braybrook 1997). Polymers have also been used to fabricate
microneedles (Park, Allen, et al. 2005) since they offer inexpensive and relatively simple
fabrication process in addition to their biocompatibility and biodegradability (Ratner
2004), but they are generally not as strong as metals. Various needle tip designs have

132
been demonstrated in previous studies by others including blunt tip (Davis, Martanto, et
al. 2005), bevel tip (McAllister, Wang, et al. 2003, Park, Allen, et al. 2005) and solid
sharp tip (Davis, Martanto, et al. 2005) among many other tip designs. To be useful to
effectively transport drug solution into skin, hollow microneedles must be unobstructed
during their insertion into skin and during fluid delivery within the skin.
There are some physical barriers that prevent fluid injection using microneedles into
the skin. Prevention of fluid flow from the microneedles can be caused by needle tip
blockage. Tip blockage due to pieces of skin that come inside the needle bore results in
coring. Needle tip position may also affect the amount of tissue coring. A needle with the
tip opening at its vertex may result in the higher possibility of coring. On the other hand,
a sharp-tip needle with side openings may minimize the coring effect. Previous studies
showed that hollow microtubes were clogged with skin tissue when inserted into skin in
vitro and in vivo, thus preventing their use to flow fluid into skin (McAllister 2000).
A separate study of hollow tapered blunt-tip microneedle insertions into rat skin in
vivo also showed the common occurrence of needle coring by tissue (Davis 2003). An
observation after the insertion of an array of 16 microneedles with 75 μm tip diameter
and their removal from the skin indicated that all the needle tips were plugged by 70 μm
diameter tissue. Similar needles have been shown to not fully insert into the skin (Davis,
Landis, et al. 2004). As a comparison, sharp solid needles were shown to fully insert into
the skin (Davis, Martanto, et al. 2005). The extent of the insertion thus was shown to be
governed by microneedle tip geometry and sharpness. Microneedles with side opening
holes permit sharper tips, which reduce force of insertion, thus making the device easier
to use and reducing the need for mechanical strength and/or possibility of needle fracture.
133
All of these led to the growing interest to fabricate microneedles with side openings
(Gardeniers, Luttge, et al. 2003, Stoeber and Liepmann 2002).
Building off previous studies, we developed a novel fabrication method to create
hollow microneedles with side openings with a relatively simple fabrication process
based on micromolding and laser drilling methods.
A.2 Materials and Methods
A.2.1 Micromolding Process
We used micromolding techniques to make microneedle master structures using the
tips of metal probes (Picoprobe, GGB Industries, Inc. Naples, FL) with circular
polycaprolactone base substrate (PCL, 1.14 dl/g, Birmingham Polymers Inc.,
Birmingham, AL). The first step was to define the thickness of the polycaprolactone base
by inserting the bottom part of a glass vial to a certain depth into a PDMS (Sylgard 184,
Dow Corning, Midland, MI) mixture, which was heated on a hot plate (250°C). Prior to
use, air bubbles in the PDMS were removed by applying vacuum pressure of 20 inHg
(Laboport, KNF Neuberger Inc., Trenton, NJ) for 90 min. After the PDMS was cured, the
glass vial was removed, which yielded in a PDMS mold with an invagination at the
center. The tip of a metal probe, held in place by a syringe, was then inserted into the
invaginated area to a depth that determines the final microneedle height. To make the
PCL base, PCL pellets were then placed inside the invagination of PDMS mold
surrounding the metal probe shaft and melted at 250°C. Uniformly-melted PCL was
shown as solid white materials in the invaginated area of the PDMS mold shown in
Figure A.1.
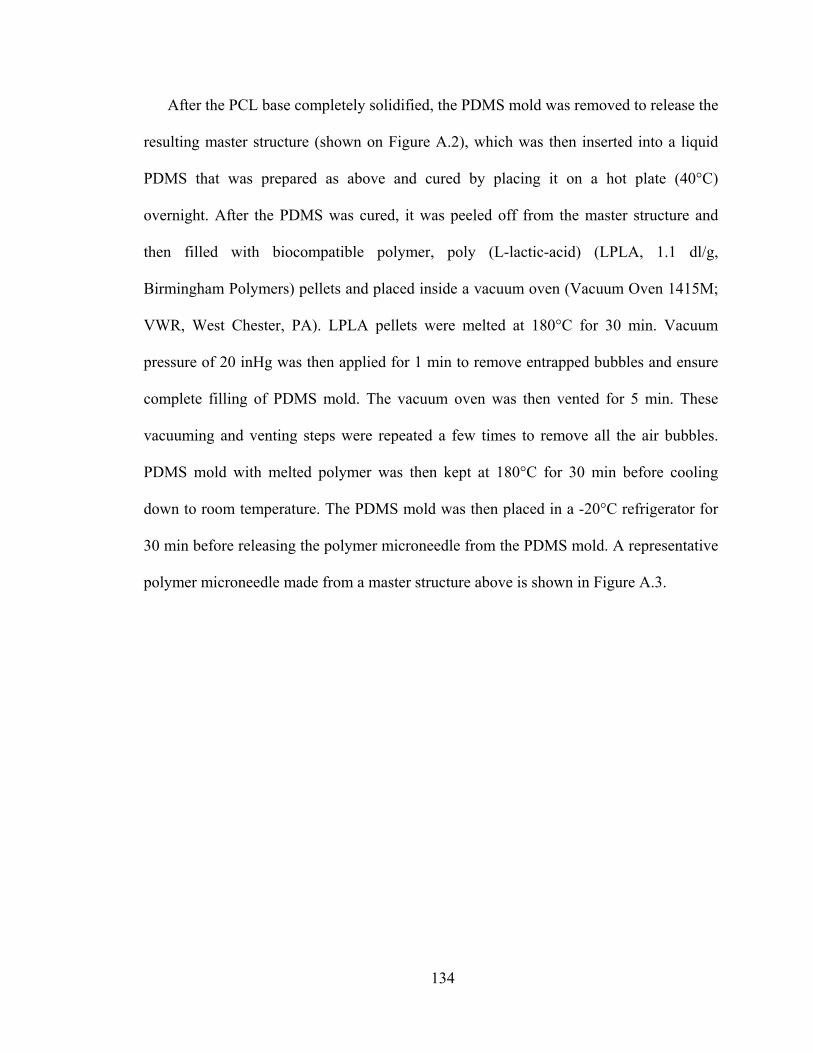
134
After the PCL base completely solidified, the PDMS mold was removed to release the
resulting master structure (shown on Figure A.2), which was then inserted into a liquid
PDMS that was prepared as above and cured by placing it on a hot plate (40°C)
overnight. After the PDMS was cured, it was peeled off from the master structure and
then filled with biocompatible polymer, poly (L-lactic-acid) (LPLA, 1.1 dl/g,
Birmingham Polymers) pellets and placed inside a vacuum oven (Vacuum Oven 1415M;
VWR, West Chester, PA). LPLA pellets were melted at 180°C for 30 min. Vacuum
pressure of 20 inHg was then applied for 1 min to remove entrapped bubbles and ensure
complete filling of PDMS mold. The vacuum oven was then vented for 5 min. These
vacuuming and venting steps were repeated a few times to remove all the air bubbles.
PDMS mold with melted polymer was then kept at 180°C for 30 min before cooling
down to room temperature. The PDMS mold was then placed in a -20°C refrigerator for
30 min before releasing the polymer microneedle from the PDMS mold. A representative
polymer microneedle made from a master structure above is shown in Figure A.3.

135
Figure A.1 Schematic of experimental set up to make a microneedle master structure using metal probe and polycaprolactone.
Figure A.2 An image of solid metal probe with polycaprolactone base used as microneedle master structure.
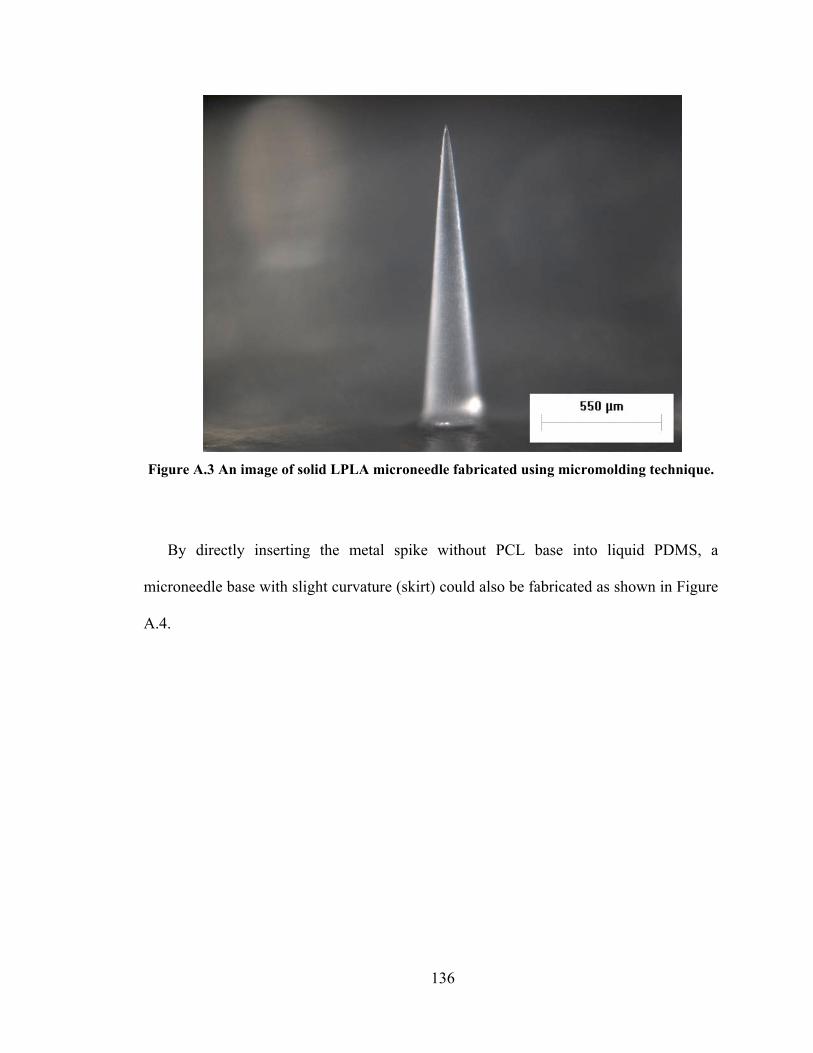
136
Figure A.3 An image of solid LPLA microneedle fabricated using micromolding technique.
By directly inserting the metal spike without PCL base into liquid PDMS, a
microneedle base with slight curvature (skirt) could also be fabricated as shown in Figure
A.4.
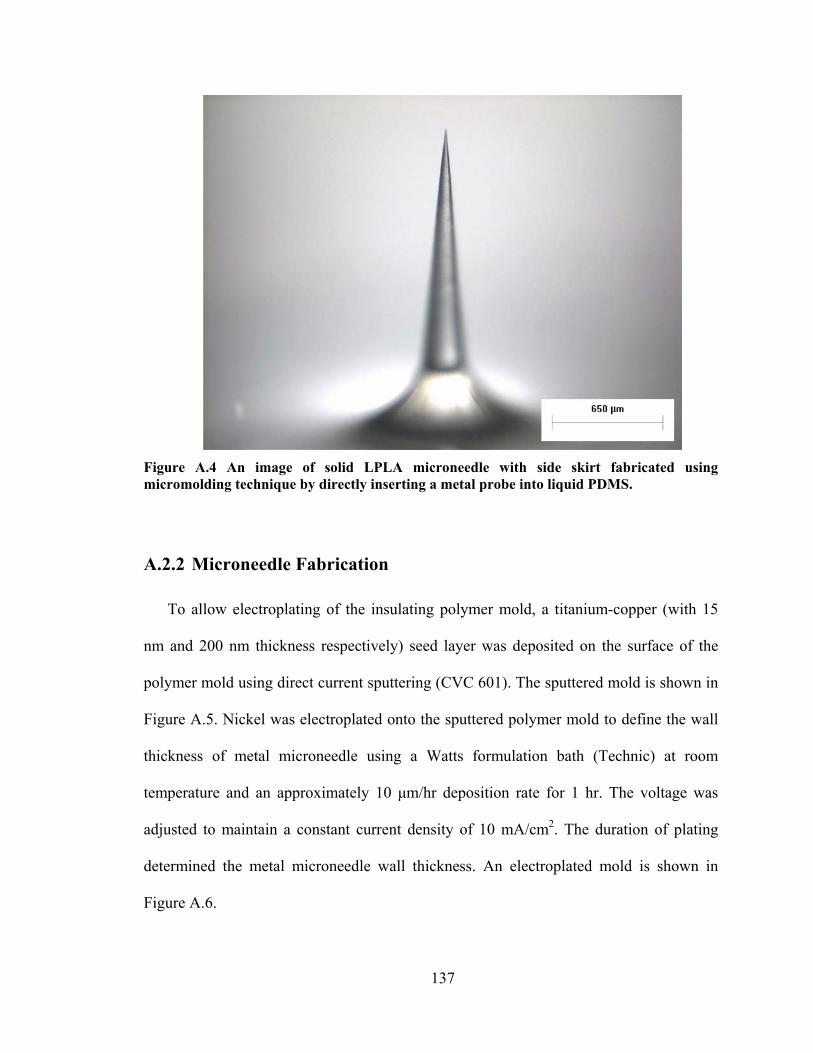
137
Figure A.4 An image of solid LPLA microneedle with side skirt fabricated using micromolding technique by directly inserting a metal probe into liquid PDMS.
A.2.2 Microneedle Fabrication
To allow electroplating of the insulating polymer mold, a titanium-copper (with 15
nm and 200 nm thickness respectively) seed layer was deposited on the surface of the
polymer mold using direct current sputtering (CVC 601). The sputtered mold is shown in
Figure A.5. Nickel was electroplated onto the sputtered polymer mold to define the wall
thickness of metal microneedle using a Watts formulation bath (Technic) at room
temperature and an approximately 10 μm/hr deposition rate for 1 hr. The voltage was
adjusted to maintain a constant current density of 10 mA/cm2. The duration of plating
determined the metal microneedle wall thickness. An electroplated mold is shown in
Figure A.6.
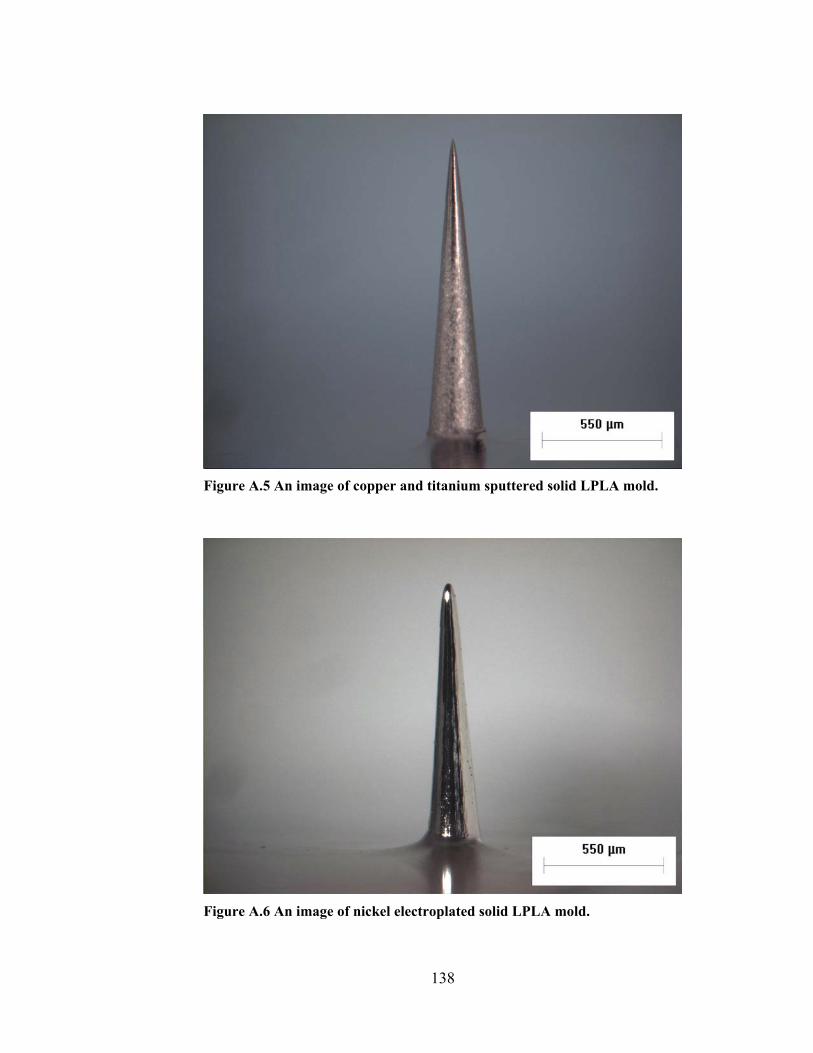
138
Figure A.5 An image of copper and titanium sputtered solid LPLA mold.
Figure A.6 An image of nickel electroplated solid LPLA mold.
139
To create the side openings, the tip of Nickel-coated polymer mold was then drilled
using a 248-nm wavelength UV Excimer Laser (Resonetics Micromaster) operated at 80
Hz and an energy of 180 mJ. Finally, LPLA mold was removed in a methylene chloride
(Sigma) solution until LPLA was completely dissolved to make hollow metal
microneedles with side openings. The sequences of laser drilling and electroplating could
also be reversed in which the side opening holes were drilled after the sputtering step
rather than after electroplating step.
A.3 Results and Discussion
Using a novel microneedle design and fabrication method which combined
micromolding and laser drilling techniques, we made hollow metal microneedles with
side openings as shown in Figure A.7 after selectively etching the polymer mold. By
reversing the fabrication sequences of laser-drilling and electroplating, a similar needle
fabricated by laser-drilling a sputtered polymer mold and then electroplated the mold is
shown in Figure A.8. The position of the side-opening hole could be moved to different
heights along the needle shaft and the size of the hole could be varied by changing laser
drilling parameters. A similarly fabricated microneedle with smaller side opening holes is
shown in Figure A.9. Preliminary work demonstrated that side-opening hollow
microneedles were capable to flow fluid through (data not shown). The fabrication of
arrays of hollow microneedles with side opening holes could be envisioned using the
combination of photolithography and laser-drilling techniques to create needle master
structures and the side opening holes respectively. Although not shown in this study, we
expect that hollow microneedles with side openings will reduce force of insertion, thus

140
making the device easier to use and reducing the need for mechanical strength and/or
possibility of needle fracture.
Figure A.7 An image of hollow metal microneedle with 30 μm side opening holes fabricated by laser-drilling an electroplated polymer mold.

141
Figure A.8 An image of hollow metal microneedle with 30 μm side opening holes fabricated by laser-drilling a sputtered polymer mold and then electroplated the mold.
Figure A.9 An image of hollow metal microneedle with 20 μm side opening holes fabricated by laser-drilling a sputtered polymer mold and then electroplated the mold.

142
A.4 Conclusions
We demonstrated the novel fabrication of hollow microneedles with side openings
using the combination of polymer micromolding and laser drilling methods. Altogether
these microneedles have desired properties critical to successful hollow microneedles:
side openings that allow sharp tips for easy insertion and fluidic channels for active drug
delivery.

143
REFERENCES Hyaluronidase (Vitrase) - ISTA. Drugs in R&D 4: 194-197 (2003). Report of the expert committee on the diagnosis and classification of diabetes mellitus. Diabetes Care 26 Suppl 1: S5-20 (2003). Ahmed, A., Bonner, C. and Desai, T. A. Bioadhesive microdevices with multiple reservoirs: a new platform for oral drug delivery. J Control Release 81: 291-306 (2002). Arbit, E. The physiological rationale for oral insulin administration. Diabetes Technol Ther 6: 510-517 (2004). Aungst, B. J. and Rogers, N. J. Site dependence of absorption-promoting actions of laureth-9, Na salicylate, Na2EDTA, and aprotinin on rectal, nasal, and buccal insulin delivery. Pharm Res 5: 305-308 (1988). Bachmann, K., Pardoe, D. and White, D. Scaling basic toxicokinetic parameters from rat to man. Environ Health Perspect 104: 400-407 (1996). Bancroft, J. D. and Gamble, M. Theory and Practice of Histological Techniques, Churchill Livingstone, New York, NY, 2002. Barry, B. W. Novel mechanisms and devices to enable successful transdermal drug delivery. Eur J Pharm Sci 14: 101-114 (2001). Bert, J. L. and Reed, R. K. Flow conductivity of rat dermis is determined by hydration. Biorheology 32: 17-27 (1995). Bertsch, A., Lorenz, H. and Renaud, P. 3D microfabrication by combining microstereolithography and thick resist UV lithography. Sens Actuators A Phys A73: 14-23 (1999). Bode, B. W., Sabbah, H. T., Gross, T. M., Fredrickson, L. P. and Davidson, P. C. Diabetes management in the new millennium using insulin pump therapy. Diabetes Metab Res Rev 18: S14-S20 (2002). Bramson, J., Dayball, K., Evelegh, C., Wan, Y. H., Page, D. and Smith, A. Enabling topical immunization via microporation: a novel method for pain-free and needle-free delivery of adenovirus-based vaccines. Gene Ther 10: 251-260 (2003). Braybrook, J. H. Biocompatibility : Assessment of Medical Devices and Materials, Wiley, Chichester, NY, 1997.

144
Brazzle, J. D., Bartholomeusz, D., Davies, R., Andrade, J., Wagenen, R. and Frazier, A. B. Active microneedles with integrated functionality. Solid State Sensors and Actuators Conference, Hilton Head Island, SC, USA 199-202 (2000). Brazzle, J. D., Mohanty, S. and Frazier, A. B. Hollow metallic micromachined needles with multiple output ports. Proceedings of the SPIE - The International Society for Optical Engineering: Microfluidic Devices and Systems II, Santa Clara, CA, USA 3877: 257-266 (1999). Brazzle, J. D., Mohanty, S. and Frazier, A. B. Micromachined multiple output port needle. Proceedings of the First Joint EMBS/BMES Conference (Engineering in Medicine and Biology 21st Annual Conference and the Annual Fall Meeting of the Biomedical Engineering Society), Atlanta, GA, USA 2: 834 (1999). Brazzle, J. D., Papautsky, I. and Frazier, A. B. Fluid coupled metallic micromachined needle arrays. Proceedings of the 20th Annual International Conference of the IEEE Engineering in Medicine and Biology Society, Hong Kong, China 20(4): 1837-1840 (1998). Brazzle, J. D., Papautsky, I. and Frazier, A. B. Fluid-coupled hollow metallic micromachined needle arrays. Proceedings of the SPIE - The International Society for Optical Engineering: Microfluidic Devices and Systems, Santa Clara, CA, USA 3515: 116-124 (1998). Bremseth, D. L. and Pass, F. Delivery of insulin by jet injection: recent observations. Diabetes Technol Ther 3: 225-232 (2001). Bronaugh, R. L. and Maibach, H. I. Percutaneous Absorption Drugs--Cosmetics--Mechanisms--Methodology, Marcel Dekker, New York, NY, 1999. Bruce, D. G., Chisholm, D. J., Storlien, L. H., Borkman, M. and Kraegen, E. W. Meal-time intranasal insulin delivery in type 2 diabetes. Diabet Med 8: 366-370 (1991). Bruera, E., Neumann, C. M., Pituskin, E., Calder, K. and Hanson, J. A randomized controlled trial of local injections of hyaluronidase versus placebo in cancer patients receiving subcutaneous hydration. Annals of Oncology 10: 1255-1258 (1999). Burkoth, T. L., Bellhouse, B. J., Hewson, G., Longridge, D. J., Muddle, A. G. and Sarphie, D. F. Transdermal and transmucosal powdered drug delivery. Crit Rev Ther Drug Carrier Syst 16: 331-384 (1999). Bykowski, M. Needle-free injection devices face obstacles. Skin & Allergy News 30: 13 (1999). Cevc, G. Lipid vesicles and other colloids as drug carriers on the skin. Adv Drug Deliv Rev 56: 675-711 (2004).
145
Chabri, F., Bouris, K., Jones, T., Barrow, D., Hann, A., Allender, C., Brain, K. and Birchall, J. Microfabricated silicon microneedles for nonviral cutaneous gene delivery. Br J Dermatol 150: 869-877 (2004). Chandrasekaran, S. and Frazier, A. B. An autonomous microneedle-based bio-analysis system. Proceedings of the Second Joint EMBS/BMES Conference (Engineering in Medicine and Biology 24th Annual Conference and the Annual Fall Meeting of the Biomedical Engineering Society), Houston, TX, USA 2: 1644-1645 (2002). Chandrasekaran, S. and Frazier, A. B. Characterization of surface micromachined hollow metallic microneedles. 16th IEEE International Conference on Micro Electro Mechanical Systems, Kyoto, Japan 363-366 (2003). Chandrasekaran, S., Mohanty, S. K. and Frazier, A. B. Autonomous microneedle system for biochemical analysis. TRANSDUCERS, 12th International Conference on Solid-State Sensors, Actuators and Microsystems, Boston, MA, USA 2: 1442-1445 (2003). Chen, J., Wise, K. D., Hetke, J. F. and Bledsoe, S. C., Jr. A multichannel neural probe for selective chemical delivery at the cellular level. IEEE Trans Biomed Eng 44: 760-769 (1997). Chetty, D. J. and Chien, Y. W. Novel methods of insulin delivery: an update. Crit Rev Ther Drug Carrier Syst 15: 629-670 (1998). Colquitt, J. L., Green, C., Sidhu, M. K., Hartwell, D. and Waugh, N. Clinical and cost-effectiveness of continuous subcutaneous insulin infusion for diabetes. Health Technol Assess 8: 1-202 (2004). Cormier, M. and Daddona, P. E. Macroflux technology for transdermal delivery of therapeutic proteins and vaccines. In Rathbone, M. J., Hadgraft, J. and Roberts, M. S. (eds), Modified-Release Drug Delivery Technology (Rathbone, M. J., Hadgraft, J. and Roberts, M. S., eds), Marcel Dekker, New York, NY, 2003, pp. 589-598. Cormier, M., Johnson, B., Ameri, M., Nyam, K., Libiran, L., Zhang, D. D. and Daddona, P. Transdermal delivery of desmopressin using a coated microneedle array patch system. J Control Release 97: 503-511 (2004). Davidson, M. B. Diabetes Mellitus : Diagnosis and Treatment, Saunders, Philadelphia, PA, 1998. Davis, S. P. Hollow microneedles for molecular transport across skin. Ph.D. Thesis. Georgia Institute of Technology. xxi, 159 leaves (2003). Davis, S. P., Landis, B. J., Adams, Z. H., Allen, M. G. and Prausnitz, M. R. Insertion of microneedles into skin: measurement and prediction of insertion force and needle fracture force. J Biomech 37: 1155-1163 (2004).
146
Davis, S. P., Martanto, W., Allen, M. G. and Prausnitz, M. R. Hollow metal microneedles for insulin delivery to diabetic rats. IEEE Trans Biomed Eng 52: 909-915 (2005). Davis, S. P., Prausnitz, M. R. and Allen, M. G. Fabrication and characterization of laser micromachined hollow microneedles. TRANSDUCERS, 12th International Conference on Solid-State Sensors, Actuators and Microsystems, Boston, MA, USA 2: 1435-1438 (2003). Doyle, E. A., Weinzimer, S. A., Steffen, A. T., Ahern, J. A. H., Vincent, M. and Tamborlane, W. V. A randomized, prospective trial comparing the efficacy of continuous subcutaneous insulin infusion with multiple daily injections using insulin glargine. Diabetes Care 27: 1554-1558 (2004). Drejer, K., Vaag, A., Bech, K., Hansen, P., Sorensen, A. R. and Mygind, N. Intranasal administration of insulin with phospholipid as absorption enhancer: pharmacokinetics in normal subjects. Diabet Med 9: 335-340 (1992). Dyer, P. E. Excimer laser polymer ablation: twenty years on. Appl Phys A, Mater Sci Process A77: 167-173 (2003). Findley, I. and Chamberlain, G. ABC of labour care: relief of pain. Br Med J 318: 927-930 (1999). Finnin, B. C. and Morgan, T. M. Transdermal penetration enhancers: applications, limitations, and potential. J Pharm Sci 88: 955-958 (1999). Fox, A. J. and Rowbotham, D. J. Recent advances: anaesthesia. Br Med J 319: 557-560 (1999). Fox, R. W. and McDonald, A. T. Introduction to Fluid Mechanics, Wiley, New York, NY, 1998. French, E. J., Pouton, C. W. and Walters, K. A. Mechanisms and prediction of nonionic surfactant effects on skin permeability. In Walters, K. A. and Hadgraft, J. (eds), Pharmaceutical Skin Penetration Enhancement (Walters, K. A. and Hadgraft, J., eds), Marcel Dekker, New York, NY, 1993, pp. 113-144. Gad-el-Hak, M. The fluid mechanics of microdevices - The Freeman Scholar Lecture. J Fluid Eng 121: 5-33 (1999). Gardeniers, H. J. G. E., Berenschot, J. W., de Boer, M. J., Yeshurun, Y., Hefetz, M., van't Oever, R. and van den Berg, A. Silicon micromachined hollow microneedles for transdermal liquid transfer. 15th IEEE International Conference on Micro Electro Mechanical Systems, Las Vegas, NV, USA 141-144 (2002).

147
Gardeniers, H. J. G. E., Luttge, R., Berenschot, E. J. W., de Boer, M. J., Yeshurun, S. Y., Hefetz, M., van't Oever, R. and van den Berg, A. Silicon micromachined hollow microneedles for transdermal liquid transport. J MEMS 12: 855-862 (2003). Garrioch, S. H. and James, D. F. A finite-element study of Newtonian and power-law fluids in conical channel flow. J Fluid Eng 119: 341-346 (1997). Gebhart, S., Faupel, M., Fowler, R., Kapsner, C., Lincoln, D., McGee, V., Pasqua, J., Steed, L., Wangsness, M., Xu, F. and Vanstory, M. Glucose sensing in transdermal body fluid collected under continuous vacuum pressure via micropores in the stratum corneum. Diabetes Technol Ther 5: 159-166 (2003). Gizurarson, S. and Bechgaard, E. Intranasal administration of insulin to humans. Diabetes Res Clin Pract 12: 71-84 (1991). Goodman, L. S., Gilman, A., Hardman, J. G., Gilman, A. G. and Limbird, L. E. Goodman & Gilman's The Pharmacological Basis of Therapeutics, McGraw-Hill Health Professions Division, New York, NY, 1996. Gopalakrishnan, V., Hwang, S., Loughrey, H., Alexandre, B., Desai, D., Haiying, L., Abribat, T., Vachon, L. and Daddona, P. E. Administration of ThPTH to humans using Macroflux® transdermal technology results in the rapid delivery of biologically active PTH. http://www.theratech.com/pres_posters/pthposter4oct.pdf (2004). Gower, M. C. Excimer laser micromachining: a 15 year perspective. Proceedings of the SPIE - The International Society for Optical Engineering: Laser Applications in Microelectronic and Optoelectronic Manufacturing IV, San Jose, CA, USA 3618: 251-261 (1999). Gower, M. C. Industrial applications of laser micromachining. Opt Express 7: 56-67 (2000). Graham, A. K. Electroplating Engineering Handbook, Van Nostrand Reinhold Co., New York, NY: xviii, 845 p. 1971. Griss, P., Enoksson, P., Tolvanen-Laakso, H. K., Merilainen, P., Ollmar, S. and Stemme, G. Micromachined electrodes for biopotential measurements. J MEMS 10: 10-16 (2001). Griss, P. and Stemme, G. Side-opened out-of-plane microneedles for microfluidic transdermal liquid transfer. J MEMS 12: 296-301 (2003). Gross, J. and Kelly, J. G. Intradermal drug delivery device and method for the intradermal delivery of drugs. U.S. Patent 5 527 288. Elan Medical Technologies Limited. (1996).

148
Gross, J., Lavi, G. and Tsals, I. Pre-filled drug-delivery device and method of manufacture and assembly of same. U.S. Patent 6 500 150. Elan Pharma International Limited. (2002). Gross, J., Tsals, I., Lavi, G., Yigal, G. and Carmel, E. Drug delivery device. U.S. Patent 6 595 956. (2003). Harrison, W. J. The pressure in a viscous liquid moving through a channel with diverging boundaries. Proc Cambridge Phil Soc 19: 307-312 (1919). Harvey, E. C., Rumsby, P. T., Gower, M. C. and Remnant, J. L. Microstructuring by excimer laser. Proceedings of the SPIE - The International Society for Optical Engineering: Micromachining and Microfabrication Process Technology, Austin, TX, USA 2639: 266-277 (1995). Hashmi, S., Ling, P., Hashmi, G., Reed, M., Gaugler, R. and Trimmer, W. Genetic transformation of nematodes using arrays of micromechanical piercing structures. Biotechniques 19: 766-770 (1995). Hay, E. D. Cell Biology of Extracellular Matrix, Plenum Press, New York, NY, 1981. Henry, S., McAllister, D. V., Allen, M. G. and Prausnitz, M. R. Microfabricated microneedles: a novel approach to transdermal drug delivery. J Pharm Sci 87: 922-925 (1998). Hensel, K. B. Electropolishing. Metal Polishing 98: 440-448 (2000). Herndon, C. M. and Fike, D. S. Continuous subcutaneous infusion practices of United States hospices. J Pain Symptom Manage 22: 1027-1034 (2001). Hilsted, J., Madsbad, S., Hvidberg, A., Rasmussen, M. H., Krarup, T., Ipsen, H., Hansen, B., Pedersen, M., Djurup, R. and Oxenboll, B. Intranasal insulin therapy: the clinical realities. Diabetologia 38: 680-684 (1995). Hinchcliffe, M. and Illum, L. Intranasal insulin delivery and therapy. Adv Drug Deliv Rev 35: 199-234 (1999). Hogan, P., Dall, T. and Nikolov, P. Economic costs of diabetes in the US in 2002. Diabetes Care 26: 917-932 (2003). Hollander, P. A., Blonde, L., Rowe, R., Mehta, A. E., Milburn, J. L., Hershon, K. S., Chiasson, J.-L. and Levin, S. R. Efficacy and safety of inhaled insulin (Exubera) compared with subcutaneous insulin therapy in patients with type 2 diabetes: results of a 6-month, randomized, comparative trial. Diabetes Care 27: 2356-2362 (2004).
149
Hostýnek, J. J. and Maibach, H. I. Nickel and The Skin : Absorption, Immunology, Epidemiology, and Metallurgy, CRC Press, Boca Raton, FL, 2002. Jarzebski, A. B. and Wilkinson, W. L. Non-isothermal developing flow of a generalised power-law fluid in a tapered tube. J Non-Newtonian Fluid Mech 8: 239-248 (1981). Jolanki, R., Kanerva, L., Estlander, T., Henriks-Eckerman, M.-L. and Suhonen, R. Allergic contact dermatitis from phenoxyethoxy ethylacrylates in optical fiber coating, and glue in an insulin pump set. Contact Dermatitis 45: 36-37 (2001). Kanikkannan, N., Kandimalla, K., Lamba, S. S. and Singh, M. Structure-activity relationship of chemical penetration enhancers in transdermal drug delivery. Curr Med Chem 7: 593-608 (2000). Kastin, A. J. and Akerstrom, V. Orexin A but not orexin B rapidly enters brain from blood by simple diffusion. J Pharmacol Exp Ther 289: 219-223 (1999). Katsuma, S. and Tsujimoto, G. Genome medicine promised by microarray technology. Expert Rev Mol Diagn 1: 377-382 (2001). Kaushik, S., Hord, A. H., Denson, D. D., McAllister, D. V., Smitra, S., Allen, M. G. and Prausnitz, M. R. Lack of pain associated with microfabricated microneedles. Anesth Analg 92: 502-504 (2001). Kemblowski, Z. and Kiljanski, T. Flow of Stokesian fluids through conical ducts. Chem Eng J 9: 141-151 (1975). Kreil, G. Hyaluronidases -- a group of neglected enzymes. Protein Sci 4: 1666-1669 (1995). Kwon, T. H., Shen, S. F. and Wang, K. K. Pressure drop of polymeric melts in conical converging flow: experiments and predictions. Polymer Eng Sci 26: 214-224 (1986). Langer, R. Perspectives: drug delivery - drugs on target. Science 293: 58-59 (2001). Langkjaer, L., Brange, J., Grodsky, G. M. and Guy, R. H. Iontophoresis of monomeric insulin analogues in vitro: effects of insulin charge and skin pretreatment. J Control Release 51: 47-56 (1998). Lenhard, M. J. and Reeves, G. D. Continuous subcutaneous insulin infusion: a comprehensive review of insulin pump therapy. Arch Intern Med 161: 2293-2300 (2001). Leoni, L. and Desai, T. A. Micromachined biocapsules for cell-based sensing and delivery. Adv Drug Deliv Rev 56: 211-229 (2004).
150
Levick, J. R. Flow through interstitium and other fibrous matrices. Quarterly Journal of Experimental Physiology 72: 409-438 (1987). Liebl, A. Challenges in optimal metabolic control of diabetes. Diabetes Metab Res Rev 18: S36-S41 (2002). Lin, W., Cormier, M., Samiee, A., Griffin, A., Johnson, B., Teng, C. L., Hardee, G. E. and Daddona, P. E. Transdermal delivery of antisense oligonucleotides with microprojection patch (Macroflux) technology. Pharm Res 18: 1789-1793 (2001). Lindner, D. Microsystems for chemical and biological applications. MRS Bull 26: 333-336 (2001). Lippert, T., David, C., Hauer, M., Phipps, C. and Wokaun, A. Tailor-made polymers for laser ablation. Rev Laser Eng 29: 734-738 (2001). Lynch, P. M., Butler, J., Huerta, D., Tsals, I., Davidson, D. and Hamm, S. A pharmacokinetic and tolerability evaluation of two continuous subcutaneous infusion systems compared to an oral controlled-release morphine. J Pain Symptom Manage 19: 348-356 (2000). Madou, M. J. Fundamentals of Microfabrication : The Science of Miniaturization, CRC Press, Boca Raton, FL, 2002. Maibach, H. I. and Menné, T. Nickel and The Skin : Immunology and Toxicology, CRC Press, Boca Raton, FL, 1989. Mala, G. M. and Li, D. Q. Flow characteristics of water in microtubes. Int J Heat Fluid Flow 20: 142-148 (1999). Marks, R., Barton, S. P. and Edwards, C. The Physical Nature of The Skin, Boston MTP Press, Lancaster, England, 1988. Martanto, W., Davis, S. P., Holiday, N. R., Wang, J., Gill, H. S. and Prausnitz, M. R. Transdermal delivery of insulin using microneedles in vivo. Pharm Res 21: 947-952 (2004). Martanto, W., Smith, M. K., Baisch, S. M., Costner, E. A. and Prausnitz, M. R. Fluid dynamics in conically tapered microneedles. AIChE J 51: 1599-1607 (2005). Matriano, J. A., Cormier, M., Johnson, J., Young, W. A., Buttery, M., Nyam, K. and Daddona, P. E. Macroflux microprojection array patch technology: a new and efficient approach for intracutaneous immunization. Pharm Res 19: 63-70 (2002). Matsuda, H. and Arima, H. Cyclodextrins in transdermal and rectal delivery. Adv Drug Deliv Rev 36: 81-99 (1999).

151
McAllister, D. V. Microfabricated needles for transdermal drug delivery. Ph.D. Thesis. Georgia Institute of Technology. xxii, 189 leaves (2000). McAllister, D. V., Allen, M. G. and Prausnitz, M. R. Microfabricated microneedles for gene and drug delivery. Annu Rev Biomed Eng 2: 289-313 (2000). McAllister, D. V., Wang, P. M., Davis, S. P., Park, J.-H., Canatella, P. J., Allen, M. G. and Prausnitz, M. R. Microfabricated needles for transdermal delivery of macromolecules and nanoparticles: fabrication methods and transport studies. Proc Natl Acad Sci U S A 100: 13755-13760 (2003). McGuire, S. and Yuan, F. Quantitative analysis of intratumoral infusion of color molecules. Am J Physiol Heart Circ Physiol 281: H715-H721 (2001). Meehan, E., Gross, Y., Davidson, D., Martin, M. and Tsals, I. A microinfusor device for the delivery of therapeutic levels of peptides and macromolecules. J Control Release 46: 107-116 (1997). Meyer, F. A., Laver-Rudich, Q. and Tannenbaum, R. Evidence for a mechanical coupling of glycoprotein microfibrils with collagen fibrils in Wharton's jelly. Biochimica et biophysica acta 755: 376-387 (1983). Meyer, K. Hyaluronidases. In Boyer, P. D. (ed), The Enzymes, Vol. 5 (Boyer, P. D., ed), Academic Press, New York, NY, 1971, pp. 307-320. Mikszta, J. A., Alarcon, J. B., Brittingham, J. M., Sutter, D. E., Pettis, R. J. and Harvey, N. G. Improved genetic immunization via micromechanical disruption of skin-barrier function and targeted epidermal delivery. Nat Med 8: 415-419 (2002). Mikszta, J. A., Sullivan, V. J., Dean, C., Waterston, A. M., Alarcon, J. B., Dekker III, J. P., Brittingham, J. M., Huang, J., Hwang, C. R., Ferriter, M., Jiang, G., Mar, K., Saikh, K. U., Stiles, B. G., Roy, C. J., Ulrich, R. G. and Harvey, N. G. Protective immunization against inhalational anthrax: a comparison of minimally invasive delivery platforms. J Infect Dis 191: 278-288 (2005). Mitragotri, S. Synergistic effect of enhancers for transdermal drug delivery. Pharm Res 17: 1354-1359 (2000). Mitragotri, S., Blankschtein, D. and Langer, R. Ultrasound-mediated transdermal protein delivery. Science 269: 850-853 (1995). Mitragotri, S., Coleman, M., Kost, J. and Langer, R. Transdermal extraction of analytes using low-frequency ultrasound. Pharm Res 17: 466-470 (2000). Mitragotri, S., Edwards, D. A., Blankschtein, D. and Langer, R. A mechanistic study of ultrasonically-enhanced transdermal drug delivery. J Pharm Sci 84: 697-706 (1995).
152
Moon, Sang-Jun and Lee, S. S. Fabrication of microneedle array using inclined LIGA process. TRANSDUCERS, 12th International Conference on Solid-State Sensors, Actuators and Microsystems, Boston, MA, USA 2: 1546-1549 (2003). Moulin, D. E. and Kreeft, J. H. Comparison of continuous subcutaneous and intravenous hydromorphone infusions for management of cancer pain. Lancet 337: 465-468 (1991). Mukerjee, E. V., Collins, S. D., Isseroff, R. R. and Smith, R. L. Microneedle array for transdermal biological fluid extraction and in situ analysis. Sens Actuators A Phys 114: 267-275 (2004). Mukerjee, E. V., Isseroff, R. R., Collins, S. D. and Smith, R. L. Microneedle array with integrated microchannels for transdermal sample extraction and in situ analysis. TRANSDUCERS, 12th International Conference on Solid-State Sensors, Actuators and Microsystems, Boston, MA, USA 2: 1439-1441 (2003). Munson, B. R., Young, D. F. and Okiishi, T. H. Fundamentals of Fluid Mechanics, Wiley, New York, NY, 2002. Naik, A., Kalia, Y. N. and Guy, R. H. Transdermal drug delivery: overcoming the skin's barrier function. Pharm Sci Technol Today 3: 318-326 (2000). Nishimura, J. and Oka, S. Steady flow of a viscous fluid through a tapered tube. J Phys Soc Jpn 20: 449-453 (1965). Oka, S. Steady slow motion of viscous fluid through tapered tube. J Phys Soc Jpn 19: 1481-1484 (1964). Owens, D. R. New horizons--alternative routes for insulin therapy. Nat Rev Drug Discov 1: 529-540 (2002). Papautsky, I., Brazzle, J., Ameel, T. A. and Frazier, A. B. Microchannel fluid behavior using micropolar fluid theory. 11th IEEE Annual International Workshop on Micro Electro Mechanical Systems, Heidelberg, Germany 544-549 (1998). Park, J.-H. Polymeric microneedles for transdermal drug delivery. Ph.D. Thesis. Georgia Institute of Technology. xxiv, 194 leaves (2004). Park, J.-H., Allen, M. G. and Prausnitz, M. R. Biodegradable polymer microneedles: fabrication, mechanics and transdermal drug delivery. J Control Release 104: 51-66 (2005). Park, J.-H., Davis, S., Yoon, Y.-K., Prausnitz, M. R. and Allen, M. G. Micromachined biodegradable microstructures. 16th IEEE International Conference on Micro Electro Mechanical Systems, Kyoto, Japan 371-374 (2003).

153
Park, J.-H., Yoon, Y.-K., Prausnitz, M. R. and Allen, M. G. High-aspect-ratio tapered structures using an integrated lens technique. 17th IEEE International Conference on Micro Electro Mechanical Systems, Maastricht, Netherlands 383-386 (2004). Pasero, C. Subcutaneous opioid infusion. Am J Nurs 102: 61-62 (2002). Patton, J. S., Bukar, J. G. and Eldon, M. A. Clinical pharmacokinetics and pharmacodynamics of inhaled insulin. Clin Pharmacokin 43: 781-801 (2004). Patton, J. S. and Platz, R. M. Pulmonary delivery of peptides and proteins for systemic action. Adv Drug Deliv Rev 8: 179-196 (1992). Pickup, J., Mattock, M. and Kerry, S. Glycaemic control with continuous subcutaneous insulin infusion compared with intensive insulin injections in patients with type 1 diabetes: meta-analysis of randomised controlled trials. Br Med J 324: 705-710 (2002). Prausnitz, M., Bose, V., Langer, R. and Weaver, J. Electroporation of mammalian skin: a mechanism to enhance transdermal drug delivery. Proc Natl Acad Sci U S A 90: 10504-10508 (1993). Prausnitz, M. R. A practical assessment of transdermal drug delivery by skin electroporation. Adv Drug Deliv Rev 35: 61-76 (1999). Prausnitz, M. R. Overcoming skin's barrier: the search for effective and user-friendly drug delivery. Diabetes Technol Ther 3: 233-236 (2001). Prausnitz, M. R. Microneedles for transdermal drug delivery. Adv Drug Deliv Rev 56: 581-587 (2004). Prausnitz, M. R., Mitragotri, S. and Langer, R. Current status and future potential of transdermal drug delivery. Nat Rev Drug Discov 3: 115-124 (2004). Pugmire, D. L., Waddell, E. A., Haasch, R., Tarlov, M. J. and Locascio, L. E. Surface characterization of laser-ablated polymers used for microfluidics. Analyt Chem 74: 871-878 (2002). Purdon, C. H., Azzi, C. G., Zhang, J., Smith, E. W. and Maibach, H. I. Penetration enhancement of transdermal delivery--current permutations and limitations. Crit Rev Ther Drug Carrier Syst 21: 97-132 (2004). Quattrin, T., Belanger, A., Bohannon, N. J. V., Schwartz, S. L. and for the Exubera Phase III Study Group. Efficacy and safety of inhaled insulin (Exubera) compared with subcutaneous insulin therapy in patients with type 1 diabetes: results of a 6-month, randomized, comparative trial. Diabetes Care 27: 2622-2627 (2004).
154
Ratner, B. D. Biomaterials Science : An Introduction to Materials in Medicine, Elsevier Academic Press, San Diego, CA, 2004. Rave, K., Nosek, L., Heinemann, L., Gonzales, C., Ernest, C. S., Chien, J. and Muchmore, D. Inhaled micronized crystalline human insulin using a dry powder inhaler: dose-response and time-action profiles. Diabet Med 21: 763-768 (2004). Reed, M. L. and Lye, W.-K. Microsystems for drug and gene delivery. Proc IEEE 92: 56-75 (2004). Rizvi, N. H., Rumsby, P. T. and Gower, M. C. New developments and applications in the production of 3D microstructures by laser micromachining. Proceedings of the SPIE - The International Society for Optical Engineering: Photonic Systems and Applications in Defense and Manufacturing, Singapore 3898: 240-249 (1999). Rosenstock, J., Cappelleri, J. C., Bolinder, B. and Gerber, R. A. Patient satisfaction and glycemic control after 1 year with inhaled insulin (Exubera) in patients with type 1 or type 2 diabetes. Diabetes Care 27: 1318-1323 (2004). Rousche, P. J. and Normann, R. A. A method for pneumatically inserting an array of penetrating electrodes into cortical tissue. Ann Biomed Eng 20: 413-422 (1992). Runyan, W. R. and Bean, K. E. Semiconductor Integrated Circuit Processing Technology, Addison-Wesley, Reading, MA, 1990. Sanchez-Pozo, A., Alados, J. C. and Sanchez-Medina, F. Metabolic changes induced by urethane-anesthesia in rats. Gen Pharmacol 19: 281-284 (1988). Schaefer, H. and Redelmeier, T. E. Skin Barrier : Principles of Percutaneous Absorption, Karger, Basel, NY, 1996. Schlesinger, M. and Paunovic, M. Modern Electroplating, Electrochemical Society Series, Wiley, New York, NY: xiv, 868 p. 2000. Senel, S. and Hincal, A. A. Drug permeation enhancement via buccal route: possibilities and limitations. J Control Release 72: 133-144 (2001). Shah, R. B., Ahsan, F. and Khan, M. A. Oral delivery of proteins: progress and prognostication. Crit Rev Ther Drug Carrier Syst 19: 135-169 (2002). Sifton, D. W. Physicians' Desk Reference, Medical Economics Co., Montvale, NJ, 2003. Smart, W. H. and Subramanian, K. The use of silicon microfabrication technology in painless blood glucose monitoring. Diabetes Technol Ther 2: 549-559 (2000).

155
Stoeber, B. and Liepmann, D. Fluid injection through out-of-plane microneedles. 1st Annual International IEEE-EMBS Special Topic Conference on Microtechnologies in Medicine and Biology, Lyon, France 224-228 (2000). Stoeber, B. and Liepmann, D. Design, fabrication, and testing of a MEMS syringe. Proceedings of Solid-State Sensor and Actuator Workshop, Hilton Head Island, SC, USA (2002). Stone, H. A. and Kim, S. Microfluidics: basic issues, applications, and challenges. AIChE J 47: 1250-1254 (2001). Storrs, F. J., Rosenthal, L. E., Adams, R. M., Clendenning, W., Emmett, E. A., Fisher, A. A., Larsen, W. G., Maibach, H. I., Rietschel, R. L. and Schorr, W. F. Prevalence and relevance of allergic reactions in patients patch tested in North America--1984 to 1985. J Am Acad Dermatol 20: 1038-1045 (1989). Sullivan, R. R. and Hertel, K. L. The permeability method for determining specific surface of fibers and powders. Advances in Colloid Sciences 1: 37-80 (1942). Sushil, S., Peach, J. P., Hitt, D. L. and Eggleton, C. D. Rheology of mixtures of artificial blood and erythrocyte suspensions. Proceedings of the 2001 ASME Bioengineering Conference, Snowbird, UT, USA 50: 481-482 (2001). Sutterby, J. L. Laminar Newtonian and non-Newtonian converging flow in conical sections. Ph.D. Thesis. University of Wisconsin. xxv, 226 p. (1964). Tomlinson, K. C., Gardiner, S. M., Hebden, R. A. and Bennett, T. Functional consequences of streptozotocin-induced diabetes mellitus, with particular reference to the cardiovascular system. Pharmacol Rev 44: 103-150 (1992). Trebotich, D., Zahn, J. D., Prabhakarpandian, B. and Liepmann, D. Modeling of microfabricated microneedles for minimally invasive drug delivery, sampling and analysis. Biomed Microdev 5: 245-51 (2003). Wang, J., Lu, J., Ly, S. Y., Vuki, M., Tian, B., Adeniyi, W. K. and Armendariz, R. A. Lab-on-a-cable for electrochemical monitoring of phenolic contaminants. Analyt Chem 72: 2659-2663 (2000). Wang, M. Y., Ren, L. M., Du, Z. J. and Fu, S. X. Urethane-induced hyperglycemia. Acta Pharmacol Sin 21: 271-275 (2000). Wang, P. M., Cornwell, M. and Prausnitz, M. R. Minimally invasive extraction of dermal interstitial fluid for glucose monitoring using microneedles. Diabetes Technol Ther 7: 131-141 (2005).

156
Weibel, E. R. Handbook of Physiology, Am. Physiol. Soc., Washington, DC, 1964, pp. 284-307. Weiss, S. R., Berger, S., Cheng, S. L., Kourides , I., Landshulz, W. H. and Gelfand, R. A. Adjunctive therapy with inhaled human insulin in type 2 diabetic patients failing oral agents: a multicenter phase II trial. Diabetes 48: 48 (1999). Weiss, S. R., Cheng, S. L., Kourides, I. A., Gelfand, R. A. and Landschulz, W. H. Inhaled insulin provides improved glycemic control in patients with type 2 diabetes mellitus inadequately controlled with oral agents: a randomized controlled trial. Arch Intern Med 163: 2277-2282 (2003). Whitehead, K., Shen, Z. and Mitragotri, S. Oral delivery of macromolecules using intestinal patches: applications for insulin delivery. J Control Release 98: 37-45 (2004). Wille, J. J. and Kydonieus, A. F. Biochemical Modulation of Skin Reactions : Transdermals, Topicals, Cosmetics, CRC Press, Boca Raton, FL, 2000. Williams, A. C. and Barry, B. W. Penetration enhancers. Adv Drug Deliv Rev 56: 603-618 (2004). Xia, Y. and Whitesides, G. M. Soft lithography. Annu Rev Mater Sci 153-184 (1998). Yamasaki, Y., Shichiri, M., Kawamori, R., Kikuchi, M., Yagi, T., Arai, S., Tohdo, R., Hakui, N., Oji, N. and Abe, H. The effectiveness of rectal administration of insulin suppository on normal and diabetic subjects. Diabetes Care 4: 454-8 (1981). Yun, M., Choi, H., Jung, J. and Kim, C. Development of a thermo-reversible insulin liquid suppository with bioavailability enhancement. Int J Pharm 189: 137-145 (1999). Zahn, J. D., Deshmukh, A. A., Papavasiliou, A. P., Pisano, A. P. and Liepmann, D. An integrated microfluidic device for the continuous sampling and analysis of biological fluids. Proceedings of 2001 ASME International Mechanical Engineering Congress and Exposition, New York, NY, USA 3: 787-792 (2001). Zahn, J. D., Deshmukh, A. A., Pisano, A. P. and Liepmann, D. Continuous on-chip micropumping through a microneedle. 14th IEEE International Conference on Micro Electro Mechanical Systems, Interlaken, Switzerland 503-506 (2001). Zahn, J. D., Trebotich, D. and Liepmann, D. Microfabricated microdialysis microneedles for continuous medical monitoring. 1st Annual International IEEE-EMBS Special Topic Conference on Microtechnologies in Medicine and Biology, Lyon, France 375-380 (2000). Zhang, X.-Y., Luck, J., Dewhirst, M. W. and Yuan, F. Interstitial hydraulic conductivity in a fibrosarcoma. Am J Physiol Heart Circ Physiol 279: H2726-H2734 (2000).

157
Zimmermann, S., Fienbork, D., Stoeber, B., Flounders, A. W. and Liepmann, D. A microneedle-based glucose monitor: fabricated on a wafer-level using in-device enzyme immobilization. TRANSDUCERS, 12th International Conference on Solid-State Sensors, Actuators and Microsystems, Boston, MA, USA 1: 99-102 (2003).
158
VITA
Wijaya Martanto was born in Semarang, Indonesia on September 11, 1979. He graduated
from Loyola College High School, Indonesia in 1997. He then attended the University of
Minnesota, Twin Cities, Minnesota. In May 2000, he received a Bachelor of Science with
Magna Cum Laude and High Distinction in Chemical Engineering with a Minor in
Chemistry. In August 2000, he attended Georgia Institute of Technology, Atlanta,
Georgia. His dissertation title was “Microinjection Into Skin Using Microneedles.” He
defended his thesis on May 31, 2005 and obtained his Ph.D. in Chemical Engineering
with a Minor in Management and a Dupree College of Management Certificate for
Engineering Entrepreneurship on August 5, 2005.