Marshall University, Combined Financial Statements as of and … · Marshall University...
94
Marshall University Combined Financial Statements as of and for the Years Ended June 30, 2011 and 2010, and Independent Auditors’ Reports
Transcript of Marshall University, Combined Financial Statements as of and … · Marshall University...

Marshall University Combined Financial Statements as of and for the Years Ended June 30, 2011 and 2010, and Independent Auditors’ Reports

MARSHALL UNIVERSITY
TABLE OF CONTENTS
Page
INDEPENDENT AUDITORS’ REPORT 1–2
MANAGEMENT’S DISCUSSION AND ANALYSIS (RSI) (UNAUDITED) 3–13
COMBINED FINANCIAL STATEMENTS: Statements of Net Assets 14–15 The Marshall University Foundation, Inc. — Statements of Financial Position 16 Provident — Marshall Properties L.L.C. — Statement of Financial Position as of June 30, 2011 17 MSH — Marshall, L.L.C. — Statement of Financial Position as of June 30, 2010 18 Statements of Revenues, Expenses, and Changes in Net Assets 19–20 The Marshall University Foundation, Inc. — Statements of Activities 21–22 Provident — Marshall Properties L.L.C. — Statement of Activities and Comprehensive Income for the Period August 1, 2010 through June 30, 2011 23 MSH — Marshall, L.L.C. — Statement of Activities and Comprehensive Income for the Year Ended June 30, 2010 24
Statements of Cash Flows 25–26 Notes to Combined Financial Statements 27–90
INDEPENDENT AUDITORS’ REPORT ON INTERNAL CONTROL OVER FINANCIAL REPORTING AND ON COMPLIANCE AND OTHER MATTERS BASED ON AN AUDIT OF FINANCIAL STATEMENTS PERFORMED IN ACCORDANCE WITH GOVERNMENT AUDITING STANDARDS 91–92

INDEPENDENT AUDITORS’ REPORT
To the Governing Board of Marshall University:
We have audited the accompanying combined statements of net assets of Marshall University (the “University”) as of June 30, 2011 and 2010, and the related combined statements of revenues, expenses, and changes in net assets, and of cash flows for the years then ended. These combined financial statements are the responsibility of the management of the University. Our responsibility is to express an opinion on these combined financial statements based on our audits. We did not audit the discretely presented financial statements of The Marshall University Foundation, Inc. (the “Foundation”), Provident — Marshall Properties L.L.C. (“Provident — Marshall”), or MSH — Marshall, L.L.C. (“MSH — Marshall”) (component units of the University). Those statements were audited by other auditors whose reports have been furnished to us, and our opinion, insofar as it relates to the discretely presented financial statements of the Foundation, Provident — Marshall, and MSH — Marshall, is based solely on the reports of such other auditors.
We conducted our audits in accordance with auditing standards generally accepted in the United States of America and the standards applicable to financial audits contained in Government Auditing Standards, issued by the Comptroller General of the United States. The financial statements of Provident — Marshall and MSH — Marshall, which were audited by other auditors, were not audited in accordance with Government Auditing Standards. Those standards require that we plan and perform the audit to obtain reasonable assurance about whether the financial statements are free of material misstatement. An audit includes consideration of internal control over financial reporting as a basis for designing procedures that are appropriate in the circumstances, but not for the purpose of expressing an opinion on the effectiveness of the University’s internal control over financial reporting. Accordingly, we express no such opinion. An audit also includes examining, on a test basis, evidence supporting the amounts and disclosures in the financial statements, assessing the accounting principles used and significant estimates made by management, as well as evaluating the overall financial statement presentation. We believe that our audits provide a reasonable basis for our opinion.
In our opinion, based on our audits and the reports of the other auditors, such combined financial statements present fairly, in all material respects, the respective financial position of the University and the discretely presented component units of the University as of June 30, 2011 and 2010, and the respective changes in net assets and its cash flows for the years then ended in conformity with accounting principles generally accepted in the United States of America.
The Management’s Discussion and Analysis on pages 3 to 13, which is the responsibility of the University’s management, is not a required part of the basic combined financial statements, but is supplementary information required by the Governmental Accounting Standards Board. We have applied certain limited procedures, which consisted principally of inquiries of management regarding the methods of measurement and presentation of the supplementary information. However, we did not audit such information, and express no opinion on it.

- 2 -
In accordance with Government Auditing Standards, we have also issued our report dated October 17, 2011, on our consideration of the University’s internal control over financial reporting and our tests of its compliance with certain provisions of laws, regulations, contracts, grant agreements, and other matters. The purpose of that report is to describe the scope of our testing of internal control over financial reporting and compliance and the results of that testing, and not to provide an opinion on the internal control over financial reporting or on compliance. That report is an integral part of an audit performed in accordance with Government Auditing Standards and should be considered in assessing the results of our audit.
October 17, 2011
- 3 -
Marshall University
Management’s Discussion and Analysis (Unaudited) Fiscal Year 2011
About Marshall University Marshall University (the “University” or the “Institution”) is a public, non-profit institution of higher learning, which offers degrees in more than 100 academic fields of study at the baccalaureate and graduate degree level, including doctoral degrees (Ph.D. and professional doctorates) in various fields through its 12 colleges and schools. The University was founded in 1837 and achieved University status in 1961. Integral parts of the Institution included in the financial information presented are the Marshall University Research Corporation (MURC) and the Joan C. Edwards School of Medicine (SOM). MURC has a separately presented financial statement, which can be referenced for additional information about changes to that organization. As West Virginia’s second largest university, Marshall University including the SOM serves over 14,000 students from virtually all counties in West Virginia, 44 states and the District of Columbia, as well as over 300 students from more than 50 countries across the globe. The students are served by 719 full-time faculty and 891 staff members on its main campus located in Huntington, West Virginia and its four regional centers (South Charleston Campus, Mid-Ohio Valley Center, Teays Valley Center and Beckley Center).
Marshall University has been accredited continuously as an institution of higher learning by the Higher Learning Commission of the North Central Association of Colleges and Schools since 1928. It also has earned and maintains specialized accreditation status with 24 agencies responsible for evaluating and conferring specialty accreditation for educational programs involving various professional fields of study (includes business, engineering and technology, medicine, psychology, speech-language pathology, teacher education, etc.); see http://www.marshall.edu/www/accreditation.asp for a complete list.
Marshall University is governed by a 16-member Board of Governors (the “Board”), appointed by the Governor of the State of West Virginia, which determines, controls, supervises and oversees the financial, business and educational policies and affairs of the Institution. The Board of Governors also develops a master plan, approves the Institution’s annual budget, reviews and controls all academic programs offered at the Institution, and approves tuition rates and applicable student fees.
Overview of the Financial Statements and Financial Analysis The Management’s Discussion and Analysis is required supplementary information and has been prepared in accordance with the requirements of Governmental Accounting Standard Board (GASB) Standards.
The emphasis of discussions about these Statements will concern FY 2011 data explaining, with the use of approximate dollar amounts, the significant changes from the financial statements presented for the year ended June 30, 2010, for both the University and MURC. Three years of comparative information are provided for discussion and analysis purposes. Additionally, detailed financial information of the Marshall University Foundation, Inc., MSH — Marshall, L.L.C., and Provident — Marshall, L.L.C. are included; however, these component units are controlled and managed by independent 501(c) (3) corporations, with separate independent Boards of Directors. The student housing and recreation center project that was owned by MSH-Marshall, L.L.C. in fiscal year 2010 was sold to Provident – Marshall, L.L.C. in July of the 2011 fiscal year. The University does not control these resources and, therefore, discussion and analyses of these organizations are not included. The University’s financial report consists of three financial statements: the combined statement of net assets; the combined statement of revenues, expenses, and changes in net assets; and the combined statement of cash flows. These statements focus on the financial condition of the University, the results of operations, and cash flows of the University as a whole. Each of these statements is discussed below.

- 4 -
Net Assets
The statements of net assets present the assets (current and noncurrent), liabilities (current and noncurrent), and net assets (assets minus liabilities) of the University as of the end of the fiscal year. Assets denote the resources available to continue the operations of the University. Liabilities indicate how much the University owes vendors, employees and lenders. Net assets measure the equity or the availability of funds of the University for future periods. Net Assets are displayed in three major categories: Invested in capital assets, net of related debt. This category represents the University’s total investment in capital assets, net of accumulated depreciation and outstanding debt obligations related to those capital assets. To the extent debt has been incurred; but, not yet expended for capital assets, such amounts are not included as a component of invested in capital assets, net of related debt. Restricted net assets. This category includes net assets, the use of which is restricted, either due to externally imposed constraints or because of restrictions imposed by law. They are further divided into two additional components — nonexpendable and expendable. Nonexpendable restricted net assets include endowment and similar type funds for which donors or other outside sources have stipulated, as a condition of the gift instrument, that the principal is to be maintained inviolate and in perpetuity and invested for the purpose of producing present and future income, which may either be expended or added to principal. Expendable restricted net assets include resources for which the University is legally or contractually obligated to spend resources in accordance with restrictions imposed by external third parties. Unrestricted net assets. This category includes resources that are not subject to externally imposed stipulations. Such resources are derived primarily from tuition and fees (not restricted as to use), state appropriations, sales and services of educational activities and auxiliary enterprises. Unrestricted net assets are used for transactions related to the educational and general operations of the University and may be designated for specific purposes by action of the University’s management or the Board of Governors.
FY 2011 FY 2010 FY 2009Assets: Current assets $ 120,490 $ 111,265 $ 91,122 Other noncurrent assets 42,497 24,192 27,429 Capital assets, net 327,319 318,604 322,974Total Assets $ 490,306 $ 454,061 $ 441,525
Liabilities Current liabilities $ 41,680 $ 36,956 $ 33,168 Noncurrent liabilities 109,443 104,524 96,386Total Liabilities $ 151,123 $ 141,480 $ 129,554
Net Assets Invested in capital assets, net of related debt $ 257,709 $ 244,714 $ 244,458 Restricted - nonexpendable 7,368 914 641 Restricted - expendable 22,134 20,886 20,637 Unrestricted 51,972 46,067 46,235
Total Net Assets $ 339,183 $ 312,581 $ 311,971
Condensed Combined Statements of Net Assets(In thousands of dollars)

- 5 -
Changes to Total Assets
Total assets of the Institution increased by $36.2 million in FY 2011 compared to an increase of $12.5 million FY 2010. The major components of this increase are:
Cash balances for the University increased $5.1 million in total as a result of a $7.8 million increase in current cash related to student fees and auxiliaries and a $2.7 million decrease in restricted cash due to the elimination of the debt service reserve for the 2001 bonds offset by an increase in the Board of Risk and Insurance Management escrow.
Cash balances at MURC decreased $1.1 million related to grant activity. Investments increased $20.9 million in total with the MURC’s investments increasing $10.5 million during
the year and the University investments increasing $10.4 million. The University did not have any investments at the end of fiscal year 2010 due to a State Code sunset clause that only allowed the University’s monies to be invested through June 30, 2010. In July 2010, legislation was passed to allow investment through July 31, 2011. In October 2010, the University once again invested with Commonfund and the fair market value of that investment was $10.4 million at year end (the $8.1 million short term portion of the University’s Commonfund investments are considered cash equivalents and are included in the cash balance). During the 2011 legislative session, the State Code sunset clause was removed and the amount of monies that the University can invest was increased to $30 million.
Total current and noncurrent accounts receivable increased $1.6 million primarily as a result of the monies due from Economic Development Authority for the East Bonds projects of $2.3 million.
Capital Assets, net of depreciation, increased $8.7 million as a result of asset additions of $22.0 million, offset by disposals and depreciation totaling $13.3 million. Asset additions are discussed further in the Capital Asset and Debt Administration section.
Changes to Total Liabilities
Total liabilities of the Institution increased $9.6 million in FY 2011 compared to an increase of $11.9 million in FY 2010. The major increase to liabilities this year is for Other Post Employment Benefits (OPEB), which increased $11.7 million. See below and Notes 2 and 11 for more information on OPEB. Other changes to liabilities in FY 2011 are related to accounts payable, deferred revenue, and long-term debt. The major components of this increase are:
OPEB liability increased $11.7 million. This represents the unfunded liability that the University is not currently required to pay. In FY11, the Annual Required Contribution (ARC) was $742 per policy per month, in FY10 it was $761 and in FY09 it was $224. The changes are the result of changes in the discount rate and other factors used in the actuarial study that Public Employees Insurance Agency (PEIA) uses to determine the ARC amount and the elimination of payments made by the State on behalf of the University beginning with 2010.
Accounts payable and accrued liabilities increased a total of $4.6 million due to increases in payables to vendors for supplies and services mainly related to increased construction activity.
Current and noncurrent debt decreased by $6.5 million due to payments made during FY 2011 including the debt obligation to the Commission, bonds and notes payable, capital leases, and the amount due to Mountwest Community and Technical College (MCTC).
Changes to Net Assets
The final section of this Statement reflects the net asset balances. Changes to these balances from one year to the next reflect the net growth or contraction of the Institution over time with each category reflecting the varying degrees of liquidity and restrictions for which these assets are available to be used. The net asset category “Invested in capital assets, net of related debt” reflects overall changes to the buildings, equipment, and other capital assets net of depreciation and net of the liabilities associated with those assets. Investment in capital assets net of related debt increased $13.0 million in FY 2011 compared to an increase of only $0.3 million in FY 2010. For the University, the increase is $9.7 million resulting from a $5.6 million increase in net capital assets, a $1.3 million increase in other noncurrent assets (unamortized bond issuance costs) and a $2.8 million decrease in related liabilities. The net assets-invested in capital assets of MURC increased $3.3 million.

- 6 -
Endowments which are recorded as restricted nonexpendable net assets increased $6.5 million. This increase was at MURC for amounts received in connection with the “Bucks for Brains” West Virginia Research Trust fund. Total restricted expendable net assets increased $1.2 million in FY 2011 compared to an increase of $0.3 million in FY 2010, attributable to increased grant activity at MURC. The unrestricted net asset balance of $52.0 million in FY 2011 represents a $5.9 million increase from FY 2010. Unrestricted net assets increased $1.2 million for MURC and increased $4.7 million for the University.
FY 2011 FY 2010 FY 2009
Operating revenues $ 179,444 $ 166,478 $ 156,477
Operating expenses (257,146) (255,951) (233,252)
Operating loss (77,702) (89,473) (76,775)
Nonoperating revenues 94,146 90,632 85,128 Nonoperating expenses (3,480) (3,918) (4,588)
Income (loss) before other revenues,
expenses, gains, or losses 12,964 (2,759) 3,765
Other revenues, expenses, gains, or losses 13,638 3,773 5,619
Transfer to MCTC - (404) -
Increase in net assets $ 26,602 $ 610 $ 9,384
Condensed Combined Statements of Revenues, Expenses and Changes in Net Assets(In thousands of dollars)
Statement of Revenues, Expenses, and Changes in Net Assets The purpose of the Statement of Revenues, Expenses, and Changes in Net Assets is to present the revenues and expenses, both operating and nonoperating, as well as other gains and losses of the Institution. Operating Revenues Operating revenues are received for student tuition and fees, grants and contracts, auxiliary services and miscellaneous revenue. Operating revenues of $179.4 million in FY 2011 represents a $13.0 million increase from FY 2010. These increases are primarily the result of:
Increases in tuition and fee revenue, net of scholarship allowances, of $2.9 million. Tuition for full-time undergraduate students increased $25 per semester for resident students, $149 for metro students and $207 per semester for nonresident students. Tuition for full-time graduate students increased $25 per semester for resident students, $160 for metro students and $227 per semester for nonresident students. Student enrollment for the 2010-2011 academic year was approximately 14,200, which was a 3% increase over the 2009-2010 academic year.
Contract and grant revenue increased a combined $7.5 million primarily due to grants at MURC, including a federal INBRE II award for $3.1 million.
Auxiliary enterprise revenues increased $2.2 million, including a $1.1 million increase in housing resulting from increased housing rates as well as increased occupancy, and a $1.5 million increase in Athletics due to increased ticket sales. These increases are offset by a $0.4 million decrease from changes in other auxiliaries and the auxiliary scholarship allowance.

- 7 -
Operating Expenses
Operating expenses are paid for goods and services to carry out the mission of the Institution. Operating expenses of $257.1 million in FY 2011 represents a $1.2 million increase from FY 2010. These increases are primarily the result of:
Increases in expenses totaling $4.7 million, including $2.0 million in student financial aid, $1.4 million in supplies and other services, $0.8 million in salaries, and $0.5 million in utilities.
These increases were offset by reductions in expenses totaling $3.5 million, including a $0.5 million in depreciation and $2.9 million in benefits as a result of a reduction in compensated absence expense for annual leave and lower OPEB expenses. PEIA no longer charges the University for the OPEB ARC for new hires because they are not eligible for OPEB benefits.
Nonoperating Revenues and Expenses
Revenues for which goods and services are not provided are reported as nonoperating revenues. Likewise, Federal Pell Grants (Pell) are reported as nonoperating because of specific guidance in the AICPA industry audit guide. Nonoperating revenues for FY 2011 were $94.1 million, which is an increase of $3.5 million as a result of:
State appropriations were increased $1.2 million and the state fiscal stabilization funds increased $1.2 million. The State Fiscal Stabilization Funds from the Federal American Reinvestment and Recovery Act of 2009 (ARRA) were used to backfill the reduction in State appropriations from the 2009 level.
Investment income decreased $0.8 million. The University resumed its investment in Commonfund in October resulting in FY 2011 having only nine months of performance versus 12 months in FY 2010.
Other changes to nonoperating revenues include an increase in Pell grant revenue of $3.0 million and a decrease of $1.1 million in gifts.
Total operating and nonoperating revenue for the Institution was $273.6 million in FY 2011 as compared to $257.1 million in FY 2010. Revenues as a percentage for FY 2011 and 2010 are shown on Graph A. Total operating and nonoperating expense for the Institution was $260.6 million in FY 2011 as compared to $259.9 million in FY 2010. Expenses as a percentage for FY 2011 and 2010 are shown by object of expenditure in Graph B and by functional classification in Graph C.

- 8 -
Total Operating and Nonoperating Revenues
(Graph A)

- 9 -
Total Operating and Nonoperating Expenses By Object (Graph B)

- 10 -
Total Operating and Nonoperating Expenses
By Function (Graph C)

- 11 -
Income before other Revenues, Expenses, Gains, or Losses
The total of both operating and nonoperating revenues and expenses is reflected in the income before other revenues, expenses, and other items. In FY 2011, there was income of $13.0 million for the Institution. Of this total, the University had net income of $1.1 million while MURC had net income of $11.9 million. Note, if the unfunded portion of OPEB expense were excluded, the total Institution would show $24.7 million of net income. Changes to Net Assets
The increase in net assets of $26.6 million reflects marked improvement in the Institution’s general financial condition as FY2010 only had a $0.6 million increase in net assets. The net asset increase includes capital grants and gifts of $9.3 million and $4.0 million of capital bond proceeds from the Economic Development Authority. Statement of Cash Flows The statement of cash flows provides information about the cash receipts, cash payments, and net change in cash resulting from the operating, investing, and financing activities (capital and noncapital) of the University during the year. This statement helps users assess the University’s ability to generate net cash flows, its ability to meet obligations as they come due, and its need for external finance.
FY 2011 FY 2010 FY 2009
Cash flows (used in) provided by: Operating activities $ (49,981) $ (63,016) $ (61,800) Noncapital financing activities 93,459 89,612 82,447 Capital and related financing activities (16,784) (13,477) (14,381)
Investing activities (19,948) 4,953 831
Net change in current cash 6,746 18,072 7,097
Current cash, beginning of year 92,108 74,036 66,939
Current cash, end of year $ 98,854 $ 92,108 $ 74,036
Condensed Combined Statements of Cash Flows(In thousands of dollars)
. The statement of cash flows is divided into five sections:
Cash flows from operating activities show the net cash used by the operating activities of the University. Cash flows from noncapital financing activities reflect the cash received and paid for nonoperating,
noninvesting, and noncapital financing purposes. State appropriations are the primary source of cash in this section.
Cash flows from capital financing activities include cash used for the acquisition and construction of capital and related items.
Cash flows from investing activities show the purchases, proceeds, and interest received from investing activities.
Reconciliation of operating loss to net cash used in operating activities provides a schedule that reconciles the accrual-based operating loss and net cash used in operating activities.

- 12 -
Capital Asset and Debt Administration
The University continued its significant construction, renovation, and capital activities in fiscal year 2011, financed by state-issued bond proceeds, grants, gifts, and other University funds.
Projects that were completed in fiscal year 2011 include the Logan County Rural Health and Clinical Educational Center in Chapmanville, West Virginia, and renovations to the Student Center.
Projects that were initiated in fiscal year 2011 include deferred maintenance projects at the Drinko Library, Smith Hall, Henderson Center, Gullickson Hall, the Science Building, and the Fine and Performing Arts Center.
The Commission assesses each public institution of higher education for funds to meet the payment of debt service on various revenue bonds that were issued for the financing of academic and other facilities of the State’s universities and colleges, including certain facilities of the University. The bonds remain as a capital obligation of the Commission; however, $21.4 million is reported as debt service assessment payable to the Commission by the University. During FY2011, the Institution issued new Series 2010 Bonds that refunded the University’s Facilities Revenue Bonds Series 2001A. The issuance of the Series 2010 bonds resulted in a savings of $1.7 million for the University that will be realized over the first two years of the bond amortization schedule via reduced payments. In FY 2009, as part of the MCTC separation, the University incurred a long term payable to MCTC of $3.5 million for real asset acquisition. Payments made in FY 2011 and FY 2010 result in the fiscal year end amount payable of $2.5 million. Economic Outlook The University’s financial position is closely coupled to that of the State of West Virginia. The Institution continues to be at risk for a reallocation of State appropriations to other State institutions and/or non-higher education State funded entities. For FY 2011, the Institution’s total State appropriations were reduced by over $2.2 million from its 2009 level. However, this reduction was temporarily replaced by State Fiscal Stabilization Funds, which ended in FY 2011. State appropriations for FY 2012 currently are $75.5 million. Due to the uncertainty in future State appropriations, the University has taken strides to lower this dependence through initiatives that will provide greater self-reliance and sustainability for the future with a goal of maintaining or improving our existing revenue streams. The University is focused on cost controls, judicious spending, utility conservation measures, and revenue enhancements with highlights noted below. DEFERRED MAINTENANCE: Marshall University has been awarded $17.6 million in deferred maintenance and capital improvement funding for academic buildings from the State in conjunction with the issuance of the EAST (Education Arts Science and Tourism) Bonds. As of June 30, 2011, the University has recognized $4.0 million of these funds. This one-time funding from the State enabled the Institution to significantly lower its deferred maintenance obligations over the next two years and make important academic building improvements such as the Medical Education Building (MEB) renovations, Fine and Performing Arts building renovations, Smith Hall renovations including the replacement of the windows, and roof replacements for the Drinko Library, Science Hall, Henderson Center and Gullickson Hall. These improvements will support Marshall’s continuing efforts to grow enrollment and improve annual operating cost efficiencies. The University also is scheduled to receive $25.0 million of HEPC 2010 Series A Bond proceeds, which will be used towards the construction of the new Biotechnology Development Center and Applied Engineering Complex. RESEARCH: Major research program development is occurring in targeted areas that build on existing strengths of the University. These focused areas include: biotechnology and genomics research, including a developing focus in human and environmental genomics, forensic science (DNA, computer and microbial forensics), cancer, cardiovascular, geospatial sciences, transportation research and intelligent transportation system design, environmental sciences, and cognitive disabilities and rehabilitation (e.g., learning/attention deficit disorders, autism). The endowment-based Marshall Institute for Interdisciplinary Research (MIIR) has been established and is operational within the Robert C. Byrd Biotechnology and Science Center. This Institute is funded through proceeds from private, endowed gifts matched by endowment funds from the WV Research Trust Fund.

- 13 -
ENROLLMENT GROWTH PLAN: Beginning in summer 2006, Marshall University launched a series of initiatives to increase full-time undergraduate enrollment by up to 3,500 full-time students over the next decade. The primary objective is to maximize and manage enrollment growth by taking full advantage of existing institutional capacities in terms of instructional space, faculty and support staff. The targeted enrollment growth will be achieved through a combination of annual increases in the size of the freshmen class with greater non-resident student enrollment and improved retention rates across all levels to achieve six-year graduation rates that exceed 60%. Student enrollment for the 2010-2011 academic year was approximately 14,200, which was a 3% increase over the 2009-2010 academic year. The results of this initiative continue to be evident because, in Fall 2011, Marshall University welcomed another record-enrollment entering freshman class.
Going forward, the University has identified the following priorities to pursue over the next five years:
Continued emphasis on student recruitment, retention, and graduation successes. Selective new, high-demand degree program development, including the most recent addition of the School
of Pharmacy and the professional doctoral program in Physical Therapy (Doctorate in Physical Therapy, D.P.T.), both of which currently are in their start-up accreditation phases. Other degree programs in the planning phase include a new BBA in Risk Management and Insurance, a new BS in Health Sciences, and a new BS in Public Health.
Continued management of financial resources with a goal to improve faculty and staff compensation. During FY 2011, a Long Range Budget Plan was developed to support this goal. Additionally, faculty and staff compensation increases became effective at the beginning of FY 2012.
Addressing major deferred maintenance challenges on campus and funding new capital project priorities, with major emphasis and fund raising being placed on a new Biotechnology and Applied Engineering Complex and a Sports Translational Research Center.
Development of a comprehensive plan for campus-wide upgrades to furnishings and instructional technology capabilities with funding for the plan on a life cycle basis.
This is a pivotal time for the University. As the nation continues to struggle with economic difficulties, higher educational attainment continues to be a priority for our nation and many people. The challenge for the University is to continue to plan for the short term and the long term while maintaining strong leadership that encourages teamwork and relationship building and a steadfast commitment to excellence. With this foundation in place, Marshall University will succeed in advancing the creativity, adaptability, and capacity of the State’s citizens to continue to think, learn, relearn, and transform their marketability in a world economy that is increasingly dominated by global change. Although these are unpredictable economic times and there are challenges ahead of us, Marshall University continues to successfully sustain its commitment to continuing to provide its high standard of undergraduate and graduate education to its students and the citizens of our State and Nation at an affordable cost.

- 14 -
MARSHALL UNIVERSITY
COMBINED STATEMENTS OF NET ASSETSAS OF JUNE 30, 2011 AND 2010
2011 2010
ASSETS
CURRENT ASSETS: Cash and cash equivalents 98,854,192$ 92,108,612$ Accounts receivable — net 19,705,578 17,303,705 Loans receivable 869,806 866,117 Inventories 723,992 731,712 Other current assets 336,191 254,458
Total current assets 120,489,759 111,264,604
NONCURRENT ASSETS: Cash and cash equivalents 2,232,550 4,906,088 Investments 25,968,361 5,109,541 Accounts receivable 5,293,714 6,098,384 Loans receivable — net of allowance of $1,784,336 and $1,553,370 in 2011 and 2010, respectively 6,710,983 7,075,171 Other assets 2,292,343 1,003,143 Capital assets — net 327,318,832 318,603,537
Total noncurrent assets 369,816,783 342,795,864
TOTAL 490,306,542$ 454,060,468$
(Continued)

- 15 -
MARSHALL UNIVERSITY
COMBINED STATEMENTS OF NET ASSETSAS OF JUNE 30, 2011 AND 2010
2011 2010
LIABILITIES AND NET ASSETS
CURRENT LIABILITIES: Accounts payable 10,939,038$ 6,569,113$ Due to MCTC — current portion 350,000 437,500 Accrued liabilities 7,767,018 7,580,535 Deferred revenue 8,164,676 7,235,495 Deposits 678,883 679,483 Notes, capital lease, and bonds payable — current portion 1,936,953 2,173,160 Compensated absences 8,533,947 9,120,324 Debt obligation to the Commission — current portion 3,309,689 3,160,103
Total current liabilities 41,680,204 36,955,713
NONCURRENT LIABILITIES: Notes, capital lease, and bonds payable 47,537,048 50,217,161 Advances from federal sponsors 6,409,866 6,418,460 Other noncurrent liabilities 8,177,986 8,574,101 Other post employment benefits liability 27,102,502 15,438,783 Due to MCTC 2,142,834 2,492,834 Debt obligation to the Commission 18,072,847 21,382,536
Total noncurrent liabilities 109,443,083 104,523,875
Total liabilities 151,123,287 141,479,588
NET ASSETS: Invested in capital assets — net of related debt 257,709,200 244,713,976
Restricted for: Nonexpendable 7,368,505 914,191
Expendable: Scholarships 138,085 82,550 Sponsored projects 19,872,558 18,337,745 Loans 2,116,889 2,382,578 Debt service 6,309 82,679
Total restricted expendable 22,133,841 20,885,552
Unrestricted 51,971,709 46,067,161
Total net assets 339,183,255 312,580,880
TOTAL 490,306,542$ 454,060,468$
See notes to combined financial statements. (Concluded)

- 16 -
MARSHALL UNIVERSITY
THE MARSHALL UNIVERSITY FOUNDATION, INC.STATEMENTS OF FINANCIAL POSITIONAS OF JUNE 30, 2011 AND 2010
2011 2010
ASSETS Cash and cash equivalents 8,992,272$ 7,308,174$ Unconditional promises to give, less allowance for uncollectible promises of $197,528 and $129,919 in 2011 and 2010, respectively 9,765,271 5,119,855 Contributions receivable from remainder trusts 978,911 478,743 Other receivables 48,571 25,658 Beneficial interest in perpetual trust 8,889,783 6,415,960 Investments 90,406,465 76,060,291 Net investment in direct financing leases 3,101,508 3,587,018 Property and equipment - net 12,876,755 13,298,035 Cash surrender value-life insurance, net of policy loans 394,645 337,017 Prepaids 19,500 -0- Other assets 629,400 629,400
TOTAL ASSETS 136,103,081$ 113,260,151$
LIABILITIES AND NET ASSETS
LIABILITIES Accounts payable 38,501$ 439,532$ Accrued vacation and wages 103,352 121,638 Accrued interest payable 35,602 40,112 Bonds payable 12,322,179 3,606,758 Notes payable -0- 8,735,452 Annuity payment liability 628,641 690,241 Deferred revenue 270,765 236,578 Fair value of interest rate swap 140,726 -0-
TOTAL LIABILITIES 13,539,766 13,870,311
NET ASSETS Unrestricted 16,976,026 10,357,717 Temporarily restricted 25,384,186 20,696,013 Permanently restricted 80,203,103 68,336,110
TOTAL NET ASSETS 122,563,315 99,389,840
TOTAL LIABILITIES AND NET ASSETS 136,103,081$ 113,260,151$
See notes to combined financial statements.
- 17 -
MARSHALL UNIVERSITY
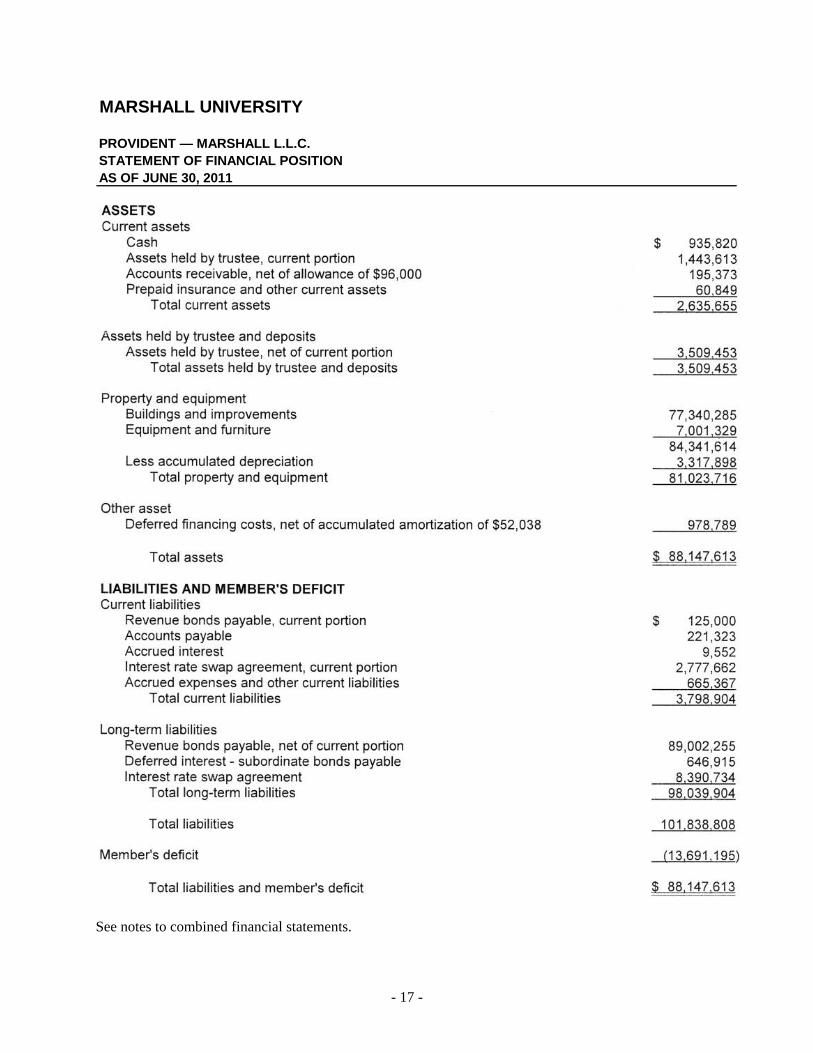
PROVIDENT — MARSHALL L.L.C.STATEMENT OF FINANCIAL POSITIONAS OF JUNE 30, 2011
See notes to combined financial statements.

- 18 -
MARSHALL UNIVERSITY
MSH — MARSHALL, L.L.C.STATEMENT OF FINANCIAL POSITIONAS OF JUNE 30, 2010
2010ASSETS
CURRENT ASSETS: Cash and cash equivalents 1,102,676$ Investments — bond funds 1,114,023 Accounts receivable 98,642 Interest receivable Inventory 5,047 Prepaid expenses 17,825
Total current assets 2,338,213
RESTRICTED ASSETS — Investments — debt service reserves 5,629,679
CAPITAL ASSETS — Net 79,540,771
OTHER ASSETS — Debt issuance costs — net 2,458,069
Total other assets 2,458,069
TOTAL 89,966,732$
LIABILITIES AND NET ASSETS
CURRENT LIABILITIES: Accounts payable and accrued liabilities 767,186$ Accrued interest payable 323,936 Unearned revenue 92,233
Total current liabilities 1,183,355
LONG-TERM LIABILITIES:Accrued interest payable 1,338,187 Bonds payable 90,065,000
Total long-term liabilities 91,403,187
OBLIGATION UNDER INTEREST RATE SWAP 13,277,767
Total liabilities 105,864,309
MEMBER’S DEFICIT (15,897,577)
TOTAL 89,966,732$
See notes to combined financial statements.

- 19 -
MARSHALL UNIVERSITY
COMBINED STATEMENTS OF REVENUES, EXPENSES, AND CHANGES IN NET ASSETSFOR THE YEARS ENDED JUNE 30, 2011 AND 2010
2011 2010
OPERATING REVENUES: Student tuition and fees — net of scholarship allowance of $27,636,917 and $26,215,579 in 2011 and 2010, respectively 61,845,199$ 58,904,116$ Contracts and grants: Federal 37,532,029 34,384,266 State 26,553,816 20,535,999 Local 2,739,604 952,066 Private 12,347,383 15,799,489 Interest on loans receivable 127,918 133,338 Sales and services of educational activities 126,334 131,174 Auxiliary enterprise revenue — net of scholarship allowance of $4,046,698 and $3,477,814 in 2011 and 2010, respectively 29,459,854 27,265,884 Other operating revenues 8,712,122 8,371,927
Total operating revenues 179,444,259 166,478,259
OPERATING EXPENSES: Salaries and wages 114,859,618 114,053,264 Benefits 43,750,084 46,714,775 Supplies and other services 53,165,243 51,737,326 Utilities 8,955,864 8,458,098 Student financial aid — scholarships and fellowships 22,528,524 20,541,524 Depreciation 12,848,716 13,382,695 Other operating expenses 344,282 396,241 Fees assessed by the Commission for operations 694,131 667,466
Total operating expenses 257,146,462 255,951,389
OPERATING LOSS (77,702,203) (89,473,130)
(Continued)

- 20 -
MARSHALL UNIVERSITY
COMBINED STATEMENTS OF REVENUES, EXPENSES,AND CHANGES IN NET ASSETSFOR THE YEARS ENDED JUNE 30, 2011 AND 2010
2011 2010
NONOPERATING REVENUES (EXPENSES): State appropriations 69,343,950$ 68,169,997$ State fiscal stabilization funds (federal) 3,857,032 2,691,646 Federal Pell grants 19,379,957 16,367,125 Gifts 673,912 1,742,174 Investment income 891,555 1,661,375 Interest on indebtedness (2,151,418) (2,590,938) Fees assessed by the Commission for debt service (1,150,693) (1,283,848) Other nonoperating expenses — net (178,167) (43,263)
Net nonoperating revenues 90,666,128 86,714,268
INCOME (LOSS) BEFORE OTHER REVENUES, EXPENSES, GAINS, OR LOSSES 12,963,925 (2,758,862)
CAPITAL GRANTS AND GIFTS 9,270,344 2,090,612
STATE CAPITAL GRANTS (FEDERAL) 375,764 298,900
CAPITAL BOND PROCEEDS FROM THE COMMISSION 1,382,697
CAPITAL BOND PROCEEDS FROM STATE 3,992,342
TRANSFER NET ASSETS TO MOUNTWEST CTC (403,744)
INCREASE IN NET ASSETS 26,602,375 609,603
NET ASSETS — Beginning of year 312,580,880 311,971,277
NET ASSETS — End of year 339,183,255$ 312,580,880$
See notes to combined financial statements. (Concluded)

- 21-

- 22 -

- 23 -
MARSHALL UNIVERSITY
PROVIDENT — MARSHALL L.L.C.STATEMENT OF ACTIVITIES AND COMPREHENSIVE INCOMEFOR THE PERIOD AUGUST 1, 2010 THROUGH JUNE 30, 2011
See notes to combined financial statements.

- 24 -
MARSHALL UNIVERSITY
MSH — MARSHALL L.L.C.STATEMENT OF ACTIVITIES AND COMPREHENSIVE INCOMEFOR THE YEAR ENDED JUNE 30, 2010
2010
REVENUES: Housing 3,752,687$ Wellness center 3,740,811 Interest income 239,748
Total revenues 7,733,246
EXPENSES: Interest expense 4,655,983 Depreciation and amortization 3,414,681 Payroll and related benefits 1,206,049 Letter of credit fees 831,367 Utilities 610,799 Building maintenance 531,512 Management fees 379,000 Insurance 132,368 Rental expenses 121,147 Remarketing fees 81,065 Legal and accounting 61,288 Owners fees 60,954 Office supplies and equipment 32,193 Taxes and licenses 22,124 Travel 20,849 Trustee fees 12,600 Telephone and communications 12,291 Bond rating fees 9,000 Bad debt expense 8,571 Interior unit expenses 4,412 Arbitrage rebate expense (benefit) (65,255)
Total expenses 12,142,998
OTHER INCOME (EXPENSE): Realized gain on investments 566,621 Unrealized gain on investments Unrealized (loss) on investments (4,397,867)
Total other income (expense) (3,831,246)
NET LOSS (8,240,998)
MEMBER’S DEFICIT: Beginning of the year (7,656,579)
End of the year (15,897,577)$
See notes to combined financial statements.
- 25 -
MARSHALL UNIVERSITY
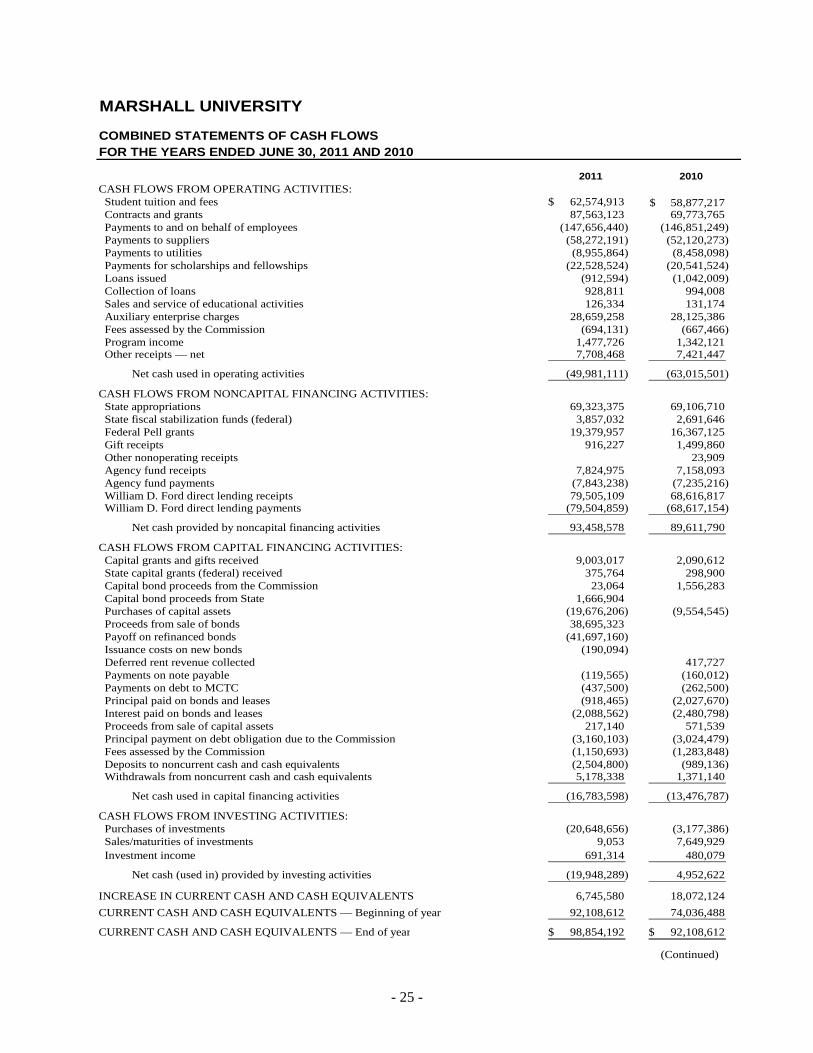
COMBINED STATEMENTS OF CASH FLOWSFOR THE YEARS ENDED JUNE 30, 2011 AND 2010
2011 2010CASH FLOWS FROM OPERATING ACTIVITIES: Student tuition and fees 62,574,913$ 58,877,217$ Contracts and grants 87,563,123 69,773,765 Payments to and on behalf of employees (147,656,440) (146,851,249) Payments to suppliers (58,272,191) (52,120,273) Payments to utilities (8,955,864) (8,458,098) Payments for scholarships and fellowships (22,528,524) (20,541,524) Loans issued (912,594) (1,042,009) Collection of loans 928,811 994,008 Sales and service of educational activities 126,334 131,174 Auxiliary enterprise charges 28,659,258 28,125,386 Fees assessed by the Commission (694,131) (667,466) Program income 1,477,726 1,342,121 Other receipts — net 7,708,468 7,421,447
Net cash used in operating activities (49,981,111) (63,015,501)
CASH FLOWS FROM NONCAPITAL FINANCING ACTIVITIES: State appropriations 69,323,375 69,106,710 State fiscal stabilization funds (federal) 3,857,032 2,691,646 Federal Pell grants 19,379,957 16,367,125 Gift receipts 916,227 1,499,860 Other nonoperating receipts 23,909 Agency fund receipts 7,824,975 7,158,093 Agency fund payments (7,843,238) (7,235,216) William D. Ford direct lending receipts 79,505,109 68,616,817 William D. Ford direct lending payments (79,504,859) (68,617,154)
Net cash provided by noncapital financing activities 93,458,578 89,611,790
CASH FLOWS FROM CAPITAL FINANCING ACTIVITIES: Capital grants and gifts received 9,003,017 2,090,612 State capital grants (federal) received 375,764 298,900 Capital bond proceeds from the Commission 23,064 1,556,283 Capital bond proceeds from State 1,666,904 Purchases of capital assets (19,676,206) (9,554,545) Proceeds from sale of bonds 38,695,323 Payoff on refinanced bonds (41,697,160) Issuance costs on new bonds (190,094) Deferred rent revenue collected 417,727 Payments on note payable (119,565) (160,012) Payments on debt to MCTC (437,500) (262,500) Principal paid on bonds and leases (918,465) (2,027,670) Interest paid on bonds and leases (2,088,562) (2,480,798) Proceeds from sale of capital assets 217,140 571,539 Principal payment on debt obligation due to the Commission (3,160,103) (3,024,479) Fees assessed by the Commission (1,150,693) (1,283,848) Deposits to noncurrent cash and cash equivalents (2,504,800) (989,136) Withdrawals from noncurrent cash and cash equivalents 5,178,338 1,371,140
Net cash used in capital financing activities (16,783,598) (13,476,787)
CASH FLOWS FROM INVESTING ACTIVITIES: Purchases of investments (20,648,656) (3,177,386) Sales/maturities of investments 9,053 7,649,929 Investment income 691,314 480,079
Net cash (used in) provided by investing activities (19,948,289) 4,952,622
INCREASE IN CURRENT CASH AND CASH EQUIVALENTS 6,745,580 18,072,124
CURRENT CASH AND CASH EQUIVALENTS — Beginning of year 92,108,612 74,036,488
CURRENT CASH AND CASH EQUIVALENTS — End of year 98,854,192$ 92,108,612$
(Continued)

- 26 -
MARSHALL UNIVERSITY
COMBINED STATEMENTS OF CASH FLOWS FOR THE YEARS ENDED JUNE 30, 2011 AND 2010
2011 2010
RECONCILIATION OF NET OPERATING LOSS TO NET CASH USED IN OPERATING ACTIVITIES: Operating loss (77,702,203)$ (89,473,130)$ Adjustments to reconcile net operating loss to net cash used in operating activities: Depreciation expense 12,848,716 13,382,695 Changes in assets and liabilities: Accounts receivable — net 31,723 (4,386,401) Loans receivable — net 360,499 111,486 Prepaid expenses (81,734) 16,270 Inventories 7,720 16,285 Accounts payable 2,836,339 1,162,863 Accrued liabilities (130,385) 2,079,282 Other post employment benefits liability 11,663,719 12,450,009 Compensated absences (586,377) 807,117 Deferred revenue 780,066 913,674 Deposits held in custody for others (600) (3,250) Advances from federal sponsors (8,594) (92,401)
NET CASH USED IN OPERATING ACTIVITIES (49,981,111)$ (63,015,501)$
NONCASH TRANSACTIONS: Donated capital assets 4,159,043$ 1,273,040$
Loss on disposal of assets 178,167$ 67,173$
Property additions in accounts payable 2,011,174$ 77,999$
See notes to combined financial statements. (Concluded)

- 27 -
MARSHALL UNIVERSITY
NOTES TO COMBINED FINANCIAL STATEMENTS AS OF AND FOR THE YEARS ENDED JUNE 30, 2011 AND 2010
1. ORGANIZATION
Marshall University (the “University”) is governed by the Marshall University Board of Governors (the “Board”). The Board was established by Senate Bill (S.B.) 653.
Powers and duties of the Board include, but are not limited to, the power to determine, control, supervise, and manage the financial, business, and educational policies and affairs of the institution(s) under its jurisdiction; the duty to develop a master plan for the institution; the power to prescribe the specific functions and institution(s) budget requests; the duty to review, at least every five years, all academic programs offered at the institution(s); and the power to fix tuition and other fees for the different classes or categories of students enrolled at the institution(s).
S.B. 653 also created the West Virginia Higher Education Policy Commission (the “Commission”), which is responsible for developing, gaining consensus around, and overseeing the implementation and development of a higher education public policy agenda.
As a requirement of Governmental Accounting Standards Board standards (GASB), the University has included information from the Marshall University Foundation, Inc. (the “Foundation”), Provident Group — Marshall Properties, L.L.C. (“Provident — Marshall”) for the period ending June 30, 2011, and MSH — Marshall, L.L.C. (“MSH — Marshall”) for the period ending June 30, 2010.
On July 30, 2010 Provident — Marshall purchased the project previously owned by MSH – Marshall. MSH — Marshall recognized a gain on sale of the project, net of unamortized issuance costs, of $17 million. For additional information see Note 7 of the Provident — Marshall financial statements included in the Component Unit’s Disclosures.
Although the University benefits from the activities of the Foundation, the Foundation is independent of the University in all respects. The Foundation is not a subsidiary of the University and is not directly or indirectly controlled by the University. The Foundation has its own separate, independent Board of Directors. Moreover, the assets of the Foundation are the exclusive property of the Foundation and do not belong to the University. The University is not accountable for, and does not have ownership of, any of the financial and capital resources of the Foundation. The University does not have the power or authority to mortgage, pledge, or encumber the assets of the Foundation. The Board of Directors of the Foundation is entitled to make all decisions regarding the business and affairs of the Foundation, including, without limitation, distributions made to the University. Under State law, neither the principal nor income generated by the assets of the Foundation can be taken into consideration in determining the amount of State-appropriated funds allocated to the University. Third parties dealing with the University, the Board, and the State of West Virginia (the “State”) (or any agency thereof) should not rely upon the financial statements of the Foundation for any purpose without consideration of all the foregoing conditions and limitations.
Although the University benefits from the activities of Provident — Marshall and MSH — Marshall, Provident — Marshall and MSH — Marshall are independent of the University in all respects. Provident — Marshall and MSH — Marshall are not subsidiaries of the University and are not directly or indirectly controlled by the University. Provident — Marshall is a nonprofit corporation that is operated

- 28 -
for charitable purposes. MSH — Marshall is a wholly owned subsidiary of Mustard Seed Housing, Inc., which is a nonprofit corporation that is operated for charitable purposes. The assets of Provident — Marshall and MSH — Marshall are the exclusive property of Provident — Marshall and MSH — Marshall and do not belong to the University. The University is not accountable for, and does not have ownership of, any of the financial and capital resources of Provident — Marshall and MSH — Marshall. The University does not have the power or authority to mortgage, pledge, or encumber the assets of Provident — Marshall and MSH — Marshall. Any income resulting from the operations of Provident — Marshall and MSH — Marshall is for the benefit of Provident — Marshall and MSH — Marshall, respectively, and is not distributed to the University.
Third parties dealing with the University, the Board, and the State (or any agency thereof) should not rely upon the financial statements of Provident — Marshall or MSH — Marshall for any purpose without consideration of all the foregoing conditions and limitations.
2. SUMMARY OF SIGNIFICANT ACCOUNTING POLICIES
The combined financial statements of the University have been prepared in accordance with accounting principles generally accepted in the United States of America as prescribed by GASB. The combined financial statement presentation required by GASB provides a comprehensive, entity-wide perspective of the University’s assets, liabilities, net assets, revenues, expenses, changes in net assets, and cash flows.
The University follows all GASB pronouncements, as well as Financial Accounting Standards Board (FASB) Statements and Interpretations, Accounting Principles Board Opinions, and Accounting Research Bulletins issued on or before November 30, 1989, and has elected not to apply the FASB Statements and Interpretations issued after November 30, 1989, to its combined financial statements.
Reporting Entity — The University is an operating unit of the West Virginia Higher Education Fund and represents separate funds of the State that are not included in the State’s general fund. The University is a separate entity that, along with all State institutions of higher education, the Commission (which includes West Virginia Network for Educational Telecomputing), and the West Virginia Council for Community and Technical College Education form the Higher Education Fund of the State. The Higher Education Fund is considered a component unit of the State, and its financial statements are discretely presented in the State’s comprehensive annual financial report.
The accompanying combined financial statements present all funds under the authority of the University, including Marshall University Research Corporation (MURC) and Southern West Virginia Brownfields Assistance Center, Inc. (the “Center”). The basic criteria for inclusion in the accompanying combined financial statements is the exercise of oversight responsibility derived from the University’s ability to significantly influence operations and accountability for fiscal matters of related entities. Related foundations and other affiliates of the University (see Notes 15, 16, and 17) are not part of the University reporting entity and are not included in the accompanying combined financial statements, since the University has no ability to designate management, cannot significantly influence operations of these entities, and is not accountable for the fiscal matters of these entities under GASB.
On May 25, 2006, the Center was incorporated to foster and promote the redevelopment of Brownfield sites, including providing assistance to eligible entities on state and federal Brownfield programs, securing state and federal funding for Brownfield redevelopment, and acquiring property eligible for state and federal Brownfield assistance as set forth in West Virginia State Code 18B-11-7. As of June 30, 2011 and 2010, the Center had limited financial activity, all of which is included in the accompanying combined financial statements.

- 29 -
The audited financial statements of the Foundation, Provident — Marshall, and MSH — Marshall are presented here as discrete component units with the University combined financial statements in accordance with GASB discretely presented component unit requirements. The Foundation is a separate, private, nonprofit organization; Provident — Marshall is a single-member, limited liability company; and MSH — Marshall is a single-member, limited liability company, and all report under FASB standards. As such, certain revenue recognition criteria and presentation features are different from GASB revenue recognition criteria and presentation features. No modifications have been made to the audited financial information as they are presented herein (see Notes 15, 16, 23, 24, and 25).
Financial Statement Presentation — GASB establishes standards for external financial reporting for public colleges and universities and requires that financial statements be presented on a basis to focus on the University as a whole. Net assets are classified into four categories according to external donor restrictions or availability of assets for satisfaction of University obligations. The University’s net assets are classified as follows:
Invested in Capital Assets, Net of Related Debt — This represents the University’s total investment in capital assets, net of depreciation and outstanding debt obligations related to those capital assets. To the extent that debt has been incurred but not yet expended for capital assets, such amounts are not included as a component of invested in capital assets, net of related debt.
Restricted Net Assets, Expendable — This includes resources for which the University is legally or contractually obligated to spend in accordance with restrictions imposed by external third parties.
The West Virginia Legislature, as a regulatory body outside the reporting entity, has restricted the use of certain funds by Article 10, Fees and Other Money Collected at State Institutions of Higher Education of the West Virginia State Code. House Bill No. 101 passed in March 2004 simplified the tuition and fees restrictions to auxiliaries and capital items. These activities are fundamental to the normal ongoing operations of the Fund. These restrictions are subject to change by future actions of the West Virginia Legislature.
Restricted Net Assets, Nonexpendable — This includes endowment and similar type funds in which donors or other outside sources have stipulated, as a condition of the gift instrument, that the principal is to be maintained inviolate and in perpetuity, and invested for the purpose of producing present and future income, which may either be expended or added to principal.
Unrestricted Net Assets — Unrestricted net assets represent resources derived from student tuition and fees, state appropriations, and sales and services of educational activities. These resources are used for transactions relating to the educational and general operations of the University and may be used at the discretion of the Board to meet current expenses for any purpose.
Basis of Accounting — For financial reporting purposes, the University is considered a special-purpose government engaged in only business-type activities. Accordingly, the University’s combined financial statements have been prepared on the accrual basis of accounting with a focus on the flow of economic resources measurement. Revenues are reported when earned and expenses are reported when materials or services are received. All intercompany accounts and transactions have been eliminated.
Cash and Cash Equivalents — For purposes of the combined statements of net assets, the University considers all highly liquid investments with an original maturity of three months or less to be cash equivalents.

- 30 -
Cash and cash equivalents balances on deposit with the State of West Virginia Treasurer’s Office (the “State Treasurer”) are pooled by the State Treasurer with other available funds of the State for investment purposes by the West Virginia Board of Treasury Investments (BTI). These funds are transferred to the BTI, and the BTI is directed by the State Treasurer to invest the funds in specific external investment pools in accordance with West Virginia Code, policies set by the BTI, provisions of bond indentures, and the trust agreements when applicable. Balances in the investment pools are recorded at fair value or amortized cost, which approximates fair value. Fair value is determined by a third-party pricing service based on asset portfolio pricing models and other sources in accordance with GASB. The BTI was established by the State Legislature and is subject to oversight by the State Legislature. Fair value and investment income are allocated to participants in the pools based upon the funds that have been invested. The amounts on deposit are available for immediate withdrawal or on the first day of each month for the WV Short Term Bond Pool and, accordingly, are presented as cash and cash equivalents in the accompanying financial statements.
The BTI maintains the Consolidated Fund investment fund, which consists of eight investment pools and participant-directed accounts, three of which the Commission may invest in. These pools have been structured as multi-participant variable net asset funds to reduce risk and offer investment liquidity diversification to the Fund participants. Funds not required to meet immediate disbursement needs are invested for longer periods. A more detailed discussion of the BTI’s investment operations pool can be found in its annual report. A copy of that annual report can be obtained from the following address: 1900 Kanawha Blvd. East, Room E-122, Charleston, WV 25305 or http://www.wvbti.com.
Investments — The University had investments in two long-term funds at June 30, 2011. One fund comprised high-quality bond investments, with the other comprising long-term equity investments. At June 30, 2010, the University did not have any investments as funds were withdrawn and the cash returned to the state investment pool in June 2010 in order to comply with the July 1, 2010, expiration of S.B. 603, Section 12-1-2b, the pilot program for investments. S.B. 330, Section 12-1-12d reinstated the authorization for investments. MURC held U.S. government agency securities and invested in an intermediate term fund comprised of high-quality fixed income securities at June 30, 2010 and 2011.
Investments, other than alternative investments, are presented at fair value based on quoted market prices. The alternative investments are carried at fair value. These valuations include assumptions and methods that were reviewed by University management and are primarily based on quoted market prices or other readily determinable market values for the underlying investments. The University believes that the carrying amount of its alternative investments is a reasonable estimate of fair value. Because a portion of alternative investments are not readily marketable and the estimated value is subject to uncertainty, the reported value may differ from the value that would have been used had a ready market existed.
Permissible investments for all agencies include those guaranteed by the United States, its agencies, and instrumentalities (U.S. government obligations); corporate debt obligations, including commercial paper, that meet certain ratings; certain money market funds; repurchase agreements; reverse repurchase agreements; asset-backed securities; certificates of deposit; state and local government securities; and other investments. Other investments consist primarily of investments in accordance with the Linked Deposit Program, a program using financial institutions in the State to obtain certificates of deposit, loans approved by the State legislature, and any other program investments authorized by the State legislature.

- 31 -
Allowance for Doubtful Accounts — It is the University’s policy to provide for future losses on uncollectible accounts, contracts, grants, and loans receivable based on an evaluation of the underlying account, contract, grant, and loan balances; the historical collectibility experienced by the University on such balances; and such other factors that, in the University’s judgment, require consideration in estimating doubtful accounts.
Inventories — Inventories are stated at the lower of cost or market, cost being determined on the first-in, first-out method.
Noncurrent Cash, Cash Equivalents, and Investments — Cash and investments that are (1) externally restricted to make debt service payments and long-term loans to students, or to maintain sinking or reserve funds, (2) to purchase capital or other noncurrent assets or settle long-term liabilities, or (3) permanently restricted net assets are classified as noncurrent assets in the accompanying combined statements of net assets.
Other Assets — Other assets consist primarily of debt issuance costs that have been incurred in connection with the issuance of the 2001 Housing and Parking Facilities Series A Bonds at June 30, 2010, and the University Refunding Revenue Bonds Series 2010 at June 30, 2011. These costs, consisting primarily of the underwriter’s discount and legal and consulting fees, are amortized over the term of the bonds.
Capital Assets — Capital assets include property, plant, and equipment; books and materials that are part of a catalogued library; and infrastructure assets. Capital assets are stated at cost at the date of acquisition or construction or at market value at the date of donation in the case of gifts. Depreciation is computed using the straight-line method over the estimated useful lives of the assets, generally 15 to 50 years for buildings and infrastructure, 15 years for land improvements, 7 years for library books, and 3 to 10 years for furniture and equipment. The University’s capitalization threshold is $100,000 for buildings and $5,000 for most other capital assets.
Deferred Revenue — Revenues for programs or activities to be conducted primarily in the next fiscal year are classified as deferred revenue, including items such as football ticket sales, tuition and fees, and room and board. Financial aid and other deposits are separately classified as deposits.
Compensated Absences and Other Post employment Benefits (OPEB) — The University accounts for compensated absences in accordance with the provisions of GASB.
GASB provides standards for the measurement, recognition, and display of OPEB expenditures, assets, and liabilities, including applicable note disclosures and required supplementary information. During fiscal year 2006, House Bill No. 4654 was established to create a trust fund for postemployment benefits for the State. The University is required to participate in this multiple-employer, cost-sharing plan, the West Virginia Retiree Health Benefit Trust Fund, sponsored by the State of West Virginia. Details regarding this plan can be obtained by contacting the West Virginia Public Employees Insurance Agency (PEIA), State Capitol Complex, Building 5, Room 1001, 1900 Kanawha Boulevard, East, Charleston, WV 25305-0710 or http://www.wvpeia.com.
GASB requires entities to accrue for employees’ rights to receive compensation for vacation leave or payments in lieu of accrued vacation or sick leave as such benefits are earned and payment becomes probable.

- 32 -
The University’s full-time employees earn up to two vacation leave days for each month of service and are entitled to compensation for accumulated, unpaid vacation leave upon termination. Full-time employees also earn 1 1/2 sick leave days for each month of service and are entitled to extend their health or life insurance coverage upon retirement in lieu of accumulated, unpaid sick leave. Generally, two days of accrued sick leave extend health insurance for one month of single coverage, and three days extend health insurance for one month of family coverage. For employees hired after 1988, or who were hired before 1988 but did not choose such coverage until after 1988 but before July 1, 2001, the employee shares in the cost of the extended benefit coverage to the extent of 50% of the premium required for the extended coverage. Employees hired July 1, 2001, or later will no longer receive sick leave credit toward insurance premiums when they retire. Additionally, all retirees have the option to purchase continued coverage regardless of their eligibility for premium credits. This liability is now provided for under the multiple-employer, cost-sharing plan sponsored by the State.
Certain faculty employees (generally those with less than a 12-month contract) earn a similar extended health or life insurance coverage retirement benefit based on years of service. Generally, 3 1/3 years of teaching service extend health insurance for one year of single coverage, and five years extend health insurance for one year of family coverage. Faculty hired after July 1, 2009, will no longer receive years of service credit toward insurance premiums when they retire. Employees hired after July 1, 2010, receive no health insurance premium subsidy from the University. Two groups of employees hired after July 1, 2010, will not be required to pay the unsubsidized rate: 1) active employees who were originally hired before July 1, 2010, who have a break in service of fewer than two years after July 1, 2010; and 2) retired employees who retired before July 1, 2010, return to active service after July 1, 2010, and then go back into retirement. In those cases, the original hire date will apply.
The estimated expense and expense incurred for the vacation leave or OPEB benefits are recorded as a component of benefits expense in the combined statements of revenues, expenses, and changes in net assets.
Risk Management — The State’s Board of Risk and Insurance Management (BRIM) provides general, property and casualty, and medical malpractice liability coverage to the University and its employees, including those physicians employed by the University and related to the University’s School of Medicine (SOM). Such coverage may be provided to the University by BRIM through self-insurance programs maintained by BRIM or policies underwritten by BRIM that may involve experience-related premiums or adjustments to BRIM.
BRIM engages an independent actuary to assist in the determination of its premiums so as to minimize the likelihood of premium adjustments to the University or other participants in BRIM’s insurance programs. As a result, management does not expect significant differences between the premiums the University is currently charged by BRIM and the ultimate cost of that insurance based on the University’s actual loss experience. In the event that such differences arise between estimated premiums currently charged by BRIM to the University and the University’s ultimate actual loss experience, the difference will be recorded as the change in estimate becomes known.
SOM established a $250,000 deductible program under the BRIM professional liability coverage effective July 1, 2005. Prior to this date, the SOM was totally covered by BRIM at a limit of $1,000,000 per occurrence. Starting July 1, 2005, the SOM assumed the risk and responsibility for any and all indemnity amounts up to $250,000 per occurrence and all loss expenses associated with medical malpractice claims and/or suits in exchange for a reduction in its premium for medical malpractice insurance.

- 33 -
Under the program, SOM entered into an agreement with BRIM whereby SOM initially deposited $500,000 in an escrow account with the State Treasury from which BRIM could withdraw amounts to pay indemnity costs and allocated expenses in connection with medical malpractice claims against the SOM. At June 30, 2011 and 2010, the balance in the escrow account was $2,056,550 and $1,538,157, respectively. Based on an actuarial valuation of this self-insurance program, the University has recorded a liability of $7,333,000 and $7,580,000 at June 30, 2011 and 2010, respectively, to reflect projected claim payments at 80% confidence level at June 30, 2011 and 2010. The receivable from University Physicians & Surgeons, Inc., for the funding it has agreed to provide for this liability was $5,276,450 and $6,041,843 at June 30, 2011 and 2010, respectively, and is included in noncurrent other accounts receivable (see Note 4).
In addition, through its participation in PEIA and a third-party insurer, the University has obtained for its employees health, life, and prescription drug coverage, and coverage for job-related injuries. In exchange for the payment of premiums to PEIA and the third-party insurer, the University has transferred its risks related to health, life, prescription drug, and job-related injuries coverage.
Classification of Revenues — The University has classified its revenues according to the following criteria:
Operating Revenues — Operating revenues include activities that have the characteristics of exchange transactions, such as (1) student tuition and fees, net of scholarship discounts and allowances, (2) sales and services of auxiliary enterprises, net of scholarship discounts and allowances, (3) most federal, state, local, and nongovernmental grants and contracts, and (4) sales and services of educational activities.
Nonoperating Revenues — Nonoperating revenues include activities that have the characteristics of nonexchange transactions, such as gifts and contributions, and other revenues that are defined as nonoperating revenues by GASB, such as state appropriations, Federal Pell Grants, and investment income.
Other Revenues — Other revenues consist primarily of capital grants and gifts.
Use of Restricted Net Assets — The University has not adopted a formal policy regarding whether to first apply restricted or unrestricted resources when an expense is incurred for purposes for which both restricted and unrestricted net assets are available. Generally, the University attempts to utilize restricted funds first when practicable.
Federal Financial Assistance Programs — The University makes loans to students under the Federal Direct Student Loan Program. Under this program, the U.S. Department of Education makes interest subsidized and nonsubsidized loans directly to students through institutions such as the University. Direct student loan receivables are not included in the University’s accompanying combined statements of net assets since the loans are repayable directly to the U.S. Department of Education. In 2011 and 2010, the University received and disbursed approximately $79,500,000 and $68,600,000, respectively, under the Federal Direct Student Loan Program on behalf of the U.S. Department of Education, which is not included as revenue and expense on the accompanying combined statements of revenues, expenses, and changes in net assets.
The University also distributes other student financial assistance funds on behalf of the federal government to students under the Federal Pell Grant, Supplemental Educational Opportunity Grant, and College Work Study programs. The activity of these programs is recorded in the accompanying combined financial statements. In 2011 and 2010, the University received and disbursed approximately $20,200,000 and $17,300,000, respectively, under these federal student aid programs.

- 34 -
Scholarship Allowances — Student tuition and fee revenues, and certain other revenues from students, are reported net of scholarship allowances in the accompanying combined statements of revenues, expenses, and changes in net assets. Scholarship allowances are the difference between the stated charge for goods and services provided by the University and the amount that is paid by students and/or third parties making payments on the students’ behalf.
Financial aid to students is reported in the combined financial statements under the alternative method as prescribed by the National Association of College and University Business Officers. Certain aid, such as loans, funds provided to students as awarded by third parties, and Federal Direct Lending is accounted for as a third-party payment (credited to the student’s account as if the student made the payment). All other aid is reflected in the accompanying combined financial statements as operating expenses, or scholarship allowances, which reduce revenues. The amount reported as operating expenses represents the portion of aid that was provided to the student in the form of cash. Scholarship allowances represent the portion of aid provided to the student in the form of reduced tuition. Under the alternative method, these amounts are computed on a university basis by allocating the cash payments to students, excluding payments for services, on the ratio of total aid to the aid not considered to be third-party aid.
Government Grants and Contracts — Government grants and contracts normally provide for the recovery of direct and indirect costs, subject to audit. The University recognizes revenue associated with direct costs as the related costs are incurred. Recovery of related indirect costs is generally recorded at fixed rates negotiated for a period of one to five years.
Income Taxes — The University is exempt from income taxes, except for unrelated business income, as a nonprofit organization under federal income tax laws and regulations of the Internal Revenue Service.
Cash Flows — Any cash and cash equivalents escrowed, restricted for noncurrent assets or in funded reserves have not been included as cash and cash equivalents for the purpose of the combined statements of cash flows.
Use of Estimates — The preparation of combined financial statements in conformity with accounting principles generally accepted in the United States of America requires management to make estimates and assumptions that affect the reported amounts of assets and liabilities and disclosure of contingent assets and liabilities at the date of the combined financial statements and the reported amounts of revenues and expenses during the reporting period. Actual results could differ from those estimates.
Risk and Uncertainties — Investments are exposed to various risks, such as interest rate, credit, and overall market volatility. Due to the level of risk associated with certain securities, it is reasonably possible that changes in risk and values will occur in the near term and that such changes could materially affect the amounts reported in the combined financial statements.
Newly Adopted Statements Issued by the Governmental Accounting Standards Board — During 2011, the University adopted Statement No. 54, Fund Balance Reporting and Governmental Fund Type Definitions. This statement establishes new categories for reporting fund balance and revised the definitions for governmental fund types. The adoption of this statement did not have a material impact on the financial statements.
The University also adopted GASB Statement No. 59, Financial Instruments Omnibus. This statement improves financial reporting by providing more complete information, by improving consistency of measurements, and by providing clarifications of existing standards related to certain financial instruments and external investment pools. The adoption of this statement did not have a material impact on the financial statements.

- 35 -
Recent Statements Issued by the Governmental Accounting Standards Board — The Governmental Accounting Standards Board has issued Statement No. 60, Accounting and Financial Reporting for Service Concession Arrangements, effective for fiscal years beginning after December 15, 2011. This statement addresses how to account for and report service concession arrangements (SCAs) by establishing recognition, measurement, and disclosure requirements for SCAs for both transferors and governmental operators. The University has not yet determined the effect that the adoption of GASB Statement No. 60 may have on its financial statements.
The Governmental Accounting Standards Board has also issued Statement No. 61, The Financial Reporting Entity: Omnibus — an amendment of GASB Statements No. 14 and No. 34, effective for fiscal years beginning after June 15, 2012. This statement improves financial reporting for a governmental financial reporting entity by improving guidance for including, presenting, and disclosing information about component units and equity interest transactions of the entity. The University has not yet determined the effect that the adoption of GASB Statement No. 61 may have on its financial statements.
The Governmental Accounting Standards Board has also issued Statement No. 62, Codification of Accounting and Financial Reporting Guidance Contained in Pre-November 30, 1989 FASB and AICPA Pronouncements, effective for fiscal years beginning after December 15, 2011. The objective of this statement is to incorporate into the GASB’s authoritative literature certain accounting and financial reporting guidance included in the FASB and AICPA pronouncements issued on or before November 30, 1989. This statement will improve financial reporting by contribution to the GASB’s efforts to codify all sources of generally accepted accounting principles for state and local governments so that they derive from a single source. The University has not yet determined the effect that the adoption of GASB Statement No. 62 may have on its financial statements.
The Governmental Accounting Standards Board has also issued Statement No. 63, Financial Reporting of Deferred Outflows of Resources, Deferred Inflows of Resources, and Net Position, effective for fiscal years beginning after December 15, 2011. The objective of this statement is to provide guidance for reporting deferred outflows of resources, deferred inflows of resources, and net position in the statement of financial position and related disclosures. The University has not yet determined the effect that the adoption of GASB Statement No. 63 may have on its financial statements.
The Governmental Accounting Standards Board has also issued Statement No. 64, Derivative Instruments: Application of Hedge Accounting Termination Provisions, effective for fiscal years beginning after June 15, 2011. The objective of this statement is to improve financial reporting by clarifying whether an effective hedging relationship continues after the replacement of a swap counterparty or a swap counterparty’s credit support provider. The University has not yet determined the effect that the adoption of GASB Statement No. 64 may have on its financial statements.

- 36 -
3. CASH AND CASH EQUIVALENTS
The composition of cash and cash equivalents was held as follows:
Current Noncurrent Total
State Treasurer 74,071,936$ 176,000$ 74,247,936$ Trustee 12,050 12,050 State Treasurer — escrow 2,056,550 2,056,550 Money markets 23,533,753 23,533,753 In bank 1,230,792 1,230,792 On hand 5,661 5,661
.98,854,192$ 2,232,550$ 101,086,742$
Current Noncurrent Total
State Treasurer 74,491,469$ 176,000$ 74,667,469$ Trustee 82,680 3,191,931 3,274,611 State Treasurer — escrow 1,538,157 1,538,157 Money markets 13,134,919 13,134,919 In bank 4,393,833 4,393,833 On hand 5,711 5,711
.92,108,612$ 4,906,088$ 97,014,700$
June 30, 2011
June 30, 2010
Cash held by the State Treasurer includes $1,819,294 and $2,089,265 at June 30, 2011 and 2010, respectively, of restricted cash for sponsored projects, loans, and other purposes.
Cash on deposit with Trustee represents funds reserved for refunding the University Facilities Revenue Bonds, Series 2001A and paying the costs of issuance that relate to the University Refunding Revenue Bonds, Series 2010 (see Note 9).
State Treasurer escrow represents an escrow agreement the University entered into with BRIM for malpractice insurance deductibles with a balance of $2,056,550 and $1,538,157 at June 30, 2011 and 2010, respectively.
MURC cash equivalents totaling $14,445,806 and $12,533,109 at June 30, 2011 and 2010, respectively, are held in repurchase agreements, and a business savings account collateralized at 112% and 113%, respectively. The collateral was held in the name of MURC.
The combined carrying amount of cash in bank at June 30, 2011 and 2010, was $1,230,792 and $4,393,833 as compared with the combined bank balance of $2,147,153 and $4,928,191, respectively. The difference is primarily caused by outstanding checks and items in transit. The bank balances were covered by federal depository insurance as noted below or were collateralized by securities held by the State’s agent. Regarding federal depository insurance, interest-bearing accounts are insured by the Federal Deposit Insurance Corporation (FDIC) up to $250,000. Non-interest bearing accounts are 100% insured through December 31, 2012.
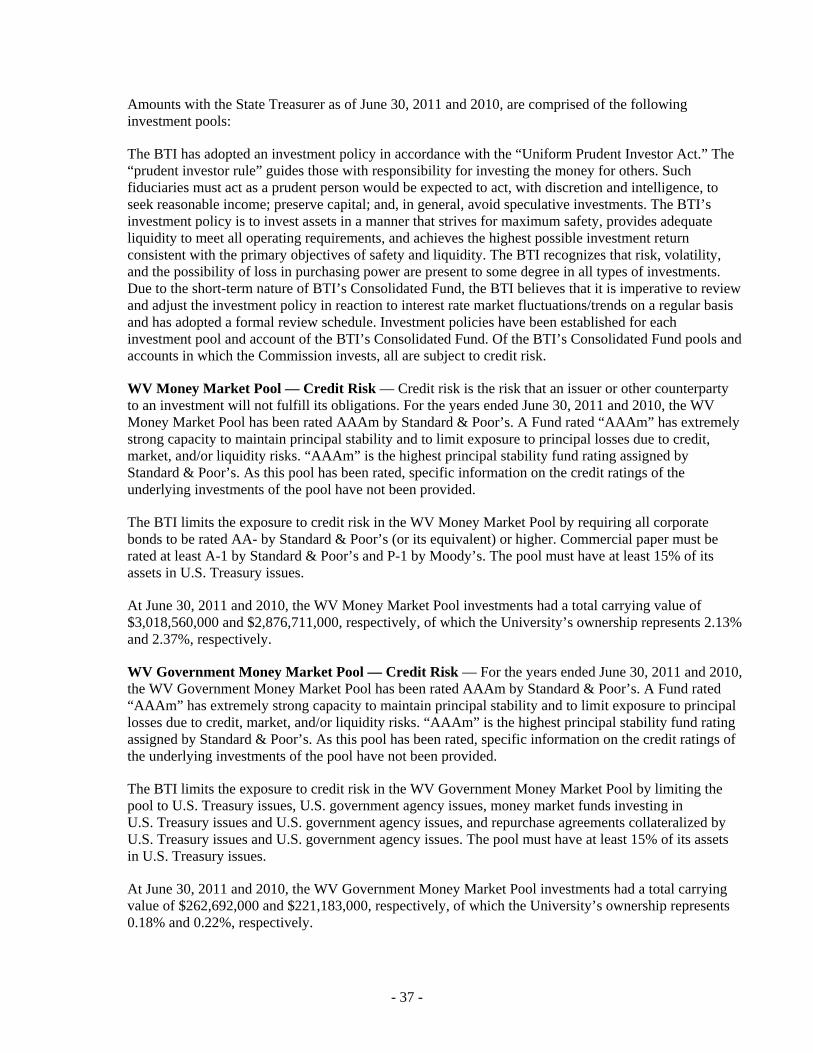
- 37 -
Amounts with the State Treasurer as of June 30, 2011 and 2010, are comprised of the following investment pools:
The BTI has adopted an investment policy in accordance with the “Uniform Prudent Investor Act.” The “prudent investor rule” guides those with responsibility for investing the money for others. Such fiduciaries must act as a prudent person would be expected to act, with discretion and intelligence, to seek reasonable income; preserve capital; and, in general, avoid speculative investments. The BTI’s investment policy is to invest assets in a manner that strives for maximum safety, provides adequate liquidity to meet all operating requirements, and achieves the highest possible investment return consistent with the primary objectives of safety and liquidity. The BTI recognizes that risk, volatility, and the possibility of loss in purchasing power are present to some degree in all types of investments. Due to the short-term nature of BTI’s Consolidated Fund, the BTI believes that it is imperative to review and adjust the investment policy in reaction to interest rate market fluctuations/trends on a regular basis and has adopted a formal review schedule. Investment policies have been established for each investment pool and account of the BTI’s Consolidated Fund. Of the BTI’s Consolidated Fund pools and accounts in which the Commission invests, all are subject to credit risk.
WV Money Market Pool — Credit Risk — Credit risk is the risk that an issuer or other counterparty to an investment will not fulfill its obligations. For the years ended June 30, 2011 and 2010, the WV Money Market Pool has been rated AAAm by Standard & Poor’s. A Fund rated “AAAm” has extremely strong capacity to maintain principal stability and to limit exposure to principal losses due to credit, market, and/or liquidity risks. “AAAm” is the highest principal stability fund rating assigned by Standard & Poor’s. As this pool has been rated, specific information on the credit ratings of the underlying investments of the pool have not been provided.
The BTI limits the exposure to credit risk in the WV Money Market Pool by requiring all corporate bonds to be rated AA- by Standard & Poor’s (or its equivalent) or higher. Commercial paper must be rated at least A-1 by Standard & Poor’s and P-1 by Moody’s. The pool must have at least 15% of its assets in U.S. Treasury issues.
At June 30, 2011 and 2010, the WV Money Market Pool investments had a total carrying value of $3,018,560,000 and $2,876,711,000, respectively, of which the University’s ownership represents 2.13% and 2.37%, respectively.
WV Government Money Market Pool — Credit Risk — For the years ended June 30, 2011 and 2010, the WV Government Money Market Pool has been rated AAAm by Standard & Poor’s. A Fund rated “AAAm” has extremely strong capacity to maintain principal stability and to limit exposure to principal losses due to credit, market, and/or liquidity risks. “AAAm” is the highest principal stability fund rating assigned by Standard & Poor’s. As this pool has been rated, specific information on the credit ratings of the underlying investments of the pool have not been provided.
The BTI limits the exposure to credit risk in the WV Government Money Market Pool by limiting the pool to U.S. Treasury issues, U.S. government agency issues, money market funds investing in U.S. Treasury issues and U.S. government agency issues, and repurchase agreements collateralized by U.S. Treasury issues and U.S. government agency issues. The pool must have at least 15% of its assets in U.S. Treasury issues.
At June 30, 2011 and 2010, the WV Government Money Market Pool investments had a total carrying value of $262,692,000 and $221,183,000, respectively, of which the University’s ownership represents 0.18% and 0.22%, respectively.

- 38 -
WV Short Term Bond Pool:
Credit Risk — The BTI limits the exposure to credit risk in the WV Short Term Bond Pool by requiring all corporate bonds to be rated A by Standards & Poor’s (or its equivalent) or higher. Commercial paper must be rated at least A-1 by Standards & Poor’s and P-1 by Moody’s. As this pool has not been rated, the following table provides information on the credit ratings of the WV Short Term Bond Pool’s investments (in thousands):
Carrying Percent of Carrying Percent ofSecurity Type Moody’s S&P Value Pool Assets Value Pool Assets
Corporate asset backed securities Aaa AAA 87,197$ 18.40 % 24,330$ 5.37 % Aaa NR * 19,891 4.20 10,353 2.28 Aa3 AAA 1,000 0.22 Aa3 AA+ ** 454 0.10 Ba1 CC ** 45 0.01 Ba2 BB ** 219 0.05 B1 BBB ** 605 0.13 B1 CCC ** 885 0.19 857 0.19 B2 CCC ** 366 0.08 B3 B ** 366 0.08 442 0.10 B3 BBB ** 631 0.13 247 0.05 B3 CCC ** 554 0.12 Ca CCC ** 664 0.14
Caal CCC ** 230 0.05 Caa2 CCC ** 473 0.10 779 0.17 Caa3 CCC ** 393 0.08 Caa3 D ** 27 0.01 NR * AAA 3,538 0.78 NR * NR * 4,000 0.84
114,981 24.27 43,565 9.60
Corporate bonds and notes Aaa AAA 72,549 16.00 Aaa AA 2,043 0.43 2,060 0.46 Aa1 AA 5,430 1.20 Aa1 A 4,143 0.87 Aa2 AAAAa2 AA 11,866 2.50 6,650 1.47 Aa3 AA 7,064 1.49 6,722 1.48 Aa3 A 13,040 2.75 13,850 3.05 A1 AA 8,107 1.71 15,485 3.41 A1 A 22,731 4.80 21,098 4.65 A2 AA 2,555 0.54 A2 A 23,976 5.06 41,093 9.06 A3 A 8,770 1.85 4,158 0.92
104,295 22.00 189,095 41.70
Commercial paper P-1 A-1 15,995 3.38 U.S. agency bonds Aaa AAA 20,017 4.22 40,180 8.86 U.S. Treasury notes*** Aaa AAA 25,034 5.28 158,423 34.93 U.S. agency mortgage backed securities**** Aaa AAA 97,296 20.53 4,540 1.00 Money market funds Aaa AAAm 96,287 20.32 Money market funds Aaa AAA 17,715 3.91
473,905$ 100 % 453,518$ 100 %
20102011Credit Rating*
* NR = Not Rated
** The securities were not in compliance with BTI Investment Policy at June 30, 2011 and/or 2010. The securities were in compliance when originally acquired, but were subsequently downgraded. BTI management and its investment advisors have determined that it is in the best interests of the participants to hold the securities for optimal outcome.
*** U.S. Treasury issues are explicitly guaranteed by the United States government and are not subject to credit risk.
**** U.S. agency mortgage backed securities are explicitly guaranteed by the United States government and are not subject to credit risk.
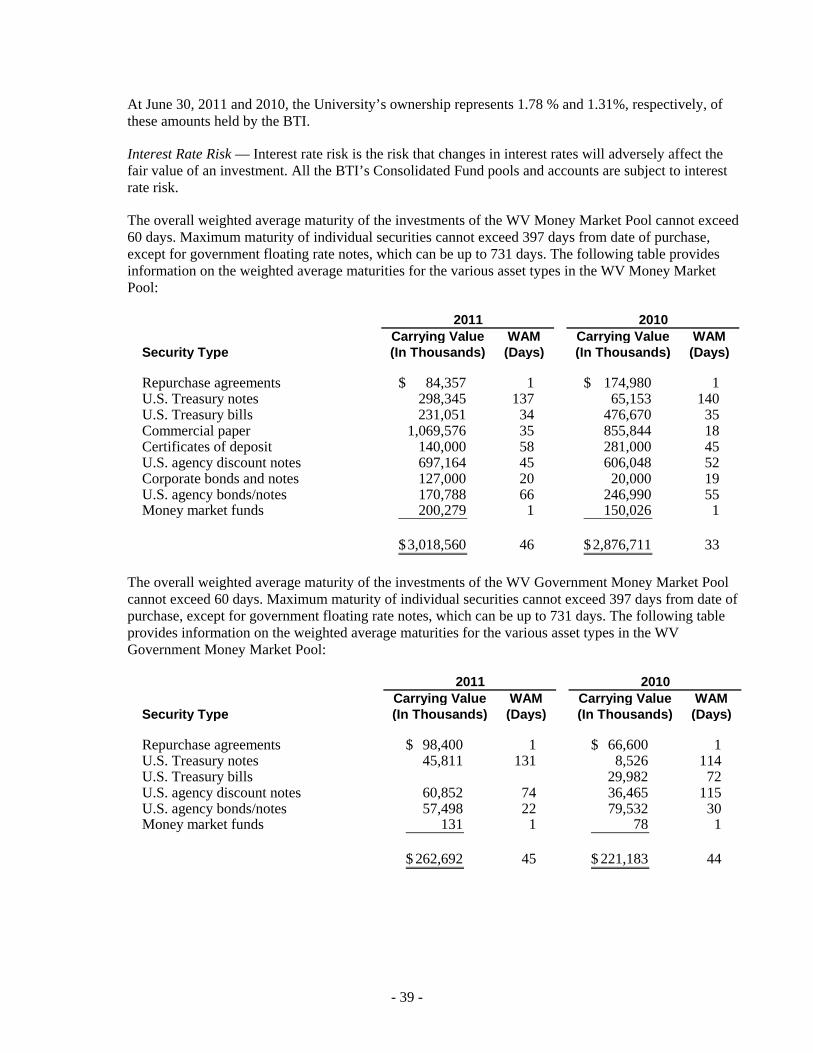
- 39 -
At June 30, 2011 and 2010, the University’s ownership represents 1.78 % and 1.31%, respectively, of these amounts held by the BTI.
Interest Rate Risk — Interest rate risk is the risk that changes in interest rates will adversely affect the fair value of an investment. All the BTI’s Consolidated Fund pools and accounts are subject to interest rate risk.
The overall weighted average maturity of the investments of the WV Money Market Pool cannot exceed 60 days. Maximum maturity of individual securities cannot exceed 397 days from date of purchase, except for government floating rate notes, which can be up to 731 days. The following table provides information on the weighted average maturities for the various asset types in the WV Money Market Pool:
Carrying Value WAM Carrying Value WAMSecurity Type (In Thousands) (Days) (In Thousands) (Days)
Repurchase agreements 84,357$ 1 174,980$ 1 U.S. Treasury notes 298,345 137 65,153 140 U.S. Treasury bills 231,051 34 476,670 35 Commercial paper 1,069,576 35 855,844 18 Certificates of deposit 140,000 58 281,000 45 U.S. agency discount notes 697,164 45 606,048 52 Corporate bonds and notes 127,000 20 20,000 19 U.S. agency bonds/notes 170,788 66 246,990 55 Money market funds 200,279 1 150,026 1
3,018,560$ 46 2,876,711$ 33
2011 2010
The overall weighted average maturity of the investments of the WV Government Money Market Pool cannot exceed 60 days. Maximum maturity of individual securities cannot exceed 397 days from date of purchase, except for government floating rate notes, which can be up to 731 days. The following table provides information on the weighted average maturities for the various asset types in the WV Government Money Market Pool:
Carrying Value WAM Carrying Value WAMSecurity Type (In Thousands) (Days) (In Thousands) (Days)
Repurchase agreements 98,400$ 1 66,600$ 1 U.S. Treasury notes 45,811 131 8,526 114 U.S. Treasury bills 29,982 72 U.S. agency discount notes 60,852 74 36,465 115 U.S. agency bonds/notes 57,498 22 79,532 30 Money market funds 131 1 78 1
262,692$ 45 221,183$ 44
2011 2010

- 40 -
The overall effective duration of the investments of the WV Short Term Bond Pool cannot exceed 731 days. Maximum effective duration of individual securities cannot exceed 1,827 days (five years) from date of purchase. The following table provides information on the effective duration for the various asset types in the WV Short Term Bond Pool:
Effective EffectiveValue Duration Value Duration
Security Type (Days) (Days)
U. S. Treasury bonds/notes 25,034$ 227 158,423$ 583 Commercial paper 15,995 55 Corporate notes 104,295 234 189,095 560 Corporate asset backed securities 114,981 268 43,565 679 U.S. agency bonds/notes 20,017 85 40,180 288 U.S. agency mortgage backed securities 97,296 18 4,540 360 Money market funds 96,287 1 17,715 1
473,905$ 138 453,518$ 530
Carrying
(In Thousands)
2011 2010Carrying
(In Thousands)
Other Investment Risks — Other investment risks include concentration of credit risk, custodial credit risk, and foreign currency risk. None of the BTI’s Consolidated Fund’s investment pools or accounts is exposed to these risks as described below.
Concentration of credit risk is the risk of loss attributed to the magnitude of the BTI’s Consolidated Fund pool or account’s investment in a single corporate issuer. The BTI investment policy prohibits those pools and accounts permitted to hold corporate securities from investing more than 5% of their assets in any one corporate name or one corporate issue.
The custodial credit risk for investments is the risk that, in the event of the failure of the counterparty to a transaction, the BTI will not be able to recover the value of investment or collateral securities that are in the possession of an outside party. Repurchase agreements are required to be collateralized by at least 102% of their value, and the collateral is held in the name of the BTI. Securities lending collateral that is reported on the BTI’s statement of fiduciary net assets is invested in a pool managed by the securities lending agent. In all transactions, the BTI or its agent does not release cash or securities until the counterparty delivers its side of the transaction.
Foreign currency risk is the risk that changes in exchange rates will adversely affect the fair value of an investment or a deposit. None of the BTI’s Consolidated Fund’s investment pools or accounts holds interests in foreign currency or interests valued in foreign currency.
Deposits — Custodial credit risk of deposits is the risk that in the event of failure of a depository financial institution, a government will not be able to recover deposits or will not be able to recover collateral securities that are in the possession of an outside party. Deposits include nonnegotiable certificates of deposit. None of the above pools contain nonnegotiable certificates of deposit. The BTI does not have a deposit policy for custodial credit risk.
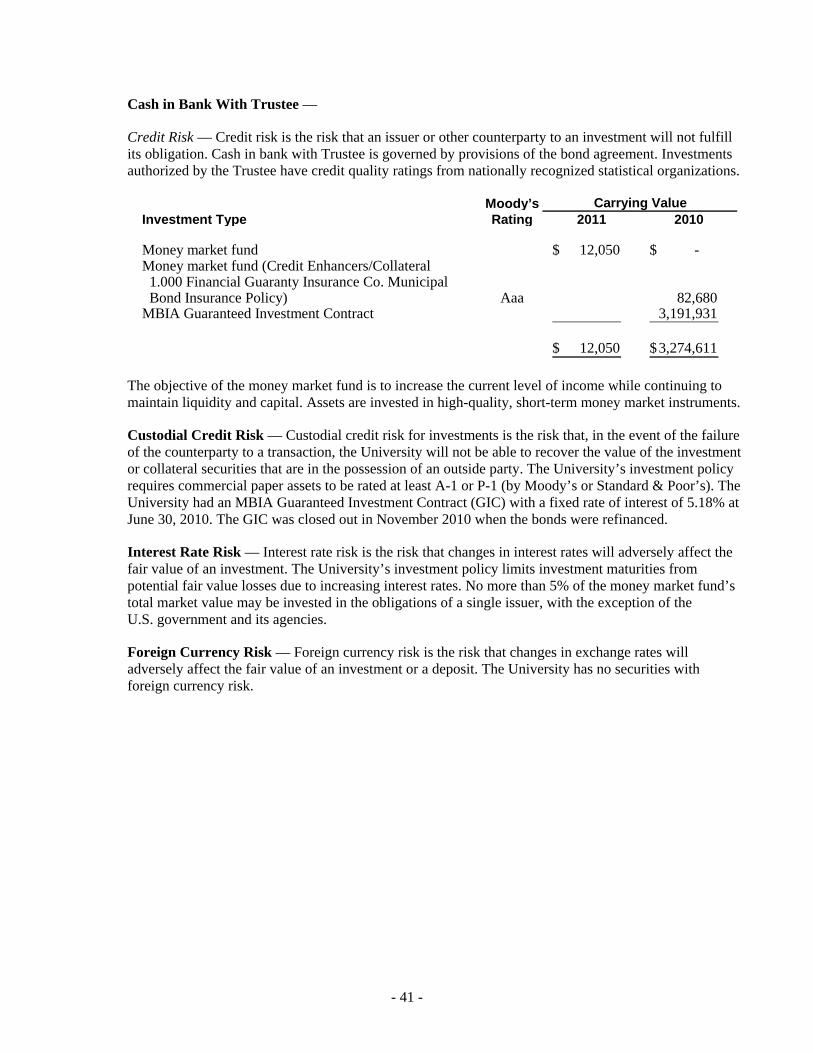
- 41 -
Cash in Bank With Trustee —
Credit Risk — Credit risk is the risk that an issuer or other counterparty to an investment will not fulfill its obligation. Cash in bank with Trustee is governed by provisions of the bond agreement. Investments authorized by the Trustee have credit quality ratings from nationally recognized statistical organizations.
Moody’sInvestment Type Rating 2011 2010
Money market fund 12,050$ - $ Money market fund (Credit Enhancers/Collateral 1.000 Financial Guaranty Insurance Co. Municipal Bond Insurance Policy) Aaa 82,680 MBIA Guaranteed Investment Contract 3,191,931
12,050$ 3,274,611$
Carrying Value
The objective of the money market fund is to increase the current level of income while continuing to maintain liquidity and capital. Assets are invested in high-quality, short-term money market instruments.
Custodial Credit Risk — Custodial credit risk for investments is the risk that, in the event of the failure of the counterparty to a transaction, the University will not be able to recover the value of the investment or collateral securities that are in the possession of an outside party. The University’s investment policy requires commercial paper assets to be rated at least A-1 or P-1 (by Moody’s or Standard & Poor’s). The University had an MBIA Guaranteed Investment Contract (GIC) with a fixed rate of interest of 5.18% at June 30, 2010. The GIC was closed out in November 2010 when the bonds were refinanced.
Interest Rate Risk — Interest rate risk is the risk that changes in interest rates will adversely affect the fair value of an investment. The University’s investment policy limits investment maturities from potential fair value losses due to increasing interest rates. No more than 5% of the money market fund’s total market value may be invested in the obligations of a single issuer, with the exception of the U.S. government and its agencies.
Foreign Currency Risk — Foreign currency risk is the risk that changes in exchange rates will adversely affect the fair value of an investment or a deposit. The University has no securities with foreign currency risk.

- 42 -
4. ACCOUNTS RECEIVABLE
Accounts receivable as of June 30, 2011 and 2010, are as follows:
Current Noncurrent Total
Student tuition and fees — net of allowance for doubtful accounts of $365,117 585,470$ - $ 585,470$ Grants and contracts receivable — net of allowance for doubtful accounts of $392,105 13,040,501 13,040,501 Due from the Commission 484,227 484,227 Due from other State agencies 2,440,756 2,440,756 Appropriations due from Primary Government 2,602,780 2,602,780 Other accounts receivable 551,844 5,293,714 5,845,558
19,705,578$ 5,293,714$ 24,999,292$
Current Noncurrent Total
Student tuition and fees — net of allowance for doubtful accounts of $297,453 769,797$ - $ 769,797$ Grants and contracts receivable — net of allowance for doubtful accounts of $412,458 13,165,052 13,165,052 Due from the Commission 216,252 216,252 Due from other State agencies 2,715,836 2,715,836 Other accounts receivable 436,768 6,098,384 6,535,152
17,303,705$ 6,098,384$ 23,402,089$
2011
2010

- 43 -
5. INVESTMENTS
The University had the following investments as of June 30, 2011 and 2010, as follows:
Investment Type Level 1 Level 2 Level 3 Fair Value
University:
Commonfund — High Quality
Bond Fund - $ 8,117,041$ 174,922$ 8,291,963$ Commonfund — Equity Index Fund 2,066,196 2,066,196
MURC: Commonfund — Intermediate Term Fund 2,138,437 7,888 2,146,325 U.S. Government National Mortgage Association Securities 13,463,877 13,463,877
- $ 25,785,551$ 182,810$ 25,968,361$
Investment Type Level 1 Level 2 Level 3 Fair Value
MURC: Commonfund — Intermediate - $ 2,057,411$ 9,441$ 2,066,852$ Term Fund U.S. Government National Mortgage Association Securities 3,042,689 3,042,689
- $ 5,100,100$ 9,441$ 5,109,541$
2011
2010
Investments have been reported at fair value and categorized as Level 1, 2, or 3. Level 1 represents investments that have a quoted price in the active market. Level 2 represents investments with direct or indirect observable market inputs. Level 3 represents investments with no observable market.
Credit Risk — MURC’s investment policy limits individual investments to U.S. government agency securities and nationally recognized bond funds holding those securities. The U.S. Government National Mortgage Association Securities held by MURC have an average maturity of 2.5 years and two years respectively, for fiscal year 2011 and 2010. The Intermediate Term Fund had an average maturity of 1.6 years and 1.5 years, respectively, for fiscal year 2011 and 2010. At both June 30, 2011 and 2010, MURC’s investment in U.S. Government National Mortgage Association Securities were rated AAA as government backed securities and the average rating of the Intermediate Term Fund was AA at both June 30, 2011 and 2010.
The University’s investment policy adheres to fiduciary responsibilities in accordance with the provisions of the Uniform Prudent Investor Act (WV State Code §44-6C-1 Prudent Investor Rule). Oversight will occur with care, skill, prudence, and diligence.

- 44 -
Concentration of Credit Risk — To minimize risk, MURC’s investment policy allows for no more than 60% of available assets to be invested with any one issuer, except U.S. government securities.
The University’s investment policy states that investments of a single issuer, with the exception of the U.S. government and its agencies (including GNMA, FNMA, and FHLMC), may not exceed 5% of the total market value of any fund. No more than 25% of the fixed income portfolio may be rated below investment grade.
Interest Rate Risk — Interest rate risk is the risk that changes in interest rates will adversely affect the fair value of an investment. Interest rate risk is managed by limiting the time period or duration of the specific investment.
Foreign Currency Risk — The University has no investments with foreign currency risk.
6. CAPITAL ASSETS
Capital asset transactions for the University for the years ended June 30, 2011 and 2010, are as follows:
Beginning EndingBalance Additions Reductions Other Balance
Capital assets not being depreciated: Land 30,444,262$ 173,136$ - $ - $ 30,617,398$ Antiques and artwork (inexhaustible) 132,107 132,107 Construction in progress 1,635,801 14,778,621 (10,523) (5,837,029) 10,566,870
Total capital assets not being depreciated 32,212,170$ 14,951,757$ (10,523)$ (5,837,029)$ 41,316,375$
Other capital assets: Land improvements 6,658,924$ - $ - $ - $ 6,658,924$ Infrastructure 24,733,392 267,555 (34,494) 155,958 25,122,411 Buildings 354,175,574 5,681,071 359,856,645 Equipment 66,159,123 6,627,176 (6,195,004) 66,591,295 Library books 8,456,133 123,354 (79,974) 8,499,513
Total other capital assets 460,183,146 7,018,085 (6,309,472) 5,837,029 466,728,788
Less accumulated depreciation for: Land improvements 1,643,222 443,928 2,087,150 Infrastructure 15,607,199 1,039,313 (34,494) 16,612,018 Buildings 100,198,033 6,968,049 107,166,082 Equipment 48,407,585 4,230,409 (5,799,696) 46,838,298 Library books 7,935,740 167,017 (79,974) 8,022,783
Total accumulated depreciation 173,791,779 12,848,716 (5,914,164) - 180,726,331
Other capital assets — net 286,391,367$ (5,830,631)$ (395,308)$ 5,837,029$ 286,002,457$
Capital asset summary: Capital assets not being depreciated 32,212,170$ 14,951,757$ (10,523)$ (5,837,029)$ 41,316,375$ Capital assets 460,183,146 7,018,085 (6,309,472) 5,837,029 466,728,788
Total cost of capital assets 492,395,316 21,969,842 (6,319,995) - 508,045,163
Less accumulated depreciation (173,791,779) (12,848,716) 5,914,164 (180,726,331)
Capital assets — net 318,603,537$ 9,121,126$ (405,831)$ - $ 327,318,832$
2011

- 45 -
Beginning EndingBalance Additions Reductions Other Balance
Capital assets not being depreciated: Land 30,982,236$ 172,936$ (710,910)$ - $ 30,444,262$ Antiques and artwork (inexhaustible) 132,107 132,107 Construction in progress 6,378,758 4,955,970 (9,698,927) 1,635,801
Total capital assets not being depreciated 37,493,101$ 5,128,906$ (710,910)$ (9,698,927)$ 32,212,170$
Other capital assets: Land improvements 6,174,781$ - $ - $ 484,143$ 6,658,924$ Infrastructure 23,999,738 731,708 (22,693) 24,639 24,733,392 Buildings 345,083,408 93,120 (191,099) 9,190,145 354,175,574 Equipment 66,125,834 4,293,385 (4,260,096) 66,159,123 Library books 8,367,474 149,404 (60,745) 8,456,133
Total other capital assets 449,751,235 5,267,617 (4,534,633) 9,698,927 460,183,146
Less accumulated depreciation for: Land improvements 1,199,294 443,928 1,643,222 Infrastructure 14,599,457 1,030,435 (22,693) 15,607,199 Buildings 93,518,646 6,870,486 (191,099) 100,198,033 Equipment 47,138,322 4,855,836 (3,586,573) 48,407,585 Library books 7,814,475 182,010 (60,745) 7,935,740
Total accumulated depreciation 164,270,194 13,382,695 (3,861,110) - 173,791,779
Other capital assets — net 285,481,041$ (8,115,078)$ (673,523)$ 9,698,927$ 286,391,367$
Capital asset summary: Capital assets not being depreciated 37,493,101$ 5,128,906$ (710,910)$ (9,698,927)$ 32,212,170$ Capital assets 449,751,235 5,267,617 (4,534,633) 9,698,927 460,183,146
Total cost of capital assets 487,244,336 10,396,523 (5,245,543) - 492,395,316
Less accumulated depreciation (164,270,194) (13,382,695) 3,861,110 (173,791,779)
Capital assets — net 322,974,142$ (2,986,172)$ (1,384,433)$ - $ 318,603,537$
2010
The University maintains certain collections of inexhaustible assets for which no value can be practically determined. Accordingly, such collections are not capitalized or recognized for financial statement purposes. Such collections include contributed works of art, historical treasures, and literature that are held for exhibition, education, research, and public service. These collections are neither disposed of for financial gain nor encumbered in any means.
The University has been approved to receive $17,600,000 of Education, Arts, Science, and Tourism (EAST) bond proceeds issued by the West Virginia Development Office during August 2010. As of June 30, 2011, $3,992,342 of such proceeds have been received. The West Virginia Development Office is responsible for repayment of the debt.
At June 30, 2011, the University had outstanding contractual commitments of approximately $11,900,000 for property, plant, and equipment expenditures.

- 46 -
7. LONG-TERM LIABILITIES
Long-term obligation transactions for the University for the year ended June 30, 2011 and 2010, are as follows:
Beginning Ending CurrentBalance Additions Reductions Balance Portion
Notes, bonds, and capital leases: Notes payable 2,780,914$ - $ (119,565)$ 2,661,349$ 121,953$ Revenue bonds payable 40,690,000 38,875,128 (40,753,419) 38,811,709 915,000 Capital leases payable 8,919,407 (918,464) 8,000,943 900,000
Total notes, bonds, and capital leases 52,390,321 38,875,128 (41,791,448) 49,474,001
Other long-term liabilities: Debt obligation to the Commission 24,542,639 (3,160,103) 21,382,536 3,309,689 Due to MCTC 2,930,334 (437,500) 2,492,834 350,000 OPEB liability 15,438,783 11,663,719 27,102,502 Other noncurrent liabilities 8,574,101 1,737,265 (2,133,380) 8,177,986 Advances from federal sponsors 6,418,460 (8,594) 6,409,866
Total other long-term liabilities 57,904,317 13,400,984 (5,739,577) 65,565,724
110,294,638$ 52,276,112$ (47,531,025)$ 115,039,725$
2011
Beginning Ending CurrentBalance Additions Reductions Balance Portion
Notes, bonds, and capital leases: Notes payable 2,940,926$ - $ (160,012)$ 2,780,914$ 119,565$ Revenue bonds payable — including debt service reserve funds of $3,191,931 41,775,000 (1,085,000) 40,690,000 1,135,000 Capital leases payable 9,862,078 (942,671) 8,919,407 918,595
Total notes, bonds, and capital leases 54,578,004 - (2,187,683) 52,390,321
Other long-term liabilities: Debt obligation to the Commission 27,567,118 (3,024,479) 24,542,639 3,160,103 Due to MCTC 3,500,000 (569,666) 2,930,334 437,500 OPEB liability 2,988,774 12,450,009 15,438,783 Other noncurrent liabilities 6,805,898 2,775,065 (1,006,862) 8,574,101 Advances from federal sponsors 6,510,861 60,000 (152,401) 6,418,460
Total other long-term liabilities 47,372,651 15,285,074 (4,753,408) 57,904,317
101,950,655$ 15,285,074$ (6,941,091)$ 110,294,638$
2010
8. NOTES PAYABLE
MURC borrowed the proceeds of a bond issuance by the Cabell County Commission for the construction of an addition to the Marshall University Forensic Science Center. MURC’s repayment terms are the same as the bond repayment term. MURC is obligated to make interest payments which commenced on October 10, 2008, for the interest due on the loan semi-annually and to make annual principal payments starting on April 1, 2009, based on a hypothetical amortization of the then-remaining principal balance at the then-applicable interest rate for the then-remaining years of the original 20-year amortization period ending April 10, 2028. However, any unspent mortgage proceeds would go to pay the first amounts due for interest and principal. Any remaining principal balance shall be payable in full

- 47 -
on April 10, 2028. The interest rate on the bonds was 3.2% at April 10, 2008, and will continue to and include year five, and will change for each subsequent five-year period to the rate per annum equal to 67% of the five-year Treasury Constant Maturity in effect on that date, plus 1.67% per annum.
At June 30, 2011, the scheduled maturities on notes payable are as follows:
Years EndingJune 30 Principal Interest
2012 121,953$ 85,109$ 2013 124,101 81,261 2014 128,072 77,289 2015 132,170 73,191 2016 136,400 68,962 2017–2021 750,332 276,475 2022–2026 878,318 148,489 2027–2028 390,003 18,788
2,661,349$ 829,564$
9. BONDS
Bonds payable at June 30, 2011 and 2010, consist of the following:
OriginalInterest Annual Principal
Rate Installment Due 2011 2010
University Refunding Revenue Bonds 2.0%–5.0% $915,000–$2,885,000 37,140,000$ - $ University Facilities Revenue Bonds 3.6%–5.3% $1,135,000–$3,035,000 40,690,000
37,140,000 40,690,000 Add Bond Premium 1,671,709
Total 38,811,709$ 40,690,000$
Principal Amount Outstanding
In June 2001, the Board sold $46,610,000 of Revenue Bonds, 2001 Housing and Parking Facilities Series A (the “2001 Bonds”). The 2001 Bonds were issued under the authority contained in Chapter 18, Article 23 of the Code of West Virginia, 1931, as amended, and the 2001 Bonds are secured pursuant to a Trust Indenture (the “Indenture”) dated as of June 1, 2001, by and between the Interim Governing Board and Bank One, West Virginia, National Association, Charleston, West Virginia (the “Trustee”). The 2001 Bonds were secured by and payable from the revenues of the dormitories and parking facilities and certain funds held under the Indenture. The proceeds of the 2001 Bonds were used (1) to finance a portion of the costs of acquisition, construction, and equipping of a student housing complex and parking facilities at the University and renovations and improvements to existing dormitories at the University, (2) to fund capitalized interest on the 2010 Bonds, (3) to fund debt service reserves for the 2010 Bonds, and (4) to pay a portion of the costs of issuance of the 2010 Bonds.
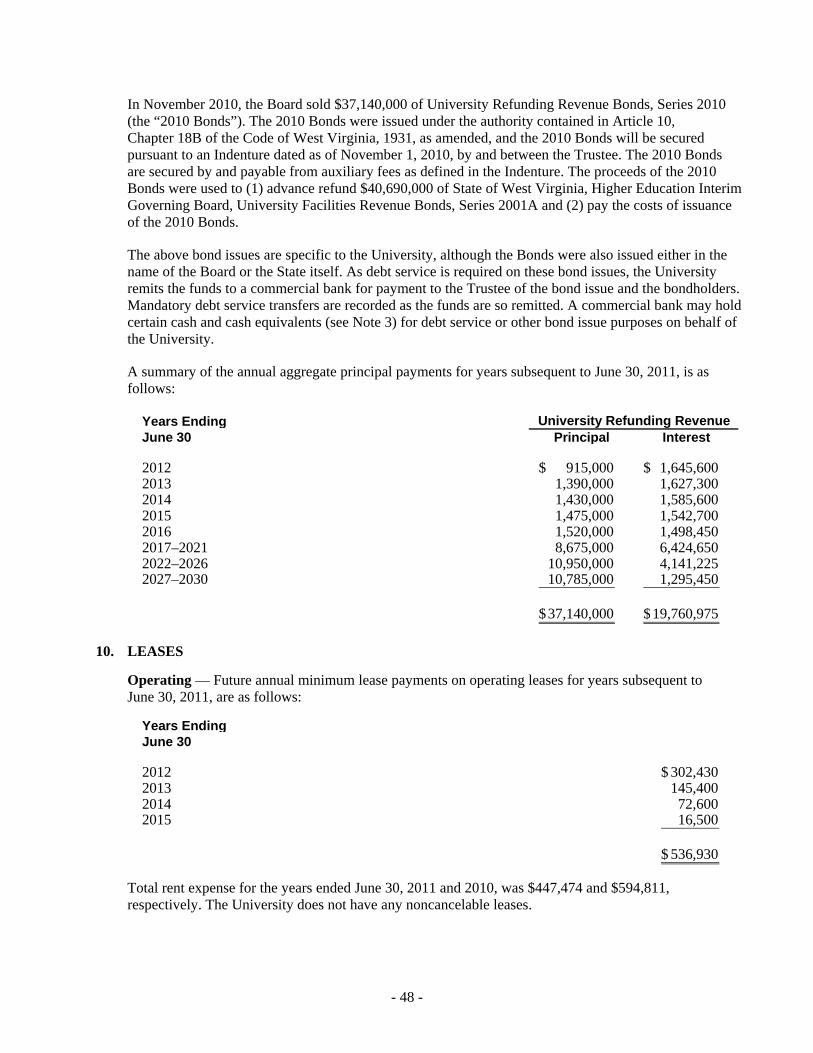
- 48 -
In November 2010, the Board sold $37,140,000 of University Refunding Revenue Bonds, Series 2010 (the “2010 Bonds”). The 2010 Bonds were issued under the authority contained in Article 10, Chapter 18B of the Code of West Virginia, 1931, as amended, and the 2010 Bonds will be secured pursuant to an Indenture dated as of November 1, 2010, by and between the Trustee. The 2010 Bonds are secured by and payable from auxiliary fees as defined in the Indenture. The proceeds of the 2010 Bonds were used to (1) advance refund $40,690,000 of State of West Virginia, Higher Education Interim Governing Board, University Facilities Revenue Bonds, Series 2001A and (2) pay the costs of issuance of the 2010 Bonds.
The above bond issues are specific to the University, although the Bonds were also issued either in the name of the Board or the State itself. As debt service is required on these bond issues, the University remits the funds to a commercial bank for payment to the Trustee of the bond issue and the bondholders. Mandatory debt service transfers are recorded as the funds are so remitted. A commercial bank may hold certain cash and cash equivalents (see Note 3) for debt service or other bond issue purposes on behalf of the University.
A summary of the annual aggregate principal payments for years subsequent to June 30, 2011, is as follows:
Years EndingJune 30 Principal Interest
2012 915,000$ 1,645,600$ 2013 1,390,000 1,627,300 2014 1,430,000 1,585,600 2015 1,475,000 1,542,700 2016 1,520,000 1,498,450 2017–2021 8,675,000 6,424,650 2022–2026 10,950,000 4,141,225 2027–2030 10,785,000 1,295,450
37,140,000$ 19,760,975$
University Refunding Revenue
10. LEASES
Operating — Future annual minimum lease payments on operating leases for years subsequent to June 30, 2011, are as follows:
Years EndingJune 30
2012 302,430$2013 145,400 2014 72,600 2015 16,500
536,930$
Total rent expense for the years ended June 30, 2011 and 2010, was $447,474 and $594,811, respectively. The University does not have any noncancelable leases.

- 49 -
Capital — The University leases various equipment and buildings through capital leases. At June 30, 2011 and 2010, leased equipment with a net book value of $618,733 and $830,609 and leased buildings with a net book value of $10,493,242 and $10,769,107, respectively, are included in equipment and buildings.
In December 1996, the University entered into a lease agreement with the Marshall University Graduate College (MUGC) Foundation for an academic center to be used by the MUGC. The construction of the academic center was financed by the MUGC Foundation through the issuance of governmental revenue bonds. Effective September 1, 1997, the MUGC Foundation leased the academic center to the University for 20 years. Upon expiration of the lease term, the University will have the right to purchase the academic center for a sum equal to the amount required to redeem or otherwise satisfy or defease the MUGC Foundation’s bonds on the date of such purchase. During the year ended June 30, 2008, all assets and liabilities of the MUGC Foundation became part of the Foundation. This lease agreement is now with the Foundation.
The University has a capital lease agreement with the Foundation for the Marshall University Graduate College’s administration facility (the “Facility”). The fair value of the Facility was estimated by an independent appraisal during the year ended June 30, 1995, at $5,000,000 (building: $4,300,000, land: $700,000), and the 21-year lease term commenced with the Marshall University Graduate College’s occupancy of the Facility in June 1995. Ownership of the Facility transfers to the University at the end of the lease term.
In December 1998, the University entered into a lease-purchase agreement with the Mason County Building Commission for the Mid-Ohio Valley Center (MOVC). The construction of MOVC was financed by the Mason County Building Commission through the issuance of revenue bonds and was completed in January 2000. This lease was terminated and replaced with a new lease-purchase agreement in December 2005, with the new lease including an addition to be constructed at MOVC with funds from new bonds issued by the Mason County Building Commission. Ownership of MOVC transfers to the University at the end of the lease term.
Also in December 1998, the University entered into a sublease with Pleasant Valley Hospital for partial ownership of MOVC. This sublease was terminated and replaced with a new sublease in January 2006. Under the terms of the new sublease, Pleasant Valley Hospital’s percentage of equity in MOVC will decline over the following three years. On July 1, 2009, the equity contribution of Pleasant Valley Hospital reverted to the University.

- 50 -
Future annual minimum lease payments for years subsequent to June 30, 2011, are as follows:
Years EndingJune 30 Principal Interest Total
2012 900,001$ 302,518$ 1,202,519$2013 937,646 264,874 1,202,520 2014 976,542 225,969 1,202,511 2015 923,621 186,264 1,109,885 2016 765,151 150,506 915,657 2017–2021 2,118,758 432,495 2,551,253 2022–2025 1,379,224 80,562 1,459,786
9,644,131
Less interest 1,643,188
8,000,943$
In October 2007, the University entered into a ground lease with MSH — Marshall to lease the site for the student housing and wellness center project, which was funded by debt obligations of MSH — Marshall. The lease transferred to Provident — Marshall when the project was purchased from MSH — Marshall. The ground lease payments are one dollar per year.
11. OTHER POST EMPLOYMENT BENEFITS
In accordance with GASB, OPEB costs are accrued based upon invoices received from PEIA based upon actuarial determined amounts. At June 30, 2011 and 2010, the noncurrent liability related to OPEB costs was $27,102,502 and $15,438,783, respectively. The total of OPEB expense incurred and the amount of OPEB expense that relates to retirees was $14,680,071 and $3,016,352, respectively, during 2011. The total of OPEB expense incurred and the amount of OPEB expense that relates to retirees was $15,207,924 and $2,757,915, respectively, during 2010. As of and for the years ended June 30, 2011 and 2010, there were 185 and 181, respectively, retirees receiving these benefits.
12. STATE SYSTEM OF HIGHER EDUCATION INDEBTEDNESS
The University is a State institution of higher education. It receives a State appropriation to finance a portion of its operations. In addition, it is subject to the legislative and administrative mandates of State government. Those mandates affect all aspects of the University’s operations, its tuition and fee structure, its personnel policies, and its administrative practices.
The State has chartered the Commission with the responsibility to construct or renovate, finance, and maintain various academic and other facilities of the State’s universities and colleges, including certain facilities of the University. Financing for these facilities was provided through revenue bonds issued by the former Board of Regents, the former University System of West Virginia, the former State College System of West Virginia, or the former Interim Governing Board (the “Boards”). These obligations administered by the Commission are the direct and total responsibility of the Commission, as successor to the former Boards.

- 51 -
The Commission has the authority to assess each public institution of higher education for payment of debt service on these system bonds. The education and general capital fees (previously tuition and registration fees) of the members of the former University System are generally pledged as collateral for the Commission’s bond indebtedness. Student fees collected by the institution in excess of the debt service allocation are retained by the institution for internal funding of capital projects and maintenance. Although the bonds remain as a capital obligation of the Commission, an estimate of the obligation of each institution is reported as a long-term payable by each institution and as a receivable by the Commission.
For the year ended June 30, 2011 and 2010, debt service assessed is as follows:
2011 2010
Principal 3,160,103$ 3,024,479$Interest 1,105,380 1,238,535 Other 45,313 45,313
4,310,796$ 4,308,327$
During the year ended June 30, 2005, the Commission issued $167,000,000 of 2005 Series B 30-year Revenue Bonds to fund capital projects at various higher education institutions in the State. State lottery funds will be used to repay the debt, although the University revenues are pledged if lottery funds prove insufficient.
During August 2010, the West Virginia Development Office issued approximately $162 million of Education, Arts, Science and Tourism (EAST) bonds. The Commission, as provided in the State Code, received 60% or $97.2 million, of the proceeds to help fund various building and campus renewal projects. The University has been authorized to receive $17,600,000 of these proceeds. The West Virginia Development office is responsible for the repayment of the debt. As of June 30, 2011, the University has recognized $4.0 million of these funds.
During December 2010, the West Virginia Higher Education Policy Commission (HEPC) issued $76,865,000 of the State of West Virginia Higher Education Policy Commission Revenue 2010 Series Bonds to fund HEPC Bond projects approved by the Commission. The University has been authorized to receive $25,000,000 of these proceeds to be specifically used for the construction of the new Biotechnology Development Center and Applied Engineering Complex. The University will begin drawing the bond proceeds for this project in FY 2012; 85% of these bond proceeds must be spent by December 2013. The University has no responsibility for repayment of this debt.
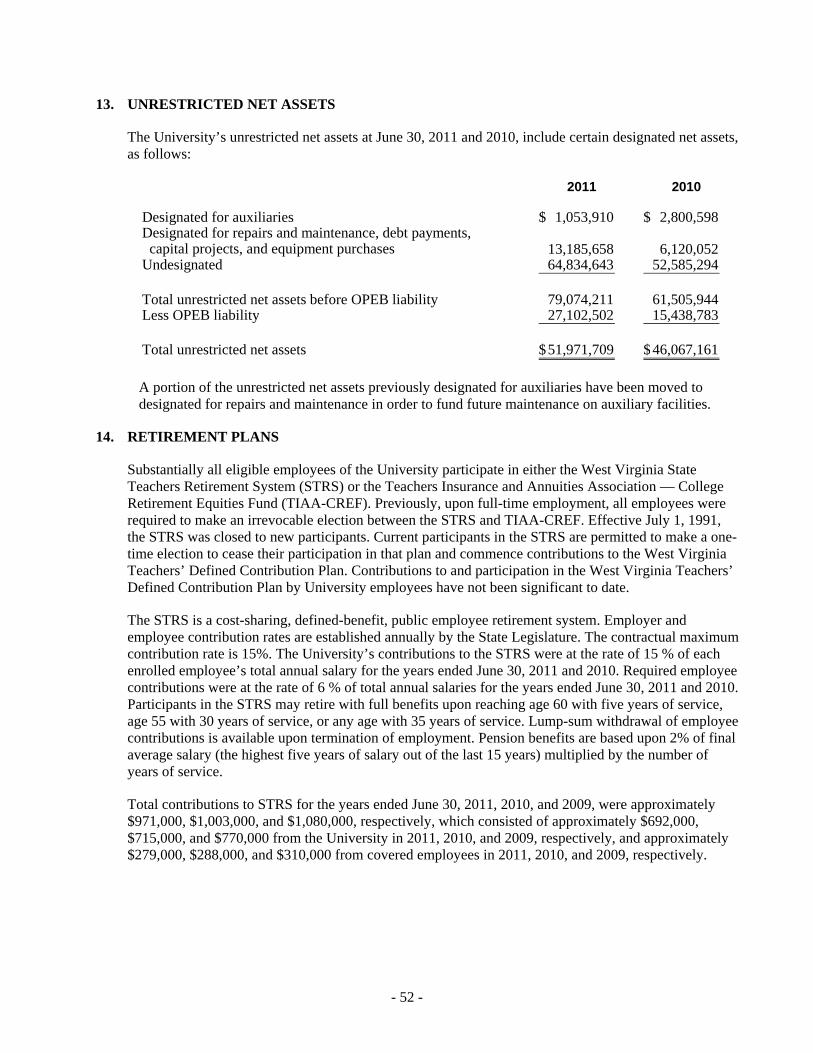
- 52 -
13. UNRESTRICTED NET ASSETS
The University’s unrestricted net assets at June 30, 2011 and 2010, include certain designated net assets, as follows:
2011 2010
Designated for auxiliaries 1,053,910$ 2,800,598$ Designated for repairs and maintenance, debt payments, capital projects, and equipment purchases 13,185,658 6,120,052 Undesignated 64,834,643 52,585,294
Total unrestricted net assets before OPEB liability 79,074,211 61,505,944 Less OPEB liability 27,102,502 15,438,783
Total unrestricted net assets 51,971,709$ 46,067,161$
A portion of the unrestricted net assets previously designated for auxiliaries have been moved to designated for repairs and maintenance in order to fund future maintenance on auxiliary facilities.
14. RETIREMENT PLANS
Substantially all eligible employees of the University participate in either the West Virginia State Teachers Retirement System (STRS) or the Teachers Insurance and Annuities Association — College Retirement Equities Fund (TIAA-CREF). Previously, upon full-time employment, all employees were required to make an irrevocable election between the STRS and TIAA-CREF. Effective July 1, 1991, the STRS was closed to new participants. Current participants in the STRS are permitted to make a one-time election to cease their participation in that plan and commence contributions to the West Virginia Teachers’ Defined Contribution Plan. Contributions to and participation in the West Virginia Teachers’ Defined Contribution Plan by University employees have not been significant to date.
The STRS is a cost-sharing, defined-benefit, public employee retirement system. Employer and employee contribution rates are established annually by the State Legislature. The contractual maximum contribution rate is 15%. The University’s contributions to the STRS were at the rate of 15 % of each enrolled employee’s total annual salary for the years ended June 30, 2011 and 2010. Required employee contributions were at the rate of 6 % of total annual salaries for the years ended June 30, 2011 and 2010. Participants in the STRS may retire with full benefits upon reaching age 60 with five years of service, age 55 with 30 years of service, or any age with 35 years of service. Lump-sum withdrawal of employee contributions is available upon termination of employment. Pension benefits are based upon 2% of final average salary (the highest five years of salary out of the last 15 years) multiplied by the number of years of service.
Total contributions to STRS for the years ended June 30, 2011, 2010, and 2009, were approximately $971,000, $1,003,000, and $1,080,000, respectively, which consisted of approximately $692,000, $715,000, and $770,000 from the University in 2011, 2010, and 2009, respectively, and approximately $279,000, $288,000, and $310,000 from covered employees in 2011, 2010, and 2009, respectively.

- 53 -
The contribution rate is set by the State Legislature on an overall basis, and the STRS does not perform a calculation of the contribution requirement for individual employers, such as the University. Historical trend and net pension obligation information is available from the annual financial report of the Consolidated Public Retirement Board. A copy of this report may be obtained by writing to the Consolidated Public Retirement Board, Building 5, Room 1000, Charleston, WV 25305.
The TIAA-CREF is a defined contribution plan in which benefits are based solely upon amounts contributed plus investment earnings. Each employee who elects to participate in this plan is required to make a contribution equal to 6% of total annual compensation. The University matches the employees’ 6% contributions. Contributions are immediately and fully vested. Employees may elect to make additional contributions to TIAA-CREF, which are not matched by the University.
Total contributions to TIAA-CREF for the years ended June 30, 2011, 2010, and 2009, were approximately $12,079,000, $11,891,000, and $11,489,000, respectively, which consisted of approximately $5,973,000, $5,884,000, and $5,670,000 from the University in 2011, 2010, and 2009, respectively, and approximately $6,106,000, $6,007,000, and $5,819,000 from covered employees in 2011, 2010, and 2009, respectively.
Effective January 1, 2003, higher education employees enrolled in the basic 401(a) retirement plan with TIAA-CREF have an option to switch to the Educators Money 401(a) Basic Retirement Plan (the “Educators Money”). New hires have the choice of either plan.
The Educators Money is a defined contribution plan in which benefits are based solely upon amounts contributed plus investment earnings. Each employee who elects to participate in this plan is required to make a contribution equal to 6% of total annual compensation. The University matches the employees’ 6% contributions. Contributions are immediately and fully vested. Employees may elect to make additional contributions to the Educators Money, which are not matched by the University.
Total contributions to the Educators Money for the years ended June 30, 2011, 2010, and 2009, were approximately $110,000, $152,000, and $128,000, respectively, which consisted of approximately $55,000, $76,000, and $64,000 from the University in 2011, 2010, and 2009, respectively, and approximately $55,000, $76,000, and $64,000 from covered employees in 2011, 2010, and 2009, respectively.
The University’s total payroll for the years ended June 30, 2011 and 2010, was approximately $114,860,000 and $114,053,000, respectively; total covered employees salaries in the STRS, TIAA-CREF, and Educators Money were approximately $4,658,000, $99,684,000, and $914,000, respectively, in 2011 and $4,805,000, $98,357,000, and $1,268,000, respectively, in 2010.
15. MARSHALL UNIVERSITY FOUNDATION, INC.
The Foundation is a separate nonprofit organization incorporated in the State whose purpose is to benefit the work and services of the University and its affiliated nonprofit organizations. The Foundation has a board of directors authorized to have 40 members selected by its Board members. At present, there are 34 members, including the President of the University as a nonvoting ex-officio member. In carrying out its responsibilities, the board of directors of the Foundation employs management, forms policy, and maintains fiscal accountability over funds administered by the Foundation. The University administration does not control the resources of the Foundation. The Foundation’s financial statements are presented as part of the University’s combined financial statements in accordance with GASB.

- 54 -
16. COMPONENT UNITS
MSH — MARSHALL, L.L.C.
MSH — Marshall is a Delaware single-member, limited liability company whose sole member is Mustard Seed Housing, Inc. The board of Mustard Seed Housing, Inc., consists of five members who are selected by its board members, and it appoints the one-member board (the executive director) for MSH — Marshall. MSH — Marshall was formed for the purpose of acquiring and financing the Series 2007 project. The Series 2007 project consists of an 812-bed housing facility and a 123,850-square-foot student recreation/wellness center located on the University campus. MSH — Marshall has engaged Capstone On-Campus Management, LLC and Centers, LLC to manage and maintain the Series 2007 project under management agreements. The MSH — Marshall financial statements for the year ended June 30, 2010 are presented as a discrete component unit of the University’s combined financial statements in accordance with GASB.
On July 30, 2010, MSH — Marshall sold the project to Provident Group – Marshall Properties LLC, in accordance with the terms and conditions of the Purchase and Sale Agreement. MSH – Marshall recognized a gain on sale of the Series 2007 project, net of unamortized issuance costs, of $17 million. The University did not have any financial impact as a result of the sale.
PROVIDENT — MARSHALL PROPERTIES L.L.C.
Provident – Marshall, a West Virginia limited liability company, was created on June 4, 2010, by its sole member, Provident Resources Group, Inc. (Provident), a Georgia nonprofit corporation and organization exempt from federal income tax under Section 501(a) of the Internal Revenue Code of 1986 (Code), as amended as a charitable organization described in Section 501(c)(3) of the Code. Provident — Marshall was created to own, operate and maintain a 418 unit, 812 bed, student housing facility and a 123,850 square foot student recreation/wellness center located on the campus of Marshall University, located in Huntington, West Virginia (Project). On July 30, 2010, Provident — Marshall purchased the Project from MSH – Marshall and commenced operations on that date.
Provident and Provident — Marshall promote and advance education through various means, including, without limitation, the development, construction, acquisition, ownership, management, maintenance, operation, and disposition of facilities of various types, including, but not limited to, educational, research, and student-housing facilities and through the provision of development, enrichment, counseling, tutoring, and other services and activities, so as to assist colleges and universities in fulfilling their educational mission. The Provident — Marshall financial statements for the period ending June 30, 2011 are presented as a discrete component unit of the University’s combined financial statements in accordance with GASB.
17. AFFILIATED ORGANIZATIONS
The University has separately incorporated affiliated organizations, including the University Physicians & Surgeons, Inc., and the Big Green Scholarship Foundation, Inc. Oversight responsibility for these entities rests with independent boards and management not otherwise affiliated with the University. Accordingly, the financial statements of such organizations are not included in the accompanying combined financial statements under the blended component unit requirements. They are not included in the University’s accompanying combined financial statements under discretely presented component unit requirements as, they (1) are not material or (2) have dual purposes (i.e., not entirely or almost entirely for the benefit of the University).
- 55 -
18. RELATED PARTY TRANSACTIONS
The University continued to provide services to Mountwest Community and Technical College (MCTC) and the University recognized $2.0 million and $2.2 million in 2011 and 2010, respectively, in state contracts and grants in connection with service agreements. The Governing Boards of both institutions have agreed to extend the service agreement past July 1, 2011, on a monthly basis until MCTC’s renovated campus is available for occupancy. At June 30, 2011 and 2010, related to this service agreement, the University has recorded $23,076 and $53,617, respectively, as a receivable from MCTC. Additionally, during the year ended June 30, 2010, the University had a net transfer of assets of $403,744 to MCTC.
19. CONTINGENCIES AND COMMITMENTS
The nature of the educational industry is such that, from time to time, claims will be presented against the University on account of alleged negligence, acts of discrimination, breaches of contract, or disagreements arising from the interpretation of laws or regulations. While some of these claims may be for substantial amounts, they are not unusual in the ordinary course of providing educational services in a higher education system. In the opinion of management, all known claims are covered by insurance or are such that an award against the University would not seriously affect the financial position of the University.
Under the terms of federal grants, periodic audits are required, and certain costs may be questioned as not being appropriate expenditures under the terms of the grants. Such audits could lead to reimbursement to the grantor agencies. The University’s management believes disallowances, if any, will not have a significant financial impact on the University’s financial position.
The Internal Revenue Code of 1986 establishes rules and regulations for arbitrage rebates. No arbitrage rebate liabilities have been recorded in the accompanying combined financial statements as of June 30, 2011 or 2010.
The University owns various buildings that are known to contain asbestos. The University is not required by federal, state, or local law to remove the asbestos from its buildings. The University is required under federal environmental, health, and safety regulations to manage the presence of asbestos in its buildings in a safe manner. The University addresses its responsibility to manage the presence of asbestos in its buildings on a case-by-case basis. Significant problems of dangerous asbestos conditions are abated as the conditions become known. The University also addresses the presence of asbestos as building renovation or demolition projects are undertaken and through asbestos operation and maintenance programs directed at containing, managing, or operating with the asbestos in a safe manner.
20. SEGMENT INFORMATION
The University issues revenue bonds to finance certain of its auxiliary enterprise activities. Investors in those bonds rely solely on the revenues generated by the activities of the auxiliaries for repayment.
Board of Governors of Marshall University, University Refunding Revenue Bonds, Series 2010
In November 2010, the Board sold $37,140,000 of University Refunding Revenue Bonds, Series 2010 (the “2010 Bonds”). The 2010 Bonds were issued under the authority contained in Article 10, Chapter 18B of the Code of West Virginia, 1931, as amended, and the 2010 Bonds will be secured pursuant to an Indenture dated as of November 1, 2010, by and between the Trustee. The 2010 Bonds are secured by and payable from auxiliary fees as defined in the Indenture.
- 56 -
The proceeds of the 2010 Bonds are being used to (1) advance refund $40,690,000 of State of West Virginia, Higher Education Interim Governing Board, University Facilities Revenue Bonds, Series 2001A and (2) pay the costs of issuance of the 2010 Bonds.
State of West Virginia, Higher Education Interim Governing Board, University Facilities Revenue Bonds, 2001 Series A
In June 2001, the Board sold $46,610,000 of Revenue Bonds, University Facilities 2001 Series A (the “2001 Bonds”). The 2001 Bonds were issued under the authority contained in Chapter 18, Article 23 of the Code of West Virginia, 1931, as amended, and the 2001 Bonds will be secured pursuant to an Indenture dated as of June 1, 2001, by and between the Trustee. The 2001 Bonds are secured by and payable from the revenues of the dormitories and parking facilities and certain funds held under the Indenture. The proceeds of the 2001 Bonds are being used (1) to finance a portion of the costs of acquisition, construction, and equipping of a new student housing complex and parking facilities at the University and renovations and improvements to existing dormitories at the University, (2) to fund capitalized interest on the 2001 Bonds, (3) to fund debt service reserves for the 2001 Bonds, and (4) to pay a portion of the costs of issuance of the 2001 Bonds.
The 2001 Bonds were refinanced by the 2010 Bonds.

- 57 -
Condensed financial information for the University’s segment as of June 30, 2011 and 2010, is as follows:
2010 Bonds 2001 Bonds
Condensed Statements of Net Assets 2011 2010
Assets: Current assets 6,509,177$ 8,390,747$ Noncurrent assets 42,244,540 44,733,101
Total 48,753,717$ 53,123,848$
Liabilities: Current liabilities 3,869,656$ 3,350,794$ Noncurrent liabilities 39,099,792 40,303,512
Total liabilities 42,969,448 43,654,306
Net assets: Invested in capital assets — net of related debt 3,438,572 4,043,101 Restricted for debt service 6,309 82,679 Unrestricted 2,339,388 5,343,762
Total net assets 5,784,269 9,469,542
Total 48,753,717$ 53,123,848$
Condensed Statements of Revenues, Expenses, and Changes in Net Assets
Operating: Operating revenues 16,916,672$ 14,991,202$ Operating expenses (13,393,509) (12,964,780)
Net operating income 3,523,163 2,026,422
Nonoperating: Nonoperating revenues 324,593 178,480 Nonoperating expenses (1,642,779) (2,159,303)
Total nonoperating (1,318,186) (1,980,823)
Net Revenues 2,204,977 45,599
Transfers from the University 3,579,292 14,388
Changes in net assets 5,784,269 59,987
Net assets — beginning of year 9,409,555
Net assets — end of year 5,784,269$ 9,469,542$
Condensed Statements of Cash Flows
Net cash provided by operating activities 6,147,180$ 3,948,173$
Net cash provided by (used in) capital and related financing 206,999 (3,187,264)
Net increase in cash and cash equivalents 6,354,179 760,909
Cash and cash equivalents — beginning of year 10,660,278
Cash and cash equivalents — end of year 6,354,179$ 11,421,187$

- 58 -
21. NATURAL CLASSIFICATIONS WITH FUNCTIONAL CLASSIFICATIONS
The operating expenses within both natural and functional classifications for the years ended June 30, 2011 and 2010, are as follows:
FeesSalaries Supplies Scholarships Other Assessed by
and and and Operating the 2011 Wages Benefits Other Services Utilities Fellowships Depreciation Expense Commission Total
Instruction 54,195,687$ 19,901,088$ 8,296,042$ 14$ - $ - $ - $ - $ 82,392,831$ Research 6,935,345 2,476,928 7,487,348 72,225 16,971,846 Public service 10,821,597 3,224,452 6,533,971 146,767 20,726,787 Academic support 11,682,982 4,384,713 5,397,476 17,900 21,483,071 Student services 6,369,194 2,744,451 3,465,428 6,745 12,585,818 General institutional support 12,398,473 4,479,092 4,879,333 411,865 22,168,763 Operations and maintenance of plant 4,129,658 2,573,205 3,240,334 6,316,380 16,259,577 Student financial aid 22,528,524 22,528,524 Auxiliary enterprises 8,326,682 3,966,155 13,865,311 1,983,968 28,142,116 Depreciation 12,848,716 12,848,716 Other 344,282 694,131 1,038,413
Total 114,859,618$ 43,750,084$ 53,165,243$ 8,955,864$ 22,528,524$ 12,848,716$ 344,282$ 694,131$ 257,146,462$
FeesSalaries Supplies Scholarships Other Assessed by
and and and Operating the 2010 Wages Benefits Other Services Utilities Fellowships Depreciation Expense Commission Total
Instruction 53,252,081$ 21,177,345$ 8,102,033$ 937$ - $ - $ - $ - $ 82,532,396$ Research 7,989,643 2,918,049 7,645,774 245,516 18,798,982 Public service 10,495,184 3,391,828 6,853,866 125,373 20,866,251 Academic support 11,156,450 4,512,872 5,405,451 153 21,074,926 Student services 6,083,216 2,956,989 3,201,995 2,567 12,244,767 General institutional support 12,090,002 4,790,929 4,143,305 21,551 21,045,787 Operations and maintenance of plant 3,975,609 2,728,472 3,015,375 6,157,942 15,877,398 Student financial aid 20,541,524 20,541,524 Auxiliary enterprises 9,011,079 4,238,291 13,369,527 1,904,059 28,522,956 Depreciation 13,382,695 13,382,695 Other 396,241 667,466 1,063,707
Total 114,053,264$ 46,714,775$ 51,737,326$ 8,458,098$ 20,541,524$ 13,382,695$ 396,241$ 667,466$ 255,951,389$

- 59 -
22. SUBSEQUENT EVENT
In September 2011, the Marshall University Board of Governors approved a resolution authorizing the financing of certain capital projects through the issuance of one or more series of bonds in a principal amount not to exceed $54,000,000. The non-exclusive list of potential projects to be funded by these bonds include a multi-floor parking structure, a soccer stadium complex, a biotechnology incubator and applied engineering complex, a fine arts incubator, an indoor athletic complex, an academic instructional facility and land acquisition and building demolition.
23. COMPONENT UNIT DISCLOSURES — FOUNDATION
The notes taken directly from the audited financial statements of the Foundation are as follows:

- 60 -

- 61 -

- 62 -

- 63 -
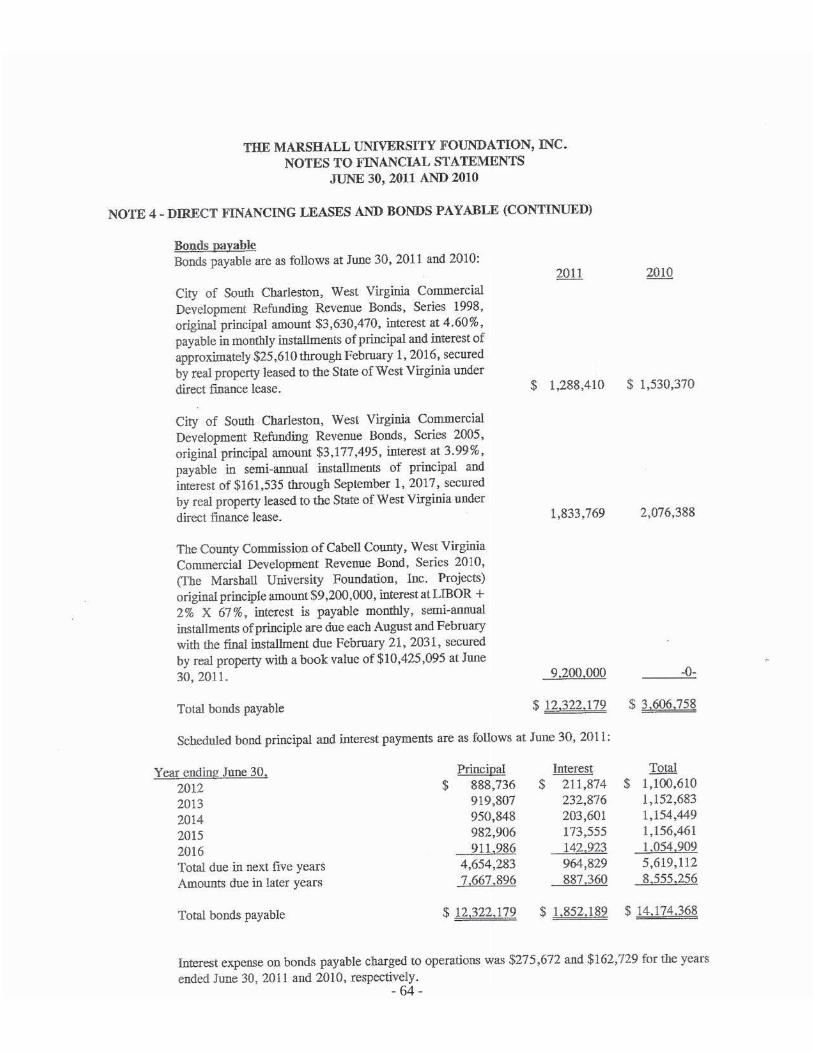
- 64 -

- 65 -

- 66 -

- 67 -
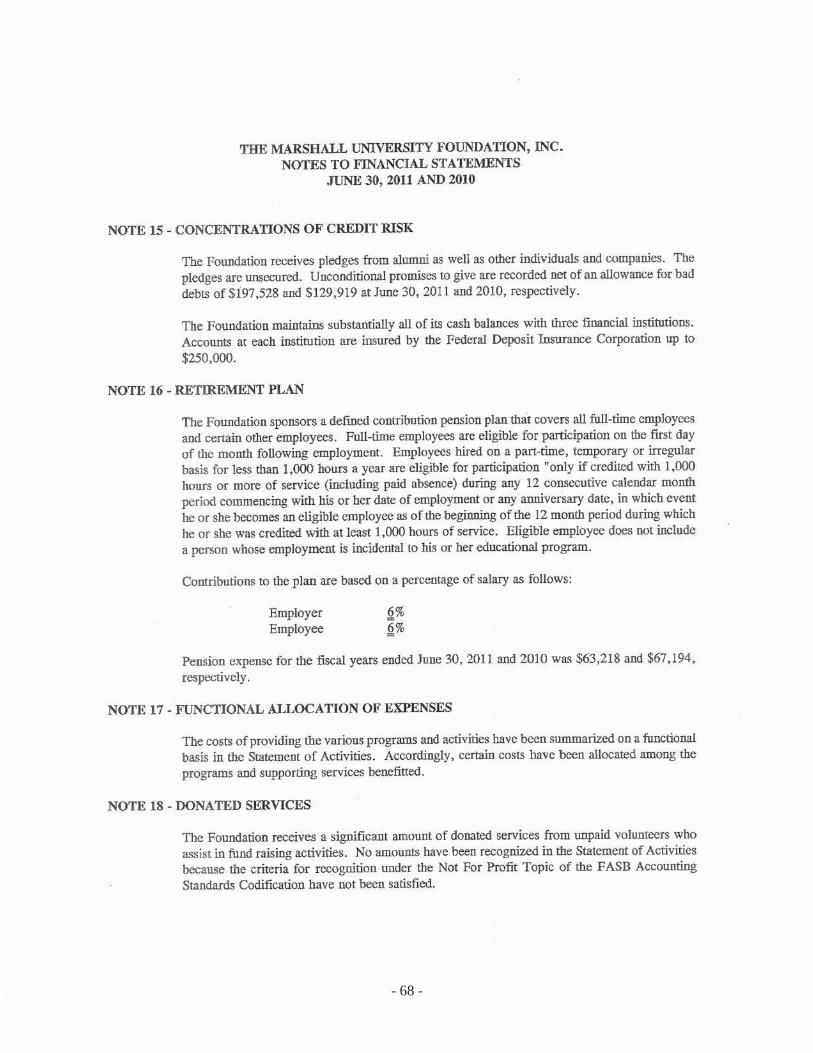
- 68 -

- 69 -
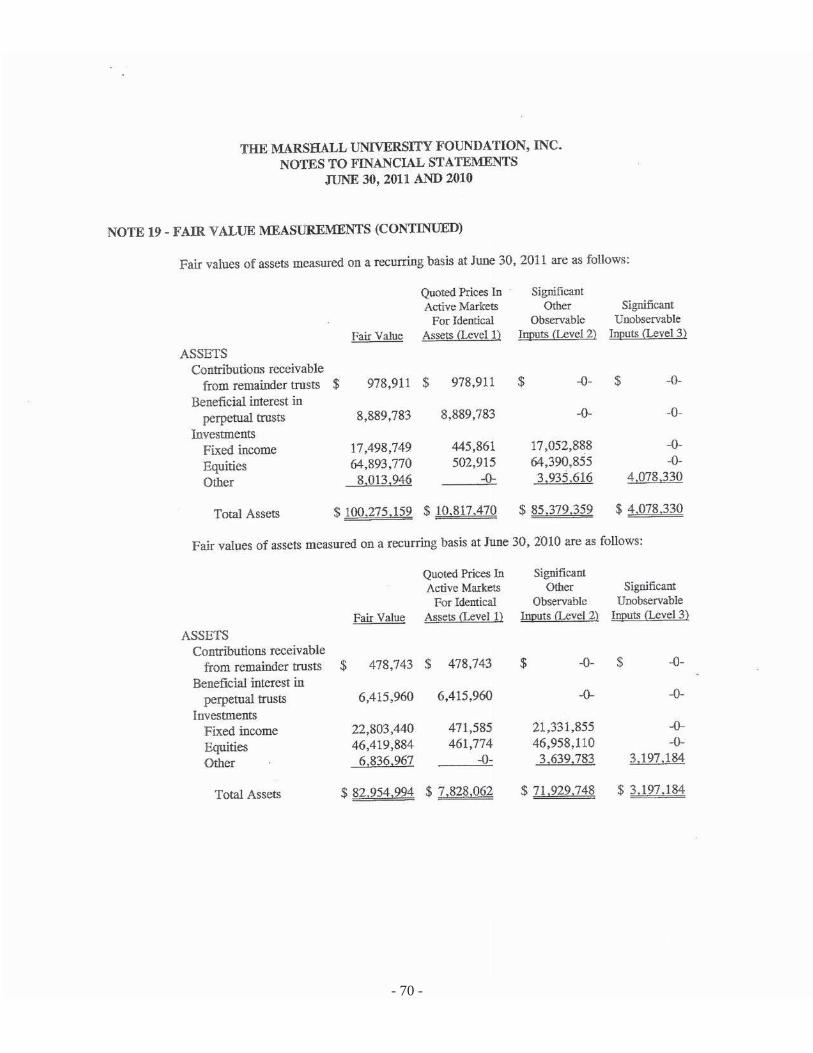
- 70 -
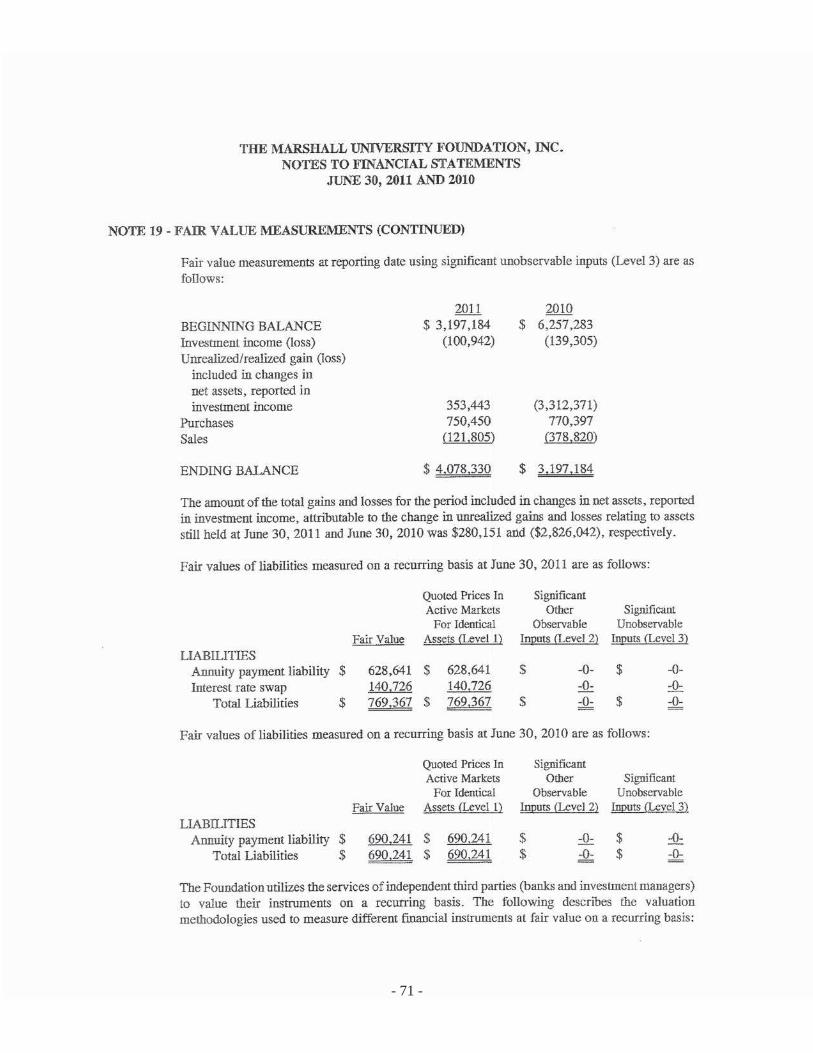
- 71 -

- 72 -

- 73 -

- 74 -

- 75 -
- 76 -

- 77 -

- 78 -

- 79 -

- 80 -

- 81 -

- 82 -

- 83 -
24. COMPONENT UNIT DISCLOSURES — PROVIDENT-MARSHALL
The notes taken directly from the audited financial statements of Provident-Marshall are as follows. These notes are comparable to the predecessor component unit’s 2010 notes.

- 84 -
- 85 -

- 86 -

- 87 -

- 88 -

- 89 -

- 90 -
INDEPENDENT AUDITORS’ REPORT ON INTERNAL CONTROL OVER FINANCIAL REPORTING AND ON COMPLIANCE AND OTHER MATTERS BASED ON AN AUDIT OF FINANCIAL STATEMENTS PERFORMED IN ACCORDANCE WITH GOVERNMENT AUDITING STANDARDS
To the Governing Board of Marshall University:
We have audited the combined financial statements of Marshall University (the “University”) as of and for the year ended June 30, 2011, and have issued our report thereon dated October 17, 2011, which states reliance on other auditors for the discretely presented component units. We conducted our audit in accordance with auditing standards generally accepted in the United States of America and the standards applicable to financial audits contained in Government Auditing Standards, issued by the Comptroller General of the United States. The audits of the University’s discretely presented component units were conducted in accordance with generally accepted auditing standards, but not in accordance with the standards applicable to financial audits contained in Government Auditing Standards, issued by the Comptroller General of the United States.
Internal Control Over Financial Reporting
Management of the University is responsible for establishing and maintaining effective internal control over financial reporting. In planning and performing our audit, we considered the University’s internal control over financial reporting as a basis for designing our auditing procedures for the purpose of expressing our opinion on the combined financial statements, but not for the purpose of expressing an opinion on the effectiveness of the University’s internal control over financial reporting. Accordingly, we do not express an opinion on the effectiveness of the University’s internal control over financial reporting.
A deficiency in internal control exists when the design or operation of a control does not allow management or employees, in the normal course of performing their assigned functions, to prevent or detect and correct misstatements on timely basis. A material weakness is a deficiency, or combination of deficiencies in internal control, such that there is a reasonable possibility that a material misstatement of the entity’s financial statements will not be prevented, or detected and corrected on a timely basis.
Our consideration of internal control over financial reporting was for the limited purpose described in the first paragraph of this section and was not designed to identify all deficiencies in internal control over financial reporting that might be deficiencies, significant deficiencies, or material weaknesses. We did not identify any deficiencies in internal control over financial reporting that we consider to be material weaknesses as defined above.

- 92 -
Compliance and Other Matters
As part of obtaining reasonable assurance about whether the University’s combined financial statements are free of material misstatement, we performed tests of its compliance with certain provisions of laws, regulations, contracts, and grant agreements, noncompliance with which could have a direct and material effect on the determination of combined financial statement amounts. However, providing an opinion on compliance with those provisions was not an objective of our audit, and accordingly, we do not express such an opinion. The results of our tests disclosed no instances of noncompliance or other matters that are required to be reported under Government Auditing Standards.
This report is intended solely for the information and use of the Marshall University Governing Board, managements of the University and the West Virginia Higher Education Policy Commission, federal and state awarding agencies, and pass-through entities and is not intended to be, and should not be, used by anyone other than these specified parties.
October 17, 2011