Mars, Pyramids and Changes in the Solar System€¦ · PPT file · Web view · 2008-05-25Title:...
36
What is Causing Climate What is Causing Climate Change? Change? Is CO Is CO 2 the the Only Only Important Factor? Important Factor?
Transcript of Mars, Pyramids and Changes in the Solar System€¦ · PPT file · Web view · 2008-05-25Title:...

What is Causing Climate What is Causing Climate Change?Change?
Is COIs CO22 the the OnlyOnly Important Factor? Important Factor?

22
Please review these WebsitesPlease review these Websites Please see these Websites for more Please see these Websites for more
information:information: www.weatherwars.infowww.weatherwars.info www.divinecosmos.comwww.divinecosmos.com www.enterprisemission.comwww.enterprisemission.com http://members.tripod.com/~DELTA_9/http://members.tripod.com/~DELTA_9/ http://www.thewebfairy.com/fonebone/index.htmhttp://www.thewebfairy.com/fonebone/index.htm http://www.checktheevidence.com/http://www.checktheevidence.com/
Contact: Andrew Johnson [email protected]

33
Global Warming – Is COGlobal Warming – Is CO22 the the Only Important Factor?Only Important Factor?
It’s It’s YOURYOUR fault, ye know! fault, ye know! YouYou consume the goods! consume the goods! YouYou drive the cars! drive the cars! YouYou use the electricity! use the electricity! Global Warming is entirely Global Warming is entirely YOUR FAULTYOUR FAULT!! And you complain at the idea of being taxed for And you complain at the idea of being taxed for
your “Carbon Footprint”!your “Carbon Footprint”! Some people! Some people! Let’s not confuse ENVIRONMENTAL DESTRUCTION Let’s not confuse ENVIRONMENTAL DESTRUCTION
and CLIMATE CHANGE.and CLIMATE CHANGE.
BUT WAIT… BUT WAIT…
Are we being given ALL THE DATA?

44
The SunThe Sun Since at least the late 1970’s, the Sun’s Since at least the late 1970’s, the Sun’s
overall radiation emissions have increased overall radiation emissions have increased by 0.5% per decade.by 0.5% per decade.
Another NASA scientist found that Another NASA scientist found that between 1901 and 2000, the Sun’s between 1901 and 2000, the Sun’s magnetic fieldmagnetic field has increased in strength has increased in strength by 230%.by 230%.
Before 2003, the 2 strongest solar flares Before 2003, the 2 strongest solar flares on record were rated at a previously on record were rated at a previously unheard-of X20, and occurred in 1989 and unheard-of X20, and occurred in 1989 and 2001. Then, in November 2003 a flare 2001. Then, in November 2003 a flare occurred that some estimate to be at least occurred that some estimate to be at least 200% more powerful than any ever seen 200% more powerful than any ever seen before - an X40 - or higher.before - an X40 - or higher.
These and other events in late 2003 These and other events in late 2003 caused one NASA scientist to say that the caused one NASA scientist to say that the Sun is now more active than in living Sun is now more active than in living memory, and “there has been nothing like memory, and “there has been nothing like this before.”this before.”
During in the Sunspot Cycle, when activity During in the Sunspot Cycle, when activity is at a maximum, many of the spots is at a maximum, many of the spots appear at a latitude of 19.5appear at a latitude of 19.5°. °.
Largest, Brightest-Ever X40 Solar Flare, 11.5.03
and Subsequent CME (R). (NASA-ESA)

55
MercuryMercury Despite huge surface temperatures, Despite huge surface temperatures,
Mercury seems to have ice in its polar Mercury seems to have ice in its polar regions.regions.
This is blamed on comet-based ice that This is blamed on comet-based ice that crash-landed into “permanently crash-landed into “permanently shadowed craters,” which NASA shadowed craters,” which NASA scientists admit is a “problematic” scientists admit is a “problematic” assumption to make; the ice assumption to make; the ice supposedly has survived for millennia, supposedly has survived for millennia, whereas a NASA probe landing at the whereas a NASA probe landing at the pole is only expected to survive one pole is only expected to survive one week in the heat.week in the heat.
Mercury also has an unexpectedly Mercury also has an unexpectedly dense core of iron, consisting of almost dense core of iron, consisting of almost half of its entire mass,half of its entire mass, and a strong and a strong dipole magnetic field as well. Some dipole magnetic field as well. Some Scientists would like to know how these Scientists would like to know how these anomalies are possible.anomalies are possible.
Mariner 10 Pictures (1974)

66
VenusVenus
Mariner 10 (1974) Mosaic Image of Venus
The amount of sulfur in The amount of sulfur in Venus’ atmosphere was Venus’ atmosphere was found to have decreased found to have decreased “dramatically” between “dramatically” between 1978 and 1983.1978 and 1983.
This is currently blamed on This is currently blamed on a hypothetical “giant a hypothetical “giant volcanic eruption,” which volcanic eruption,” which released these sulfur released these sulfur compounds all at once into compounds all at once into the Venusian atmosphere - the Venusian atmosphere - this sulfur then must have this sulfur then must have “settled out” of the “settled out” of the Venusian atmosphere and Venusian atmosphere and so disappeared.so disappeared.

77
VenusVenus
Green nightglow of Venus
Venus’ overall night-side “airglow” brightness Venus’ overall night-side “airglow” brightness increased by 2500% in roughly the same increased by 2500% in roughly the same timeframe - 1975 - 2001.timeframe - 1975 - 2001.
The new airglow is green in colour, indicating The new airglow is green in colour, indicating oxygen atoms, and these oxygen emissions are as oxygen atoms, and these oxygen emissions are as strong on Venus as they are in Earth’s own oxygen-strong on Venus as they are in Earth’s own oxygen-rich aurora - so a possible explanation is that there rich aurora - so a possible explanation is that there has been a massive increase in the oxygen content has been a massive increase in the oxygen content of Venus’ atmosphere. of Venus’ atmosphere.
Alpha & Beta Regio, two active volcanoes on Venus Alpha & Beta Regio, two active volcanoes on Venus are at 19.5are at 19.5°°

88
Earth - 1Earth - 1 A 410% increase in the overall A 410% increase in the overall
number of natural catastrophes number of natural catastrophes on Earth between 1963 and on Earth between 1963 and 1993 (Dmitriev 1997)1993 (Dmitriev 1997)
A 400% increase in the number A 400% increase in the number of quakes on Earth (over 2.5 on of quakes on Earth (over 2.5 on the Richter scale) since 1973 the Richter scale) since 1973 (Mandeville 1998)(Mandeville 1998)
Approx 500% increase in Approx 500% increase in Earth’s volcanic activity Earth’s volcanic activity between 1875 and 1993 between 1875 and 1993 (Mandeville 2000)(Mandeville 2000)
99
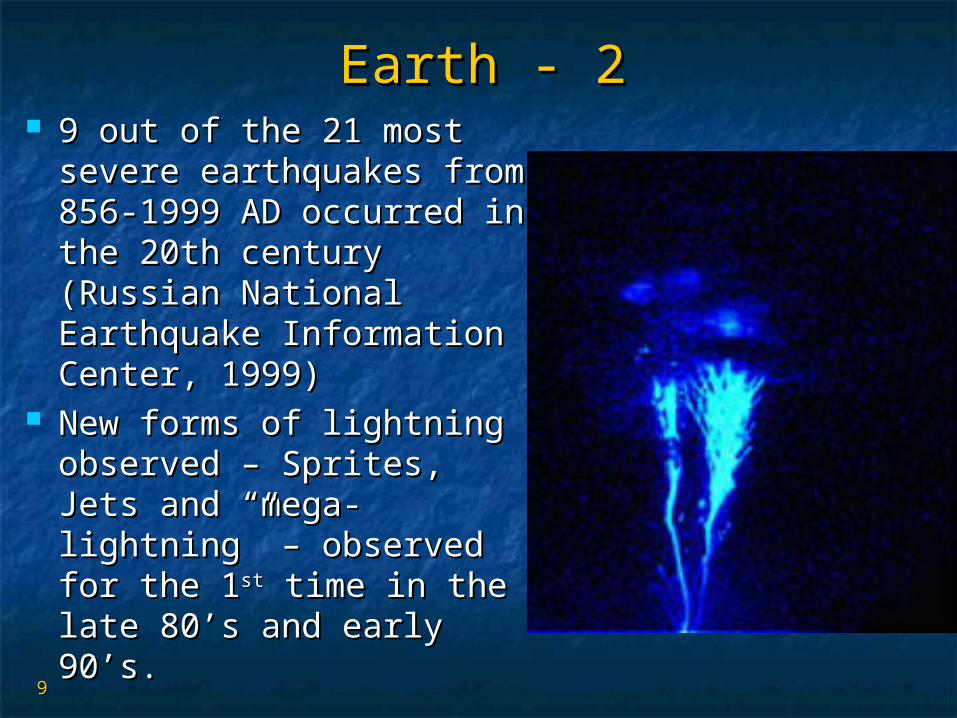
Earth - 2Earth - 2 9 out of the 21 most 9 out of the 21 most
severe earthquakes from severe earthquakes from 856-1999 AD occurred in 856-1999 AD occurred in the 20th century the 20th century (Russian National (Russian National Earthquake Information Earthquake Information Center, 1999) Center, 1999)
New forms of lightning New forms of lightning observed – Sprites, Jets observed – Sprites, Jets and “mega-lightning” – and “mega-lightning” – observed for the 1observed for the 1stst time time in the late 80’s and early in the late 80’s and early 90’s.90’s.

1010
Mars - 1Mars - 1

1111
Mars - 2Mars - 2 The Polar Ice Caps have diminished significantly The Polar Ice Caps have diminished significantly
in size in the last 8 years.in size in the last 8 years. Interestingly, NASA admitted earlier that an Interestingly, NASA admitted earlier that an
underlying geometric structure was somehow underlying geometric structure was somehow involved in the retreat of the icecap- a hexagon-involved in the retreat of the icecap- a hexagon-shaped pattern seems to be present in both shaped pattern seems to be present in both images)images)
Olympus Mons (27 km high), at 19 degrees N. -- Olympus Mons (27 km high), at 19 degrees N. -- on Mars.on Mars.
Ozone is up and dust is down, both indicating Ozone is up and dust is down, both indicating that increased ionization is taking place. The that increased ionization is taking place. The atmosphere is noticeably cloudier and denser, a atmosphere is noticeably cloudier and denser, a massive hurricane and a surprisingly fast-moving massive hurricane and a surprisingly fast-moving planet-wide dust storm have dazzled NASA planet-wide dust storm have dazzled NASA scientists. scientists.

1212
Jupiter - 1Jupiter - 1 The amount of heavy elements (such as oxygen) in The amount of heavy elements (such as oxygen) in
Jupiter’s atmosphere decreased by 10% between 1979 and Jupiter’s atmosphere decreased by 10% between 1979 and 1995, which is equivalent to 20 Earth-masses of oxygen 1995, which is equivalent to 20 Earth-masses of oxygen disappearing in 16 years. Radiation emissions from Jupiter disappearing in 16 years. Radiation emissions from Jupiter simultaneously simultaneously increasedincreased by about 25% in the same time. by about 25% in the same time.
Hoagland Observes that Hoagland Observes that Jupiter’s Great Red Spot Jupiter’s Great Red Spot (present for at least the last (present for at least the last 300 years) is found at a 300 years) is found at a latitude of – 19.5°. latitude of – 19.5°.
By 2008, 2 new Red Spots By 2008, 2 new Red Spots had appeared.had appeared.
Jupiter may also be Jupiter may also be undergoing Global undergoing Global Warming.Warming.

1313
SaturnSaturn Between 1980 and 1996, the speed of Between 1980 and 1996, the speed of
rotation for Saturn’s clouds at the rotation for Saturn’s clouds at the equator reduced by equator reduced by 58.2%, 58.2%, described described as an as an “unexpected and dramatic “unexpected and dramatic change in weather.”change in weather.” The NASA The NASA explanation is “seasonal changes”.explanation is “seasonal changes”.
In Aug. 1981, Voyager 2 reached In Aug. 1981, Voyager 2 reached Saturn and photographed unexpected Saturn and photographed unexpected “spokes” in the rings, caused by “spokes” in the rings, caused by “bunching” of particles.“bunching” of particles.
In Dec 2003, With higher resolution In Dec 2003, With higher resolution and superior imaging, it was hoped to and superior imaging, it was hoped to get a better look at these with Cassini.get a better look at these with Cassini.
The Spokes had disappeared!The Spokes had disappeared! Saturn has also exhibited anomalous Saturn has also exhibited anomalous
X-ray emissions (observed by Chandra) X-ray emissions (observed by Chandra) and Auroral activity.and Auroral activity.
Cassini Saturn Photo
(“Hexagon”)

1414
Uranus - 1Uranus - 1 Uranus “appeared as featureless Uranus “appeared as featureless
as a cue ball” in 1986 when as a cue ball” in 1986 when Voyager flew by, Voyager flew by, remarkably remarkably bright cloudsbright clouds began appearing as began appearing as of at least 1996… clouds “almost of at least 1996… clouds “almost as large as continents on Earthas large as continents on Earth
By 1998, the Hubble Space By 1998, the Hubble Space Telescope had discovered nearly Telescope had discovered nearly as many clouds in the high as many clouds in the high Uranian atmosphere as had Uranian atmosphere as had everever been observed in the been observed in the entire entire history history of Uranus. One of these of Uranus. One of these clouds was “brighter than any clouds was “brighter than any other” ever seen on Uranus.”other” ever seen on Uranus.”
False-Color Infrared Image of Emerging High-Altitude Bright Clouds on Uranus

1515
Uranus - 2Uranus - 2 In 1999, NASA articles were In 1999, NASA articles were
referring to Uranus as being “hit” referring to Uranus as being “hit” by “Huge Storms,” making it “a by “Huge Storms,” making it “a dynamic world with the brightest dynamic world with the brightest clouds in the outer solar system.” clouds in the outer solar system.”
The head NASA scientist referred The head NASA scientist referred to these increasingly bright and to these increasingly bright and active clouds as active clouds as “really big, big “really big, big changes”changes” on Uranus, compared on Uranus, compared to what we had seen with to what we had seen with Voyager.Voyager.
Even from Earth, significant Even from Earth, significant changeschanges have been catalogued… have been catalogued… based on new cloud patterns based on new cloud patterns “whose origins are not well “whose origins are not well understood”understood”
Image of Uranus obtained in 2005 by ACS on HST. Rings, southern collar and a bright cloud
in the northern hemisphere are visible.

1616
NeptuneNeptune By June 1994, Neptune’s “Great Dark Spot”, at our By June 1994, Neptune’s “Great Dark Spot”, at our
familiar 19.5familiar 19.5°° latitude, had mysteriously latitude, had mysteriously disappeareddisappeared. . By April of 1995, Neptune’s Great Dark Spot had By April of 1995, Neptune’s Great Dark Spot had
reappeared reappeared in Neptune’s in Neptune’s northernnorthern hemisphere hemisphere accompanied by more bright, high-altitude clouds! accompanied by more bright, high-altitude clouds! NASA itself noted that this new spot was a NASA itself noted that this new spot was a “near-mirror “near-mirror image of the first spot image of the first spot previously imaged by Voyager 2.previously imaged by Voyager 2.
More bright clouds have appeared in the last 8 years.More bright clouds have appeared in the last 8 years.
Neptune, with Great Dark
Spot in center, as seen by
Voyager 2 in 1989

1717
Pluto - 1Pluto - 1 The most distant planet – which The most distant planet – which
some even say is not really a some even say is not really a planet.planet.
We naturally assume that if a We naturally assume that if a planet moves closer to the Sun, it planet moves closer to the Sun, it is exposed to more heat.is exposed to more heat.
Since 1989, Pluto has been Since 1989, Pluto has been moving moving awayaway from the Sun in its from the Sun in its highly elliptical, 248-year orbithighly elliptical, 248-year orbit
Space.com admits, Space.com admits, “Logic “Logic suggests the planet might cool as suggests the planet might cool as it receives less sunlight each day”it receives less sunlight each day”

1818
Pluto - 2Pluto - 2 Dr. James L. Elliot, took advantage of a Dr. James L. Elliot, took advantage of a
rare event, where Pluto passed in front rare event, where Pluto passed in front of a star in 2002, and this allowed him of a star in 2002, and this allowed him to determine whether Pluto’s structure to determine whether Pluto’s structure and composition had stayed the same and composition had stayed the same as in 1989 (similar to what is shown as in 1989 (similar to what is shown lower right). lower right).
They discovered that the atmospheric They discovered that the atmospheric pressure of Pluto has increased - by pressure of Pluto has increased - by 300% - between 1989 and 2002. This 300% - between 1989 and 2002. This has also caused a noticeable rise in has also caused a noticeable rise in Pluto’s surface temperatures. Pluto’s surface temperatures.
This is attributed by mainstream This is attributed by mainstream planetologists to… “seasonal change.”planetologists to… “seasonal change.”

1919
Local Interstellar Medium Local Interstellar Medium This may be playing a role in what is happening in the Solar This may be playing a role in what is happening in the Solar
System:System: From http://ae-www.usc.edu/bio/dons/ds_biosk.html From http://ae-www.usc.edu/bio/dons/ds_biosk.html Research on the properties of the Local Interstellar medium have Research on the properties of the Local Interstellar medium have
been carried out in scattered periods beginning in 1978. The been carried out in scattered periods beginning in 1978. The NASA Space Physics Division has shown a persistent pernicious NASA Space Physics Division has shown a persistent pernicious bias against work on the effects of the neutral gas in the LISM in bias against work on the effects of the neutral gas in the LISM in the United States, from the time of the formation of the Division. the United States, from the time of the formation of the Division. The dominant role of neutral hydrogen in the formation of the The dominant role of neutral hydrogen in the formation of the termination shock in the collision of the solar wind with the LISM termination shock in the collision of the solar wind with the LISM has only recently been recognized by the particles and fields has only recently been recognized by the particles and fields research community, which has been supported primarily by the research community, which has been supported primarily by the Space Science Division. The most important contributions to Space Science Division. The most important contributions to research in this program are papers (48), which presents a research in this program are papers (48), which presents a calibration independent method of determining absolute LISM calibration independent method of determining absolute LISM density, and (89), which presents the first evidence for a large density, and (89), which presents the first evidence for a large increase in the LISM neutral atomic hydrogen density from increase in the LISM neutral atomic hydrogen density from Voyager measurements of the 50 AU region, suggesting the Voyager measurements of the 50 AU region, suggesting the approach to the termination shock (89). See 19, 20, 21, 48, 64, approach to the termination shock (89). See 19, 20, 21, 48, 64, 82, 89.82, 89.

2020
Maunder Minimum (Sunspots) and Maunder Minimum (Sunspots) and The Little Ice AgeThe Little Ice Age
Europe's so-called Europe's so-called "Little Ice Age" "Little Ice Age" (1645-1715) (1645-1715) coincided with the coincided with the Maunder Minimum -- Maunder Minimum -- a period during a period during which sunspots were which sunspots were exceedingly rare. exceedingly rare.
There does seem to be correlation There does seem to be correlation between Sun Spot numbers and the between Sun Spot numbers and the temperature on the Earth over time.temperature on the Earth over time.

2121
Sunspots and ClimateSunspots and Climate Another effect on global temperature Another effect on global temperature
related to sunspots is the deflection of related to sunspots is the deflection of cosmic particles coming from Milky cosmic particles coming from Milky Way by the sun's increased magnetic Way by the sun's increased magnetic field during increased sunspot activity. field during increased sunspot activity.
During periods of decreased sunspot During periods of decreased sunspot activity, the sun's magnetic field is activity, the sun's magnetic field is reduced and a higher percentage of reduced and a higher percentage of cosmic rays enter the Earth's cosmic rays enter the Earth's atmosphere. "The ions produced by atmosphere. "The ions produced by cosmic rays act as condensation nuclei cosmic rays act as condensation nuclei for larger suspension particles and for larger suspension particles and thus contribute to cloud formation. thus contribute to cloud formation.
With increased solar activity (and stronger magnetic With increased solar activity (and stronger magnetic fields), the cosmic ray intensity decreases, and with it fields), the cosmic ray intensity decreases, and with it the amount of cloud coverage, resulting in a rise of the amount of cloud coverage, resulting in a rise of temperature on the Earth. Conversely, a reduction in temperature on the Earth. Conversely, a reduction in solar activity produces lower temperatures." (A12)solar activity produces lower temperatures." (A12)

2222
Chemtrails 1Chemtrails 1
Note the “grid” pattern. Also, bear in mind that this picture was taken at a minimum Note the “grid” pattern. Also, bear in mind that this picture was taken at a minimum altitude of 150 miles (250km), AND from an angle. We are looking at an atmospheric altitude of 150 miles (250km), AND from an angle. We are looking at an atmospheric phenomenon, which is at least 300 miles (500km) from the lens! Ordinary, normal phenomenon, which is at least 300 miles (500km) from the lens! Ordinary, normal contrails could not, and would not, be visible from such a distance. In any case, contrails could not, and would not, be visible from such a distance. In any case, contrails would never last long enough to create this blanket of material over such a contrails would never last long enough to create this blanket of material over such a wide area. And from whence does all this MASS come from?? We're looking at MILLIONS wide area. And from whence does all this MASS come from?? We're looking at MILLIONS OF TONS of material to make a layer like this in the atmosphere folks. We can only OF TONS of material to make a layer like this in the atmosphere folks. We can only guess how many square miles/kilometers of continental territory are shown in this guess how many square miles/kilometers of continental territory are shown in this photograph, but the area seen here is huge. All of this caused by mere jet engine photograph, but the area seen here is huge. All of this caused by mere jet engine exhaust? I DON'T THINK SO.exhaust? I DON'T THINK SO.

2323
Chemtrails 2Chemtrails 2
Battle Creek Michigan 2004. The day begins without a Battle Creek Michigan 2004. The day begins without a cloud in the sky... Until the planes appear and so often cloud in the sky... Until the planes appear and so often they fly in pairs. they fly in pairs.
2424
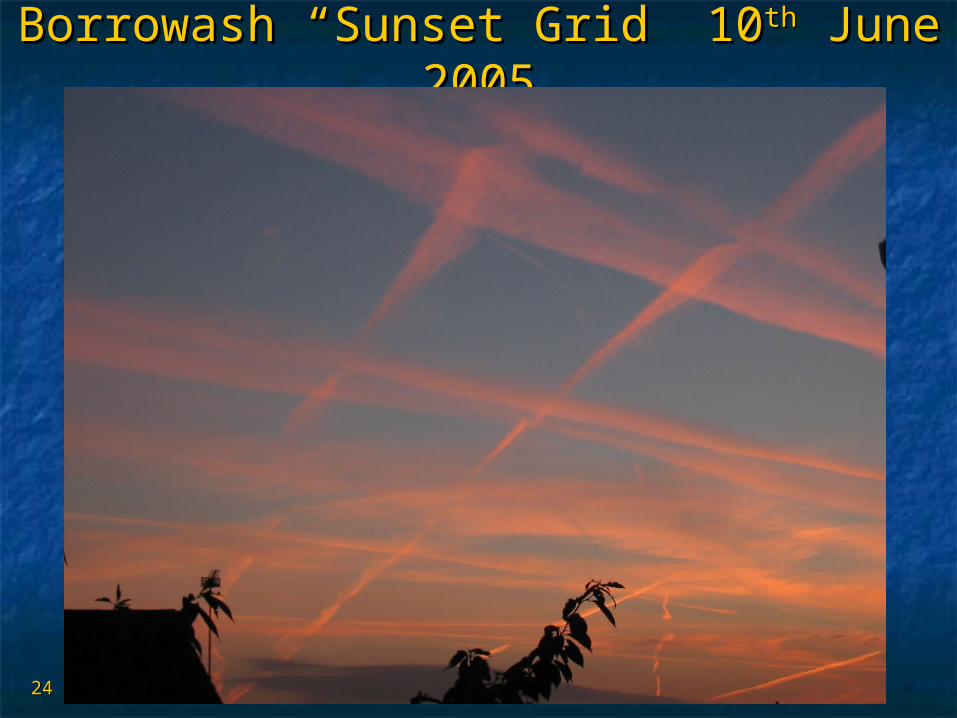
Borrowash “Sunset Grid” 10Borrowash “Sunset Grid” 10thth June June 20052005

2525
Cloud Anomalies - 1Cloud Anomalies - 1 Some extraordinary Some extraordinary
pictures of cloud pictures of cloud anomalies have anomalies have surfaced over the surfaced over the last few years.last few years.
This image caused This image caused quite a stir in late quite a stir in late summer 2003 when summer 2003 when this image was this image was captured some place captured some place in Alabama, it even in Alabama, it even made it onto the made it onto the BBC News Website!BBC News Website!
http://news.bbc.co.uk/1/hi/sci/tech/3394461.stm

2626
Cloud Anomalies - 2Cloud Anomalies - 2This This image image was taken was taken the the morning morning of Nov 17, of Nov 17, 2004 from 2004 from a plane a plane departing departing New New York's JFK York's JFK airport. airport.

2727
Cloud Anomalies - 3Cloud Anomalies - 3Orlando Florida Orlando Florida late in the day late in the day prior to prior to Christmas Eve. Christmas Eve. Blooming Blooming contrails contrails evident with a evident with a striking oval striking oval imprint imprint deposited into deposited into the cloud field. the cloud field. It truly amazes It truly amazes me that this me that this whole project is whole project is still so hidden still so hidden behind the behind the 'important' 'important' news of the news of the day. A sorry day. A sorry symptom of the symptom of the state of state of journalism in journalism in this nation and this nation and indeed indeed throughout the throughout the Western world. Western world.

2828
Cloud Anomalies - 4Cloud Anomalies - 4This oval This oval strike strike appears to appears to be very be very fresh with fresh with the cirrus the cirrus fallout just fallout just in the in the beginning beginning phases. phases. Note the Note the straight straight edge to the edge to the back of the back of the cloud field cloud field northward northward of the oval. of the oval.

2929
Cloud Anomalies - 5Cloud Anomalies - 5
No details for this imageNo details for this image

3030
Weather Satellite Anomalies – 1Weather Satellite Anomalies – 1 October 21, October 21,
2004 1932Z 2004 1932Z 3:32 Central 3:32 Central
Notice how Notice how the cumulus the cumulus field has field has formed a 90-formed a 90-degree bend degree bend around the around the two negative two negative energy clear energy clear areas. areas.

3131
Weather Satellite Anomalies – 2Weather Satellite Anomalies – 2 Scott Stevens writes:Scott Stevens writes: ““June 7, 2004--0108Z June 7, 2004--0108Z
Southern Southern Montana/East Montana/East Idaho/NW Montana. Idaho/NW Montana. This image was huge This image was huge for me. Finally for me. Finally convincing me that convincing me that this project wasn't this project wasn't limited to individual limited to individual 'events' but was 'events' but was everywhere all the everywhere all the time. Soak up all the time. Soak up all the oddities, squares, oddities, squares, and clouds at 90-and clouds at 90-degree angles. the degree angles. the whole storm had to whole storm had to have been digitized have been digitized into individual cells. into individual cells. I've never looked at I've never looked at the sky the same the sky the same since.”since.”
http://www.weatherwars.info/satellite_1.htm

3232
Weather Satellite Anomalies – 3Weather Satellite Anomalies – 3
What causes What causes CIRCULARCIRCULAR rainfall patterns rainfall patterns (as detected on satellite radar)(as detected on satellite radar)??

3333
Hurricane OpheliaHurricane OpheliaRichard C Hoagland stated Richard C Hoagland stated on his Blog - “It is our on his Blog - “It is our contention, based on the contention, based on the physics of these images physics of these images (described at the official (described at the official University of Wisconsin University of Wisconsin MIMIC site), that these MIMIC site), that these bizarre "tuning fork" patterns bizarre "tuning fork" patterns -- note, geometrically aimed -- note, geometrically aimed at the precise centers of at the precise centers of these respective storms! -- these respective storms! -- are actually a "rainfall side-are actually a "rainfall side-effect" of an unseen energy effect" of an unseen energy technology being applied to technology being applied to these respective storms ... in these respective storms ... in an effort to decrease both an effort to decrease both their wind velocities, and to their wind velocities, and to simultaneously alter the simultaneously alter the storms' tracks themselves.” storms' tracks themselves.”

3434
Hurricane RitaHurricane Rita
Also From Richard C Hoagland‘s Blog: “Further, in just the last Also From Richard C Hoagland‘s Blog: “Further, in just the last few days, we've uncovered compelling new technical information few days, we've uncovered compelling new technical information -- specifically, satellite microwave radiometer images of rainfall in -- specifically, satellite microwave radiometer images of rainfall in Hurricane Rita (known as MIMIC images) -- which provide Hurricane Rita (known as MIMIC images) -- which provide remarkable additional support for the hypothesis that "someone" remarkable additional support for the hypothesis that "someone" is using a currently "unknown technology" to alter both hurricane is using a currently "unknown technology" to alter both hurricane strength ... and to steer the storms themselves (below).strength ... and to steer the storms themselves (below).

3535
In fact, it looks like…In fact, it looks like… Changes are happening on all other planets in the solar Changes are happening on all other planets in the solar
system.system. ENVIRONMENTAL DESTRUCTION and ENVIRONMENTAL DESTRUCTION and
CLIMATE CHANGE have DIFFERENT CAUSES.CLIMATE CHANGE have DIFFERENT CAUSES. COCO22 is a Minor Factor is a Minor Factor in the picture of Global Warming… in the picture of Global Warming… There seem to be energy changes throughout the solar There seem to be energy changes throughout the solar
system – and also Solar activity has changed significantly system – and also Solar activity has changed significantly in the last few years.in the last few years.
Energy Changes across the Solar System could be being Energy Changes across the Solar System could be being induced by an officially unacknowledged type of induced by an officially unacknowledged type of “Hyperdimensional Energy Transfer”. “Hyperdimensional Energy Transfer”.
Someone is deliberately polluting the atmosphere with Someone is deliberately polluting the atmosphere with something anyway (and few notice)something anyway (and few notice)
Other ResearchOther Research shows that Pollution-Free Energy shows that Pollution-Free Energy Technologies (or ones with far lower levels of pollution) Technologies (or ones with far lower levels of pollution) have been perniciously suppressed.have been perniciously suppressed.
What are you going to do about it?

3636
So please…So please…
Dept. of Environment, Greenpeace, The Green Party, Friends of the Earth, World Wildlife Fund, “Climate
Action” groups MUST take account of this data – before it’s too late. Thank you!