Marnix Roels Data You Can Trust - bcs.org file11 January 2012. 3. Tata Steel in Europe • Second...
24
Data You Can Trust Marnix Roels The Business Case for a Single Source of Data Version: 2.2 Date: 09.01.2012 Developed by the ORTeam
Transcript of Marnix Roels Data You Can Trust - bcs.org file11 January 2012. 3. Tata Steel in Europe • Second...

Data You Can TrustMarnix Roels
The Business Case for a Single Source
of Data
Version: 2.2Date: 09.01.2012
Developed by the ORTeam

11 January 2012 3
Tata Steel in Europe
• Second largest steel producer in Europe
• Approximately 35,000 employees worldwide
• Major manufacturing sites in UK, Netherlands, Germany, France and Belgium
Strip Products UK sites in Port Talbot and Newport
• Sales offices and service centres in close to 50 countries
• Supplier to many demanding markets worldwide, including construction, automotive, packaging and mechanical engineering

11 January 2012 4
Victim of History
• Raw data available in different formats on different platforms
Mainframe DB2, Windows SQL, Oracle, Oracle RDB, PI, SAP, Linux
• Hard to interrogate formats
Lotus Notes databases, emails, paper copies• No unified approach for interrogating data
SQL query, WebFOCUS, Oracle SQL Developer, PI Process Book, Access, Excel
• Localised storage and handling of data for bespoke reports
• Tortuous, poorly documented data trails
• Working in silos disconnect between layers of the organisation
Result = conflicting business reports, doubt over what the “true” report values are
11 January 2012 5
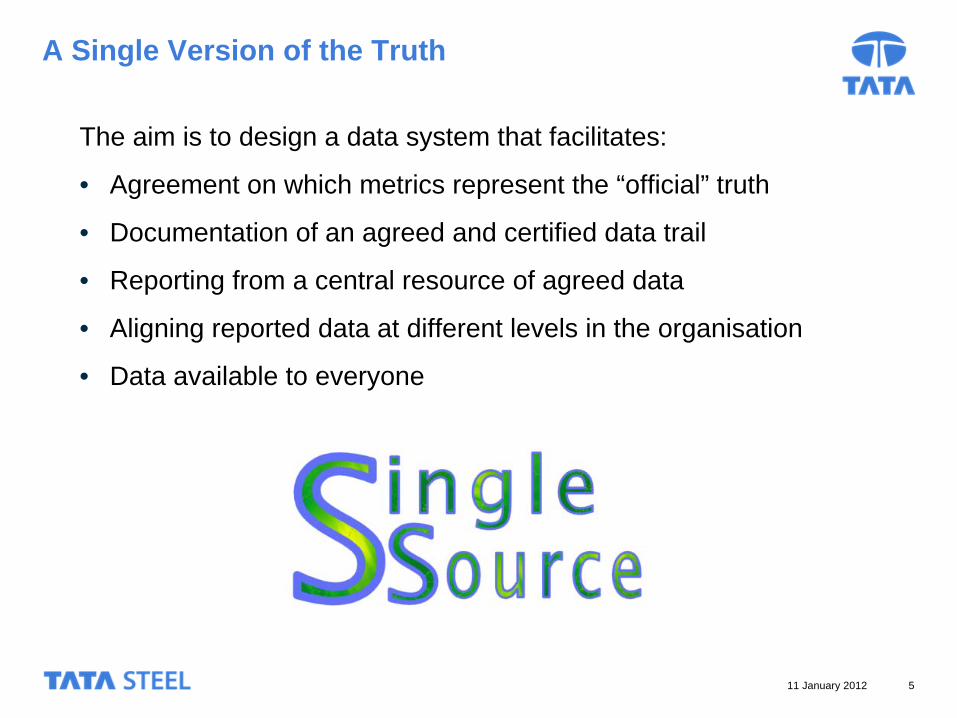
A Single Version of the Truth
The aim is to design a data system that facilitates:
• Agreement on which metrics represent the “official” truth
• Documentation of an agreed and certified data trail
• Reporting from a central resource of agreed data
• Aligning reported data at different levels in the organisation
• Data available to everyone

11 January 2012 6
Towards Single Source - Step #1: Traffic Lights
Targets give meaning to values
Operational data, local impact
11 January 2012 7
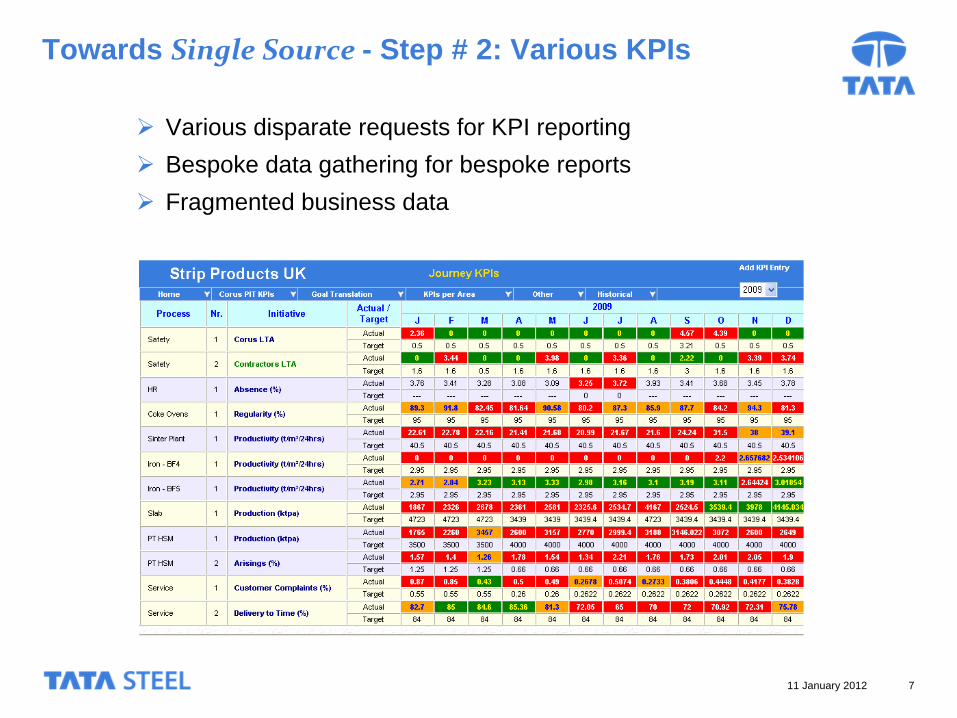
Towards Single Source - Step # 2: Various KPIs
Various disparate requests for KPI reporting
Bespoke data gathering for bespoke reports
Fragmented business data
11 January 2012 8
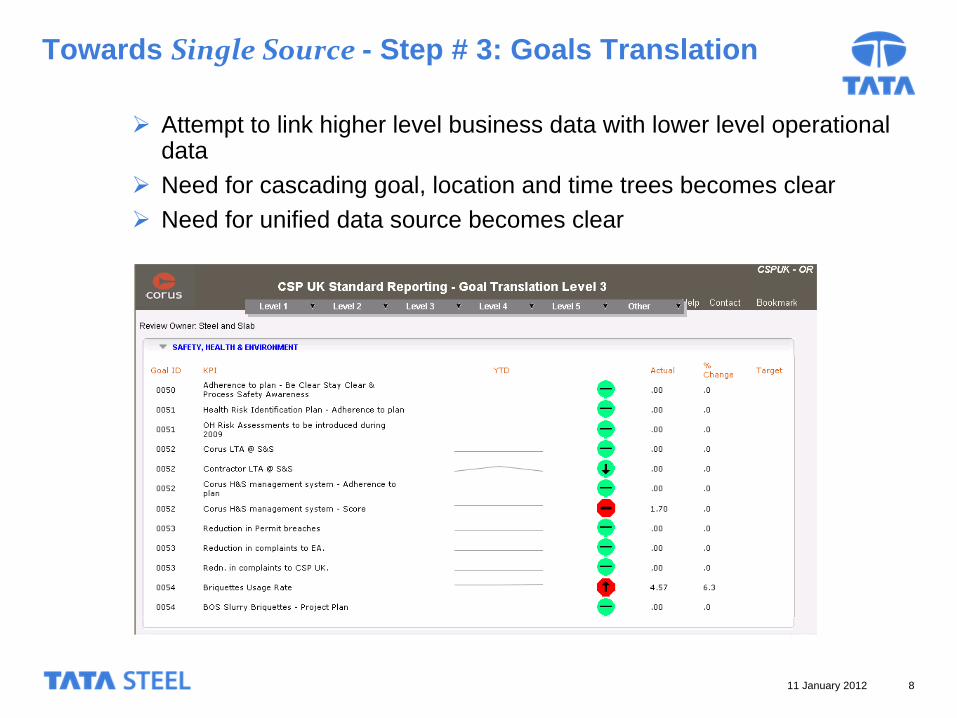
Towards Single Source - Step # 3: Goals Translation
Attempt to link higher level business data with lower level operational data
Need for cascading goal, location and time trees becomes clear
Need for unified data source becomes clear

11 January 2012 9
The Key Components of Single Source
• Key Figures and KPIs
• Targets
• Dimensions
• Dashboards
• User-defined content
• Ownership at every level (key figure definition, key figure content, KPI definition, dashboard content, dashboard improvement, goal setting, goal improvement, …)
11 January 2012 10
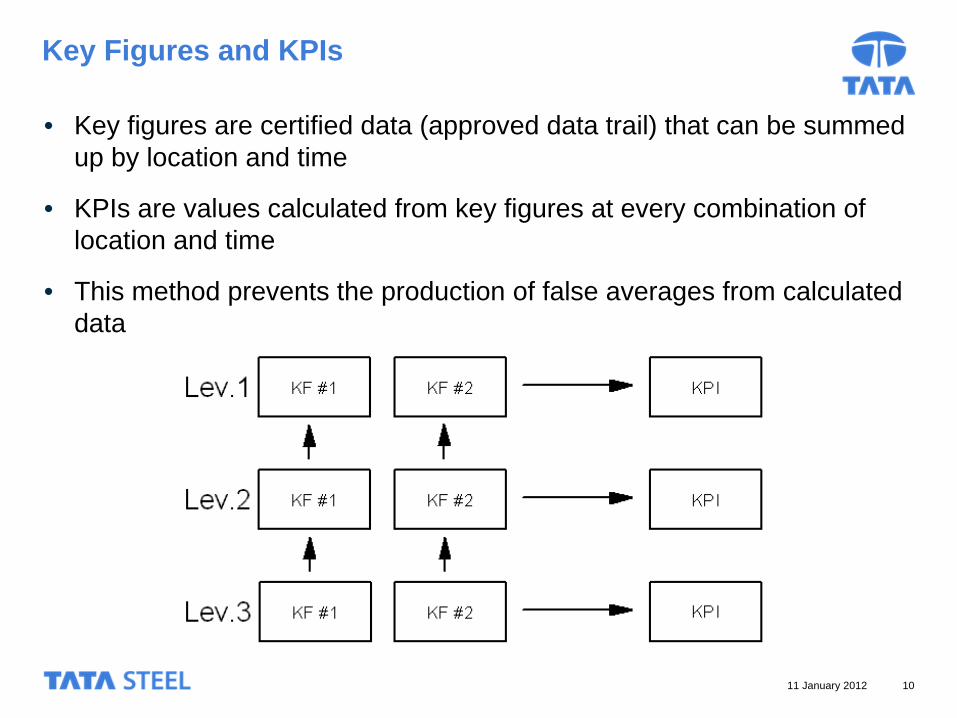
Key Figures and KPIs
• Key figures are certified data (approved data trail) that can be summed up by location and time
• KPIs are values calculated from key figures at every combination of location and time
• This method prevents the production of false averages from calculated data

11 January 2012 11
Targets
• Targets are allocated to KPIs for a given location / time combination against a given target type
• Various types of target : red/amber/green, annual plan, benchmark, SPC mean, forecast
• Various classes of target : variable, constant, constant by time, constant by location, linear interpolation of end-of-year target

11 January 2012 12
Dimensions
• Dimensions help connect key figures, KPIs and, in the case of strategy deployment, goals at different levels in the data structure
• This connection ensures that values at different levels are aligned through a process of “rolling up”
Goal dimension:
Level 4 Level 3 Level 2 Level 1
Time dimension:
Day Week Month Quarter Year
Location dimension:
Coke Ovens Raw Materials Coke Sinter & Iron Port Talbot
11 January 2012 13
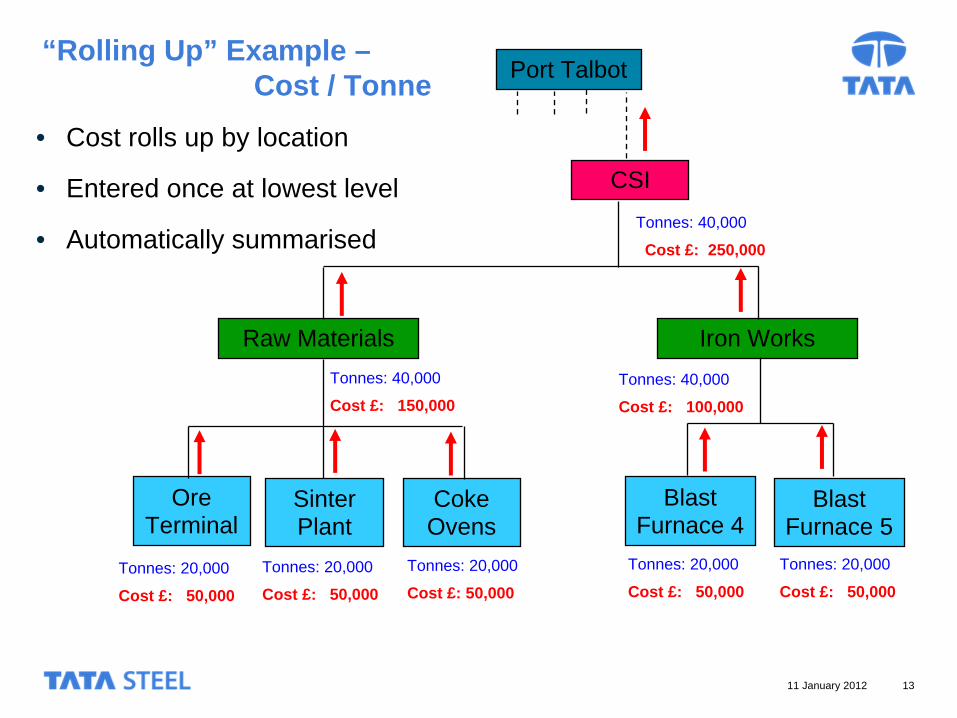
“Rolling Up” Example – Cost / Tonne
• Cost rolls up by location
• Entered once at lowest level
• Automatically summarised
Ore Terminal
Raw Materials
Tonnes: 20,000
Cost £: 50,000
Sinter Plant
Coke Ovens
Blast Furnace 4
Blast Furnace 5
Iron Works
Tonnes: 20,000
Cost £: 50,000
Tonnes: 20,000
Cost £: 50,000
Tonnes: 20,000
Cost £: 50,000Tonnes: 20,000
Cost £: 50,000
Tonnes: 40,000
Cost £: 150,000Tonnes: 40,000
Cost £: 100,000
CSITonnes: 40,000
Cost £: 250,000
Port Talbot

11 January 2012 14
“Rolling Up” Example – Cost / Tonne
• Tonnes don’t roll up by location
• Entered at every level
• Figure used is business decision
Ore Terminal
Raw Materials
Tonnes: 20,000
Cost £: 50,000
Sinter Plant
Coke Ovens
Blast Furnace 4
Blast Furnace 5
Iron Works
Tonnes: 20,000
Cost £: 50,000
Tonnes: 20,000
Cost £: 50,000
Tonnes: 20,000
Cost £: 50,000
Tonnes: 20,000
Cost £: 50,000
Tonnes: 40,000
Cost £: 150,000
Tonnes: 40,000
Cost £: 100,000
CSITonnes: 40,000
Cost £: 250,000
Port Talbot
+
11 January 2012 15
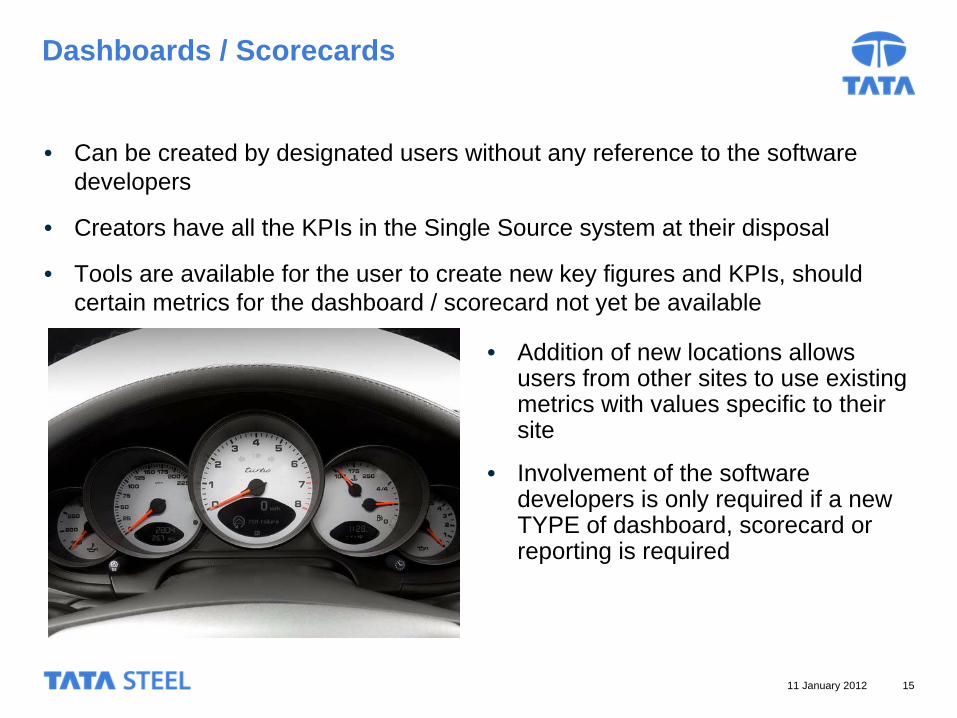
Dashboards / Scorecards
• Can be created by designated users without any reference to the software developers
• Creators have all the KPIs in the Single Source system at their disposal
• Tools are available for the user to create new key figures and KPIs, should certain metrics for the dashboard / scorecard not yet be available
• Addition of new locations allows users from other sites to use existing metrics with values specific to their site
• Involvement of the software developers is only required if a new TYPE of dashboard, scorecard or reporting is required

11 January 2012 16
Example #1 : Executive Dashboard
• High level overview for a given time period, with drilldown
11 January 2012 17
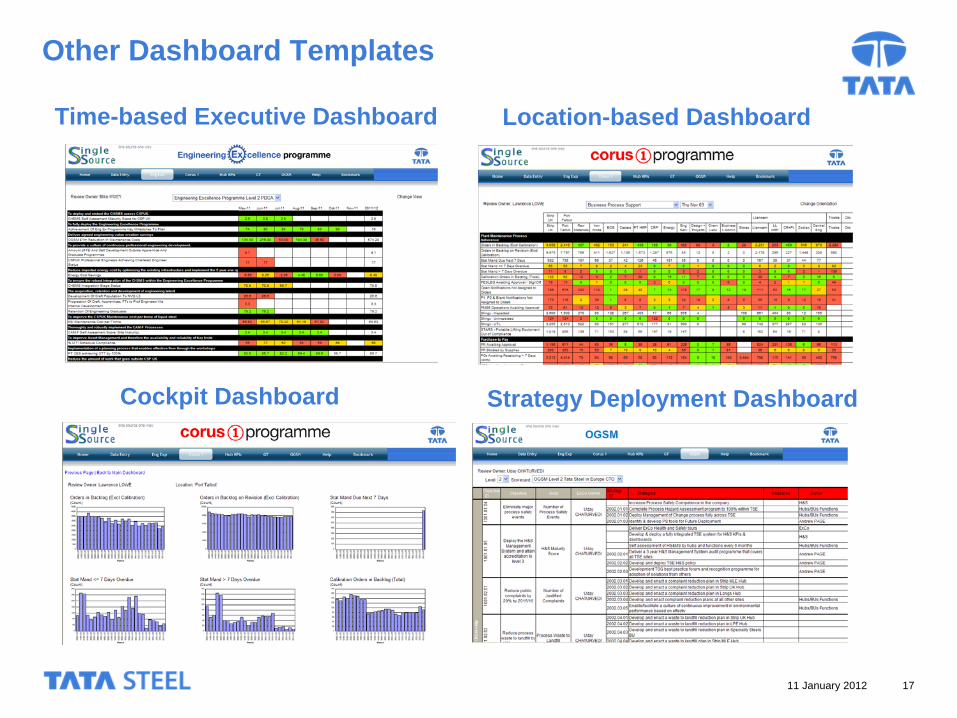
Other Dashboard Templates
Time-based Executive Dashboard Location-based Dashboard
Cockpit Dashboard Strategy Deployment Dashboard

11 January 2012 18
User-defined Content
• User type 1 - general user : can add comments to KPIs, enter key values (if designated to do so) and set targets (if designated to do so)
• User type 2 – editor : can request key figures and KPIs, create dashboards and themes for location-based dashboards
• User type 3 – special editor : can create new goals
• User type 4 – data administrator : can vet requested key figures and KPIs, and promote to their appropriate scope (local, business or group)
• User type 5 – system administrator : software developers
Each user type also has the access rights of the user types of lower rank (Russian doll user model)

11 January 2012 19
Ownership at Every Level
• Ownership gives the users control over the content within the framework set by the developers, e.g. :
• Defining key figures and KPIs• Manual entry of key values• Approving and scoping key figures and KPIs• Setting KPI targets
• Different meanings of the word “Owner”
• Dashboard owner• Dashboard facilitator• Dashboard content availability• Dashboard content improvement
11 January 2012 20
Tools of the Trade
• Data storage on SQL 2008 Server
Provisional plan to move the data to an Oracle space
• All data entry systems use Visual Studio 2010 websites on a Windows 2003 R2 web server
• Data feeds into the Single Source system can happen using manual entry, SQL auto-feed, SAP query or WebFOCUS query
• Conversion of key figures into KPIs through WebFOCUS 7.6.5 automated and scheduled jobs
• All business reporting systems performed using WebFOCUS 7.6.5 on Strip Product UK’s Data Warehouse server
11 January 2012 21
What’s New ? (to us, at least)
• Rapid iterative development cycles, with continuous feedback between user and developer
• Quasi-independent side-by-side development of data layer and reporting layer
• Dimensions enable consistency between different levels of the reporting system through roll-up within Single Source
• Built with expansion in mind
Use in other sites within Tata Steel in Europe
Use in different reporting environments• By default, data are visible to everyone (unless there’s business case for
hiding the information from the general viewer)

11 January 2012 22
Our brand of “Agile”
• Always keep track of the end goal (central resource of certified data in the public domain)
Allow diversions from the direct path to the end goal, but always remember to return to the true direction
• “Soft” planning for activities in the more distant future, hardens into more concrete actions as they come closer to implementation
• Continuous user interaction
From an early stage the user is a constant beta tester
Plan for user requirements that grow / morph over time
Developer should try to think as a user, and plan for future extensions

11 January 2012 23
Benefits to the Business
•
Single Source
has enabled the Engineering Excellence Program to effectively communicate with all levels of the organisation
• Having data available while developing the business process helped determine the true requirements
• The cross-functional team were able to create a common approach supported by business leaders and engaging local users
• The successful implementation of this project has led to it being rolled out across other Tata Steel businesses in the UK
•
Single Source
is now working towards applying the lessons learnt in the Engineering Excellence project in a similar strategy deployment programme for other business areas
11 January 2012 24
The Future
• Continued application of Single Source in new applications, thereby making the separate data collection step for feeding the applications superfluous - e.g. AMP³, RPM, Lowest Cost Route …
• Where there is a common business reporting need, use of Single Source to bring the joint data for all sites together
• Creation of a Data Factory (which would incorporate the Single Source key figures) to support reporting, data mining and ad-hoc queries (of which Single Source dashboards are a special case)

Any Questions ?