Marktausblick für Rostfreie Stähle -...
39
© Copyright SMR GmbH 2016 www.smr.at -0- Marktausblick für Rostfreie Stähle Fokus auf Europa u nd Deutschland © SMR GmbH - Steel & Metals Market Research This data collection may not be copied, published or disclosed to third parties without the permission of SMR GmbH. Edelstahl Rostfrei Convent 2016 28 st January 2016 Essen, Germany presented by Markus A. Moll Managing Director Steel & Metals Market Research
Transcript of Marktausblick für Rostfreie Stähle -...
© Copyright SMR GmbH 2016
www.smr.at- 0 -
Marktausblick für Rostfreie Stähle
Fokus auf Europa und Deutschland
© SMR GmbH - Steel & Metals Market Research
This data collection may not be copied, published or disclosed to third parties without the permission of SMR GmbH.
Edelstahl Rostfrei Convent 201628st January 2016
Essen, Germany
presented by
Markus A. Moll
Managing Director
Steel & Metals Market Research
© Copyright SMR GmbH 2016
www.smr.at- 1 -C
ON
FE
RE
NC
ES
2016
PR
OJE
CT
S
2014
Austria
GR
OU
P / T
EA
M /
LO
CA
TIO
N
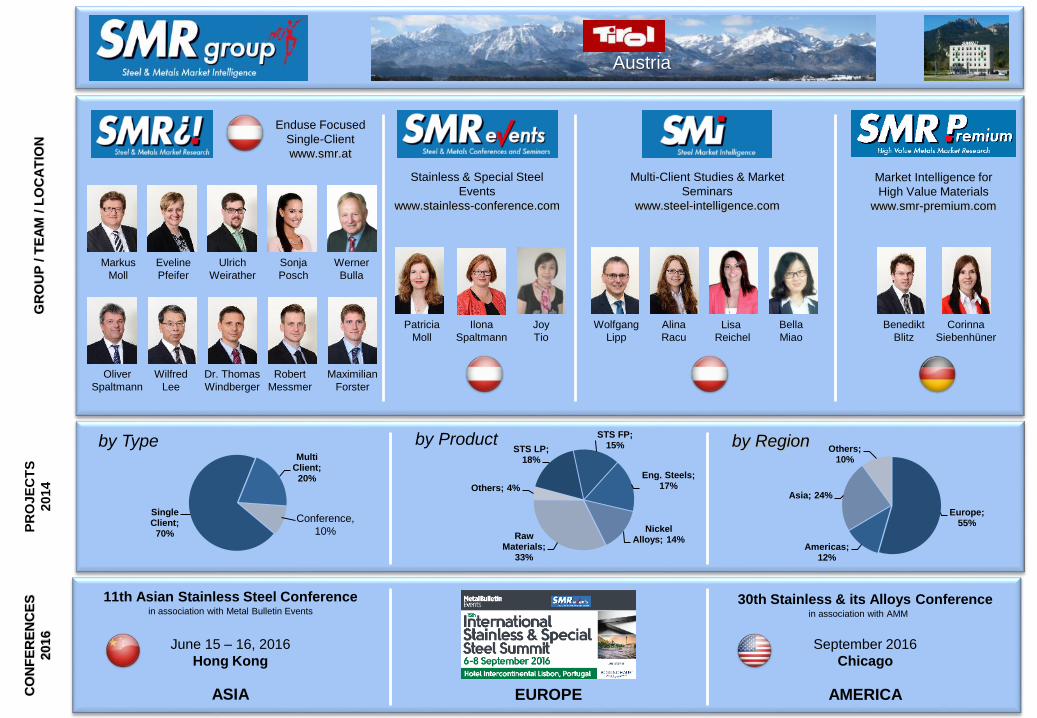
by Type by Regionby ProductSTS LP;
18%
STS FP; 15%
Eng. Steels; 17%
Nickel Alloys; 14%Raw
Materials; 33%
Others; 4%
Europe; 55%
Americas; 12%
Asia; 24%
Others; 10%
Single Client;
70%
Multi Client;
20%
Conference,
10%
Benedikt
Blitz
Wolfgang
Lipp
Alina
Racu
Patricia
Moll
Ilona
Spaltmann
Joy
Tio
Enduse Focused
Single-Client
www.smr.at
Multi-Client Studies & Market
Seminars
www.steel-intelligence.com
Stainless & Special Steel
Events
www.stainless-conference.com
Corinna
Siebenhüner
Market Intelligence for
High Value Materials
www.smr-premium.com
Oliver
Spaltmann
Dr. Thomas
Windberger
Eveline
Pfeifer
Markus
Moll
Sonja
Posch
Ulrich
Weirather
Robert
Messmer
Wilfred
Lee
Werner
Bulla
Maximilian
Forster
Lisa
Reichel
Bella
Miao
ASIA EUROPE AMERICA
in association with Metal Bulletin Events
June 15 – 16, 2016
Hong Kong
11th Asian Stainless Steel Conferencein association with AMM
September 2016
Chicago
30th Stainless & its Alloys Conference

© Copyright SMR GmbH 2016
www.smr.at- 2 -
Fahrplan
1. Überblick
2. Blick auf Deutschland
3. Ausblick 2016
4. China – Eine Zeitbombe?
5. Fokus auf Rohstoffe

© Copyright SMR GmbH 2016
www.smr.at- 3 -
CAGR 1950 – 2015e:
5 % p.a.
Deflated 304 price
(Index base since 1967)
100 Years of Success …Stainless Crude Steel Production vs. Price
© Copyright SMR GmbH 2016
www.smr.at- 4 -
-
300
600
900
1.200
1.500
1.800
2.100
2.400
2.700
3.000
3.300
3.600
3.900
4.200
4.500
[‘0
00
to
nn
es
]
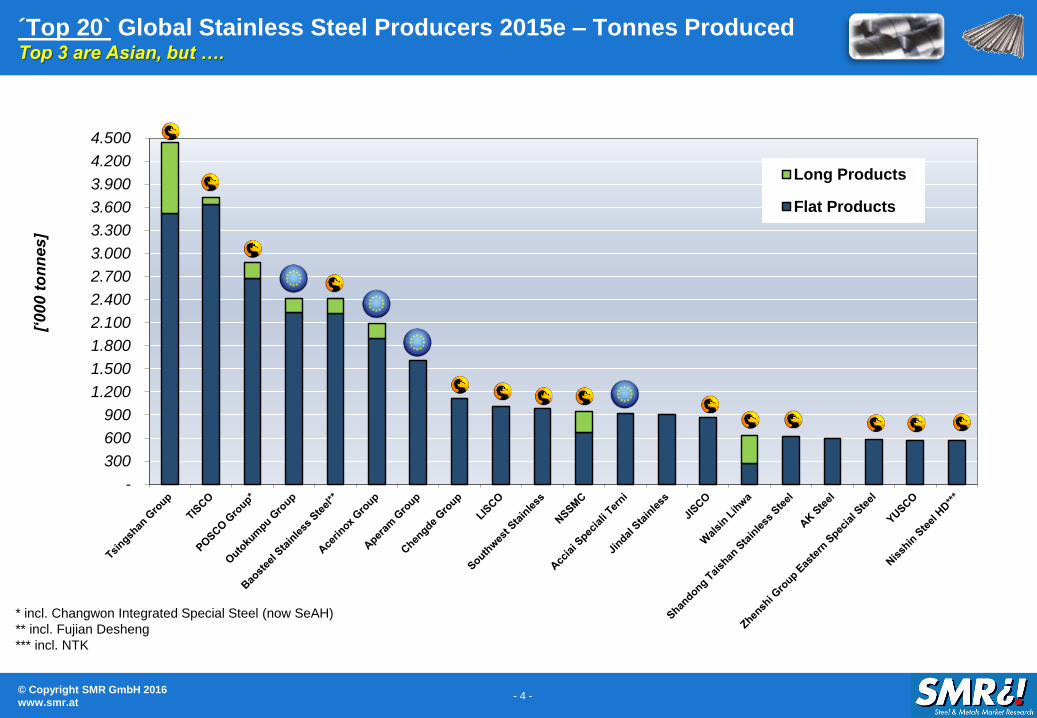
Long Products
Flat Products
´Top 20` Global Stainless Steel Producers 2015e – Tonnes ProducedTop 3 are Asian, but ….
* incl. Changwon Integrated Special Steel (now SeAH)
** incl. Fujian Desheng
*** incl. NTK
© Copyright SMR GmbH 2016
www.smr.at- 5 -
-
1.000
2.000
3.000
4.000
5.000
6.000
7.000
8.000
9.000
Rev
en
ue [
mill U
SD
]
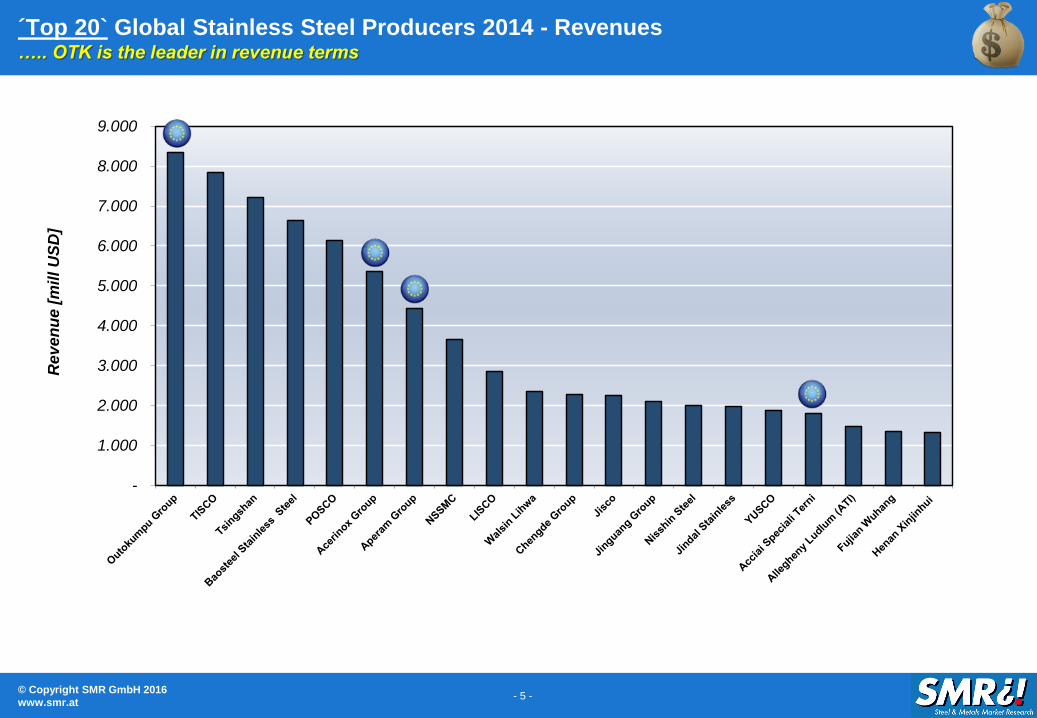
´Top 20` Global Stainless Steel Producers 2014 - Revenues….. OTK is the leader in revenue terms
© Copyright SMR GmbH 2016
www.smr.at- 6 -
1.500
2.000
2.500
3.000
3.500
4.000
4.500
5.000
[EU
R/t
on
ne
]
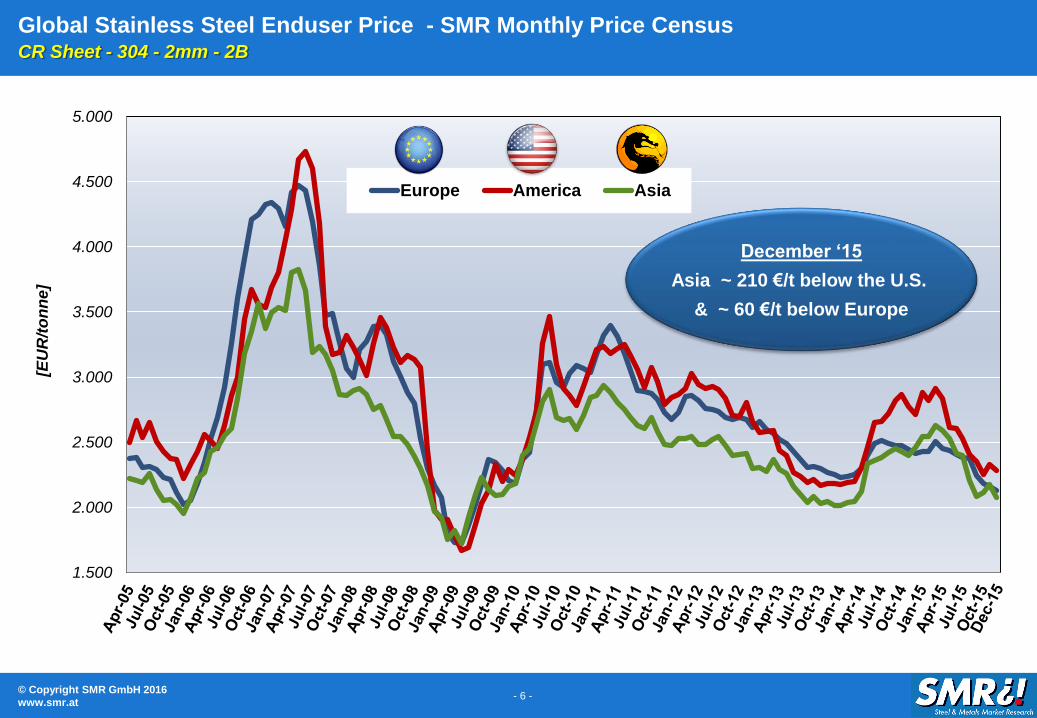
Europe America Asia
Global Stainless Steel Enduser Price - SMR Monthly Price CensusCR Sheet - 304 - 2mm - 2B
December ‘15
Asia ~ 210 €/t below the U.S.
& ~ 60 €/t below Europe

© Copyright SMR GmbH 2016
www.smr.at- 7 -
Stainless Steel Long Products: European* Market Volume 2000 – 2015e
0%
2%
4%
6%
8%
10%
12%
14%
16%
18%
20%
22%
24%
26%
28%
30%
-
150
300
450
600
750
900
1.050
1.200
1.350
1.500
2000 2001 2002 2003 2004 2005 2006 2007 2008 2009 2010 2011 2012 2013 2014 2015e
Imp
ort
Pe
ne
tra
tio
n
[ ´0
00 m
etr
ic t
on
ne
s]
European Demand external Imports Import Penetration
* incl. Turkey
Included:
for Demand: - Hot rolled bars - Forged bars - Wire rod
for Imports: - Hot rolled bars - Forged bars - Wire rod - Wire - Bright bars - Profiles
© Copyright SMR GmbH 2016
www.smr.at- 8 -
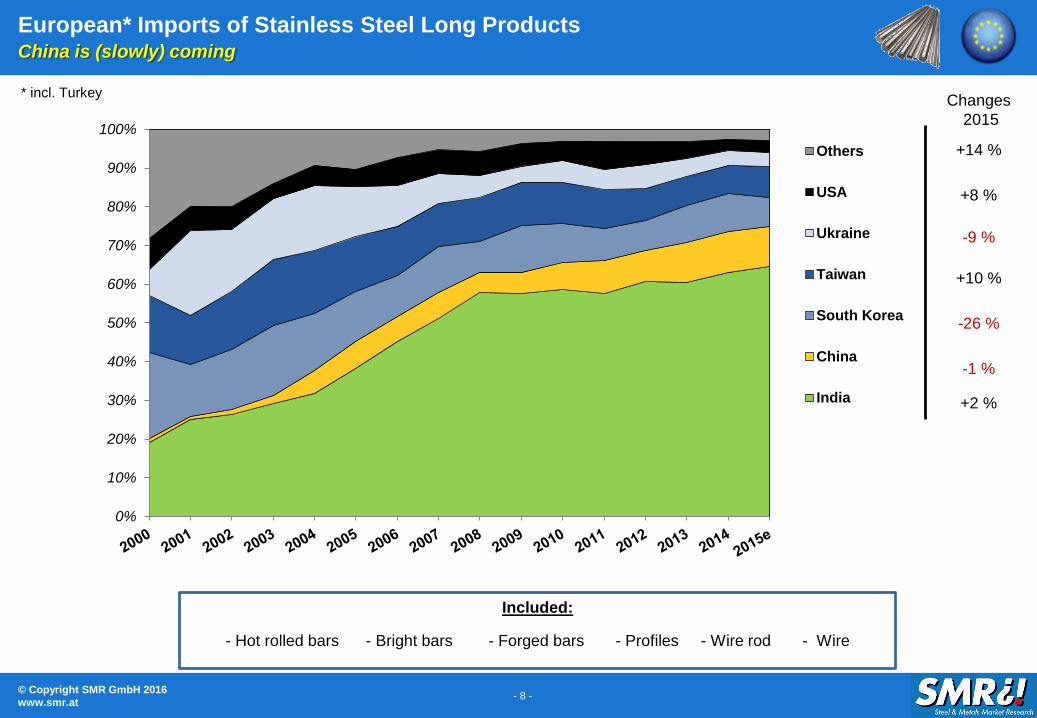
European* Imports of Stainless Steel Long ProductsChina is (slowly) coming
* incl. Turkey
0%
10%
20%
30%
40%
50%
60%
70%
80%
90%
100%
Others
USA
Ukraine
Taiwan
South Korea
China
India
Included:
- Hot rolled bars - Bright bars - Forged bars - Profiles - Wire rod - Wire
Changes
2015
+2 %
-1 %
-26 %
+10 %
-9 %
+8 %
+14 %

© Copyright SMR GmbH 2016
www.smr.at- 9 -
Stainless Steel Flat Products: European* Market Volume 2000 – 2015p
0%
2%
4%
6%
8%
10%
12%
14%
16%
18%
20%
22%
24%
26%
28%
-
500
1.000
1.500
2.000
2.500
3.000
3.500
4.000
4.500
5.000
5.500
6.000
2000 2001 2002 2003 2004 2005 2006 2007 2008 2009 2010 2011 2012 2013 2014 2015e
Imp
ort
Pe
ne
trati
on
[ ´0
00
m
etr
ic t
on
nes
]
European Demand Imports Import Penetration
Inklusive:
- HRC - Plate - CRC
* incl. Turkey
© Copyright SMR GmbH 2016
www.smr.at- 10 -
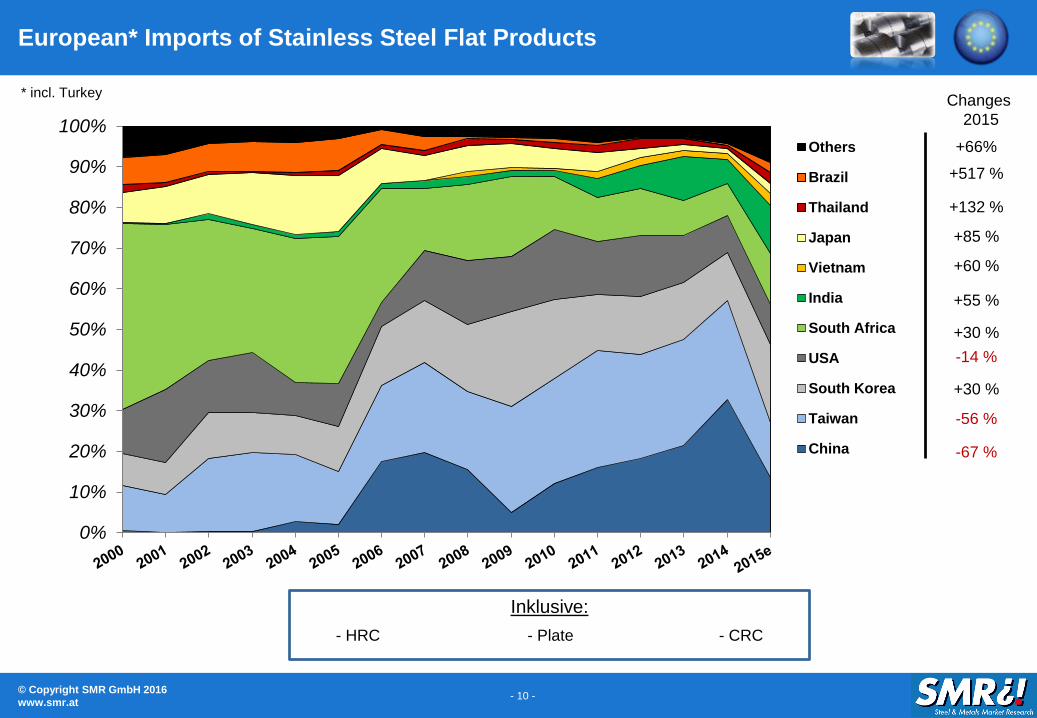
European* Imports of Stainless Steel Flat Products
0%
10%
20%
30%
40%
50%
60%
70%
80%
90%
100%Others
Brazil
Thailand
Japan
Vietnam
India
South Africa
USA
South Korea
Taiwan
China
* incl. Turkey
Inklusive:
- HRC - Plate - CRC
Changes
2015
-14 %
+30 %
+55 %
+60 %
+85 %
+517 %
+66%
+132 %
+30 %
-56 %
-67 %
© Copyright SMR GmbH 2016
www.smr.at- 11 -
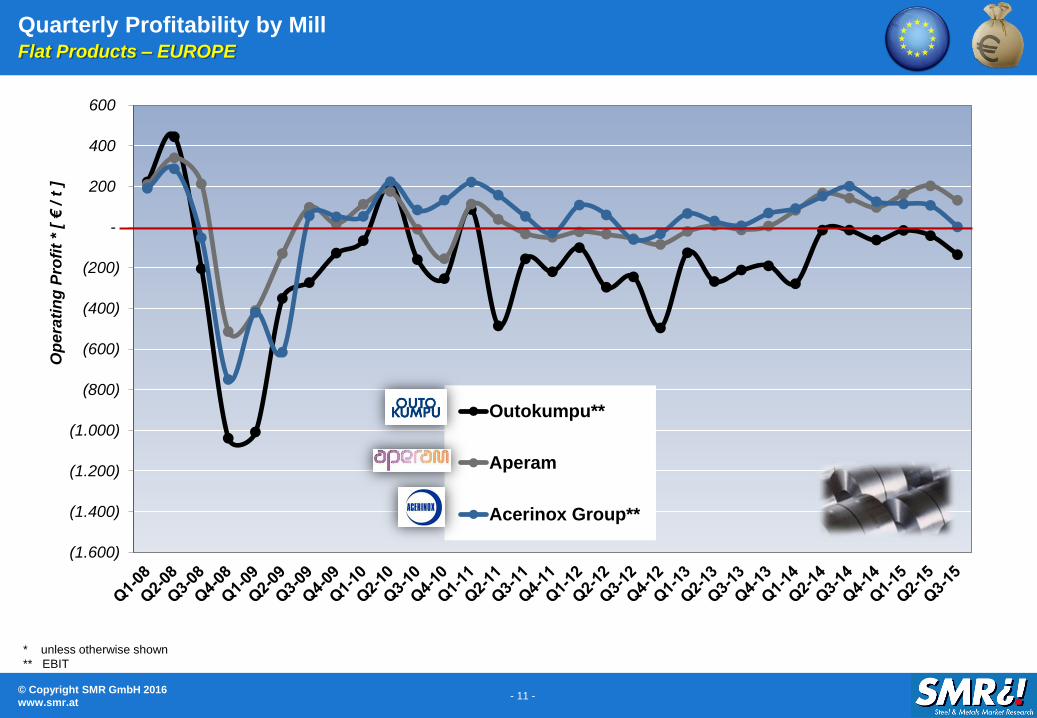
Quarterly Profitability by MillFlat Products – EUROPE
(1.600)
(1.400)
(1.200)
(1.000)
(800)
(600)
(400)
(200)
-
200
400
600
Op
era
tin
g P
rofi
t *
[ €
/ t
]
Outokumpu**
Aperam
Acerinox Group**
* unless otherwise shown
** EBIT
© Copyright SMR GmbH 2016
www.smr.at- 12 -
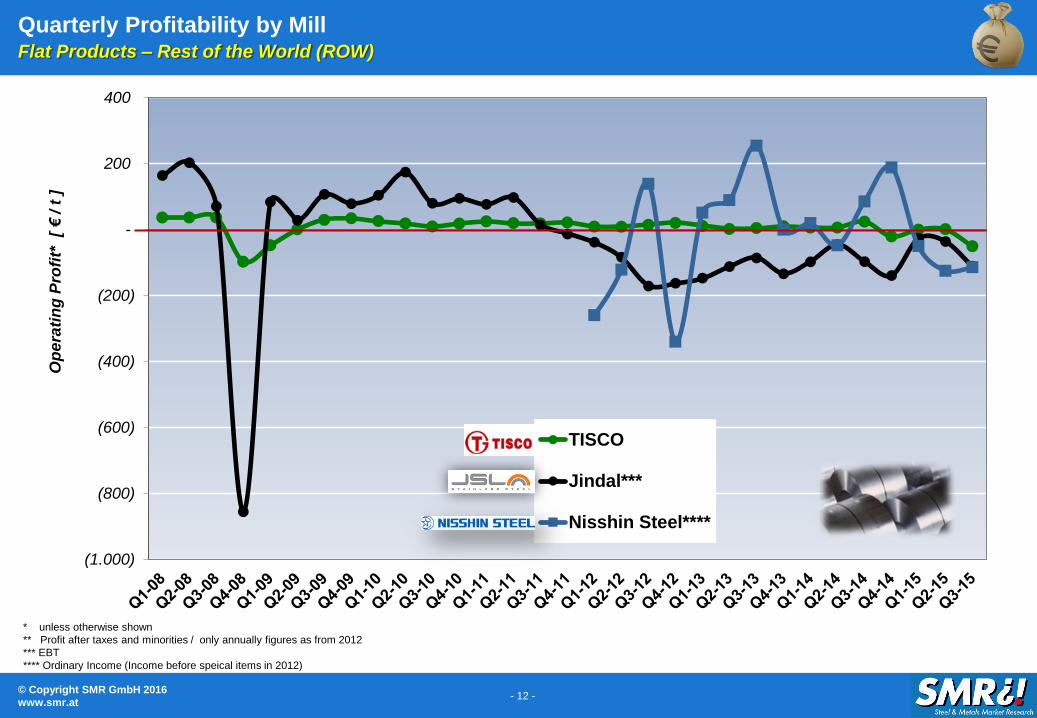
Quarterly Profitability by MillFlat Products – Rest of the World (ROW)
(1.000)
(800)
(600)
(400)
(200)
-
200
400
Op
era
tin
g P
rofi
t*
[ €
/ t
]
TISCO
Jindal***
Nisshin Steel****
* unless otherwise shown
** Profit after taxes and minorities / only annually figures as from 2012
*** EBT
**** Ordinary Income (Income before speical items in 2012)
© Copyright SMR GmbH 2016
www.smr.at- 13 -
Table of Contents
1. Overview
2. Focus on Germany
3. Outlook 2016
4. China – A ticking bomb?
5. Focus on Raw Materials

© Copyright SMR GmbH 2016
www.smr.at- 14 -
Long Term Apperant Consumption 1991 – 2015eAll Product Forms
- 14 -
800
1.000
1.200
1.400
1.600
1.800
2.000
[ in
To
nn
en
]
Long Term Growth:
+ 1.5%
Apparent Consumption = Production + Imports - Exports
Price Peak
(Upstocking)Recession
(2. Gulf War)
Financal
Crisis
Nickel
Bubble
Bursts
Massive
Upstocking
Recession
(1. Gulf War)
Economic
BoomPre-Crisis
Level
© Copyright SMR GmbH 2016
www.smr.at- 15 -
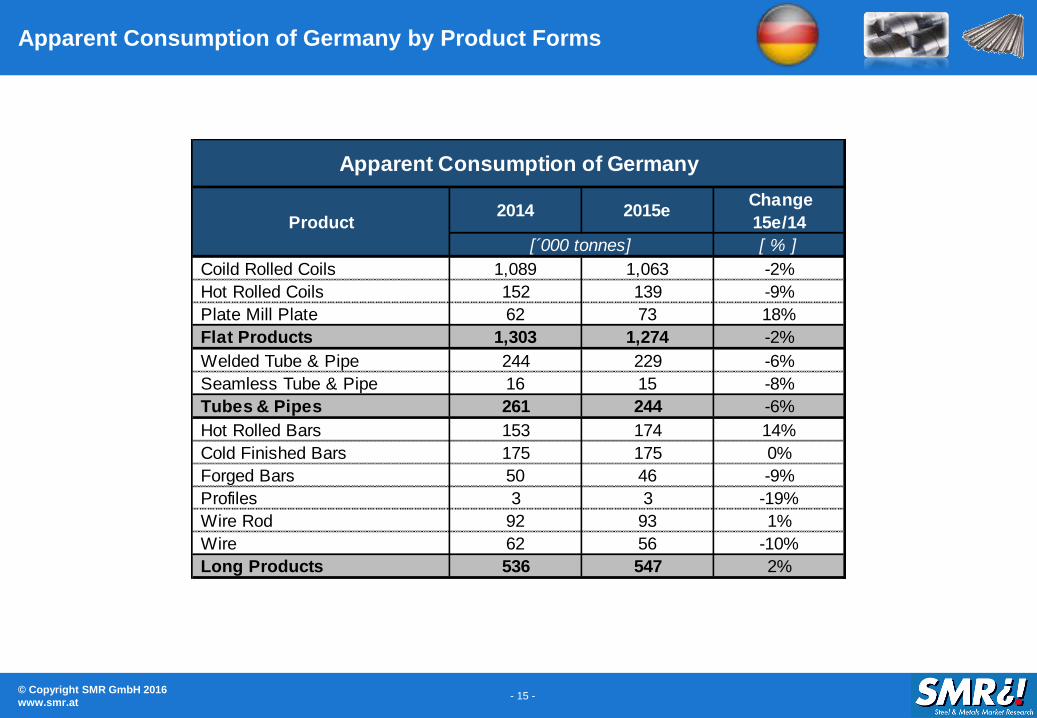
Apparent Consumption of Germany by Product Forms
[ % ]
Coild Rolled Coils 1,089 1,063 -2%
Hot Rolled Coils 152 139 -9%
Plate Mill Plate 62 73 18%
Flat Products 1,303 1,274 -2%
Welded Tube & Pipe 244 229 -6%
Seamless Tube & Pipe 16 15 -8%
Tubes & Pipes 261 244 -6%
Hot Rolled Bars 153 174 14%
Cold Finished Bars 175 175 0%
Forged Bars 50 46 -9%
Profiles 3 3 -19%
Wire Rod 92 93 1%
Wire 62 56 -10%
Long Products 536 547 2%
Apparent Consumption of Germany
Product2014 2015e
Change
15e/14
[´000 tonnes]
© Copyright SMR GmbH 2016
www.smr.at- 16 -
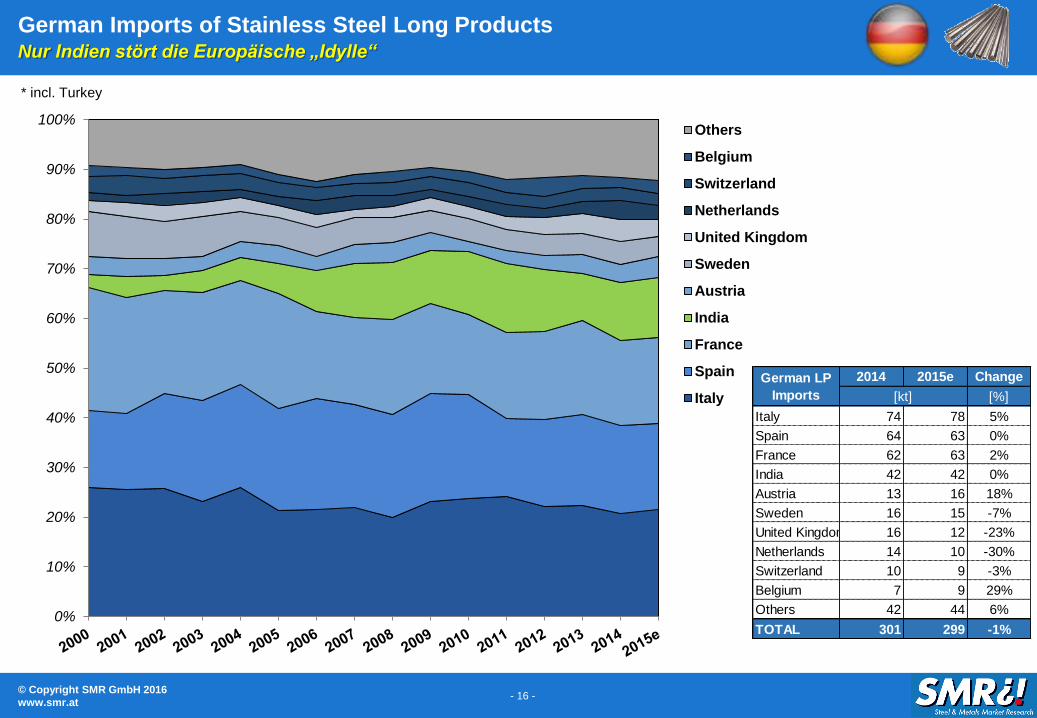
German Imports of Stainless Steel Long ProductsNur Indien stört die Europäische „Idylle“
0%
10%
20%
30%
40%
50%
60%
70%
80%
90%
100%Others
Belgium
Switzerland
Netherlands
United Kingdom
Sweden
Austria
India
France
Spain
Italy
* incl. Turkey
2014 2015e Change
[%]
Italy 74 78 5%
Spain 64 63 0%
France 62 63 2%
India 42 42 0%
Austria 13 16 18%
Sweden 16 15 -7%
United Kingdom 16 12 -23%
Netherlands 14 10 -30%
Switzerland 10 9 -3%
Belgium 7 9 29%
Others 42 44 6%
TOTAL 301 299 -1%
German LP
Imports [kt]

© Copyright SMR GmbH 2016
www.smr.at- 17 -
German Imports of Stainless Steel Flat ProductsOTK liefert zunehmend aus den Niederlanden (Terneuzen)
0%
10%
20%
30%
40%
50%
60%
70%
80%
90%
100%Others
Sweden
Finland
Spain
Italy
France
Netherlands
Belgium
2014 2015e Change
[%]
Belgium 347 344 -1%
Netherlands 221 305 38%
France 151 195 29%
Italy 135 139 3%
Spain 107 115 8%
Finland 59 55 -6%
Sweden 47 49 4%
Others 160 159 -1%
TOTAL 1,227 1,362 11%
German FP
Imports [kt]
* incl. Turkey
© Copyright SMR GmbH 2016
www.smr.at- 18 -
Table of Contents
1. Overview
2. Focus on Germany
3. Outlook 2016
4. China – A ticking bomb?
5. Focus on Raw Materials

© Copyright SMR GmbH 2016
www.smr.at- 19 -
Purchasing Manager Index - Where do we stand in the business cycle?Die erste IFO indikation für 2016 zeigt eine deutliche verlangsamung in Deutschland
25
30
35
40
45
50
55
60
65
Ind
ex o
f 50 =
‘B
rea
k E
ven
Po
int’
EU USA China Germany
* below 50 the industry contracts / above 50 it is expected to expand
48
49
50
51
52
53
54
55
56
57
58
59
© Copyright SMR GmbH 2016
www.smr.at- 20 -
-
20
40
60
80
100
120
140
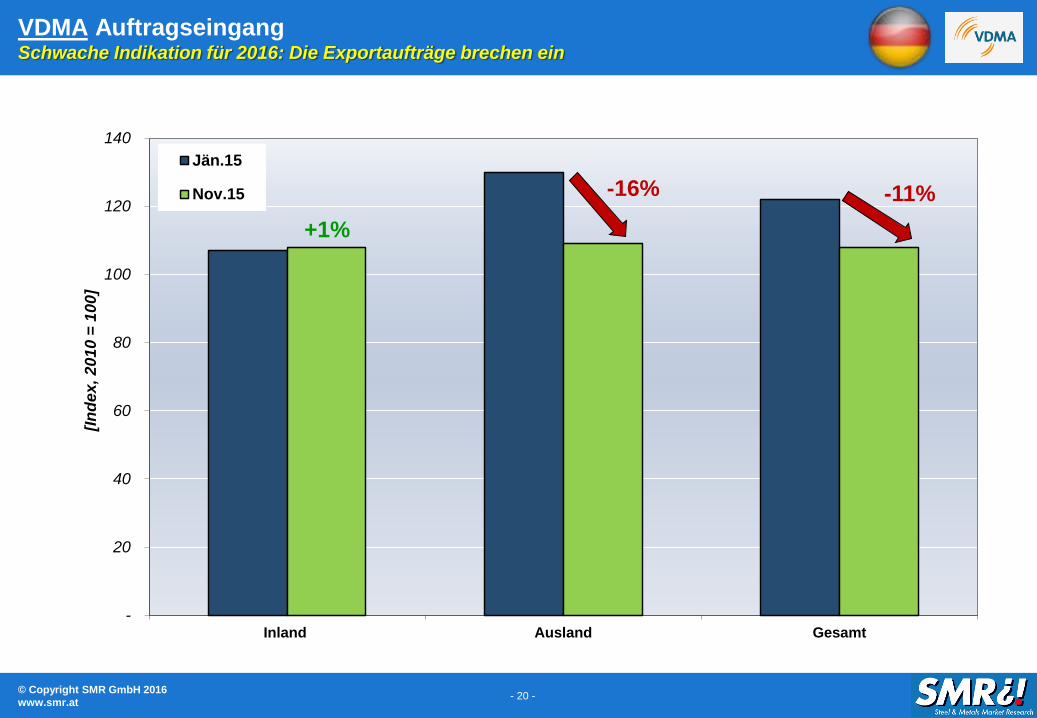
Inland Ausland Gesamt
[In
dex
, 2
01
0 =
10
0]
Jän.15
Nov.15
VDMA AuftragseingangSchwache Indikation für 2016: Die Exportaufträge brechen ein
+1%
-16% -11%
© Copyright SMR GmbH 2016
www.smr.at- 21 -
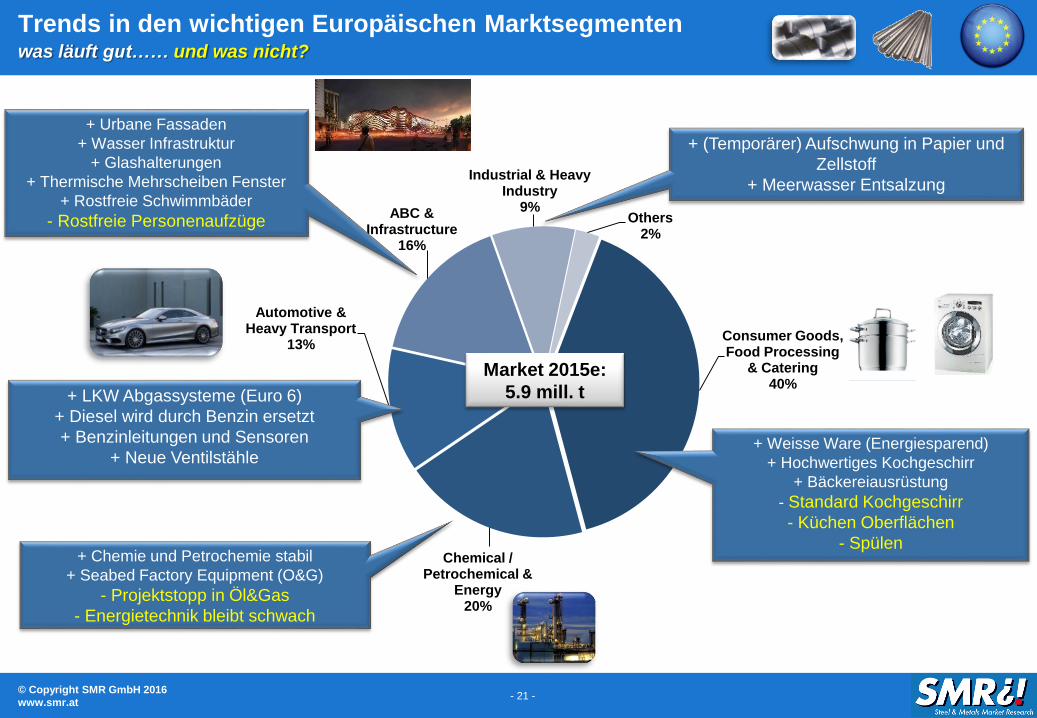
Consumer Goods, Food Processing
& Catering40%
Chemical / Petrochemical &
Energy20%
Automotive & Heavy Transport
13%
ABC & Infrastructure
16%
Industrial & Heavy Industry
9%Others
2%
Trends in den wichtigen Europäischen Marktsegmentenwas läuft gut…… und was nicht?
+ Weisse Ware (Energiesparend)
+ Hochwertiges Kochgeschirr
+ Bäckereiausrüstung
- Standard Kochgeschirr
- Küchen Oberflächen
- Spülen+ Chemie und Petrochemie stabil
+ Seabed Factory Equipment (O&G)
- Projektstopp in Öl&Gas
- Energietechnik bleibt schwach
+ Urbane Fassaden
+ Wasser Infrastruktur
+ Glashalterungen
+ Thermische Mehrscheiben Fenster
+ Rostfreie Schwimmbäder
- Rostfreie Personenaufzüge
+ (Temporärer) Aufschwung in Papier und
Zellstoff
+ Meerwasser Entsalzung
+ LKW Abgassysteme (Euro 6)
+ Diesel wird durch Benzin ersetzt
+ Benzinleitungen und Sensoren
+ Neue Ventilstähle
Market 2015e:
5.9 mill. t

© Copyright SMR GmbH 2016
www.smr.at- 22 -
-
100
200
300
400
500
600
700
800
900
1.000
1.100
1.200
[ '0
00
to
nn
es
]
Sinks & Construction Components
Exhaust Systems / O. Transport.
Small Appliances / Lifestyle Products
Heat Exchangers / O. Process Equip.
Tubes
Wire Products
Cutlery
Flow Control
Fasteners
Appliances
Catering & Utensils
Offshoring EuropeGute Neuigkeiten: Die Marktverlagerung nach Asien hat sich deutlich verlangsamt (schwacher Euro)
Langzeittrend +6% p.a.
© Copyright SMR GmbH 2016
www.smr.at- 23 -
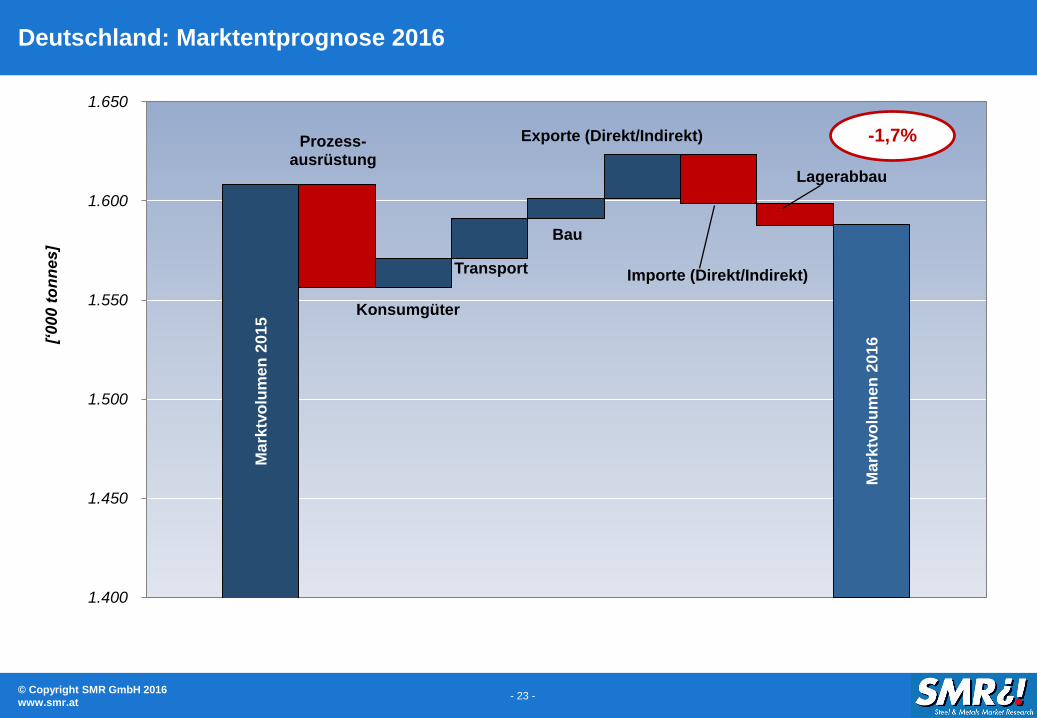
Deutschland: Marktentprognose 2016
Ma
rktv
olu
me
n 2
01
6
Ma
rktv
olu
me
n2
01
5
Prozess-ausrüstung
Konsumgüter
Transport
Bau
Exporte (Direkt/Indirekt)
Importe (Direkt/Indirekt)
Lagerabbau
1.400
1.450
1.500
1.550
1.600
1.650
[‘0
00
to
nn
es
]
-1,7%

© Copyright SMR GmbH 2016
www.smr.at- 24 -
Table of Contents
1. Overview
2. Focus on Germany
3. Outlook 2016
4. China – Eine Zeitbombe?
5. Focus on Raw Materials
© Copyright SMR GmbH 2016
www.smr.at- 25 -
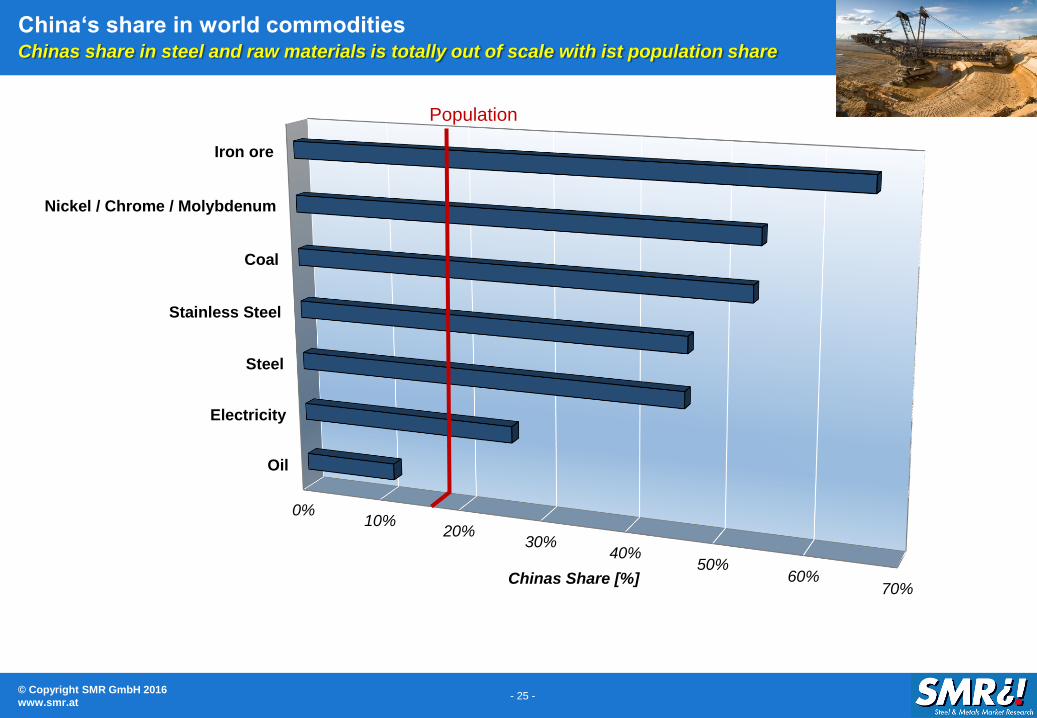
China‘s share in world commoditiesChinas share in steel and raw materials is totally out of scale with ist population share
0%10%
20%30%
40%50%
60%70%
Oil
Electricity
Steel
Stainless Steel
Coal
Nickel / Chrome / Molybdenum
Iron ore
Chinas Share [%]
Population
© Copyright SMR GmbH 2016
www.smr.at- 26 -
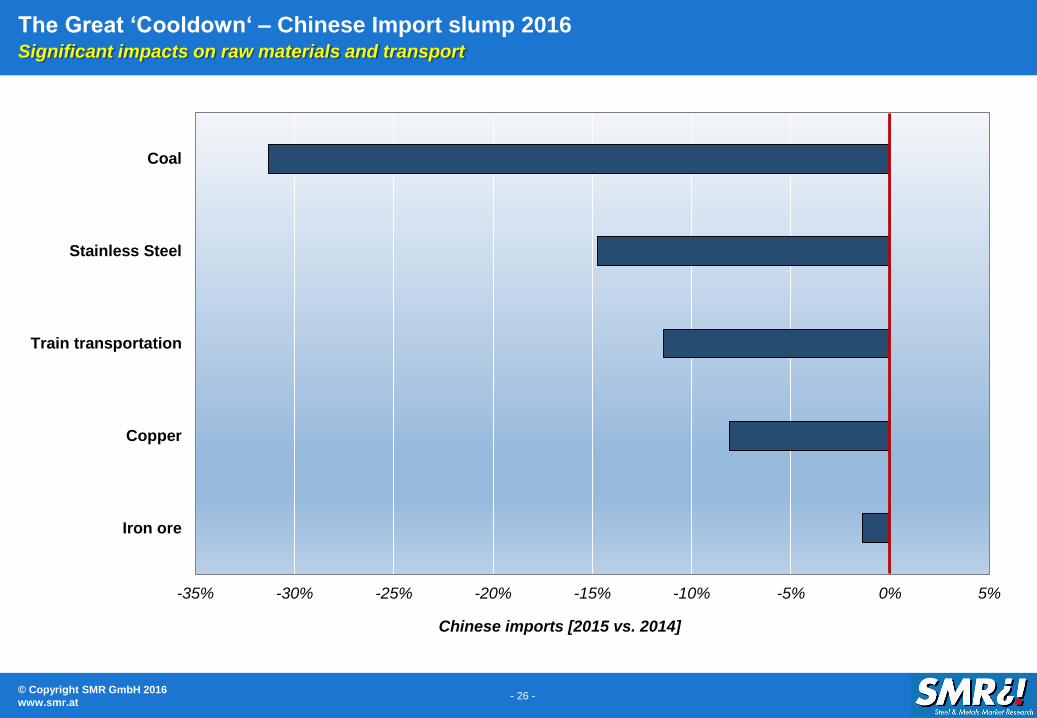
The Great ‘Cooldown‘ – Chinese Import slump 2016Significant impacts on raw materials and transport
-35% -30% -25% -20% -15% -10% -5% 0% 5%
Iron ore
Copper
Train transportation
Stainless Steel
Coal
Chinese imports [2015 vs. 2014]

© Copyright SMR GmbH 2016
www.smr.at- 27 -
Chinese Official GDP GrowthPredicted growth for 2015 is 6,5%
5%
6%
7%
8%
9%
10%
11%
12%
13%
14%
GD
P, c
on
sta
nt
pri
ce
s a
nd
ex
ch
an
ge r
ate
Really?
© Copyright SMR GmbH 2016
www.smr.at- 28 -
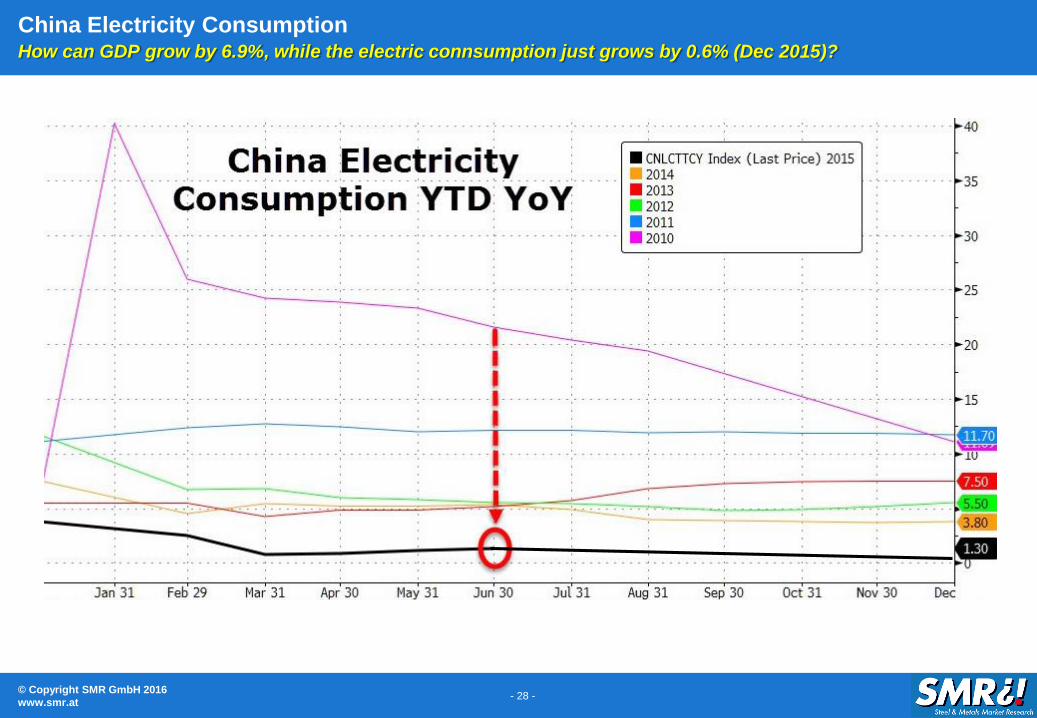
China Electricity ConsumptionHow can GDP grow by 6.9%, while the electric connsumption just grows by 0.6% (Dec 2015)?
© Copyright SMR GmbH 2016
www.smr.at- 29 -
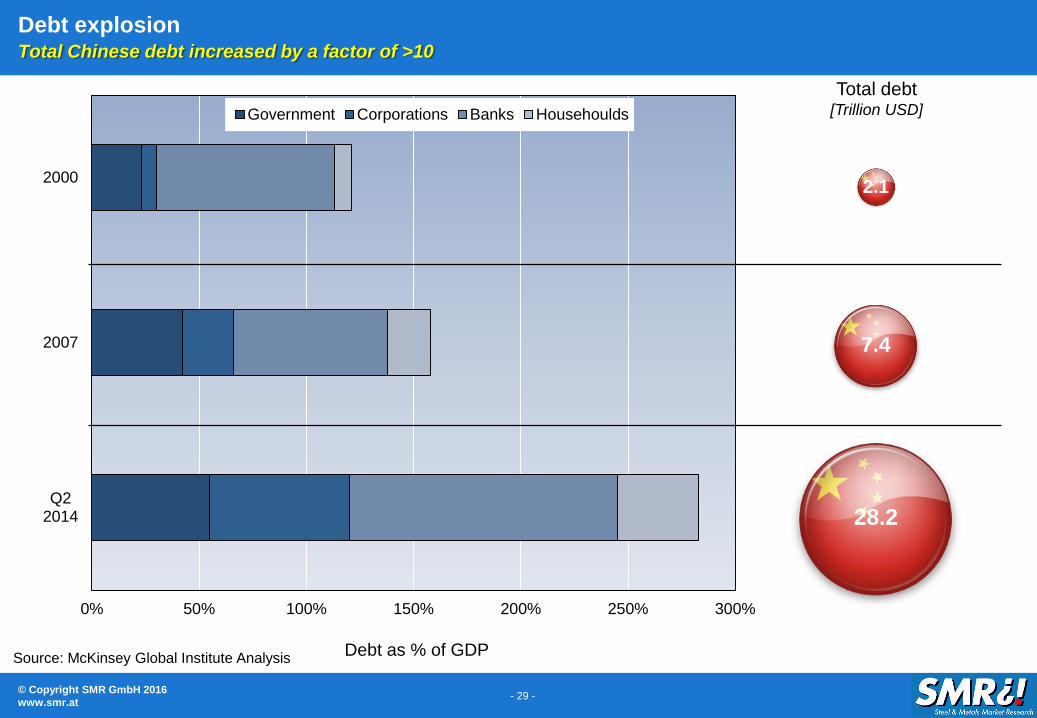
Debt explosionTotal Chinese debt increased by a factor of >10
Source: McKinsey Global Institute Analysis
0% 50% 100% 150% 200% 250% 300%
Q22014
2007
2000
Debt as % of GDP
Government Corporations Banks Househoulds
Total debt[Trillion USD]
28.2
7.4
2.1
© Copyright SMR GmbH 2016
www.smr.at- 30 -
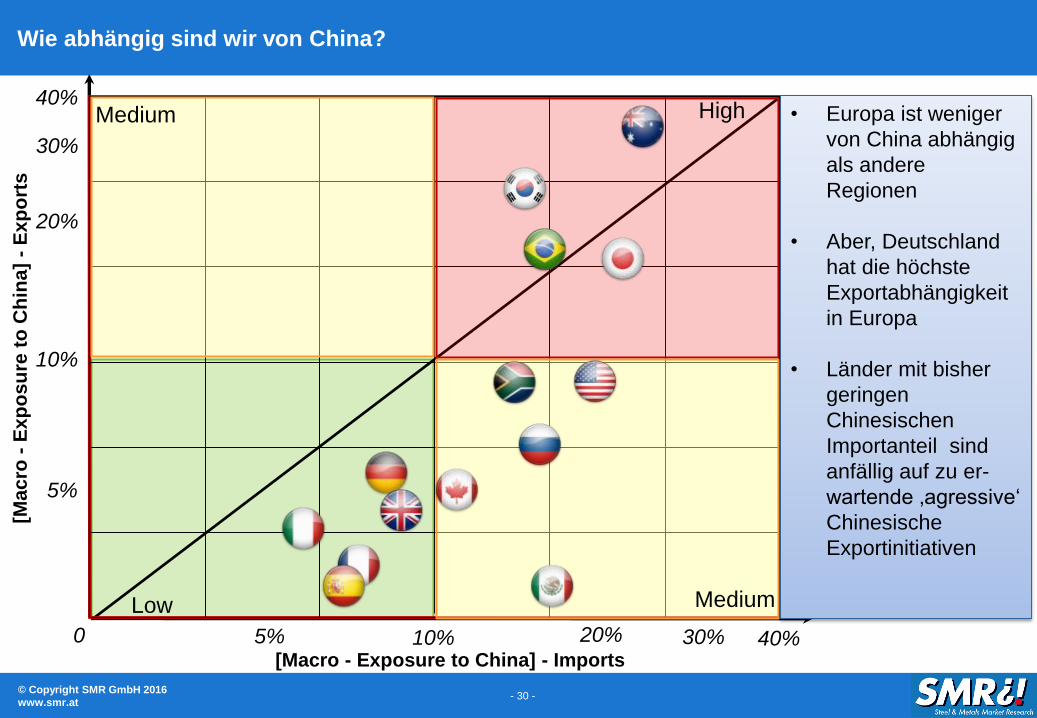
Wie abhängig sind wir von China?[M
acro
-E
xp
osu
re t
o C
hin
a]
-E
xp
ort
s
[Macro - Exposure to China] - Imports
0
10%
20%
30%
40%
5%
40%10% 30%5% 20%
• Europa ist weniger
von China abhängig
als andere
Regionen
• Aber, Deutschland
hat die höchste
Exportabhängigkeit
in Europa
• Länder mit bisher
geringen
Chinesischen
Importanteil sind
anfällig auf zu er-
wartende ‚agressive‘
Chinesische
Exportinitiativen
High
Low Medium
Medium
© Copyright SMR GmbH 2016
www.smr.at- 31 -
Table of Contents
1. Overview
2. Focus on Germany
3. Outlook 2016
4. China – A ticking bomb?
5. Focus on Raw Materials
© Copyright SMR GmbH 2016
www.smr.at- 32 -
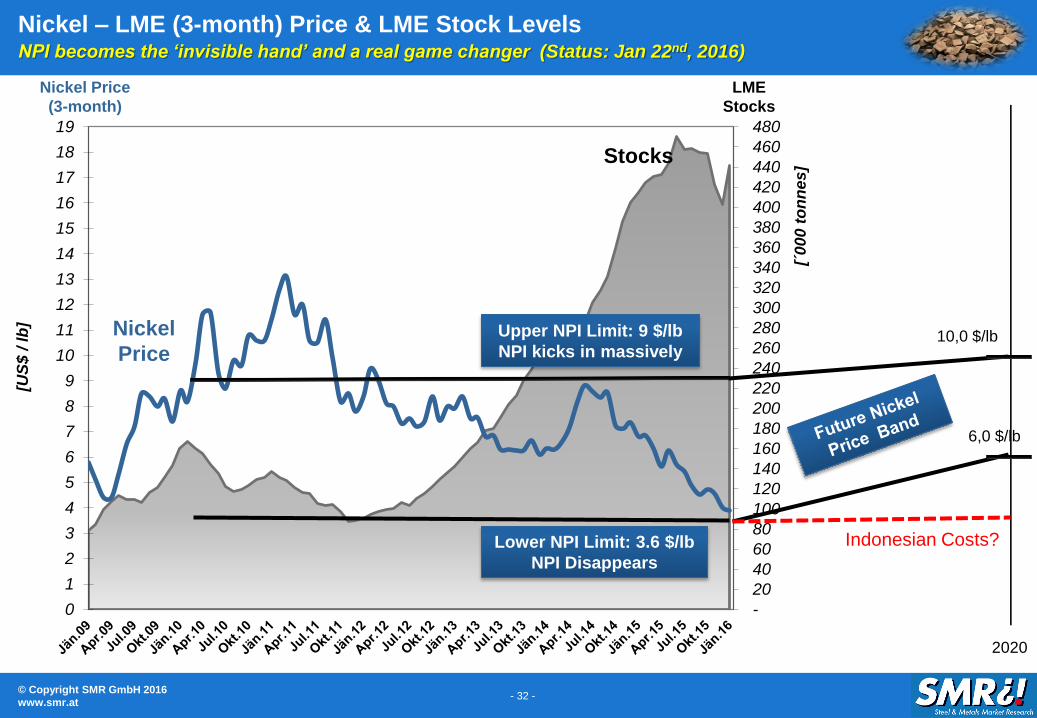
Nickel – LME (3-month) Price & LME Stock LevelsNPI becomes the ‘invisible hand’ and a real game changer (Status: Jan 22nd, 2016)
-
20
40
60
80
100
120
140
160
180
200
220
240
260
280
300
320
340
360
380
400
420
440
460
480
0
1
2
3
4
5
6
7
8
9
10
11
12
13
14
15
16
17
18
19
[´0
00
to
nn
es
]
[US
$ /
lb
]
Nickel Price
(3-month)
Nickel
Price
Stocks
LME
Stocks
2020
10,0 $/lb
6,0 $/lb
Upper NPI Limit: 9 $/lb
NPI kicks in massively
Lower NPI Limit: 3.6 $/lb
NPI Disappears
Indonesian Costs?
© Copyright SMR GmbH 2016
www.smr.at- 33 -
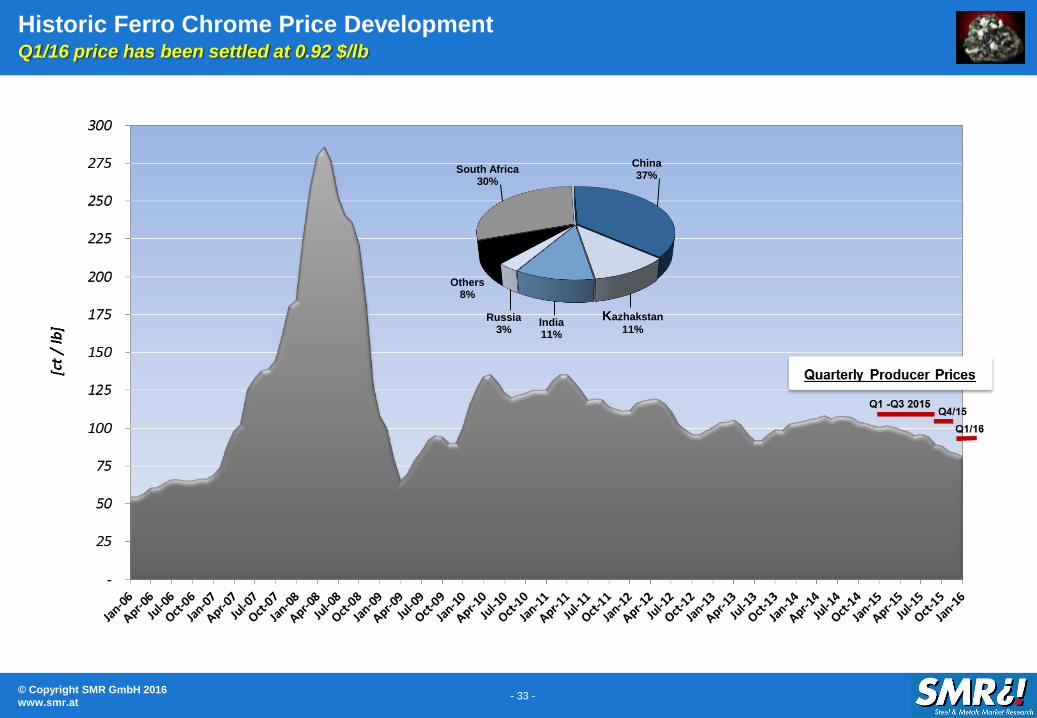
South Africa30%
China37%
Kazhakstan
11%India11%
Russia3%
Others8%
Historic Ferro Chrome Price DevelopmentQ1/16 price has been settled at 0.92 $/lb
© Copyright SMR GmbH 2016
www.smr.at- 34 -
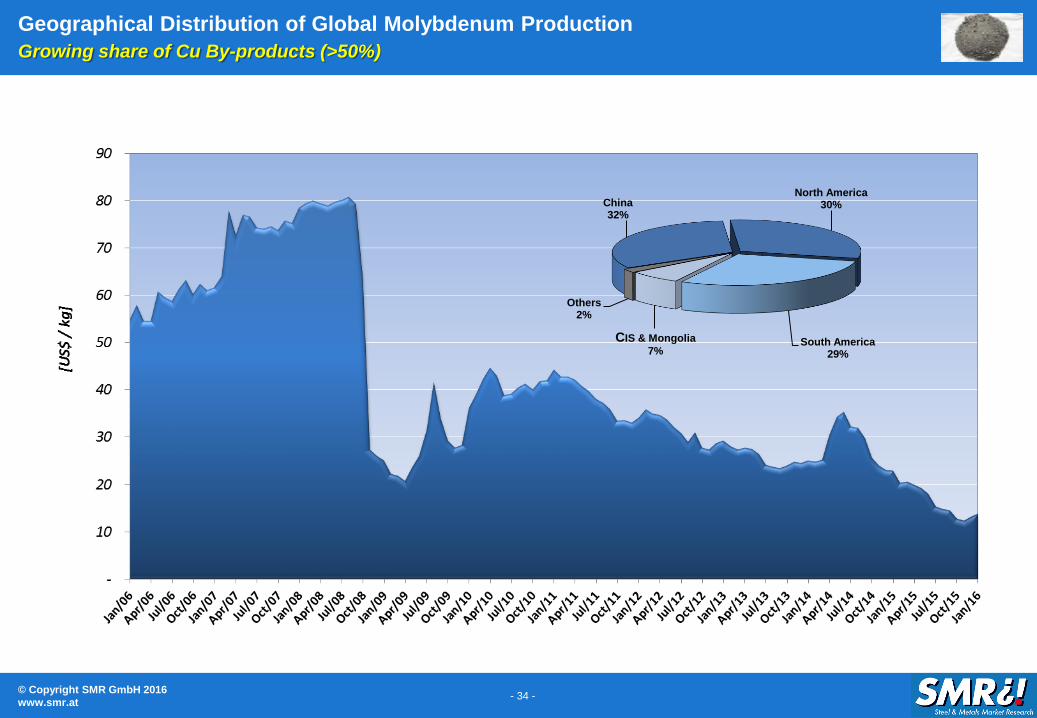
Geographical Distribution of Global Molybdenum Production
Growing share of Cu By-products (>50%)
China32%
North America30%
South America29%
CIS & Mongolia
7%
Others2%

© Copyright SMR GmbH 2016
www.smr.at- 35 -
Stainless Steel Scrap Market (Status: January 2016)The Stainless scrap is tightness has eased in Europe
(1.200)
(1.000)
(800)
(600)
(400)
(200)
-
200
400
US
$ / t
Dif
fere
nc
e:
Th
eo
reti
c M
inu
s R
ea
l S
cra
p P
ric
e
Real Intrinsic Value Discounts vs. Theoretic Values
(based on Ni 90 - Cr 85 - Fe 100 ‘rule’)
Too
Cheap
Too
Expensive
Average 11.5 % Discount
Today 17.7 % Discount!
© Copyright SMR GmbH 2016
www.smr.at- 36 -
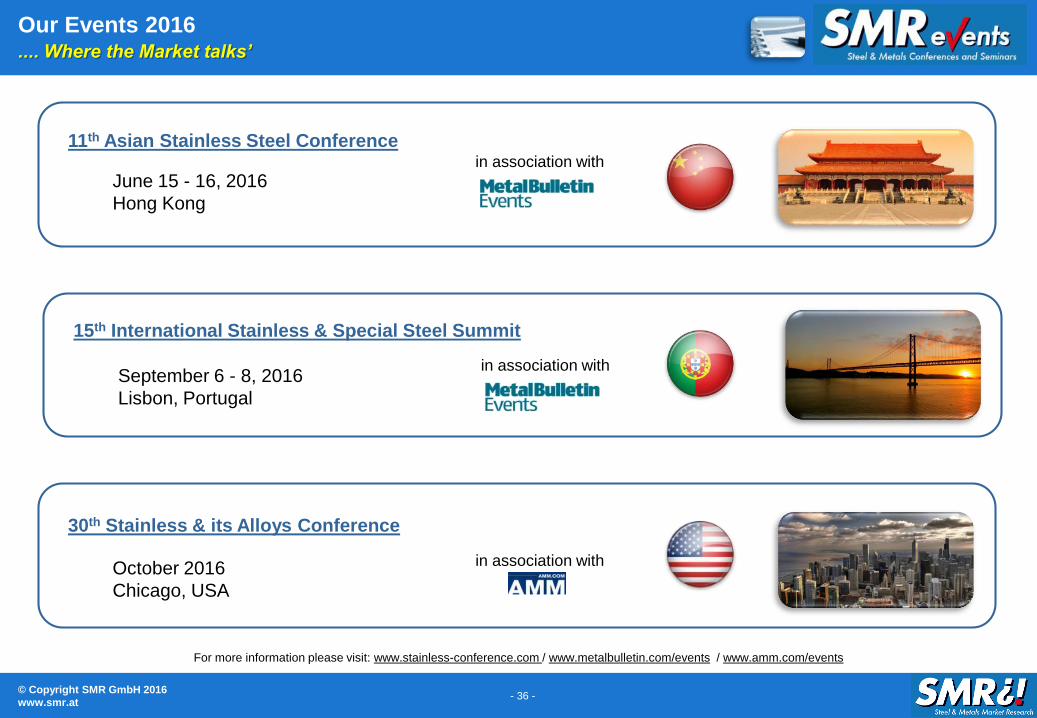
Our Events 2016.... Where the Market talks’
For more information please visit: www.stainless-conference.com / www.metalbulletin.com/events / www.amm.com/events
October 2016
Chicago, USA
30th Stainless & its Alloys Conference
in association with
June 15 - 16, 2016
Hong Kong
11th Asian Stainless Steel Conferencein association with
September 6 - 8, 2016
Lisbon, Portugal
15th International Stainless & Special Steel Summit
in association with
© Copyright SMR GmbH 2016
www.smr.at- 37 -
Unsere Seminare in 2016
1st March 2016
Istanbul, Turkey
Stainless Market Seminar Turkey
8. März 2016
Düsseldorf, Germany
Edelstahl Marktseminar Deutschland

© Copyright SMR GmbH 2016
www.smr.at- 38 -
Fragen oder Kommentare?