Markets and long-term contracts: The case of …...Gazprom Statoil (2015) Shell BG ExxonMobil...
32
www.eprg.group.cam.ac.uk Chi-Kong Chyong EPRG, Cambridge Judge Business School University of Cambridge 11 December 2015 Markets and long-term contracts: The case of Russian (and Norwegian) gas supplies to Europe
Transcript of Markets and long-term contracts: The case of …...Gazprom Statoil (2015) Shell BG ExxonMobil...

www.eprg.group.cam.ac.uk
Chi-Kong Chyong EPRG, Cambridge Judge Business School
University of Cambridge
11 December 2015
Markets and long-term contracts: The case of Russian (and Norwegian) gas supplies to Europe

www.eprg.group.cam.ac.uk
Contents
I. European gas industry: from contracts to traded markets
II. Sales strategies in the new European gas order
III. Economic implications of Gazprom’s sales strategies
2

www.eprg.group.cam.ac.uk
Key Messages
3
1. Structural changes in European energy markets in the last five years motivated major suppliers to change their sales strategies.
2. Exports through a single trading and marketing division – ISTM sales strategy – brings higher economic benefits to Gazprom than under ‘border sales’ strategy
3. Border sales = limited knowledge of ‘real prices and market dynamics’ - -> limited options to ‘correctly’ set the highest possible rents for gas resources
4. ISTM is robust against possible changes in LTC structure and possible negative impact of entry by low-cost producers ISTM carries high intrinsic (options and strategic) value to Gazprom
5. Beside the strategic value, ISTM provides greater upside potential, quantifiable only at micro-level:
– optimising gas commodity and capacity portfolios
– arbitraging between locations, time, and products
– diversifying of sales channels instead of relying on a limited number of counterparties & direct marketing to better capture consumers’ willingness to pay for various products

www.eprg.group.cam.ac.uk
Contents
I. European gas industry: from contracts to traded markets
II. Sales strategies in the new European gas order
III. Economic implications of Gazprom’s sales strategies
4
www.eprg.group.cam.ac.uk
The role of long-term contracts in gas trade results from statistical analysis of more than 630 contracts
5

www.eprg.group.cam.ac.uk
The role of long-term contracts in gas trade results from statistical analysis of more than 630 contracts
• where 𝐿𝑖 is the duration of contract i,
• 𝑄𝑖 is the annual contract quantity (ACQ),
• 𝐷𝑢𝑚𝑚𝑦𝑖𝑁𝑊𝐸_𝑃𝑜𝑠𝑡98 is a dummy variable taking the value 1 if the contract was for deliveries to the UK,
Germany, Belgium, France or the Netherlands after 1998 and 0 otherwise,
• 𝐷𝑢𝑚𝑚𝑦𝑖𝑅𝑜𝑓_𝐸𝑈_𝑃𝑜𝑠𝑡98
is a dummy variable taking the value 1 for a contract delivered to the rest of the EU
(excluding the north-west European markets mentioned above) after 1998 and 0 otherwise,
• 𝐷𝑢𝑚𝑚𝑦𝑖𝐹𝑙𝑒𝑥𝑖𝑏𝑙𝑒𝐿𝑁𝐺 is a dummy variable taking the value 1 for contracts delivered from portfolio LNG
suppliers (such as BG, Shell or BP), i.e. contracts not tied to a particular production location, and 0 otherwise, and
• 𝐷𝑢𝑚𝑚𝑦𝑖𝐿𝑁𝐺 is a dummy variable taking the value 1 for all LNG contracts in the sample and 0 otherwise.
6
𝐿𝑖 = 𝐶𝑜𝑛𝑠𝑡𝑎𝑛𝑡 + 𝛽1𝑄𝑖 + 𝛽2𝑄𝑖2 + 𝛽3𝐷𝑢𝑚𝑚𝑦𝑖
𝑁𝑊𝐸_𝑃𝑜𝑠𝑡98 + 𝛽4𝐷𝑢𝑚𝑚𝑦𝑖𝑅𝑜𝑓 _𝐸𝑈_𝑃𝑜𝑠𝑡98
+ 𝛽5𝐷𝑢𝑚𝑚𝑦𝑖𝐹𝑙𝑒𝑥𝑖𝑏𝑙𝑒𝐿𝑁𝐺 + 𝛽6𝐷𝑢𝑚𝑚𝑦𝑖
𝐿𝑁𝐺 ,
(1)

www.eprg.group.cam.ac.uk
The role of long-term contracts in gas trade results from statistical analysis of more than 630 contracts
7
Regressors 𝐿𝑖 – Contract duration (Eq. 1) Constant 19.248
(0.754) 𝛽1 0.836***
(0.172) 𝛽2 -0.022***
(0.008) 𝛽3 -6.007***
(0.867) 𝛽4 -1.905**
(0.775) 𝛽5 -2.594***
(0.976) 𝛽6 -1.841***
(0.679) R-squared 0.129 Adjusted R-squared 0.120 No. observations 631 Standard errors are reported in parentheses; *** indicates significance at the 99% level; ** indicates significance at the 95% level.

www.eprg.group.cam.ac.uk
The role of long-term contracts in gas trade results from statistical analysis of more than 630 contracts
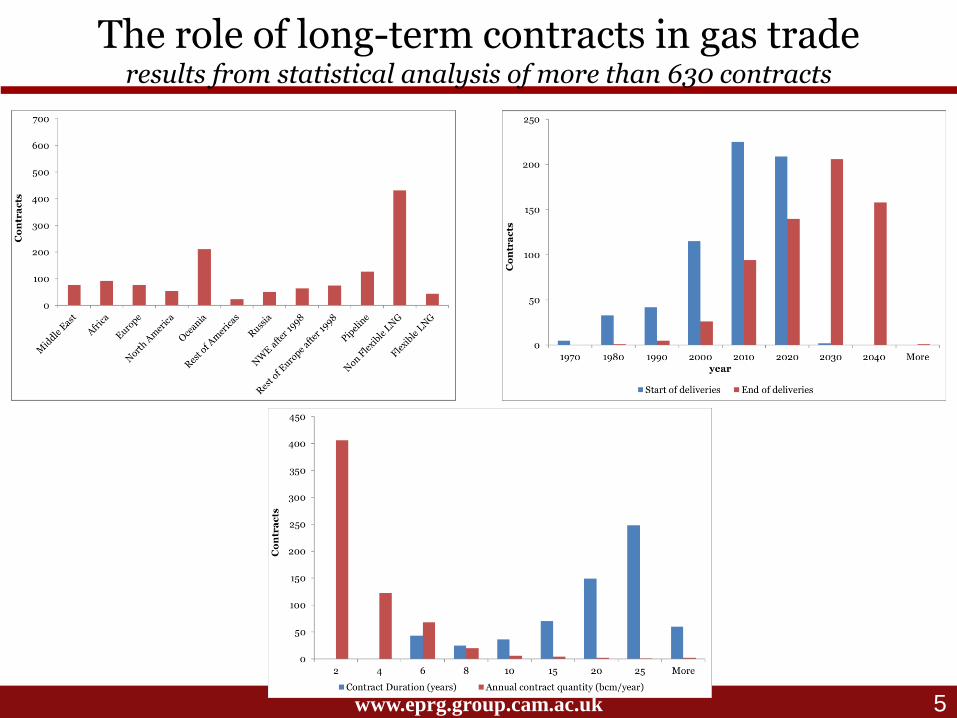
The role of long-term contracts depends on
(i) organization of vertical relationships along the value chain, and
(ii) Industry structure and competition along the value chain
(i) After the launch of market liberalization in Europe, contracts became shorter:
• contracts delivered to North-west European gas markets are, on average, 6 years shorter than duration of the other contracts in the sample;
• Contracts to NWE are also significantly shorter than those delivered to other European markets, where spot markets are substantially underdeveloped
Note: these differences are statistically significant at least at 95% level
8

www.eprg.group.cam.ac.uk
The role of long-term contracts in gas trade results from statistical analysis of more than 630 contracts
The role of long-term contracts depends on
(i) organization of vertical relationships along the value chain, and
(ii) Industry structure and competition along the value chain
(ii) LNG trade is in general more flexible than pipeline gas trade:
• LNG contracts are on average shorter than pipeline gas contracts
• Recent LNG contracts not linked to particular production fields (supplied by portfolio players such as BG, Shell) are on average 2.5 years shorter than pipeline gas contracts
• They are also one year shorter than other LNG contracts with dedicated production assets.
Note: these differences are statistically significant at least at 95% level
9
www.eprg.group.cam.ac.uk
The role of long-term contracts in gas trade results from statistical analysis of more than 630 contracts
The role of long-term contracts depends on
(i) organization of vertical relationships along the value chain, and
(ii) Industry structure and competition along the value chain
Other factors influencing the changing nature of gas trade in Europe:
1. Capital intensiveness of gas infrastructure assets,
2. Macroeconomic conditions, energy regulation and policies in Europe affecting gas markets – climate policies and coal/gas competition, renewables policies, and energy efficiency improvements,
3. demand and supply shocks
European gas industry changed dramatically in response to regulatory, technological and industrial dynamics:
• Ten years ago oil-linked contracts dominated gas trade in Europe
• In 2012 – ca. half of gas is traded based oil-indexed contracts; spot (gas-on-gas competition) accounted for about one-third
• In 2014 – ca. one-third of gas trade is based on oil-indexed contracts while two-thirds is based on spot-indexation (Source: IGU Wholesale gas price review, 2005-2014)
10

www.eprg.group.cam.ac.uk
Contents
1. European gas industry: from contracts to traded markets
2. Sales strategies in the new European gas order
3. Economic implications of Gazprom’s sales strategies
11

www.eprg.group.cam.ac.uk
Sales strategies in the new European gas order
There are two sales strategies that complement traditional sales through LTCs: (i) ‘pure production’ or ‘border sales’ strategy, and (ii) integrated production, supply, trading and marketing – ISTM sales strategy
‘Pure production’ strategy ISTM Strategy
“Specialization” drives stock price, and
Reduce earnings volatility
future value, measured through reserves-replacement ratio
Improve margin
Hedging, portfolio optimization along entire value chain
Robust and competitive advantage vis-à-vis traditional
trading houses (Vitol, Trafigura, Noble, etc.)
12

www.eprg.group.cam.ac.uk
Sales strategies in the new European gas order
There are two sales strategies that complement traditional sales through LTCs: (i) ‘pure production’ or ‘border sales’ strategy, and (ii) integrated production, supply, trading and marketing – ISTM sales strategy
‘Pure Production’ Strategy ISTM Strategy
“Specialization” drives stock price, and
Reduce earnings volatility
future value, measured through reserves-replacement ratio
Improve margin
Hedging, portfolio optimization along entire value chain
Robust and competitive advantage vis-à-vis traditional trading houses
(Vitol, Trafigura, Noble, etc.)
Pure Production Strategy
ISTM Strategy
Sonatrach
Gazprom
Statoil Shell
BG
ExxonMobil Chevron
GasTerra
ENI
Total BP
Current situation (2015)
13

www.eprg.group.cam.ac.uk
Sales strategies in the new European gas order
There are two sales strategies that complement traditional sales through LTCs: (i) ‘pure production’ or ‘border sales’ strategy, and (ii) integrated production, supply, trading and marketing – ISTM sales strategy
Pure Production Strategy
ISTM
Sonatrach
Gazprom
Statoil (2015) Shell
BG
ExxonMobil Chevron
GasTerra
ENI
Total BP Statoil (2011)
14
‘Pure Production’ Strategy ISTM Strategy
“Specialization” drives stock price, and
Reduce earnings volatility
future value, measured through reserves-replacement ratio
Improve margin
Hedging, portfolio optimization along entire value chain
Robust and competitive advantage vis-à-vis traditional trading houses
(Vitol, Trafigura, Noble, etc.)

www.eprg.group.cam.ac.uk
Sales strategies in the new European gas order Statoil - an example of an ISTM gas player ‘in the making’
• Diversified sales channels to include: 1. Sales directly to traded markets, and
2. Direct sales to industrial users
• arbitrage opportunities by engaging directly with spot prices
• Capturing additional value further downstream, bypassing traditional importers
• Diversified pricing mechanisms to include more spot-indexation
• Statoil took back the flexibility that was embedded in the long-term contracts and ‘pro-actively’ prices those flexibilities
• Introduced varieties of products around gas commodity - -> became supplier of integrated solutions, not just pure gas producer
15
Source: Presentation by Eldar Sætre, EVP, Marketing, Processing and Renewable Energy (2013)
Source: Presentation by Eldar Sætre, EVP, Marketing, Processing and Renewable Energy (2013)

www.eprg.group.cam.ac.uk
Sales strategies in the new European gas order Statoil - an example of an ISTM gas player ‘in the making’
• An econometric analysis of Statoil’s swing production capacity – Troll and Oseberg
• where NPB is the day-ahead spot price (monthly averages),
• Season is a dummy variable taking the value 1 between October and March and 0 otherwise,
• SpotIndex is a dummy variable taking the value 1 for 2012, when the positive effect of increased spot indexation allowed Statoil to take market shares from other suppliers, and 0 otherwise,
• ActiveTrading is a dummy variable taking the value 1 for 2011–2015, the period when structural shifts in the market affected Statoil’s contracts, pricing and sales strategy, and 0 otherwise,
• RU_Undersupply_14 is a dummy variable taking the value 1 for the winter of 2014/2015, when Russian supplies to Europe were minimised due to a number of factors, including reducing oversupply and stopping Ukrainian imports from Europe, and 0 otherwise,
• DummyUK1 is a dummy variable taking the value 1 for the period between October 2006 and July 2007, representing the effects of a temporary gas glut in the UK due to increased importation from the Langeled and BBL pipelines and failure of the IUK to export the surplus to Continental Europe, and 0 otherwise, and
• DummyUK2 is a dummy variable taking the value 1 for the winter of 2005/2006, to account for tight supply condition in the UK, and 0 otherwise.
16
𝑄𝑖 = 𝐶𝑜𝑛𝑠𝑡𝑎𝑛𝑡 + 𝛽1𝑁𝐵𝑃 + 𝛽2𝑆𝑒𝑎𝑠𝑜𝑛+ 𝛽3𝑆𝑝𝑜𝑡𝐼𝑛𝑑𝑒𝑥 + 𝛽4𝐴𝑐𝑡𝑖𝑣𝑒𝑇𝑟𝑎𝑑𝑖𝑛𝑔+ 𝛽5𝑅𝑈_𝑈𝑛𝑑𝑒𝑟𝑠𝑢𝑝𝑝𝑙𝑦14 + 𝛽6𝐷𝑢𝑚𝑚𝑦𝑈𝐾1 + 𝛽7𝐷𝑢𝑚𝑚𝑦𝑈𝐾2,
(2)

www.eprg.group.cam.ac.uk
Sales strategies in the new European gas order Statoil - an example of an ISTM gas player ‘in the making’
• An econometric analysis of Statoil’s swing production capacity – Troll and Oseberg
17
Regressors Troll output Oseberg output Troll and Oseberg output
Constant 1.422 (0.108)
0.064 (0.034)
1.486 (0.118)
𝛽1 0.064*** (0.017)
0.015*** (0.005)
0.080*** (0.019)
𝛽2 0.978*** (0.084)
0.164*** (0.026)
1.142*** (0.092)
𝛽3 0.591*** (0.175)
0.186*** (0.055)
0.776*** (0.192)
𝛽4 -0.242** (0.123)
-0.097** (0.039)
-0.339** (0.135)
𝛽5 0.659*** (0.237)
0.188** (0.074)
0.847*** (0.260)
𝛽6 0.565*** (0.165)
-0.064 (0.052)
0.502*** (0.181)
𝛽7 -0.432 (0.267)
0.030 (0.083)
-0.402 (0.292)
R-squared 0.581 0.357 0.617 Adjusted R-squared 0.563 0.330 0.600 No. observations 171 171 171 Standard errors are reported in parentheses; *** indicates significance at the 99% level; ** indicates significance at the 95% level.

www.eprg.group.cam.ac.uk
Sales strategies in the new European gas order Statoil - an example of an ISTM gas player ‘in the making’
• An econometric analysis of Statoil’s swing production capacity – Troll and Oseberg – highlights some of these points:
– Troll and Oseberg output closely follows market dynamics in terms of prices and volumes placed on the markets
– After contract renegotiations (2011), average monthly production from Troll and Oseberg was on average 10% and 40% lower than monthly production in preceding years. This insight is statistically significant even accounting for various effects (maintenance work at Troll, spot prices, EOR, seasonality and other market dynamics)
– This is against the trend of increased production and supplies from Norway to Europe in the same period (2011-2014)
18

www.eprg.group.cam.ac.uk
Sales strategies in the new European gas order Statoil - an example of an ISTM gas player ‘in the making’
19
Impact of Troll maintenance on trading margin

www.eprg.group.cam.ac.uk
Sales strategies in the new European gas order Statoil - an example of an ISTM gas player ‘in the making’
• An econometric analysis of Statoil’s swing production capacity – Troll and Oseberg – highlights some of these points:
– Troll and Oseberg output closely follows market dynamics in terms of prices and volumes placed on the markets
– After contract renegotiations (2011), average monthly production from Troll and Oseberg was on average 10% and 40% lower than monthly production in preceding years. This insight is statistically significant even accounting for various effects (maintenance work at Troll, spot prices, EOR, seasonality and other market dynamics)
– This is against the trend of increased production and supplies from Norway to Europe in the same period (2011-2014)
• The results highlight that having the ability to shift production from flexible fields to future periods to add upward pressure on current spot prices creates value for producers.
• But such a strategic response is only possible when a producer is actively participating in liquid trading markets, while export volume is ‘wired’ through single trade and marketing division (like Statoil’s MMP)
20

www.eprg.group.cam.ac.uk
Sales strategies in the new European gas order Statoil - an example of an ISTM gas player ‘in the making’
21

www.eprg.group.cam.ac.uk
Contents
1. European gas industry: from contracts to traded markets
2. Sales strategies in the new European gas order
3. Economic implications of Gazprom’s sales strategies
22

www.eprg.group.cam.ac.uk
Cost-benefit analyses of Gazprom’s possible sales strategies
There are two sales strategies that compliment traditional sales through LTCs: (i) ‘pure production’ or ‘border sales’ strategy, and (ii) integrated production, supply, trading and marketing – ISTM sales strategy
Pure Production Strategy
ISTM
Sonatrach
Gazprom
Statoil Shell
BG
ExxonMobil Chevron
GasTerra
ENI
Total BP
Should? When? Extent of ISTM?
?
23
Current situation (2015)
‘Pure Production’ Strategy ISTM Strategy
“Specialization” drives stock price, and
Reduce earnings volatility
future value, measured through reserves-replacement ratio
Improve margin
Hedging, portfolio optimization along entire value chain
Robust and competitive advantage vis-à-vis traditional trading houses
(Vitol, Trafigura, Noble, etc.)

www.eprg.group.cam.ac.uk
Cost-benefit analyses of Gazprom’s possible sales strategies
24
Hub-pricing
markets
Hybrid-pricing
markets (mix of oil
and spot indexation)
European
wholesalers
Producer
A
Producer
B
Trading and
marketing B
Producer B follows ISTM,
whereas Producer A is a
border sales producer
Europe
border
Billion-dollar Question:
Should Gazprom become Producer A or Producer B for uncontracted volume going forward?
Free (uncontracted)
volumes to Europe

www.eprg.group.cam.ac.uk
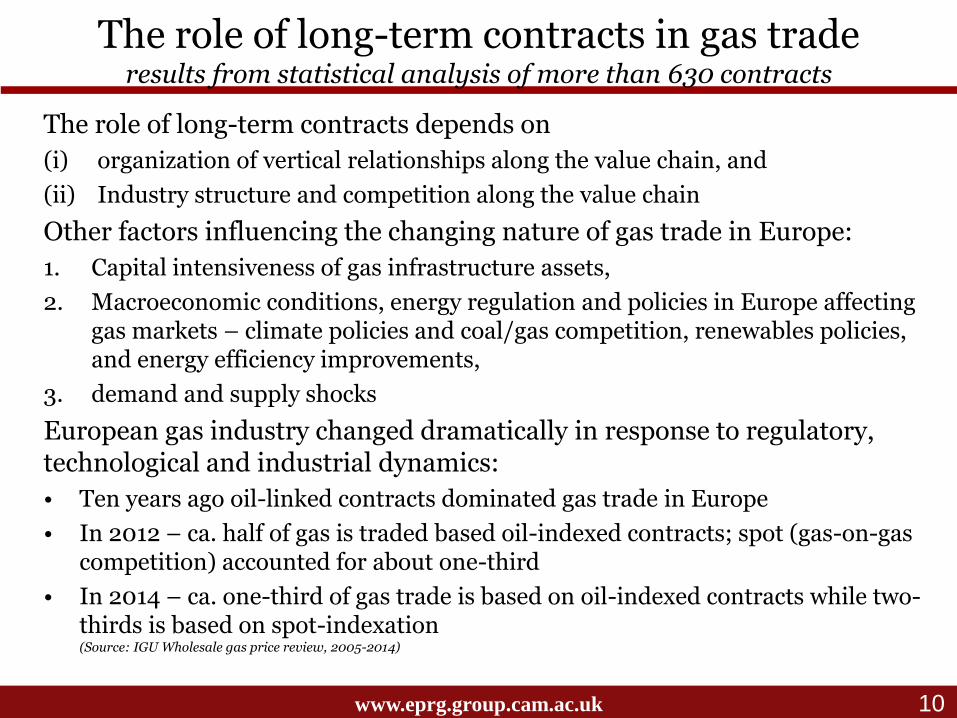
Analytical Approach to value ISTM strategy
• Global gas market was used to simulate 216 different market scenarios, representing combinations of
– possible oil prices,
– market structure & competition, and
– structure of LTCs: minimum take-or-pay and share of spot-indexation
• Basic model structure and what is in the model:
1. Gas producers: can be modelled as behaving imperfectly
(exercising market power) or perfectly competitive (marginal cost
pricing)
2. Gas traders: can be modelled as behaving imperfectly (exercising
market power) or perfectly competitive (marginal cost pricing)
3. Pipeline transmission operator: price pipeline transport
services efficiently i.e. with no market power
4. LNG terminal operator: price liquefaction and regasification
services efficiently i.e. with no market power
5. LNG shipping: marginal cost based pricing
6. Gas storage operator: price storage operations efficiently i.e.
with no market power
7. Clearing wholesale prices are represented by demand curves
which tells us that the clearance prices depend on total supplies to
that market
25
www.eprg.group.cam.ac.uk
Analytical Approach to value ISTM strategy
• Global gas market was used to simulate 216 different market scenarios, representing a combination of
– possible oil prices,
– market structure and competition, and
– structure of LTCs: minimum take-or-pay and share of spot-indexation
• Basic model structure and what is in the model:
Disclaimer The purpose of examining multiple market and non-market scenarios is to conduct ‘stress tests’ for the two possible gas sales strategies. The scenarios examined are not predictions. Whenever possible, we devised these scenarios to be as close as possible to the industry’s expected possible paths of future gas market developments. However, these scenarios are not intended to replicate possible market developments; some may be hypothetical and do not necessarily conform to the current established view of the future of the gas markets. For example, one scenario is Qatar’s removal of the exploration moratorium and the further expansion of its production capacity; this may not be realistic given the current environment of low oil and gas prices. Nevertheless, this scenario has a positive probability of occurring, making it a form of ‘high-impact, low-probability event’. Our intention is to test the robustness of hydrocarbon producers’ sales strategies in an uncertain world and not to provide ‘price forecast’-type analysis.
26

www.eprg.group.cam.ac.uk
Results: Economics of Gazprom’s possible sales strategies
• Why ISTM is better than Border Sales Strategy?
27
ISTM’s ability to correctly ‘manage’ potential supply glut
raises market prices above what could be achieved under border
sales strategy
Risks of contract renegotiations is always
higher under border sales

www.eprg.group.cam.ac.uk
Results: Economics of Gazprom’s possible sales strategies
• Even if pricing in contracts are renegotiated (more spot indexation), ISTM generates higher profits
28
Sales Strategy
Border sales
ISTM
Contract Price
renegotiations
Contract Price
renegotiations
10.2
Export Profit ($bn/year, NPV)
12.3
14.0
16.3
16.3
16.4
Spot indexation
100%
50%
10%
100%
50%
10%
ISTM Valuation
($bn/year, NPV)
6.1
4.0
2.4
www.eprg.group.cam.ac.uk
Results: Economics of Gazprom’s possible sales strategies
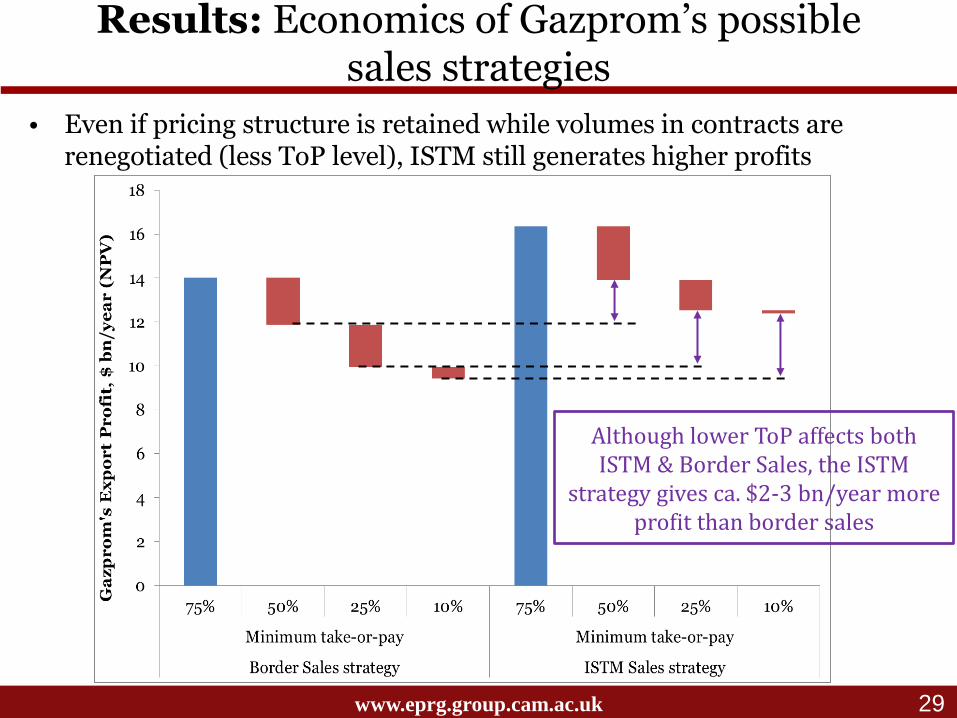
• Even if pricing structure is retained while volumes in contracts are renegotiated (less ToP level), ISTM still generates higher profits
29
Although lower ToP affects both ISTM & Border Sales, the ISTM
strategy gives ca. $2-3 bn/year more profit than border sales

www.eprg.group.cam.ac.uk
Summarizing: Economics of Gazprom’s possible sales strategies
• Ability to ‘correctly’ price the produced gas creates additional profit for Gazprom
• ISTM has intrinsic – option and strategic – value to Gazprom
• ISTM can also better capture the upside potential under favourable market conditions
Note:* we assume 75% minimum take-or-pay level and 90/10 oil vs. spot indexation for existing LTC structure; ** for example, due to increased downstream market competition
30
ISTM’s Option
Value
ISTM’s Upside
potential**
www.eprg.group.cam.ac.uk
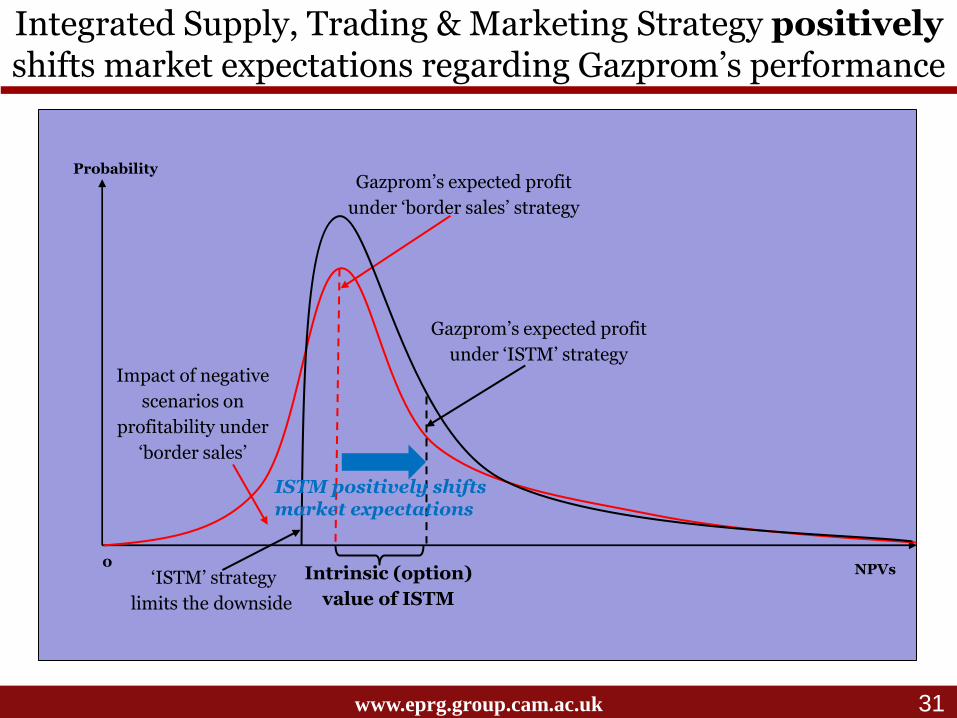
Integrated Supply, Trading & Marketing Strategy positively shifts market expectations regarding Gazprom’s performance
Probability
NPVs
Gazprom’s expected profit
under ‘border sales’ strategy
Gazprom’s expected profit
under ‘ISTM’ strategy
Intrinsic (option)
value of ISTM
31
0
ISTM positively shifts market expectations
Impact of negative
scenarios on
profitability under
‘border sales’
‘ISTM’ strategy
limits the downside


![GasTerra OA 2018-2019 Final Clean - the ICE Agreement [contractLegalName] Definitions GasTerra OA 2018-2019 Final Clean.docx page 3 2.10 Gas Market Instrument Specifications refers](https://static.fdocuments.in/doc/165x107/5aa5cd157f8b9ae7438dfb5b/gasterra-oa-2018-2019-final-clean-the-ice-agreement-contractlegalname-definitions.jpg)