Marketplace Lending - Ninepoint
21
Alternative Income Group Industry Overview Marketplace Lending
Transcript of Marketplace Lending - Ninepoint

Alternative Income Group
Industry Overview Marketplace Lending

Ninepoint Partners Industry Overview Marketplace LendingAlternative Income Group
Contents
Executive Summary ..................................................................................................................................................................................2
What is Marketplace Lending? ..............................................................................................................................................................2
Market Overview ........................................................................................................................................................................................5 Fintech – The World’s Largest Disruptor ........................................................................................................................................5 Institutional Investor Interest .............................................................................................................................................................7 Securitization ......................................................................................................................................................................................8 Improvements in Analytics/Technology ....................................................................................................................................8 Active Secondary Markets ..............................................................................................................................................................9 Competitive Landscape.......................................................................................................................................................................9
Why Should Marketplace Lending Be a Part of My Portfolio? .................................................................................................... 11 Credit Diversification ........................................................................................................................................................................... 11 Historically Low Correlation to Public Markets ............................................................................................................................12 Strong Risk-Return Profile .................................................................................................................................................................12
What Does the U.S. Landscape Look Like Now? ........................................................................................................................... 14 Unemployment .................................................................................................................................................................................... 14 Leverage ..................................................................................................................................................................................................15 Delinquency Rates ...............................................................................................................................................................................17
How Will This Affect U.S. Marketplace Loans? ............................................................................................................................... 19
page 1 of 20Marketplace Lending
page 2 of 20
Executive Summary
Marketplace Lending started emerging near the beginning of the 2008 Global Financial Crisis. It has seen significant growth in recent years as a result of the investor and borrower interest it has attracted, coupled with technological advances that make it easier for borrowers and investors or lenders to complete transactions online. In its early stages, Marketplace Lending was mostly comprised of individuals lending to other individuals. However, it has now evolved into a space dominated by institutional investors across all facets of lending such as consumer, small business (SME) and real estate lending. Financial technology (Fintech) companies have led the establishment of Marketplace Lending by creating online platforms for consumers and borrowers to allow them to complete a financing transaction virtually. As lending processes and requirements by Banks continue to be cumbersome and bureaucratic for small business and retail borrowers, Marketplace Lending platforms will serve as a solution for efficient financing of borrowers.
Marketplace Lending has similar characteristics to traditional loans; however, origination takes place through a Fintech platform that brings borrowers and investors together. This provides investors with the ability to invest in a diverse set of loans across the platform that suits their risk and return thresholds. The majority of Marketplace Lending is comprised of consumer or retail loans; however, a small but growing share consists of small business and real estate lending.
Institutional investors represent the largest investor base for Marketplace Loans. This asset class has attracted institutions for its features such as short duration, amortizing structure and high interest rates which protect against losses in the event of default and provide a high degree of certainty of repayment.
Fintech companies have invested in building technology infrastructure for Marketplace Lending through establishing online platforms to originate and underwrite loans. By providing investors with readily available information, a diverse pool of investments, and creating easy application processes for borrowers, Fintech companies have positioned themselves well to compete with traditional lenders. As of 2018, Fintech platforms held the largest market share of personal loan balances amongst all types of lenders at 38%.
The COVID-19 pandemic has caused business closures across the globe and a significant increase in the U.S. unemployment rate which is 14.7% as at April 2020. This has resulted in lending platforms applying strict underwriting guidelines such as heightened income screening requirements, capacity to repay, and temporarily halting of transactions in the secondary market. With the economic uncertainty expected to continue in the near term, it will be interesting to see how the Fintech industry will adapt.
In the near term, lenders that have provided financing for lower income borrowers will struggle as U.S. Federal Government stimulus packages taper off. Lenders who have provided loans to high income individuals employed in largely unaffected or essential industries will benefit during the pandemic. Medium to long-term unemployment rates are expected to remain high, however a rebound is expected through the next few quarters until the end of 2021. As unemployment numbers begin to improve and Banks continue to impose stricter lending standards, consumers are expected to turn to alternative financing sources such as Marketplace Lending platforms in order to meet their financing needs. As some platforms begin to restrict activity in the secondary markets, platforms that have diversified across multiple platforms will have increased liquidity compared to their counterparts.
What is Marketplace Lending?
Marketplace Lending, also known as Peer-to-Peer lending, is an alternative to traditional lending that is facilitated through Financial Technology (Fintech) marketplaces that connect borrowers and investors. This form of financing removes the need for an intermediary, such as a bank, to direct the flow of capital. Borrowers can use these online marketplaces to apply for financing, while investors can choose which borrowers they intend to finance.
Peer-to-peer loans are typically used for personal expenses, debt consolidation, medical bills, or education and are not secured against borrower assets. Instead, the structure of the loan itself provides the lender with some assurance that the principal will be returned. Marketplace loans are short in duration, usually between 1-3-year
Marketplace Lending

page 3 of 20
terms and offer an amortizing structure, with principal payments being made each month in addition to interest, similar to a mortgage payment. Payments are drawn directly from the borrower’s bank account and sent to the platform that services the loan. These features decrease the probability of default as the principal balance is paid down over the term of the loan and the borrower is more committed to paying off the financing.
Table 1: Marketplace Lending Comparison to Other Asset Classes August 2016 through August 2020
Corporate Bonds
High Yield Bonds
Leveraged Loans
Marketplace Lending
Equity
Mean Return 5.3% 6.0% 3.8% 5.8% 14.7%
Standard Deviation 6.1% 8.0% 7.4% 2.4% 15.0%
Sharpe Ratio 0.85 0.74 0.50 2.34 0.97
Positive Months 33 36 38 47 39
Negative Months 16 13 11 2 10
Max Drawdown -7.5% -13.1% -13.5% -4.6% -19.6%
Source: Bloomberg.
Indices used: ICE BofA US Corporate Index, ICE BofA US High Yield Index, S&P/LSTA Leverage Loan Index TR, S&P 500 TR and customized benchmark for Marketplace Lending. Risk Free Rate used is the 3 Month US Treasury. The Marketplace Lending benchmark consists of an equal weighted portfolio of the returns from Stone Ridge Alternative Lending Risk Premium Fund, Moonstone Lending SICAV and Morgan Stanley AIP Alternative Lending Fund. Prior to the inception of the Morgan Stanley AIP Alternative Lending Fund, the customized benchmark only includes performance from Stone Ridge Alternative Lending Risk Premium Fund and Moonstone Lending SICAV.
The borrowers in Marketplace Lending are individuals and small businesses that do not want to or cannot use a traditional financing source. The advantage for the borrower is the speed to market – borrowers can typically complete applications within 30 minutes1 and platforms can complete the financing within hours, whereas Banks may take several days or weeks to approve an unsecured line. This has allowed the asset class to grow to US$28.8 billion in 2018, which is an increase of US$20.1 billion over the previous four years.
Figure 1: Marketplace Lending by Type in the Americas
20182017201620152014
US$0.1BUS$1.0B
US$7.6B
US$0.8B
US$2.6B
US$17.9B
US$1.0BUS$1.5B
US$21.1B
US$1.2BUS$1.5B
US$14.8B
US$2.3BUS$0.7B
US$25.8B
■ Peer-to-peer/Marketplace Property Lending ■ Peer-to-peer/Marketplace Business Lending■ Peer-to-peer/Marketplace Consumer Lending
Source: University of Cambridge Centre for Alternative Finance.
Borrowers also benefit from the flexible credit underwriting model of the platforms. Typical lenders rely heavily on a credit score to determine credit worthiness of a borrower. The platforms will often use other underwriting criteria that are a better fit for certain borrowers than credit score alone. For example, Upstart is a lending platform that specializes in lending to young, well-educated individuals who do not have a robust credit history yet. In addition
Marketplace Lending

page 4 of 20
to credit score, they take educational background, school grades, location, and job history into account. This allows them to better predict the probability of default versus credit score alone, and ultimately allows the borrower to access financing that would have been rejected on a credit background analysis performed by traditional lenders.
Investors or lenders in these transactions are typically institutional investors, such as pensions, hedge funds, and endowments. These institutions can buy large pools of these loans and tailor their portfolio to the risk specifications they find most attractive. Investors find the Marketplace Lending industry very attractive as it provides a good risk-adjusted return for their investments. By avoiding financial intermediaries, investors benefit from reduced fees and targeted lending. Investors can also choose who to lend to directly, looking at the credit application and various risk metrics, weighing them against the recommended pricing by the platform.
Figure 2: Operating Expenses of an Unsecured Personal Loan (% of Loan Amount), Bank and Marketplace Loans
0
50
100
150
200
250
Marketplace LendingBank
■ Loan acquisition costs ■ Loan processing and servicing costs ■ Loan collections and recovery costs
95 bps
45 bps
40 bps
180 bps
50 bps
115 bps
50 bps
215 bps
Source: Deloitte.
Platforms provide underwriting and servicing for the loans originated in their network. In addition to basic verification of credit scores and income, platforms may look at a borrower’s debt to income ratio, education level, employment history, and other factors to determine creditworthiness. Consumer loans on the platform can see interest rates within the range of 5% to 36% APR, while business loans can carry even higher interest rates of 7 to 39% APR. Each factor plays a part in pricing a loan’s coupon, origination fee, principal approval, and term.
Once a loan is issued and the investment is made, platforms also service the loans, collecting payments from the borrower and issuing coupons to the investors. Should the loan go into default the onus is still on the platform to collect or sell the loan to a third-party collections agency. Typically, a loan that is in arrears will be referred to a collections agency immediately, to try to encourage the borrower to become current on payments. After 3-4 months of unsuccessful collections, the loan would then be sold to a different collections firm or distressed debt buyer, likely at a loss on the original investment.
Historically, annualized net losses have ranged from 2.15% on the lower end to 6.21% this past year. 30-day and 60-day delinquencies have both moved to higher levels since 2016 up to 1.91% and 1.20% from 0.30% and 0.50% respectively. The average rate of annualized net losses over the period is 4.80%. Loan losses in this asset class are typical for unsecured consumer loans. However, platforms look to limit losses by setting higher APRs to compensate for the risk, relying on the amortizing loan structure and by diversifying through vintages.
Marketplace Lending

page 5 of 20
Figure 3: Kroll Bond Rating Agency Tier 1 Marketplace Lending Index
0%
1%
2%
3%
4%
5%
6%
7%
Mar-20Mar-19Mar-18Mar-17Mar-16
Annualized Net Losses 30+ Delinquencies 60+ Delinquencies
Source: Kroll Bond Rating Agency.
Market Overview
Fintech – The World’s Largest Disruptor
Fintech is described as any technology used to innovate existing methods of delivery in financial services. The expansion of technology into financial services has changed the way businesses operate and conduct their services. New methods of interacting with businesses and monetizing on customer relationships have been developed. Every single business in the finance sector has faced increased competition or technological disruption in the past two decades. The world will continue to invest in innovative technologies that improves customer experience and convenience. This has resulted in improved operating efficiencies and cost savings. Over the 6-year timespan through 2014 – 2019, global investing in Fintech grew at a CAGR of 17.60% reaching US$135.7 billion in 2019.
Figure 4: Global Investment Activity (VC, PE, and M&A) in Fintech
201920182017201620152014
US$51.3B
US$64.8BUS$73.7B
US$54.4B
US$140.9BUS$135.7B
Source: KPMG: Pulse of Fintech H2’19 Global Trends.
Marketplace Lending

page 6 of 20
One industry that has not been left untouched is digital banking. The recent advancement of technology has allowed lenders/investors and borrowers to connect through developed online platforms. Investors are now able to access one of the traditional bank’s core activities – direct lending to consumers. The first established platforms, Prosper and Lending Club, were founded in 2006. These platforms were unable to grow significantly until the Global Financial Crisis. Traditional Banks limited their lending to deal with balance sheet issues and focus on the financial stability of their businesses post crisis. In addition, many smaller banks that previously provided capital to consumers and small businesses have been decimated. With the implementation of regulatory reforms including Basel III and Dodd Frank Act, banks have shied away from business activities that required large investments in infrastructure to provide unsecured financing to consumers and small businesses. Banks prefer that these borrowers use credit cards as they generate higher margins and do not require additional investments to access the same market. At the end of 2018, Fintech lenders represented 38% of the market share of personal loan balances.
Figure 5: Market Share of Personal Loan Balances at the end of 2018
Fintech Lenders38%
Banks28%
Traditional Finance Companies13%
Credit Unions21%
Source: DBRS and TransUnion Consumer Credit Database.
As traditional lenders pulled back their lending to consumers and small businesses, borrowers increasingly flocked to lending platforms such as Lending Club or Prosper to refinance existing loans and seek additional funding. With interest rates near zero, investors are left searching for yield. Marketplace Lending is one of the beneficiaries as it provides investors with income to supplement their fixed income holdings. In addition, the support of advanced technology allowed lenders on the platform to access enormous amounts of data on borrowers to systematically underwrite using similar processes as banks. Lenders also have the flexibility to invest in categories with different risk parameters to generate a return/risk profile that meets their needs. Marketplace Lending in the Americas grew quickly in 2015 to US$18 billion compared to US$7.6 billion in the year prior2. By 2019, global Marketplace Lending was valued at US$67.93 billion3 and is projected to reach $558.9 billion by 2027, growing at a CAGR of 29.7%1.
Marketplace Lending

page 7 of 20
Figure 6: Growth of Marketplace Lending Globally
2027P2019A
US$67.9B
CAGR of 29.7%
US$558.9B
Source: University of Cambridge Centre for Alternative Finance, Majesty Alliance & Allied Market Research.
Institutional Investor Interest
The rapid growth of Marketplace Lending has spurred the interest of institutional investors. In a low yielding environment, institutional investors have sought out different avenues to generate additional yield. The systemized approach to lending has attracted many institutions to invest in the space. Institutional investors have contributed to the growth of the asset class, accounting for 80%4 of the funding in the United States and drive a large percentage of the volume across platforms. As the asset class continues to mature with a growing base of institutional investors and advancements in technology, large pools of capital are expected to flow to this asset class.
Figure 7: Institutionalization across the Americas in 2018
0% 20% 40% 60% 80% 100%
Peer-to-peer/MarketplaceProperty Lending
Peer-to-peer/MarketplaceBusiness Lending
Peer-to-peer/MarketplaceConsumer Lending
■ Institutional ■ Non-Institutional
94%
73%
78%
6%
27%
22%
Source: University of Cambridge Centre for Alternative Finance.
Marketplace Lending
page 8 of 20
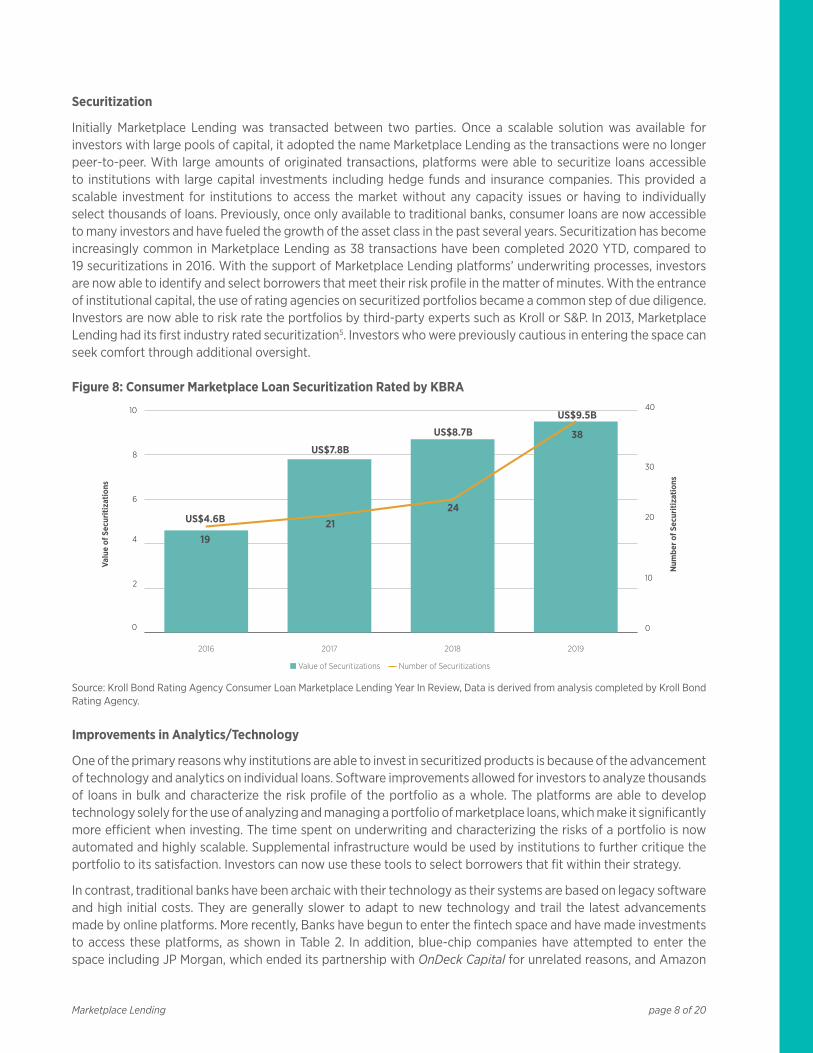
Securitization
Initially Marketplace Lending was transacted between two parties. Once a scalable solution was available for investors with large pools of capital, it adopted the name Marketplace Lending as the transactions were no longer peer-to-peer. With large amounts of originated transactions, platforms were able to securitize loans accessible to institutions with large capital investments including hedge funds and insurance companies. This provided a scalable investment for institutions to access the market without any capacity issues or having to individually select thousands of loans. Previously, once only available to traditional banks, consumer loans are now accessible to many investors and have fueled the growth of the asset class in the past several years. Securitization has become increasingly common in Marketplace Lending as 38 transactions have been completed 2020 YTD, compared to 19 securitizations in 2016. With the support of Marketplace Lending platforms’ underwriting processes, investors are now able to identify and select borrowers that meet their risk profile in the matter of minutes. With the entrance of institutional capital, the use of rating agencies on securitized portfolios became a common step of due diligence. Investors are now able to risk rate the portfolios by third-party experts such as Kroll or S&P. In 2013, Marketplace Lending had its first industry rated securitization5. Investors who were previously cautious in entering the space can seek comfort through additional oversight.
Figure 8: Consumer Marketplace Loan Securitization Rated by KBRA
0
2
4
6
8
10
2019201820172016
■ Value of Securitizations Number of Securitizations
0
10
20
30
40
Valu
e of
Sec
uriti
zatio
ns
Num
ber o
f Sec
uriti
zatio
ns
US$4.6B
US$7.8B
US$8.7B
US$9.5B
1921
24
38
Source: Kroll Bond Rating Agency Consumer Loan Marketplace Lending Year In Review, Data is derived from analysis completed by Kroll Bond Rating Agency.
Improvements in Analytics/Technology
One of the primary reasons why institutions are able to invest in securitized products is because of the advancement of technology and analytics on individual loans. Software improvements allowed for investors to analyze thousands of loans in bulk and characterize the risk profile of the portfolio as a whole. The platforms are able to develop technology solely for the use of analyzing and managing a portfolio of marketplace loans, which make it significantly more efficient when investing. The time spent on underwriting and characterizing the risks of a portfolio is now automated and highly scalable. Supplemental infrastructure would be used by institutions to further critique the portfolio to its satisfaction. Investors can now use these tools to select borrowers that fit within their strategy.
In contrast, traditional banks have been archaic with their technology as their systems are based on legacy software and high initial costs. They are generally slower to adapt to new technology and trail the latest advancements made by online platforms. More recently, Banks have begun to enter the fintech space and have made investments to access these platforms, as shown in Table 2. In addition, blue-chip companies have attempted to enter the space including JP Morgan, which ended its partnership with OnDeck Capital for unrelated reasons, and Amazon
Marketplace Lending
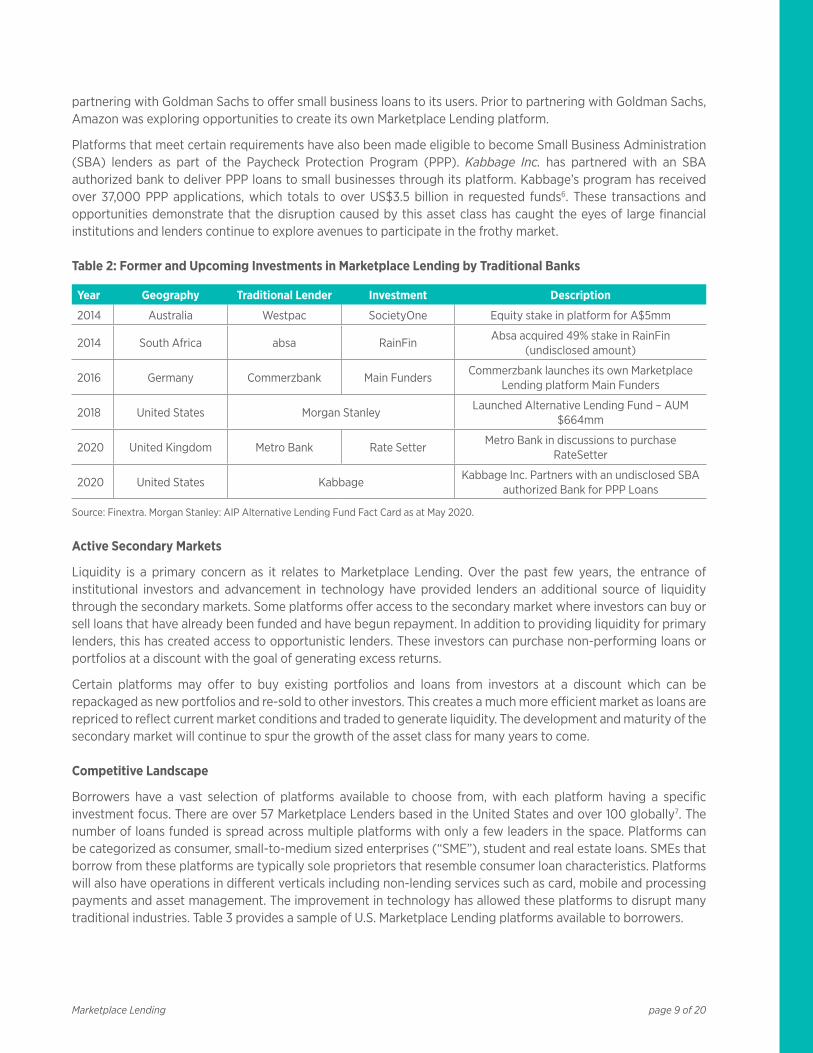
page 9 of 20
partnering with Goldman Sachs to offer small business loans to its users. Prior to partnering with Goldman Sachs, Amazon was exploring opportunities to create its own Marketplace Lending platform.
Platforms that meet certain requirements have also been made eligible to become Small Business Administration (SBA) lenders as part of the Paycheck Protection Program (PPP). Kabbage Inc. has partnered with an SBA authorized bank to deliver PPP loans to small businesses through its platform. Kabbage’s program has received over 37,000 PPP applications, which totals to over US$3.5 billion in requested funds6. These transactions and opportunities demonstrate that the disruption caused by this asset class has caught the eyes of large financial institutions and lenders continue to explore avenues to participate in the frothy market.
Table 2: Former and Upcoming Investments in Marketplace Lending by Traditional Banks
Year Geography Traditional Lender Investment Description
2014 Australia Westpac SocietyOne Equity stake in platform for A$5mm
2014 South Africa absa RainFinAbsa acquired 49% stake in RainFin
(undisclosed amount)
2016 Germany Commerzbank Main FundersCommerzbank launches its own Marketplace
Lending platform Main Funders
2018 United States Morgan StanleyLaunched Alternative Lending Fund – AUM
$664mm
2020 United Kingdom Metro Bank Rate SetterMetro Bank in discussions to purchase
RateSetter
2020 United States KabbageKabbage Inc. Partners with an undisclosed SBA
authorized Bank for PPP Loans
Source: Finextra. Morgan Stanley: AIP Alternative Lending Fund Fact Card as at May 2020.
Active Secondary Markets
Liquidity is a primary concern as it relates to Marketplace Lending. Over the past few years, the entrance of institutional investors and advancement in technology have provided lenders an additional source of liquidity through the secondary markets. Some platforms offer access to the secondary market where investors can buy or sell loans that have already been funded and have begun repayment. In addition to providing liquidity for primary lenders, this has created access to opportunistic lenders. These investors can purchase non-performing loans or portfolios at a discount with the goal of generating excess returns.
Certain platforms may offer to buy existing portfolios and loans from investors at a discount which can be repackaged as new portfolios and re-sold to other investors. This creates a much more efficient market as loans are repriced to reflect current market conditions and traded to generate liquidity. The development and maturity of the secondary market will continue to spur the growth of the asset class for many years to come.
Competitive Landscape
Borrowers have a vast selection of platforms available to choose from, with each platform having a specific investment focus. There are over 57 Marketplace Lenders based in the United States and over 100 globally7. The number of loans funded is spread across multiple platforms with only a few leaders in the space. Platforms can be categorized as consumer, small-to-medium sized enterprises (“SME”), student and real estate loans. SMEs that borrow from these platforms are typically sole proprietors that resemble consumer loan characteristics. Platforms will also have operations in different verticals including non-lending services such as card, mobile and processing payments and asset management. The improvement in technology has allowed these platforms to disrupt many traditional industries. Table 3 provides a sample of U.S. Marketplace Lending platforms available to borrowers.
Marketplace Lending
page 10 of 20
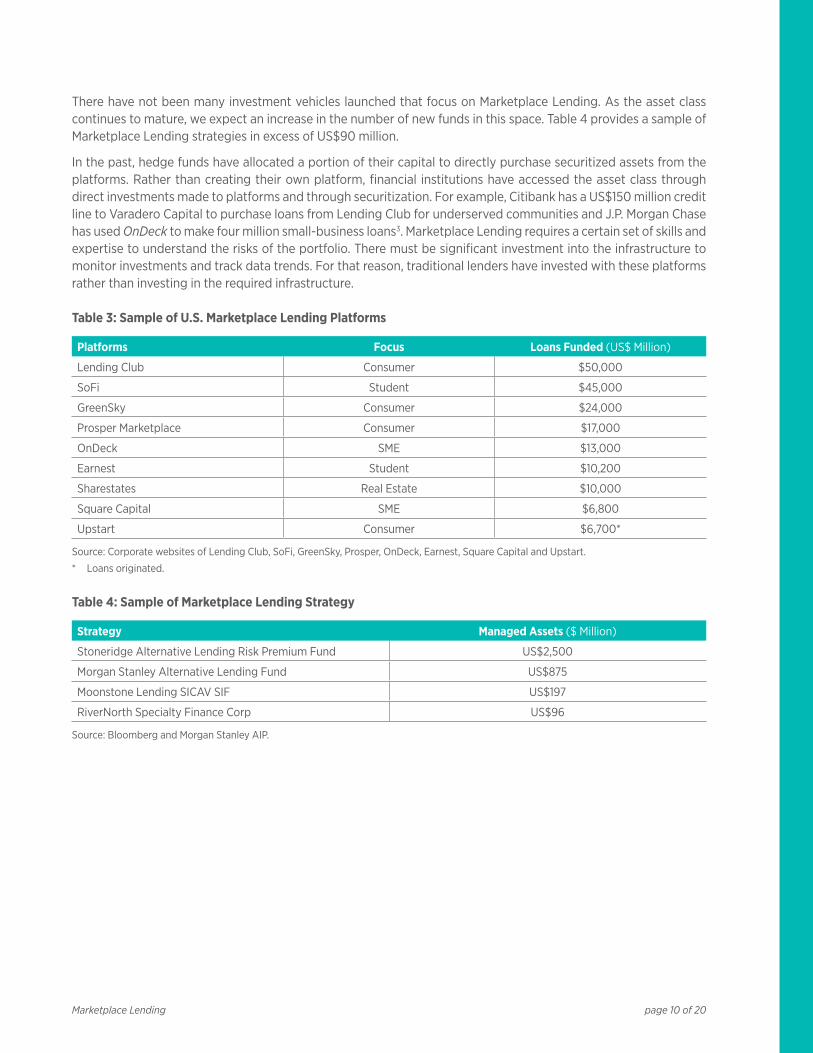
There have not been many investment vehicles launched that focus on Marketplace Lending. As the asset class continues to mature, we expect an increase in the number of new funds in this space. Table 4 provides a sample of Marketplace Lending strategies in excess of US$90 million.
In the past, hedge funds have allocated a portion of their capital to directly purchase securitized assets from the platforms. Rather than creating their own platform, financial institutions have accessed the asset class through direct investments made to platforms and through securitization. For example, Citibank has a US$150 million credit line to Varadero Capital to purchase loans from Lending Club for underserved communities and J.P. Morgan Chase has used OnDeck to make four million small-business loans3. Marketplace Lending requires a certain set of skills and expertise to understand the risks of the portfolio. There must be significant investment into the infrastructure to monitor investments and track data trends. For that reason, traditional lenders have invested with these platforms rather than investing in the required infrastructure.
Table 3: Sample of U.S. Marketplace Lending Platforms
Platforms Focus Loans Funded (US$ Million)
Lending Club Consumer $50,000
SoFi Student $45,000
GreenSky Consumer $24,000
Prosper Marketplace Consumer $17,000
OnDeck SME $13,000
Earnest Student $10,200
Sharestates Real Estate $10,000
Square Capital SME $6,800
Upstart Consumer $6,700*
Source: Corporate websites of Lending Club, SoFi, GreenSky, Prosper, OnDeck, Earnest, Square Capital and Upstart.
* Loans originated.
Table 4: Sample of Marketplace Lending Strategy
Strategy Managed Assets ($ Million)
Stoneridge Alternative Lending Risk Premium Fund US$2,500
Morgan Stanley Alternative Lending Fund US$875
Moonstone Lending SICAV SIF US$197
RiverNorth Specialty Finance Corp US$96
Source: Bloomberg and Morgan Stanley AIP.
Marketplace Lending

page 11 of 20
Why Should Marketplace Lending Be a Part of an Investor’s Portfolio?
Benefits of including an allocation to Marketplace Lending may include:
1. A high-level of diversification;
2. access to an asset class that historically has a low correlation to public markets; and
3. potential to generate strong risk-adjusted portfolio returns.
Credit Diversification
With the median loan size at $12,000 and 3- to 5-year maturities, investors are able to further diversify their portfolio across thousands of loans that differ in duration8. The platforms have the ability to select borrowers within specific categories, including breakdown by credit score, job, income, geography and various other filters. Investors can select exposure to categories where they do not already have access to and utilize the platform to generate alpha.
Typically, an investor’s portfolio will be invested in equities and bonds of corporations and various levels of governments. Prior to the growth of Marketplace Lending it was difficult for investors to gain exposure directly to consumers. By investing in Marketplace Loans, investors are now able to access another avenue of diversification away from corporate and government credit. Over the past several years, corporations and governments have sought additional borrowing and remain highly levered as shown in Figure 9. Currently U.S. households remain at lower leverage levels compared to debtholders in other geographies. With the impact of COVID-19, government entities will continue to borrow in order to provide support to the economy. In comparison, U.S. households have actively deleveraged post the Global Financial Crisis and have lower leverage ratios than Canada and the United Kingdom. Not only should investors consider diversifying through consumer loans, they should also consider the economic health of the country.
Figure 9: Debt as a % of GDP Breakdown by Holder & Country
HouseholdDebt
CorporateDebt
United Kingdom
GovernmentDebt
HouseholdDebt
CorporateDebt
Canada
GovernmentDebt
HouseholdDebt
CorporateDebt
United States
GovernmentDebt
107
75 7680
111
102
8580
84
Source: FRED, Bank of International Settlements.
Marketplace Lending
page 12 of 20
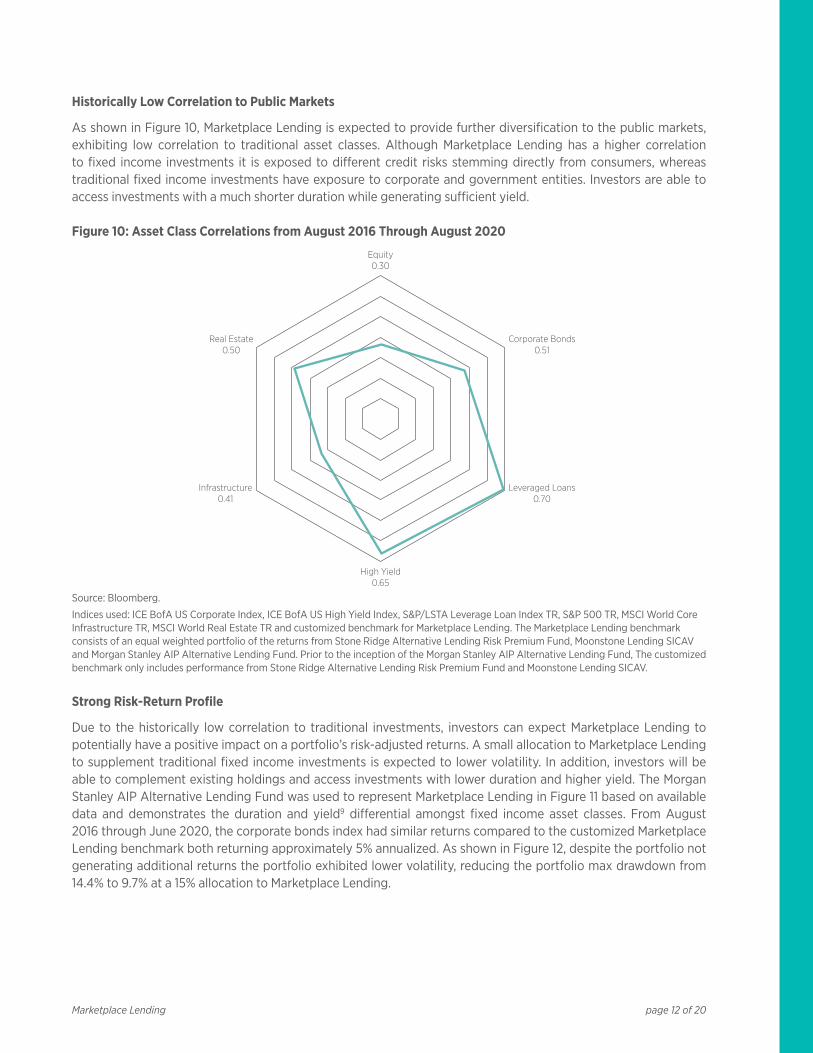
Historically Low Correlation to Public Markets
As shown in Figure 10, Marketplace Lending is expected to provide further diversification to the public markets, exhibiting low correlation to traditional asset classes. Although Marketplace Lending has a higher correlation to fixed income investments it is exposed to different credit risks stemming directly from consumers, whereas traditional fixed income investments have exposure to corporate and government entities. Investors are able to access investments with a much shorter duration while generating sufficient yield.
Figure 10: Asset Class Correlations from August 2016 Through August 2020
Equity0.30
Corporate Bonds0.51
Leveraged Loans0.70
High Yield0.65
Infrastructure0.41
Real Estate0.50
Source: Bloomberg.
Indices used: ICE BofA US Corporate Index, ICE BofA US High Yield Index, S&P/LSTA Leverage Loan Index TR, S&P 500 TR, MSCI World Core Infrastructure TR, MSCI World Real Estate TR and customized benchmark for Marketplace Lending. The Marketplace Lending benchmark consists of an equal weighted portfolio of the returns from Stone Ridge Alternative Lending Risk Premium Fund, Moonstone Lending SICAV and Morgan Stanley AIP Alternative Lending Fund. Prior to the inception of the Morgan Stanley AIP Alternative Lending Fund, The customized benchmark only includes performance from Stone Ridge Alternative Lending Risk Premium Fund and Moonstone Lending SICAV.
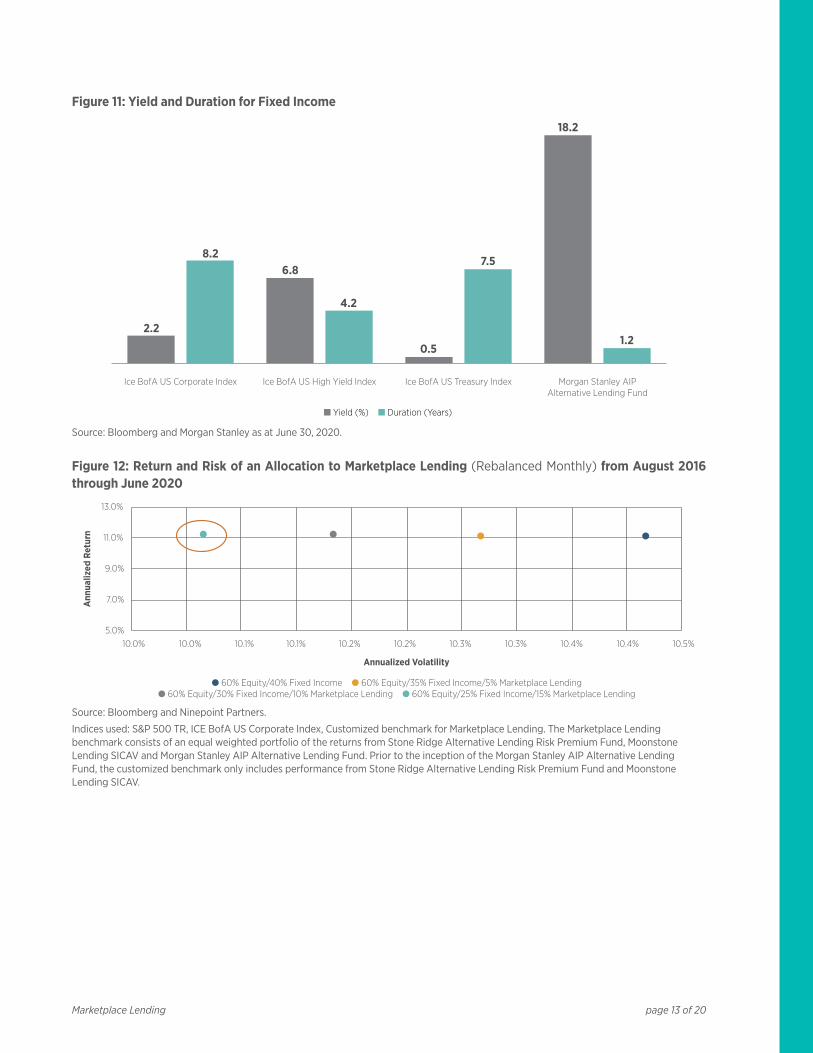
Strong Risk-Return Profile
Due to the historically low correlation to traditional investments, investors can expect Marketplace Lending to potentially have a positive impact on a portfolio’s risk-adjusted returns. A small allocation to Marketplace Lending to supplement traditional fixed income investments is expected to lower volatility. In addition, investors will be able to complement existing holdings and access investments with lower duration and higher yield. The Morgan Stanley AIP Alternative Lending Fund was used to represent Marketplace Lending in Figure 11 based on available data and demonstrates the duration and yield9 differential amongst fixed income asset classes. From August 2016 through June 2020, the corporate bonds index had similar returns compared to the customized Marketplace Lending benchmark both returning approximately 5% annualized. As shown in Figure 12, despite the portfolio not generating additional returns the portfolio exhibited lower volatility, reducing the portfolio max drawdown from 14.4% to 9.7% at a 15% allocation to Marketplace Lending.
Marketplace Lending
page 13 of 20
Figure 11: Yield and Duration for Fixed Income
Morgan Stanley AIPAlternative Lending Fund
Ice BofA US Treasury IndexIce BofA US High Yield IndexIce BofA US Corporate Index
2.2
8.26.8
4.2
0.5
7.5
18.2
1.2
■ Yield (%) ■ Duration (Years)
Source: Bloomberg and Morgan Stanley as at June 30, 2020.
Figure 12: Return and Risk of an Allocation to Marketplace Lending (Rebalanced Monthly) from August 2016 through June 2020
5.0%
7.0%
9.0%
11.0%
13.0%
10.0% 10.0% 10.1% 10.1% 10.2% 10.2% 10.3% 10.3% 10.4% 10.4% 10.5%
Ann
ualiz
ed R
etur
n
Annualized Volatility
● 60% Equity/40% Fixed Income ● 60% Equity/35% Fixed Income/5% Marketplace Lending● 60% Equity/30% Fixed Income/10% Marketplace Lending ● 60% Equity/25% Fixed Income/15% Marketplace Lending
Source: Bloomberg and Ninepoint Partners.
Indices used: S&P 500 TR, ICE BofA US Corporate Index, Customized benchmark for Marketplace Lending. The Marketplace Lending benchmark consists of an equal weighted portfolio of the returns from Stone Ridge Alternative Lending Risk Premium Fund, Moonstone Lending SICAV and Morgan Stanley AIP Alternative Lending Fund. Prior to the inception of the Morgan Stanley AIP Alternative Lending Fund, the customized benchmark only includes performance from Stone Ridge Alternative Lending Risk Premium Fund and Moonstone Lending SICAV.
Marketplace Lending

page 14 of 20
What Does the U.S. Economic Landscape Look Like Now?
Unemployment
Looking at the impact of COVID-19, certain industries were affected more so than others. Hospitality, brick and mortar retail, entertainment, travel and leisure were amongst the industries that were impacted the most. Many other industries including finance and technology (software) were quick to transition to working from home. The transition was seamless for most with only minor disturbances as many companies have strong business continuity plans in place. Nevertheless, the unemployment rate in the United States gained 10.3%, skyrocketing to 14.7% in April 2020 from 4.4% in March 2020. It has now come down to 7.9% as at September 2020 with restrictions lifted. A detailed look at unemployment numbers and affected industries show that the pandemic has disproportionately created a fallout amongst lower income workers. As shown in Figure 13, the average hourly earnings of all employees increased to as high as US$30, an increase of 4.7% from the prior month compared to the average monthly increase of 0.20% over the past 10 years. This suggests that workers who were affected are mainly lower income workers.
Figure 13: U.S. Unemployment Rate & Average Hourly Earnings of All Employees (%)
0
5
10
15
20
Jan-2020Jan-2019Jan-2018Jan-2017Jan-2016Jan-2015Jan-2014Jan-2013Jan-2012Jan-2011Jan-201020
22
24
26
28
30
32
U.S. Unemployment Rate Average Hourly Earnings
Source: U.S. Bureau of Labor Statistics. Average Hourly Earnings of All Employees are preliminary numbers as at October 5, 2020.
In recent months, employment has followed a positive trend as lockdown restrictions have begun to ease. However, the effects of the pandemic are expected to remain, and businesses will continue to be forced to operate at reduced capacities. These businesses will not be able to afford to bring back all of their employees at the current operating levels; thus, it is expected that there will be increased investment in new innovations that lead to contactless and automated services. This was inevitable with the improvements in technology to phase out lower skilled jobs that can be automated. For example, we have already seen large corporations transition to self-order kiosks, and the pandemic will only expedite the process. In turn, this could lead to permanent job loss in the short to medium term for lower income workers. Figure 14 shows that the unemployment rate is not forecasted to reach 2019 levels through 2021.
Marketplace Lending

page 15 of 20
Figure 14: Forecasted U.S. Unemployment Rate (%)
0
2
4
6
8
10
12
14
Q4 21EQ3 21EQ2 21EQ1 21EQ4 20EQ3 20AQ2 20A
JP Morgan Chase Morgan Stanley BMO Capital Citigroup Goldman Sachs Group Scotia Bank 2019 Average
Source: Bloomberg, as at October 21, 2020.
Leverage
The leverage levels in the United States for the three types of borrowers are very distinct. The U.S. Federal government has increasingly levered its balance sheet to deal with the repercussions of the 2008 Global Financial Crisis. U.S. Federal Debt as a percentage of GDP catapulted from 64% at the beginning of 2008 to 136% as at Q2 2020. Similarly, for U.S. non-financial corporations, debt levels have slowly progressed upward over the past several decades. Corporations were able to take advantage of the lower borrowing costs in the past decade and have slightly increased their debt to GDP to 78%. However, when examining the debt level of the U.S. households, there was a significant deleveraging period post the Global Financial Crisis. The crisis caused traditional Banks to significantly tighten up its balance sheets, which led to reduced new borrowings, especially for consumers. As the economic recovery ensued, household incomes improved, and banks began to loosen some of their requirements. Despite this, banks remain restricted to new transactions in certain asset classes with the introduction of stricter regulation, including the Dodd Frank Act and Basel III. Banks have been quick to respond to COVID-19 by further tightening their lending criteria. This will have large effects on household savings and it has shown in the most recent data provided by FRED Economic Data in Figure 17.
Marketplace Lending

page 16 of 20
Figure 15: U.S. Federal, Corporate and Household Debt as a % of GDP
20
40
60
80
100
120
Jan-2016Jan-2006Jan-1996Jan-1986Jan-1976Jan-1966
Federal Debt US Non-Financial Corporate US U.S. Household
Source: FRED: Federal Debt: Total Public Debt, Amount Outstanding of Total Debt Securities in Non-Financial Corporations Sector and Household Debt to GDP for United States.
U.S. households have drastically increased their personal savings rate to 24.5% in May 2020 from 7.8% from the year prior10 and has come down slightly to 14.1% as at August 2020. The drastic increase can be partially explained by the government aid programs that came into effect. Consumers seem to be preparing for upcoming expenses and bills in unison with a loss in income. As at April 2020 and June 2020, personal savings tottaled US$6,022 billion and US$3,158 billion respectively, compared to US$1,330 billion at January 2020. In comparison, the total consumer credit totaled US$4,127 billion in Q2 2020. We expect consumer credit to fall accordingly as excess savings will be used to reduce the debt burden in the next few quarters after paying for expenses. The U.S. government has provided US$2.3 trillion in financial aid to all households through the CARES Act. By large, approximately 86% of respondents to a survey reported to using the stimulus cheques to meet expenses or pay off debt with the remaining respondents using them to contribute to their savings11. As shown in Figure 16, most of the respondents utilized the cheque to meet necessities. As a result, it is likely that another stimulus deal will be reached as households require additional assistance.
Figure 16: Household Pulse Survey – Stimulus Check Usage
0 10 20 30 40 50 60
Did not report
Recreational goods
Charitable donations or givingto family members
Household items (TV, electronics,furniture, appliances)
Other
Clothing (clothing, accessories, shoes)
Savings or investments
Paying down credit card,student loans, or other debts
Vehicle payments(scheduled or monthly)
Mortgage (scheduled or monthly)
Rent
Household supplies orpersonal care products
Utilities and telecommunications
Food (groceries, eating out, take out)
44.4%45.3%
25.6%21.7%21.7%
19.6%11.5%
16.5%4.6%
5.3%4.2%
2.2%1.5%
59.7%
Source: United States Census Bureau: Week 15 Stimulus Table.
Marketplace Lending

page 17 of 20
Figure 17: U.S. Household and Nonprofit Organization Consumer Credit & Personal Savings
$0
$1,000
$2,000
$3,000
$4,000
$5,000
$6,000
$7,000
2019200919991989197919691959
Households and Nonprofit Organizations; Consumer Credit Personal Savings
Source: FRED: Households and Nonprofit Organizations; Consumer Credit; Liability, Level & Personal Savings.
The pandemic will have slightly different consequences compared to the Global Financial Crisis. The pandemic has resulted in a health crisis that has affected most industries with many forced to operate at reduced capacities, whereas in 2008 the economic damage was primarily caused by damage to the financial sector. In 2008, fiscal and monetary measures spurred economic activity and in turn increased income levels, leading to household deleveraging. In the short to medium term, it is unlikely for the average U.S. household leverage to continue to decrease without additional government aid. Operating at reduced capacity will be difficult for many businesses to sustain and so a significant rise in employment and income is not expected without a widely available vaccine. Many households seem to have tapped into their savings to meet their expenses in addition to the stimulus checks provided by the U.S. Federal Government. To combat increased credit stress, it is expected the federal government will continue to lever up its balance sheet in the near future to provide a bridge to U.S. households until a deleveraging period is sustainable.
Delinquency Rates
Credit card delinquency rates in the United States have remained at suppressed levels; most recently at 2.42% as at Q2 2020. The federal stimulus programs have provided aid to consumers, allowing users to meet their expenses and make payments. Looking at the survey conducted by the Federal Reserve Bank of New York shown in Figure 19, the initial impact of state lockdowns have financially stressed many consumers, increasing expected delinquencies to 16.5%. However, with the release of financial support from the government, the delinquency rate expected quickly dropped to 9.6%. The aid programs will continue to meet the needs for most consumers, but they are likely to rely on the payments until capacity limits are lifted.
Marketplace Lending

page 18 of 20
Figure 18: U.S. Credit Card Delinquency Rate, All Commercial Banks (%)
0
1
2
3
4
5
6
7
2020201520102005200019951991
Source: FRED: U.S. Credit Card Delinquency Rate, All Commercial Banks.
Figure 19: Federal Reserve Bank of New York Survey, U.S. Debt Delinquency Expected – Not Being able to Make Minimum Debt Payments Over Next 3 Months (%)
9
11
13
15
17
2020201920182017201620152014
Source: Bloomberg, as at October 8, 2020.
The effects of the pandemic have widely altered the lifestyle of many individuals. However, the brunt of the damage was dealt to lower income earners. Figure 20 demonstrates that the majority of the survey respondents to the U.S. Census Bureau will use the stimulus cheque for expenses and to pay off debt. Consumers with income over $75,000 have the ability to save the stimulus cheques; suggesting that they are unlikely to be financially stretched. Whereas, consumers with income under $75,000 seem to be unable to save the proceeds from the stimulus program and have used it to meet expenses. With unemployment rates expected to be at elevated levels through 2021, the population with lower household income is expected to see an increase in delinquency rates without additional government aid.
Marketplace Lending

page 19 of 20
Figure 20: U.S. Household Pulse Survey – Stimulus Usage Breakdown by Income
0% 20% 40% 60% 80% 100%
Less than $25,000
$25,000 - $34,999
$35,000 - $49,999
$50,000 - $74,999
$75,000 - $99,999
$100,000 - $149,999
$150,000 - $199,999
$200,000 and above
■ Used, or will be used, mostly for expenses ■ Used, or will be used, mostly to pay o debt■ Used, or will be used, mostly to add to savings
54.6%
72.4%
80.5%
86.1%
63.1%
69.4%
55.7%
3.4%
83.3%
19.4%
16.0%
12.3%
10.5%
17.9%
15.6%
13.4%
11.8%
26.0%
11.6%
7.2%
18.9%
15.0%
30.9%
4.9%
Source: United States Census Bureau: Week 12 Stimulus Table.
How Does the Pandemic Affect U.S. Marketplace Loans?
The unemployment rate is expected to gradually decrease over the next several quarters, though remaining elevated compared to pre-pandemic levels. Consumer income has decreased as many find it difficult to make ends meet. The pandemic has disproportionally affected the lower income population. Government stimulus programs and forbearance agreements initiated by lenders have provided a much-needed support to consumers with lower income. With most businesses unable to operate at full capacity and elevated unemployment rates, income levels will remain suppressed at least in the medium term. With credit standstill agreements coming to an end, borrowers will be forced to make required payments. Suppressed income levels in addition to increased financial stress could lead to an increase in consumer loan delinquencies.
Prior to the height of the pandemic, platforms began to diversify funding sources, established warehouse credit facilities and lowered costs to increase operating cashflows. Many Marketplace Lenders are nimble and were too quick to adjust their underwriting standards to safeguard investor capital. Underwriting amendments include lowering approval rates for high-risk borrowers, increasing interest rates on new transactions, imposing additional income and employment screening requirements and focusing on channels where the platforms have flexibility to control volume and credit quality. Certain platforms have also included payment plans, extensions and settlements to aid the borrowers.
We believe the performance of the lenders that have chased returns (versus credit quality) will lag in the foreseeable future. Borrowers with lower incomes and poor credit history are expected to be adversely impacted as government stimulus programs taper off and forbearance agreements come to an end. Lenders that have provided capital to consumers with higher income, higher credit score and are employed in industries that were not significantly damaged by the pandemic will outperform. Large platforms have been quick to adjust their underwriting criteria by emphasizing higher credit quality. Managers that have remained disciplined with strict underwriting and due diligence standards are expected to outperform and incur minimal loan losses12.
It is crucial for investors to determine whether an investment fund has provided for sufficient loan loss provisions or are marked to fair value. With the expected rise in delinquencies, portfolio valuation will be crucial for timely assessment of loan impairments. Loans that are older in vintage will not be significantly affected as marketplace loans are amortizing. These loans will have a portion of the principal paid back and as a result, have less impact on the valuation of the portfolio. On the other hand, loans that were issued just before the pandemic, will have a larger effect as these loans have not made any principal repayments.
Marketplace Lending

FOOTNOTES1 National Crowdfunding and Fintech Association: How Consumers Can Benefit from Traditional Peer-to-Peer Business Loans.2 University of Cambridge Centre for Alternative Finance, Majesty Alliance.3 Allied Market Research: Global P2P Lending Market.4 Schulte Roth & Zabel: Marketplace Lending: Opportunities and Challenges for Private Investment Funds.5 PeerIQ: Marketplace Lending Securitization Tracker, Q2 2018.6 Business Wire: Kabbage Partners with SBA-Authorized Bank to Deliver Paycheck Protection Program Loans to Small Businesses.7 Digital Commerce 360: What are the top online marketplaces?8 FDIC: Financial Innovation and Borrowers: Evidence from Peer-to-Peer Lending, May 6, 2019.9 Coupon from the AIP Alternative Lending Fund is the annual interest rate paid on a bond/loan before accounting for pre-payments and
defaults.10 FRED: Personal Savings Rate.11 United States Census Bureau: Majority Who Received Stimulus Payments Spending Most of It on Household Expenses.12 Crowdfund Insider: LendingClub Looks to Enhance Resiliency of Portfolio as Coronavirus Rattles Financial Markets.
DISCLAIMERS
The opinions, estimates and projections (“information”) contained within this report are solely those of Ninepoint Partners LP (“Ninepoint”) and are subject to change without notice. Ninepoint makes every effort to ensure that the information has been derived from sources believed to be reliable and accurate. However, Ninepoint assumes no responsibility for any losses or damages, whether direct or indirect, which arise out of the use of this information. Ninepoint is not under any obligation to update or keep current the information contained herein. The information should not be regarded by recipients as a substitute for the exercise of their own judgment. Please contact your own personal advisor on your particular circumstances. Views expressed regarding a particular company, security, industry or market sector should not be considered an indication of trading intent of any investment funds managed by Ninepoint Partners LP. These views are not to be considered as investment advice nor should they be considered a recommendation to buy or sell. The information contained herein does not constitute an offer or solicitation by anyone in the United States or in any other jurisdiction in which such an offer or solicitation is not authorized or to any person to whom it is unlawful to make such an offer or solicitation. Prospective investors who are not resident in Canada should contact their financial advisor to determine whether securities of the Funds may be lawfully sold in their jurisdiction. Materials may not be delivered or made available to individuals or entities that are not classified as (i) “Non-United States Persons” within the meaning of Section 4.7(a)(1)(iv) of the rules of the CFTC or (ii) permitted clients (as defined in section 1.1 of Canadian National Instrument 31-103). This document is for information purposes only and should not be relied upon as investment advice. We strongly recommend that you consult your investment professional for a comprehensive review of your personal financial situation before undertaking any investment strategy. Information herein is subject to change without notice and Ninepoint is not responsible for any inaccuracies or to update this information.
Ninepoint Partners LP: Toll Free: 1.866.299.9906. DEALER SERVICES: CIBC Mellon GSSC Record Keeping Services: Toll Free: 1.877.358.0540
ninepoint.com
page 20 of 20Marketplace Lending