MarketingfactPack2015ed (2)
36
PUBLISHED DECEMBER 29, 2014 ©COPYRIGHT 2014 CRAIN COMMUNICATIONS INC. SPONSORED BY 2015 Editi ANNUAL GUIDE TO MARKETERS, MEDIA AND AGENCIES 2015 Edition MARKETING ANNUAL GUIDE TO MARKETERS, MEDIA AND AGENCIE S FACT PACK 78% Percent of Americans who live in a household with high-speed internet 24.8% Internet’s share of U.S. advertising spending in 2014, three times the level of 2007 No. 2 China’s ranking in global ad markets, up from 10 in 2000 $183B 2015 U.S. ad spending forecast, topping peak set in prerecession 2007 U.S. ad agency employment, the highest point for agency jobs since 2001 197,100
-
Upload
jared-sternbach -
Category
Documents
-
view
85 -
download
0
Transcript of MarketingfactPack2015ed (2)

PUBLISHED DECEMBER 29, 2014©COPYRIGHT 2014 CRAIN COMMUNICATIONS INC.
SPONSORED BY
2015 Editi
ANNUAL GUIDE TO MARKETERS, MEDIA AND AGENCIES
2015 Edition
MARKETING
ANNUAL GUIDE TO MARKETERS, MEDIA AND AGENCIES
FACT PACK
78%Percent of Americans
who live in ahousehold with
high-speedinternet
24.8%Internet’s share of U.S.advertising spending
in 2014, threetimes the level
of 2007
No. 2China’s ranking inglobal ad markets,
up from 10 in2000
$183B2015 U.S. ad spendingforecast, topping peak
set in prerecession2007
U.S. ad agencyemployment, thehighest point for
agency jobs since 2001
197,100
marketingfp2 JC v31.qxp 12/11/2014 2:53 PM Page 1

©2015 Neustar, Inc.This information is compiled at the household level using Neustar’s products and services and is not based on actual online behavioral data.
OKAY, THEY DRIVEA MINIVAN. BUT WHAT’S BEHINDTHE TAILGATE?
You might guess they listen to classic rock and like to visit aquariums. But did you know that mom is more likely to read Cosmopolitan™ than Parenting©? That they watch TV with their kids and have an affinity for blended whiskey? Imagine what you could do with our authoritative data. Go to www.neustar.biz/wagners.
THE WAGNER FAMILY / / WAY MORE THAN A DECAL
AA012786p02.indd 1 12/11/14 1:19 PM

MARKETING FACT PACK 2015
ADVERTISING AGE DECEMBER 29, 2014 • 3
Ad Age’s Marketing Fact Pack 2015was produced by Ad Age DataCenterand published Dec. 29, 2014
Email: [email protected]
Send mail to: Advertising Age 150 N. Michigan Ave., Ste. 1737 Chicago, IL 60601
Ad sales: Jackie Ramsey212-210-0475 [email protected]
Additional copies: Order print copies [email protected] or by calling 1-877-320-1721; for readers outside the U.S.,1-313-446-0450. Digital edition available atAdAge.com/annual2015
Staff: Directors: Kevin Brown, Bradley Johnson.Editors: Shawna Lent, Catherine Wolf.Research assistants: Kim Bauer, Michael Corio,Jake Guidry, Steven Montero, Katie Robinson
This document, and informationcontained therein, is the copy-
righted property of Crain Communications Inc. andThe Ad Age Group (© Copyright 2014) and is foryour personal, non-commercial use only. You maynot reproduce, display on a website, distribute, sellor republish this document, or the information con-tained therein, without prior written consent ofThe Ad Age Group.
|MARKETING|
P. 6:
Advertising spending growth ratesU.S. and worldwide media spending trends
P. 8:
Largest advertisersIn the U.S. and worldwide
P. 10:
U.S. market leadersAd spending and share figures
|MEDIA|
P. 16:
Share of ad spending by mediumIncluding internet’s share of U.S. and worldwidead spending
P. 20:
Digital mediaLargest web properties. Upwardly mobile advertisers
P. 22:
Largest TV networksMore: Ad Age’s prime-time TV price chart on Page 24
|AGENCIES|
P. 26:
World’s 10 largest agency companiesMore: World’s largest agency networks on Page 27
P. 28:
Largest agency ventures by categoryCompanies, networks and agencies
Agency growth and digital’s shareIndustry growth, 2009-2013
|CONSUMERS|
P. 30:
Population and consumer sentimentDemographics and consumer confidence
P. 32:
How consumers interact with media technology Smartphones. Multitasking while watching TV
JOBS|
P. 34:
U.S. ad industry employmentAd agencies and internet media
INSIDEAdvertising Age’s annual guide to marketers, media and agencies. Who’s rising. Who’s falling.
Biggest players and brands. How consumers spend their time. What’s up in adland jobs.
marketingfp2 JC v31.qxp 12/11/2014 2:53 PM Page 3

IN THE AD AGE DATACENTER, YOU’LL FIND
OF THIS FACT PACK,
WE LIST THE NATION’S
MORE.
LARGEST AD SPENDERS.
Subscribe to DataCenter Today and Save $100
adage.com/datacenter2015
• Spending by media for the top 100 U.S. advertisers—plus the execs who make the decisions and agencies that handle
the accounts
• The most-advertised brand in the U.S.—and the next 199
• The 100 biggest global advertisers
• The top-spending advertisers in more than 90 countries
• The largest spenders in b-to-b
• The makeup of the world’s 50 largest agency companies
SUBSCRIBE TO DATACENTER AND ACCESS:
ON PAGE
f_DataCenter House Ad_Fact Pack_12.29.14.indd 1 12/11/14 10:23 AMAA012787.indd 1 12/11/14 1:23 PM

MARKETING FACT PACK 2015
ADVERTISING AGE DECEMBER 29, 2014 • 5
SUBSCRIBE TO AD AGE DATACENTERDataCenter subscribers get exclusive access toAdAge.com/datacenter content.
Explore Ad Age’s marketers database (profiles, brands, agencyrosters, executives, spending), updated in December 2014:AdAge.com/marketertrees2014update
Get agency rankings: AdAge.com/agencyreport2014
Find facts on the global advertising market:AdAge.com/globalmarketers2014
Subscribe: AdAge.com/getdatacenter
THE BIG LIST10 key facts on the world of marketers, media and agencies
1
3
5
7
9
2
4
6
8
10
BIGGEST U.S. ADVERTISER IN 2013
Procter & Gamble Co.: $5B in total ad spending
MOST-ADVERTISED U.S. BRAND BASED ON MEASURED MEDIA IN 2013
AT&T: $1.8 B in ad spending
MAJOR-MEDIA SPENDING IN 2015 (FORECAST)
Worldwide: $545 B ad spending
MINUTES PER DAY ADULTS IN U.S. SPENT WITH MAJOR MEDIA IN 2014
TV: 273 minutes; digital media: 346 minutes
BIGGEST U.S. AD MEDIUM IN 2014
TV: 38.1% of ad spending
FASTEST-GROWING U.S. AD MEDIUM IN 2014
Internet: 18.3% growth
BIGGEST U.S. MOBILE AD SELLER IN 2014
Google: $7 B in mobile-ad revenue
WORLD’S BIGGEST AGENCY COMPANY IN 2013
WPP: $17 B in revenue
WORLD’S BIGGEST AGENCY NETWORK IN 2013
Young & Rubicam Group: $3.6 B in revenue
BIGGEST U.S. AGENCY NETWORK IN 2013
McCann Worldgroup: $1.6 B in revenue
marketingfp2 JC v31.qxp 12/11/2014 2:54 PM Page 5

MARKETING FACT PACK 2015
ADVERTISING AGE6 • DECEMBER 29, 2014
MARKETERSU.S. and worldwide media advertising growth rates
Percent change in advertising dollars. The average of GroupM, Magna Global and ZenithOptimediaforecasts suggests U.S. advertising growth of 3.5% in 2015, down from 4.0% in 2014;
and worldwide ad growth of 4.9% in 2015, a slight uptick from 4.8% in 2014.
U.S.: 2007-2017 Worldwide: 2007-2017
-20
-10
0
10%
’17’16’15’14’13’12’11’10’09’08’07
-20
-10
0
10%
’17’16’15’14’13’12’11’10’09’08’07
Average of GroupM, Magna Global and ZenithOptimedia Average of GroupM, Magna Global and ZenithOptimedia
-20
-10
0
10%
’17
3.1
’16
4.8
’15
3.5
’14
4.0
’13’12
2.94.5
’11’10
2.63.3
’09’08
-12.0
-3.9
’07
1.2
-20
-10
0
10%
’17’16’15’14’13’12’11’10’09
-8.8
’08’07
5.65.64.94.83.84.14.7
7.4
0.3
5.1
Source: December 2014 advertising forecasts of WPP's GroupM (groupm.com), Interpublic Group of Cos.' Magna Global (magnaglobal.com)and Publicis Groupe's ZenithOptimedia (zenithoptimedia.com). Figures include TV, internet, newspaper, magazine, radio and out-of-home. GroupM2016 and 2017 worldwide growth based on a separate GroupM long-term forecast model. Figures from WPP's Kantar Media (kantarmedia.us) areU.S. measured-media spending growth rates. U.S. averages for 2016 and 2017 based on average of Magna Global and ZenithOptimedia.
■ MAGNA GLOBAL (INTERPUBLIC) ■ ZENITHOPTIMEDIA (PUBLICIS) ■ GROUPM (WPP) ■ KANTAR MEDIA (WPP)
marketingfp2 JC v31.qxp 12/11/2014 2:54 PM Page 6
MARKETING FACT PACK 2015
ADVERTISING AGE DECEMBER 29, 2014 • 7
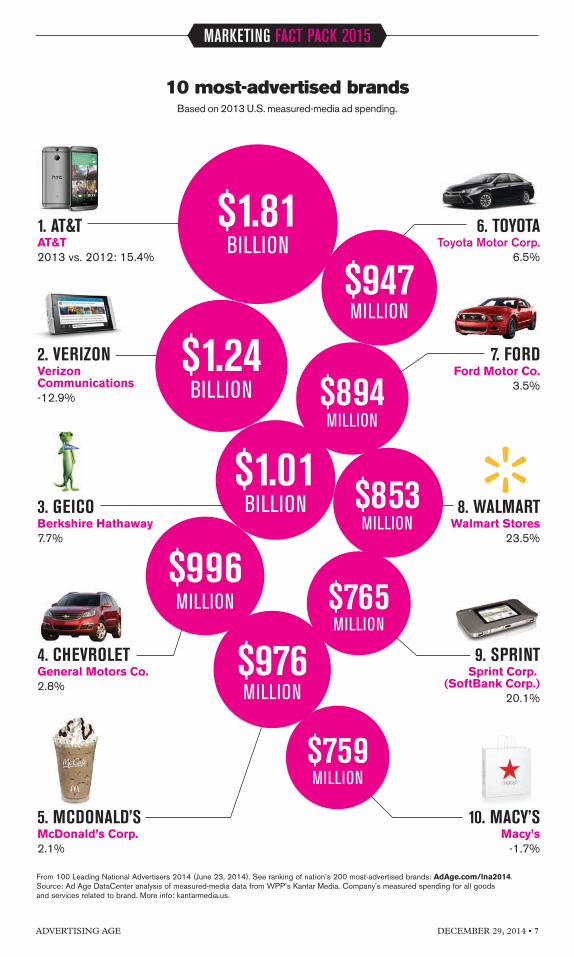
10 most-advertised brands Based on 2013 U.S. measured-media ad spending.
From 100 Leading National Advertisers 2014 (June 23, 2014). See ranking of nation’s 200 most-advertised brands: AdAge.com/lna2014.Source: Ad Age DataCenter analysis of measured-media data from WPP’s Kantar Media. Company's measured spending for all goodsand services related to brand. More info: kantarmedia.us.
5. MCDONALD’SMcDonald’s Corp.2.1%
2. VERIZONVerizon Communications-12.9%
7. FORDFord Motor Co.
3.5%
3. GEICOBerkshire Hathaway7.7%
8. WALMARTWalmart Stores
23.5%
4. CHEVROLETGeneral Motors Co.2.8%
9. SPRINTSprint Corp.
(SoftBank Corp.)20.1%
10. MACY’SMacy’s
-1.7%
$1.81BILLION
$1.24BILLION
$1.01BILLION
$996MILLION
$976MILLION
$947MILLION
$894MILLION
$853MILLION
$765MILLION
$759MILLION
1. AT&TAT&T2013 vs. 2012: 15.4%
6. TOYOTAToyota Motor Corp.
6.5%
marketingfp2 JC v31.qxp 12/11/2014 2:54 PM Page 7

MARKETING FACT PACK 2015
ADVERTISING AGE8 • DECEMBER 29, 2014
TOTAL U.S. AD SPENDING U.S. MEASURED-MEDIA(MEASURED MEDIA PLUS UNMEASURED) AD SPENDING
RANK MARKETER, HEADQUARTERS 2013 2012 % CHG 2013 2012 % CHG
1 Procter & Gamble Co. Cincinnati $4,991 $4,830 3.3 $3,466 $3,141 10.4
2 AT&T Dallas 3,268 2,910 12.3 1,856 1,642 13.1
3 General Motors Co. Detroit 3,150 3,067 2.7 1,812 1,652 9.7
4 Comcast Corp. Philadelphia 3,082 2,989 3.1 1,663 1,736 -4.2
5 Ford Motor Co. Dearborn, Mich. 2,559 2,278 12.4 1,138 1,078 5.5
6 Verizon Communications New York 2,438 2,381 2.4 1,238 1,428 -13.3
7 L’Oréal Clichy, France 2,335 2,240 4.3 1,605 1,510 6.3
8 American Express Co. New York 2,191 2,073 5.7 300 328 -8.5
9 Toyota Motor Corp. Toyota City, Japan 2,090 2,008 4.1 1,275 1,257 1.4
10 Fiat Chrysler Automobiles London 1,974 1,947 1.4 1,166 1,169 -0.2
11 Walt Disney Co. Burbank, Calif. 1,964 1,879 4.5 891 959 -7.0
12 JPMorgan Chase & Co. New York 1,879 2,087 -10.0 402 444 -9.5
13 Johnson & Johnson New Brunswick, N.J. 1,875 1,640 14.3 1,034 862 19.9
14 Walmart Stores Bentonville, Ark. 1,827 1,809 1.0 935 768 21.8
15 Microsoft Corp. Redmond, Wash. 1,811 1,127 60.7 1,004 632 58.8
16 Samsung Electronics Co. Seoul 1,701 1,408 20.8 614 594 3.4
17 Target Corp. Minneapolis 1,697 1,653 2.7 731 671 9.0
18 Time Warner New York 1,653 1,567 5.5 901 853 5.7
19 Macy’s Cincinnati 1,623 1,554 4.4 837 852 -1.8
20 Pfizer New York 1,596 1,372 16.3 1,158 923 25.5
21 Bank of America Corp. Charlotte, N.C. 1,580 1,615 -2.2 476 425 12.0
22 Anheuser-Busch InBev Leuven, Belgium/St. Louis 1,564 1,514 3.3 572 571 0.2
23 Sprint Corp. (SoftBank Corp.) Overland Park, Kan. 1,555 1,400 11.1 943 835 13.0
24 Berkshire Hathaway Omaha, Neb. 1,548 1,503 3.0 1,252 1,186 5.6
25 Amazon Seattle 1,435 1,140 25.9 329 302 8.9
Total for the 25 $53,386 $49,991 6.8 $27,599 $25,817 6.9
From 100 Leading National Advertisers 2014 (June 23, 2014). See expanded data and report methodology at AdAge.com/lna2014.See 100 Leading National Advertisers database including profiles, agency rosters and executives, updated in December 2014:AdAge.com/marketertrees2014update.
Source: Ad Age DataCenter. Total U.S. ad spending is measured-media ad spending (from WPP’s Kantar Media) plus unmeasured spending(estimated by Ad Age). Numbers rounded. Measured spending includes TV, newspaper, magazine, radio, outdoor and internet (display advertising;excludes paid search, video and other forms of internet advertising). More info: kantarmediana.us. Unmeasured spending figures are Ad AgeDataCenter estimates including direct marketing, promotion, internet paid search, social media and other forms of spending not included inmeasured media.
25 largest U.S. advertisersBy 2013 total U.S. ad spending (measured media plus unmeasured spending). Dollars in millions.
marketingfp2 JC v31.qxp 12/11/2014 2:54 PM Page 8

MARKETING FACT PACK 2015
ADVERTISING AGE DECEMBER 29, 2014 • 9
WORLDWIDE U.S. MEASURED-MEDIAMEASURED-MEDIA SPENDING AD SPENDING
RANK MARKETER, HEADQUARTERS 2013 2012 % CHG 2013 2012 % CHG
1 Procter & Gamble Co. Cincinnati $11,468 $10,429 10.0 $3,466 $3,141 10.4
2 Unilever Rotterdam/London 7,906 7,242 9.2 816 854 -4.5
3 L’Oréal Clichy, France 5,934 5,576 6.4 1,605 1,510 6.3
4 Toyota Motor Corp. Toyota City, Japan 3,444 3,387 1.7 1,275 1,257 1.4
5 General Motors Co. Detroit 3,352 3,189 5.1 1,812 1,652 9.7
6 Volkswagen Wolfsburg, Germany 3,227 2,992 7.9 527 544 -3.2
7 Nestlé Vevey, Switzerland 3,120 2,998 4.1 813 812 0.1
8 Coca-Cola Co. Atlanta 2,899 2,886 0.5 320 369 -13.4
9 Mars Inc. McLean, Va. 2,858 2,342 22.1 692 593 16.8
10 PepsiCo Purchase, N.Y. 2,735 2,499 9.4 887 850 4.4
11 Sony Corp. Tokyo 2,721 3,133 -13.2 555 717 -22.6
12 McDonald’s Corp. Oak Brook, Ill. 2,718 2,672 1.8 976 956 2.1
13 RB (Reckitt Benckiser Group) Slough, U.K. 2,541 2,379 6.8 408 476 -14.3
14 Ford Motor Co. Dearborn, Mich. 2,411 2,048 17.7 1,138 1,078 5.5
15 Nissan Motor Co. Yokohama, Japan 2,187 1,954 11.9 862 776 11.1
16 Samsung Electronics Co. Seoul 2,159 2,028 6.4 614 594 3.4
17 Johnson & Johnson New Brunswick, N.J. 2,065 1,832 12.7 1,034 862 19.9
18 Microsoft Corp. Redmond, Wash. 1,983 1,351 46.8 1,004 632 58.8
19 Yum Brands Louisville, Ky. 1,916 1,653 15.9 862 780 10.4
20 Comcast Corp. Philadelphia 1,863 1,972 -5.5 1,663 1,736 -4.2
21 Fiat Chrysler Automobiles London 1,801 2,072 -13.1 1,166 1,169 -0.2
22 Mondelez International Deerfield, Ill. 1,785 1,849 -3.5 200 216 -7.4
23 Deutsche Telekom (including T-Mobile) Bonn, Germany 1,742 1,678 3.8 803 855 -6.1
24 Ferrero Pino Torinese, Italy 1,721 1,671 3.0 55 59 -6.3
25 Pfizer New York 1,698 1,403 21.0 1,158 923 25.5
Total for the 25 $78,253 $73,235 6.9 $24,710 $23,411 5.6
From Global Marketers 2014 (Dec. 8, 2014).
See 10 biggest advertisers for 97 countries and markets, report methodology and links to measured-media tracking services by country:AdAge.com/globalmarketers2014.
Source: Ad Age DataCenter analysis of data from measured-media tracking services. Numbers rounded. U.S. measured media from Kantar Media.
25 largest global advertisersBy 2013 worldwide measured-media ad spending. Dollars in millions.
marketingfp2 JC v31.qxp 12/11/2014 2:55 PM Page 9

MARKETING FACT PACK 2015
ADVERTISING AGE10 • DECEMBER 29, 2014
From Ad Age’s 100 Leading National Advertisers 2014 (June 23, 2014). Numbers rounded. Expanded footnotes and source information:AdAge.com/lna2014. Source: U.S. measured-media spending from WPP’s Kantar Media. Dollars in millions. More info: kantarmedia.us.
Other sources: Auto marketers: Automotive News Data Center. Market share for cars and light trucks. More info: autonews.com. Wireless: U.S. networkoperator market share from ComScore MobiLens for subscribers (age 13+), three months ended December 2013 and December 2012. Year-endsubscriber connections (number of active devices) from CTIA; some users have more than one device. Ad spending for companies’ wireless services.More info: comscore.com; ctia.org. Credit cards: The Nilson Report. Market share of general-purpose credit cards based on total purchase volumein dollars for U.S. credit-card issuers. More info: nilsonreport.com. Insurance: Ad Age DataCenter analysis of measured-media spending.
U.S. market leaders by categoryWith U.S. measured-media ad spending from Kantar Media. Dollars in millions.
Auto marketersU.S. market share for auto/light-truck marketers
RANK MARKET MEASURED2013 MARKETER SHARE 2013 MEDIA 2013
1 General Motors Co. 17.9% $1,812
2 Ford Motor Co. 15.9 1,138
3 Toyota Motor Corp. 14.3 1,275
4 Fiat Chrysler Automobiles 11.6 1,166
5 Honda Motor Co. 9.8 662
6 Nissan Motor Co. 8.0 862
7 Hyundai Motor Co. 4.6 289
8 Volkswagen 3.9 527
9 Kia Motors Corp. 3.4 404
10 BMW 2.4 167
Industry total (vehicles sold in millions) 15.583 $9,228
WirelessU.S. market share for wireless-service providers
RANK MARKET MEASURED2013 MARKETER, PARENT SHARE 2013 MEDIA 2013
1 Verizon Communications 32.4% $923
2 AT&T 28.9 1,356
3 Sprint Corp. SoftBank Corp. 15.2 918
4 T-Mobile US Deutsche Telekom 11.6 793
5 TracFone Wireless America Movil 8.0 160
6 U.S. Cellular Telephone and Data Systems 1.5 33
Top 6 97.6 4,185
All other 2.4 1,524
Industry (wireless subscriber connections in millions) 335.65 $5,709
Insurance brandsShare of insurance-industry U.S. ad spending
RANK SHARE OF AD MEASURED2013 BRAND, PARENT SPENDING 2013 MEDIA 2013
1 Geico Berkshire Hathaway 19.2% $1,014
2 State Farm State Farm Mutual Auto Ins. Co. 11.8 624
3 Progressive Progressive Corp. 11.1 587
4 Allstate Allstate Corp. 9.2 486
5 Nationwide Nationwide Mutual Insurance Co. 5.6 296
6 UnitedHealthcare UnitedHealth Group 3.2 169
7 Liberty Mutual Liberty Mutual Insurance Co. 3.1 164
8 Esurance Allstate Corp. 2.9 153
9 USAA United Services Automobile Association 2.8 149
10 Farmers Insurance Zurich Fin. Svcs. Group 2.8 147
Total insurance industry ad spending 100.0 $5,280
Credit cardsU.S. market share based on card purchase volume
RANK MARKET MEASURED2013 MARKETER, PARENT SHARE 2013 MEDIA 2013
1 American Express Co. 25.4% $244
2 Chase J.P. Morgan Chase & Co. 19.1 283
3 Bank of America 11.2 153
4 Citibank Citigroup 8.6 297
5 Capital One Financial Corp. 6.7 317
6 Discover Financial Services 4.6 130
7 U.S. Bancorp 3.9 2
8 Wells Fargo & Co. 3.4 NA
9 Barclays 1.8 16
10 USAA United Services Automobile Association 1.5 NA
Industry total (purchase volume, dollars in trillions) $2.399 $1,941
marketingfp2 JC v31.qxp 12/11/2014 2:55 PM Page 10

©2015 Neustar, Inc.This information is compiled at the household level using Neustar’s products and services and is not based on actual online behavioral data.
No surprise: households like the Wagner’s like their video games. But would you have guessed they spend nearly as much time on educational sites? That their love of camping and hiking punctures the couch potato myth? Learn more about Neustar’s trusted identity insights. Go to www.neustar.biz/wagners.
MORNINGS INTHE BOARDROOM.EVENINGS INTHE WAR ROOM.
DAN WAGNER / / CUL-DE-SAC HERO
AA012786p11.indd 1 12/11/14 1:21 PM

MARKETING FACT PACK 2015
ADVERTISING AGE12 • DECEMBER 29, 2014
U.S. market leaders by categoryWith U.S. measured-media ad spending from Kantar Media. Dollars in millions.
RetailRanking based on U.S. measured-media spending
RANK SHARE OF 2013 MEASURED2013 MARKETER U.S. RETAIL SALES MEDIA 2013
1 Walmart Stores 11.4% $935
2 Macy’s 0.9 837
3 Target Corp. 2.4 731
4 Sears Holdings Corp. 1.0 588
5 Home Depot 2.4 454
6 J.C. Penney Co. 0.4 431
7 Best Buy Co. 1.2 393
8 Lowe’s Cos. 1.8 361
9 Kohl’s Corp. 0.6 347
10 Amazon 1 1.2 329
Industry total (U.S. sales, dollars in trillions) $2.962 $16,063
Personal-care brandsShare of U.S. personal-care ad spending
RANK SHARE OF AD MEASURED2013 BRAND, PARENT SPENDING 2013 MEDIA 2013
1 L’Oréal Paris L’Oréal 8.3% $586
2 Maybelline New York L’Oréal 4.5 320
3 Crest Procter & Gamble Co. 3.9 275
4 Garnier L’Oréal 3.8 268
5 Olay Procter & Gamble Co. 3.5 247
6 CoverGirl Procter & Gamble Co. 3.0 214
7 Dove Unilever 2.7 191
8 Gillette Procter & Gamble Co. 2.6 185
9 Neutrogena Johnson & Johnson 2.4 170
10 Pantene Procter & Gamble Co. 2.0 144
Total personal-care ad spending 100.0 $7,087
BeerU.S. market share based on sales volume
RANK MARKET MEASURED2013 MARKETER, PARENT SHARE 2013 MEDIA 2013
1 Anheuser-Busch InBev 45.6% $572
2 MillerCoors SABMiller 27.0 429
3 Constellation Brands 6.2 125
4 Heineken 3.9 123
5 Pabst Brewing Co. 4 2.6 2
6 Boston Beer Co. 1.4 38
7 D.G. Yuengling & Son 1.3 3
8 North American Breweries 5 1.2 2
9 Diageo 6 1.1 34
10 Mark Anthony Group 7 0.7 7
Industry total (barrels in millions) 211.7 $1,346
RestaurantsU.S. market share based on systemwide sales
RANK MARKET MEASURED2013 CHAIN, PARENT SHARE 2013 MEDIA 2013
1 McDonald’s McDonald’s Corp. 8.0% $976
2 Subway 2 Doctor’s Associates 2.8 514
3 Starbucks 2 Starbucks Corp. 2.6 89
4 Wendy’s 2 Wendy’s Co. 2.0 289
5 Burger King 2,3 Restaurant Brands Int’l 1.9 257
6 Taco Bell Yum Brands 1.7 327
7 Dunkin’ Donuts Dunkin’ Brands Group 1.5 121
8 Pizza Hut Yum Brands 1.3 247
9 Chick-fil-A Chick-fil-A 1.1 30
10 Applebee’s DineEquity 1.0 176
Industry total (U.S. sales, dollars in billions) $448.8 $6,347
From Ad Age’s 100 Leading National Advertisers 2014 (June 23, 2014). Numbers rounded. Expanded footnotes and source information:AdAge.com/lna2014. Source: U.S. measured-media spending from WPP’s Kantar Media. Dollars in millions. More info: kantarmedia.us.
Other sources: Retail: Census Bureau (U.S. retail sales). 1. Share shown is Ad Age DataCenter estimate. More info: census.gov. Restaurants:2013 Technomic Top 500 Chain Restaurant Report (sales used to calculate market share). Systemwide sales is franchised plus company-ownedrestaurants. 2. Share based on estimated sales. 3. Miami-based Burger King Worldwide in December 2014 acquired Canada-based Tim Hortons; mergedcompany operates as Canada-based Restaurant Brands International. More info: technomic.com. Personal care: Ad Age DataCenter analysis of measured-media spending. Beer: Beer Marketer’s Insights (U.S. market share and industry sales). 4. Bought in November 2014 by Blue Ribbon IntermediateHoldings. 5. Unit of Costa Rica-based Florida Ice and Farm Co. 6. Markets Guinness. 7. Parent of Mike’s Hard Lemonade Co. More info: beerinsights.com.
marketingfp2 JC v31.qxp 12/11/2014 2:56 PM Page 12

©2015 Neustar, Inc.This information is compiled at the household level using Neustar’s products and services and is not based on actual online behavioral data.
SOME CANDY BARSHAVE PROTEIN. JUST AGREE WITH HER.
Busy moms need fuel, so her family’s Snickers® habit makes total sense. But not so fast: they also index low for frozen food and high for preferring dishes “presented as an art form.” You might also want to know about the strength training and Pinterest obsession. Learn more about Neustar’s trusted identity data at www.neustar.biz/wagners.
ALISHA WAGNER / / UBER-MOM
AA012786p13.indd 1 12/11/14 1:20 PM

MARKETING FACT PACK 2015
ADVERTISING AGE14 • DECEMBER 29, 2014
KANTAR MEASURED-MEDIA SPENDING 100 LNA MEASURED MEDIAFOR TOTAL U.S. AND UNMEASURED SPENDING
MEDIUM 2013 2012 % CHG 2013 2012 % CHG
Consumer, Sunday, b-to-b and local magazine $23,733 $23,312 1.8 $8,176 $7,712 6.0
National and local newspaper; free-standing inserts 18,365 18,916 -2.9 3,797 4,038 -6.0
Network TV 26,926 27,435 -1.9 18,264 18,488 -1.2
Spot TV 15,794 17,141 -7.9 4,030 4,181 -3.6
Syndicated TV 5,159 5,133 0.5 3,233 3,181 1.6
Cable TV networks 26,125 24,397 7.1 13,579 11,797 15.1
Network, national spot and local radio 6,967 7,383 -5.6 2,234 2,351 -5.0
Outdoor 4,406 4,221 4.4 1,197 1,203 -0.5
Internet display 12,681 10,963 15.7 4,704 4,452 5.6
Measured media $140,156 $138,899 0.9 59,215 57,403 3.2
Unmeasured spending 1 NA NA NA 49,337 46,566 6.0
Total U.S. spending NA NA NA $108,551 $103,968 4.4
From 100 Leading National Advertisers 2014 (June 23, 2014). See full report and methodology: AdAge.com/lna2014. See 100 LNA databaseincluding profiles, agency rosters and executives, updated in December 2014: AdAge.com/marketertrees2014update.
Source: Ad Age DataCenter. Measured-media spending by medium from WPP’s Kantar Media. More info: kantarmediana.us. Consumer magazineincludes Spanish-language magazines. Local newspaper includes Spanish-language newspapers. Network TV includes Spanish-language networks.1. Unmeasured spending figures are Ad Age DataCenter estimates including direct marketing, promotion, internet paid search, social media andother forms of spending not included in measured media.
U.S. ad spending totals by medium from Kantar Media
Measured-media spending for total U.S. and 100 Leading National Advertisers. Dollars in millions.
U.S. ad spending forecast from ZenithOptimediaEstimated spending in major media and marketing services. ZenithOptimedia projects 2015 U.S. media spending
will reach $182.7 billion, passing the previous peak set in prerecession 2007. It expects 2015 total media andmarketing-services spending to reach a record $405.6 billion—$1,262 per person in the U.S.
2015 2015 VS. 2014 VS.SPENDING 2014 2013
SECTOR ($ BILLIONS) % CHG % CHG
MAJOR MEDIA
TV $67.2 0.3% 4.1%
Internet 51.6 18.2 18.3
Newspaper 19.4 -8.0 -8.0
Radio 17.6 1.0 1.9
Magazine 17.4 -1.9 -1.1
Outdoor and cinema 9.5 5.0 4.3
Major media $182.7 3.8% 4.8%
2015 2015 VS. 2014 VS.SPENDING 2014 2013
SECTOR ($ BILLIONS) % CHG % CHG
MARKETING SERVICES
Sales promotion $74.7 3.0% 3.1%
Telemarketing 54.5 3.0 1.0
Direct mail 48.3 -1.0 1.2
Event sponsorship 32.6 8.0 8.4
Directories 8.1 -0.8 -3.0
Public relations 4.6 5.0 7.1
Marketing services $222.8 2.7% 2.7%
Total: media, marketing services $405.6 3.2% 3.6%
Source: Publicis Groupe’s ZenithOptimedia (Advertising Expenditure Forecasts, December 2014). Numbers rounded. More info: zenithoptimedia.com.
marketingfp2 JC v31.qxp 12/11/2014 2:57 PM Page 14

MARKETING FACT PACK 2015
ADVERTISING AGE DECEMBER 29, 2014 • 15
Worldwide major-media adspending by region From ZenithOptimedia. Major-media spendingin 2015 and percent change vs. 2014.
Source: Publicis Groupe's ZenithOptimedia (Advertising ExpenditureForecasts, December 2014). Numbers rounded. Major media:TV, internet, newspaper, magazine, outdoor, radio, cinema.More info: zenithoptimedia.com.
North America$194.2B, +3.8%
Rest of world$11.6B, +9.3%
Middle East andNorth Africa$4.7B, +3.2%
Latin America$45.0B,+9.6%
Asia Pacific$155.2B,
+6.4%
Western Europe$108.6B, +3.1%
Central andEasternEurope$26.1B,
+3.5%Worldwide
total$545.4B,+4.9%
2015 SPENDING 2014-2015 SHARERANK MARKET ($ BILLIONS) % CHG OF WORLD
1 U.S. $182.7 3.8% 33.5%
2 China 50.3 10.5 9.2
3 Japan 45.6 2.5 8.4
4 Germany 24.9 1.3 4.6
5 U.K. 24.3 7.9 4.5
6 Brazil 17.3 3.6 3.2
7 France 13.0 -0.6 2.4
8 Australia 12.5 1.2 2.3
9 South Korea 12.4 6.3 2.3
10 Canada 11.5 2.6 2.1
11 Russia 10.3 1.1 1.9
12 Italy 8.8 1.0 1.6
13 Argentina 8.5 30.9 1.6
14 Indonesia 7.9 11.9 1.5
15 Mexico 7.3 10.7 1.3
16 India 6.4 11.7 1.2
17 Spain 6.1 5.1 1.1
18 Switzerland 6.1 1.8 1.1
19 Belgium 5.2 3.8 1.0
20 Netherlands 5.1 2.8 0.9
21 Thailand 4.7 3.4 0.9
22 South Africa 4.5 7.8 0.8
23 Sweden 4.0 3.2 0.7
24 Turkey 3.5 9.4 0.6
25 Colombia 2.8 5.3 0.5
Top 25 485.8 4.9 89.1
Total worldwide $545.4 4.9 100.0
Source: Publicis Groupe’s ZenithOptimedia (Advertising ExpenditureForecasts, December 2014). Numbers rounded. Major media:TV, internet, newspaper, magazine, outdoor, radio, cinema.More info: zenithoptimedia.com.
World’s 25 largestadvertising marketsFrom ZenithOptimedia. Projected major-media adspending by country in 2015. The U.S., home toabout 4.4% of the world’s population, is expectedto account for just over one-third of 2015 worldwidemedia spending.
MAJOR-MEDIA SPENDING PER CAPITA RANK MARKET 2015 2014 % CHG
1 Switzerland $749 $740 1.2
2 U.S. 570 553 3.2
3 Australia 522 522 0.0
4 Belgium 462 448 3.3
5 Sweden 412 403 2.4
21 Colombia 58 56 4.1
22 Turkey 45 42 8.2
23 China 37 33 10.0
24 Indonesia 31 28 10.3
25 India 4.99 4.53 10.2
Source: Publicis Groupe’s ZenithOptimedia (Advertising ExpenditureForecasts, December 2014). Numbers rounded.More info: zenithoptimedia.com.
Ad spending per personPer capita major-media ad spending in 2015 and2014 from ZenithOptimedia by market for five highestand five lowest among 25 largest advertising markets.The bottom three are growing at double-digit rates.
marketingfp2 JC v31.qxp 12/11/2014 2:57 PM Page 15

MARKETING FACT PACK 2015
ADVERTISING AGE16 • DECEMBER 29, 2014
Source: ZenithOptimedia (Advertising Expenditure Forecasts, December 2014). Numbers rounded. Internet includes mobile.More info: zenithoptimedia.com.
Source: Publicis Groupe’s ZenithOptimedia (Advertising Expenditure Forecasts, December 2014). Numbers rounded. ZenithOptimedia allocatesad spending according to where an ad appears. So “internet” includes all internet ad spending regardless of whether the property is run by a pure-playinternet company, a newspaper or magazine publisher, a TV network or other venture. This means, for example, that “newspaper” share shown herecaptures print ad spending but excludes newspapers’ digital advertising. More info: zenithoptimedia.com.
2014
2007
0 20 40 60 80 100%
2014
2007
38.1% 12.0% 10.1% 9.9% 5.1%
33.1%
39.6% 15.2% 7.3% 6.8% 7.3%
35.9%
24.8%
8.2% 28.1% 14.5% 11.9% 4.3%
23.8%
9.0% 27.1% 12.5% 8.1% 7.4%
U.S.
Worldwide
OUTDOORAND CINEMARADIOMAGAZINEINTERNETTV NEWSPAPER
Share of ad spending by mediumThe internet’s share of ad spending in 2014 passed print media’s share—newspapers plus magazines—in the U.S. andworld, according to ZenithOptimedia’s forecast data. Graphic shows share of spending in 2014 vs. prerecession 2007.
Internet’s share of ad spendingZenithOptimedia expects the internet to account for more than one-third of U.S. ad spending in 2017, four times
the level of 2007. It expects the internet’s share of worldwide ad spending to top 31% in 2017.
WORLDWIDE
0
10
20
30
40%
20172016201520142013201220112010200920082007
U.S. 33.9%31.1%
MEDIA
marketingfp2 JC v31.qxp 12/11/2014 2:58 PM Page 16

MARKETING FACT PACK 2015
ADVERTISING AGE DECEMBER 29, 2014 • 17
Time spent using mediaAverage time spent per day with major media by U.S. adults, 2008-2014.Time spent using digital media overtook time spent watching TV in 2013.
AVERAGE MINUTES PER DAY
MEDIUM 2008 2009 2010 2011 2012 2013 2014
Total media 620 632 646 678 709 727 748
TV 254 267 264 274 278 271 273
Print (magazine and newspaper) 63 55 50 44 38 32 26
Magazine 25 22 20 18 16 14 12
Newspaper 38 33 30 26 22 18 14
Radio 102 98 96 94 92 90 88
Other 37 35 45 37 28 20 14
Digital 164 177 191 229 273 314 346
Desktop/laptop 131 140 142 153 147 139 132
Desktop/laptop social network 8 15 23 32 33 28 25
Desktop/laptop radio NA NA 14 10 8 6 7
Desktop/laptop video 3 3 6 12 21 22 22
Desktop/laptop other 120 122 99 99 85 83 78
Mobile device (all non-voice) 19 20 24 48 95 139 171
Mobile social network NA NA 1 5 16 30 37
Mobile radio NA NA 6 14 21 26 32
Mobile video NA NA NA 3 8 22 33
Mobile other 19 20 17 26 50 61 69
Mobile phone (feature phone and smartphone) 19 20 23 36 55 76 92
Feature phone (non-voice) 17 15 13 14 11 11 11
Smartphone (non-voice) 3 5 10 22 43 66 81
Smartphone social network NA NA 1 4 11 18 22
Smartphone video NA NA NA 2 4 9 13
Smartphone other 3 5 9 16 28 39 46
Tablet (non-voice) NA NA 1 12 40 63 79
Tablet social network NA NA NA 1 5 12 15
Tablet video NA NA NA 1 4 13 20
Tablet other NA NA 1 10 31 38 44
Digital other (set-top boxes, game-console internet) 14 17 25 28 31 36 43
Source: eMarketer, September 2014. Time spent with each medium includes all time spent with that medium, regardless of multitasking.For example, one hour of multitasking online while watching TV is counted as one hour of TV and one hour of online. See more time-use dataon Pages 31-33. More info: emarketer.com.
marketingfp2 JC v31.qxp 12/11/2014 2:59 PM Page 17

HE WANTS TO DISCOVER A PLANET. HE PLANS TO CALL IT JASON.
No wonder they like Discovery.com© and academic websites. Or that his family ranks highly for watching animated and sci-fi movies. And who can enjoy all that without Pop Tarts® and beef jerky? To see how surprising your audiences are—and what that means for your marketing—learn about Neustar’s trusted identity data. Go to www.neustar.biz/wagners.
JASON WAGNER / / ROCKET MAN
©2015 Neustar, Inc.This information is compiled at the household level using Neustar’s products and services and is not based on actual online behavioral data.
AA012786p18.indd 2 12/11/14 1:31 PM

HE WANTS TO DISCOVER A PLANET. HE PLANS TO CALL IT JASON.
No wonder they like Discovery.com© and academic websites. Or that his family ranks highly for watching animated and sci-fi movies. And who can enjoy all that without Pop Tarts® and beef jerky? To see how surprising your audiences are—and what that means for your marketing—learn about Neustar’s trusted identity data. Go to www.neustar.biz/wagners.
JASON WAGNER / / ROCKET MAN
©2015 Neustar, Inc.This information is compiled at the household level using Neustar’s products and services and is not based on actual online behavioral data.
AA012786p19.indd 3 12/11/14 1:33 PM

MARKETING FACT PACK 2015
ADVERTISING AGE20 • DECEMBER 29, 2014
Source: ComScore, October 2014. More info: comscore.com. Source: ComScore, October 2014. More info: comscore.com.
Source: eMarketer, December 2014. More info: emarketer.com.
Digital: 10 largestU.S. multiplatform
web propertiesBy October 2014 unique visitors in thousands.
ESTIMATED REVENUE FROM MOBILEMEDIUM 2011 2012 2013 2014 2015 2016
Amazon NA NA $12.4 $88.5 $163.7 $266.2
Apple (iAd) $38.3 $123.8 260.2 487.1 795.0 1,166.8
Facebook NA 390.9 1,532.0 3,345.4 4,750.1 5,879.6
Google 750.0 2,171.4 4,017.8 7,062.7 10,017.5 13,335.1
LinkedIn NA NA 5.4 48.8 103.1 140.9
Millennial Media 36.1 61.4 79.4 83.9 96.8 111.0
Pandora 116.6 212.2 369.2 563.5 730.3 896.8
Twitter NA 115.0 320.1 676.5 1,051.2 1,514.2
Yahoo NA NA NA 604.0 1,065.4 1,680.9
Yelp NA 12.7 52.7 128.9 242.1 397.0
YP 93.3 252.0 378.0 510.3 637.9 765.5
Other 582.0 1,509.4 3,640.1 5,388.3 8,828.7 14,005.3
Total U.S. mobile ad spending $1,616.3 $4,848.8 $10,667.3 $18,987.9 $28,481.8 $40,159.4
Net U.S. mobile advertising revenue by companyEstimates for selected companies, 2011-2016. Dollars in millions.
TOTAL DIGITALRANK PROPERTY POPULATION
1 Google sites 236,104
2 Yahoo sites 217,594
3 Facebook 201,135
4 AOL 191,783
5 Amazon sites 175,969
6 Microsoft sites 169,955
7 CBS Interactive 133,167
8 Comcast/NBC Universal 132,807
9 Apple 131,454
10 Mode Media (formerly Glam Media) 129,887
Total digital audience 250,615
TOTAL UNIQUERANK PROPERTY, PARENT VISITORS
1 Google sites 162,317
2 Facebook 93,834
3 AOL 86,291
4 Yahoo sites 57,058
5 Vevo 48,195
6 Maker Studios Walt Disney Co. 45,563
7 Amazon sites 44,017
8 AnyClip Media 41,992
9 Vimeo IAC/InterActiveCorp 38,851
10 Fullscreen Otter Media (AT&T, Chernin Group) 37,326
Total digital audience 191,456
Digital: 10 largestU.S. online video
propertiesBy October 2014 unique visitors in thousands.
marketingfp2 JC v31.qxp 12/11/2014 2:59 PM Page 20

MARKETING FACT PACK 2015
ADVERTISING AGE DECEMBER 29, 2014 • 21
Source: U.S. Census Bureau, 2013 American Community Survey (Computer and Internet Use in the United States: 2013). More info: census.gov. High-speed internet indicates household has paid internet service other than dial-up alone.
High-speed internet accessby state in 2013
Percentage of individuals who live in a household with a subscription to a high-speed internet service.U.S. average: 78.1%. Top state: New Hampshire. Bottom state: Mississippi. Of 26 states with rates
above the national average, 18 are in the West or Northeast. Of 19 states with rates below the national average,13 are in the South. Rates in five states were not statistically different from the national average.
PERCENT WITHRANK STATE HIGH-SPEED INTERNET
PERCENT WITHRANK STATE HIGH-SPEED INTERNET
1 New Hampshire 85.7%
2 Massachusetts 85.3
3 New Jersey 84.5
4 Connecticut 83.9
5 Utah 83.8
6 Maryland 83.4
7 Hawaii 83.3
8 Washington 83.0
9 Colorado 83.0
10 Rhode Island 82.9
11 Minnesota 82.6
12 Alaska 82.6
13 Oregon 82.4
14 Vermont 80.9
15 Virginia 80.6
16 New York 80.6
17 California 80.5
18 Wyoming 80.5
19 Nevada 79.4
20 North Dakota 79.4
21 Illinois 79.3
22 Maine 79.2
23 Wisconsin 79.0
24 Pennsylvania 78.9
25 Kansas 78.8
26 Nebraska 78.8
27 Iowa 78.7%
28 Idaho 78.6
29 Florida 78.3
30 Delaware 78.1
31 Montana 77.6
32 Ohio 77.1
33 Michigan 76.3
34 Georgia 76.3
35 Arizona 76.2
36 South Dakota 76.0
37 Missouri 75.6
38 Indiana 75.3
39 North Carolina 75.2
40 Kentucky 74.8
41 Texas 74.6
42 Tennessee 72.2
43 West Virginia 71.8
44 South Carolina 71.7
45 Oklahoma 71.1
46 Louisiana 70.3
47 Alabama 68.7
48 New Mexico 68.1
49 Arkansas 65.7
50 Mississippi 62.3
U.S. average 78.1%
marketingfp2 JC v31.qxp 12/11/2014 2:59 PM Page 21

MARKETING FACT PACK 2015
ADVERTISING AGE22 • DECEMBER 29, 2014
Super Bowl XLVIIIThe Super Bowl (Feb. 2, 2014, onFox) averaged 112.2 million viewers(59.6 million male and 52.6 millionfemale). The Seattle Seahawks beatthe Denver Broncos 43-8.
Academy AwardsThe 86th Academy Awards (March 2, 2014, on ABC) averaged43.7 million viewers. “12 Years aSlave” won Best Picture.
World Cup The World Cup USA/Portugalmatch (June 22, 2014, onboth ESPN and Univision)averaged 24.1 million viewers.The match ended in a draw (2-2).
Source: Nielsen. More info: nielsen.com. Photos via Fox, ABC, ESPN and AMC.
Walking DeadThe season-five premiere of “The Walking Dead” (Oct. 12, 2014,on AMC) averaged 17.3 millionviewers.
Viewership on high-profile TV programs
Largest U.S. TV networksBy 2013 measured ad spending. Dollars in millions.
Broadcast TVMEASURED AD SPENDING ON EACH NETWORK
RANK NETWORK, COMPANY 2013 2012 % CHG
1 CBS CBS Corp. $6,998 $6,448 8.5
2 ABC Walt Disney Co. 5,107 4,927 3.7
3 NBC Comcast Corp. (NBC Universal) 4,991 6,157 -18.9
4 Fox 21st Century Fox 4,664 4,944 -5.7
5 Univision Broadcasting Media Partners (Univision Communications) 3,045 2,877 5.8
6 Telemundo Comcast Corp. (NBC Universal) 1,026 973 5.4
7 UniMás Broadcasting Media Partners (Univision Communications) 519 447 16.0
8 CW CBS Corp. 50%/Time Warner 50% 422 497 -15.1
Cable TVMEASURED AD SPENDING ON EACH NETWORK
RANK NETWORK, COMPANY 2013 2012 % CHG
1 ESPN Walt Disney Co. $2,321 $2,290 1.3
2 TNT Time Warner (Turner Broadcasting System) 2,138 1,429 49.6
3 TBS Time Warner (Turner Broadcasting System) 1,455 1,166 24.8
4 USA Comcast Corp. (NBC Universal) 1,046 1,015 3.1
5 MTV Viacom 862 866 -0.5
6 Comedy Central Viacom 832 813 2.5
7 Nickelodeon 1 Viacom 787 742 6.1
8 Bravo Comcast Corp. (NBC Universal) 711 769 -7.5
9 Discovery Channel Discovery Communications 697 660 5.6
10 HGTV Scripps Networks Interactive 696 662 5.1
Source: Kantar Media. More info: kantarmedia.us. 1. Excludes Nick at Nite.
marketingfp2 JC v31.qxp 12/11/2014 3:00 PM Page 22

©2015 Neustar, Inc.This information is compiled at the household level using Neustar’s products and services and is not based on actual online behavioral data.
SHE’S A FAN-GIRL.OF PYTHAGORAS.
Which explains all the visits to CoolMath-Games.com©. Plus why her mom and dad skew high for education spending. But they also rank above average for renting horror movies, hunting with a shotgun and being lukewarm on yoga. Learn more about non-intuitive audience insights based on authoritative data. Go to www.neustar.biz/wagners.
JODY WAGNER / / MATHMAGICIAN
AA012786p23.indd 1 12/11/14 1:20 PM

MARKETING FACT PACK 2015
ADVERTISING AGE24 • DECEMBER 29, 2014
7 PM
8 PM
9 PMSUND
AY
10 PM
8 PM
9 PM
10 PM
MOND
AY
8 PM
9 PM
10 PM
TUES
DAY
8 PM
9 PM
10 PMWEDN
ESDA
Y
AMERICA’S FUNNIEST HOME VIDEOS $49,839
ONCE UPON A TIME $136,538
RESURRECTION $140,378
REVENGE $102,098
DANCING WITH THESTARS $118,606
FOREVER $81,987
MARVEL’S AGENTS OF S.H.I.E.L.D. $157,254
THE MIDDLE $133,425
NASHVILLE $97,581
MODERN FAMILY $239,650
60 MINUTES $104,190
MADAM SECRETARY $73,525
THE GOOD WIFE $87,210
CSI $98,138
NCIS $170,948
PERSON OF INTEREST$145,450
NCIS: NEW ORLEANS$114,843
SURVIVOR $134,358
STALKER $110,763
CRIMINAL MINDS $135,789
FOOTBALL NIGHT IN AMERICA N/A
SUNDAY NIGHT FOOTBALL $627,300
THE VOICE $274,157
THE BLACKLIST $282,975STATE OF AFFAIRS2 $219,188
THE VOICE $253,840
CHICAGO FIRE $140,155
MYSTERIES OF LAURA $94,750
CHICAGO P.D. $122,000
LAW & ORDER: SVU $89,700
THE SIMPSONS $189,933
FAMILY GUY $158,400
MULANEY $127,440
GOTHAM $181,575
SLEEPY HOLLOW $202,500
UTOPIA $147,980CANCELED
NEW GIRL $187,050
THE MINDY PROJECT $126,800
HELL’S KITCHEN $107,895
RED BAND SOCIETY $118,025
THE ORIGINALS $32,140
THE FLASH $50,775
SUPERNATURAL $40,440
ARROW $47,040
THE 100 $27,800
BIG BANG THEORY $344,827TWO BROKE GIRLS1 $164,050
NCIS: LOS ANGELES $127,932
SCORPION $148,071 JANE THE VIRGIN $23,400
MARRY ME $148,750
ABOUT A BOY $117,800
SELFIE $69,533CANCELEDMANHATTAN LOVE STORYCANCELED $60,963
BLANK SPACEINDICATES
NO NETWORKPROGRAMMING
CASTLE $141,560
MOM $141,548
THE GOLDBERGS $110,667
BLACK-ISH $137,807
BROOKLYN NINE-NINE $150,500
Cost for a 30-second commercialAd Age’s annual show-by-show guide to the price of TV commercials.
Reflects fall 2014 schedule; cancellations noted.
marketingfp2 JC v31.qxp 12/11/2014 3:00 PM Page 24

MARKETING FACT PACK 2015
ADVERTISING AGE DECEMBER 29, 2014 • 25
From “How much for a 30-second spot,” Sept. 29, 2014. Reflects fall 2014 schedule; cancellations noted.
HOW AD AGE GETS THE DATA: Ad Age’s survey is compiled using data from as many as seven media-buying agencies. Prices should be taken asdirectional indications, not the actual numbers advertisers pay for a spot, as estimates can vary depending on the amount of inventory purchased from anetwork and the relationship an advertiser has with a network. Ad Age’s survey is based on what advertisers paid during this year’s upfront; prices mayhave changed for those purchasing closer to air date in the “scatter” market. 1. October. 2. November.
8 PM
9 PM
10 PM
THUR
SDAY
8 PM
9 PM
10 PM
FRID
AY
GREY’S ANATOMY $149,523
HOW TO GET AWAY WITH MURDER $146,113
SCANDAL $217,546
20/20 $62,917
SHARK TANK $109,878
SATURDAY NIGHT FOOTBALL NA
THURS. NIGHT FOOTBALL $483,333
ELEMENTARY $125,780
TWO & A HALF MEN1 $147,140
THE MCCARTHYS1 $122,475
THE AMAZING RACE $76,375
BLUE BLOODS $79,370
HAWAII FIVE-0 $72,788
CRIMETIME SATURDAY $22,350
48 HOURS $33,500
CRIMETIME SATURDAY $23,238
ENCORES NA
ENCORES NA
ENCORES NA
BIGGEST LOSER $90,736
PARENTHOOD $98,000
BAD JUDGE $104,667CANCELEDA TO Z $95,660CANCELED
DATELINE NBC $48,667
CONSTANTINE $89,667
GRIMM $118,818
BONES $125,200
GRACEPOINT $170,275
MASTERCHEF JUNIOR $100,400
UTOPIA $79,033CANCELED
FOX SPORTS SATURDAY NA
THE VAMPIRE DIARIES $59,620
REIGN $23,100
WHOSE LINE IS IT ANYWAY? $25,154
WHOSE LINE IS IT ANYWAY? $25,154
AMERICA’S NEXT TOP MODEL $23,900
LAST MAN STANDING $66,767
CRISTELA $61,480
7 PM
8 PM
9 PM
SATU
RDAY
10 PM
11 PM
THE MILLERS1 $157,996CANCELED
marketingfp2 JC v31.qxp 12/11/2014 3:01 PM Page 25

MARKETING FACT PACK 2015
ADVERTISING AGE26 • DECEMBER 29, 2014
6 HAVAS$2.4B
7 HAKUHODODY HOLDINGS2
$1.8B
8 EPSILON3
$1.4B
10 MDCPARTNERS$1.1B
9 IBMINTERACTIVE EXPERIENCE 4
$1.3B
1WPP
$17.3B2
OMNICOM GROUP
$14.6B
5DENTSU INC.1
$5.8B
4INTERPUBLIC
GROUP OF COS.
$7.1B
3PUBLICISGROUPE
$9.2B
From: Agency Report 2014 (April 28, 2014). See expanded data at AdAge.com/agencyfamilytrees2014. 1. Estimated pro forma revenue includingAegis Group (acquired March 2013). 2. Estimated revenue. 3. Part of Alliance Data Systems Corp. Estimated pro forma revenue including acquisitions.4. Part of IBM Corp. Estimated revenue.
World’s 10 largest agency companiesBy worldwide revenue in 2013.
AGENCIES
marketingfp2 JC v31.qxp 12/11/2014 3:01 PM Page 26

MARKETING FACT PACK 2015
ADVERTISING AGE DECEMBER 29, 2014 • 27
From Agency Report 2014 (April 28, 2014). See expanded network holdings: AdAge.com/agencyfamilytrees2014. Source: Ad Age DataCenterestimates. Numbers rounded. Ranking and listing based on network configuration as of April 2014. Not all network units shown. Media agenciesnot included in this ranking. 1. Aligned with McCann Worldgroup. 2. Rolls up financially to network but operates autonomously. 3. Estimatedpro forma revenue excluding media agencies (Carat, Posterscope, Vizeum). 4. Revenue shown is estimated pro forma including iThink,La Comunidad and Second Story. 5. Publicis Groupe in November 2014 signed deal to buy Sapient Corp. for $3.7 billion.
World’s largest agency networksBy 2013 estimated worldwide revenue. Dollars in millions.
WORLDWIDE REVENUERANK NETWORK, COMPANY SELECTED UNITS 2013 % CHG
1 Young & Rubicam Group WPP Y&R, Burson-Marsteller, Cohn & Wolfe, $3,591 +4.1Landor Associates, Sudler & Hennessey, Wunderman
2 McCann Worldgroup Interpublic Group of Cos. McCann Erickson Worldwide, Martin Agency, McCann Healthcare, 3,014 +2.3Momentum, MRM//McCann, Weber Shandwick 1
3 Dentsu (Japan) Dentsu Inc. Dentsu Inc.’s network of agencies in Japan 2,981 -14.0
4 DDB Worldwide DDB Worldwide, DDB Health/DDB Remedy, Interbrand, 2,727 +2.7Communications Group Omnicom Group Rapp, TracyLocke, Tribal Worldwide
5 BBDO Worldwide Omnicom Group BBDO Worldwide, Clemenger Group, Organic, Proximity 2,456 +2.2
6 Ogilvy & Mather WPP Ogilvy & Mather Advertising, Neo@Ogilvy, OgilvyOne Worldwide, 2,301 +2.0Ogilvy CommonHealth Worldwide, Ogilvy Public Relations
7 TBWA Worldwide Omnicom Group TBWA Worldwide, EG+ Worldwide 2, Integer Group, Zimmerman Advertising 1,784 +2.1
8 Publicis Worldwide Publicis Groupe Publicis Worldwide including Publicis Hawkeye (acquired March 2014) 1,624 +2.0
9 Dentsu Aegis Network 3 Dentsu Inc. Dentsu Inc.’s network outside Japan including 360i, Firstborn, iPropect, 1,470 +1.9Isobar, McGarryBowen, Mitchell & Partners (Australia), Team Epic
10 J. Walter Thompson Co. WPP J. Walter Thompson Co., Digitaria, HeathWallace, JWT Inside, Lunchbox 1,397 +1.2
11 Epsilon Alliance Data Systems Corp. Epsilon, Catapult 1,380 +10.6
12 Leo Burnett Worldwide Publicis Groupe Leo Burnett Worldwide/Arc, Amazon Advertising, Lapiz USA 1,365 +3.5
13 Havas Worldwide Havas Havas Worldwide, Havas Health, Havas PR 1,340 +1.0
14 FCB Interpublic Group of Cos. FCB, FCB Healthcare, R/GA 2 1,273 -3.8
15 IBM Interactive Experience IBM Corp. IBM Corp.’s digital-agency network 1,250 NA
16 Hakuhodo Hakuhodo DY Holdings Hakuhodo 1,164 -14.2
17 Experian Marketing Services Experian Experian’s marketing-services business segment 1,005 +7.1
18 DigitasLBi Publicis Groupe DigitasLBi, Phonevalley 909 +3.0
19 Saatchi & Saatchi Publicis Groupe Saatchi & Saatchi, Conill, Saatchi & Saatchi X, Team One 904 +2.0
20 SapientNitro 4 Sapient Corp.5 SapientNitro, La Comunidad (acquired December 2013) 875 +9.8
21 Grey Group WPP Grey, GHG, Wing 842 +7.3
22 Acxiom Corp. Acxiom Corp. Ranking based on estimated revenue from marketing and data services 780 +1.6
23 Edelman DJE Holdings Edelman, Edelman Berland, Matter 741 +11.9
24 Cheil Worldwide Cheil Worldwide Cheil Worldwide, Barbarian Group, Beattie McGuinness Bungay, 693 +16.0McKinney, OpenTide Greater China
25 Publicis Healthcare Digitas Health, Publicis Life Brands Medicus, 640 0.0Communications Group Publicis Groupe Razorfish Healthware, Saatchi & Saatchi Wellness
marketingfp2 JC v31.qxp 12/11/2014 3:01 PM Page 27

MARKETING FACT PACK 2015
ADVERTISING AGE28 • DECEMBER 29, 2014
Largest worldwide agency ventures by categoryBy 2013 estimated worldwide revenue.
WORLDWIDE 2013 REVENUE WORLDWIDE 2013 REVENUE TOTALCATEGORY / LARGEST VENTURE, PARENT IN CATEGORY % CHG FOR CATEGORY % CHG
AGENCY COMPANY 50 LARGEST AGENCY COMPANIES
WPP $17.3 billion +4.8% $75.7 billion +4.0%
AGENCY NETWORK 25 LARGEST AGENCY NETWORKS
Young & Rubicam Group WPP $3.6 billion +4.1 $38.5 billion +1.0
DIGITAL-AGENCY NETWORK 15 LARGEST DIGITAL-AGENCY NETWORKS
IBM Interactive Experience IBM Corp. $1.3 billion NA $10.1 billion +4.3
ADVERTISING AGENCY 10 LARGEST ADVERTISING AGENCIES
Dentsu Dentsu Inc. $2.2 billion -14.0 $13.6 billion -2.7
MEDIA-AGENCY NETWORK 10 LARGEST MEDIA-AGENCY NETWORKS
Starcom MediaVest Group Publicis Groupe $1.3 billion +16.4 $9.2 billion +10.6
CRM/DIRECT AGENCY NETWORK 10 LARGEST CRM/DIRECT AGENCY NETWORKS
Epsilon Alliance Data Systems Corp. $1.4 billion +10.6 $7.7 billion +4.5
PUBLIC-RELATIONS AGENCY NETWORK 10 LARGEST PUBLIC-RELATIONS AGENCY NETWORKS
Edelman DJE Holdings $741 million +11.9 $4.5 billion +4.3
U.S. agency revenue growth: 2009-2013Annual growth rates from Agency Reports.
-10
0
10%
2013
3.7%
2012
5.6%
2011
7.9%
2010
7.7%
2009
-7.5%
0
10
20
30
40%
201320122011
35.3%32.5%
30.3%
2010
28.0%
2009
25.8%
Agency Reports growth rates based on U.S. agencies from all disciplines. Source: Ad Age Agency Reports.See more: AdAge.com/agencyreport2014.
From Agency Report 2014 (April 28, 2014). See expanded rankings: AdAge.com/agencyreport2014. Source: Ad Age DataCenter estimates.
U.S. agency revenue growth:2009-2013Agency revenue in 2013 grew at its slowest pacesince the ad recovery began in 2010.
Digital share of U.S. agency revenue: 2009-2013Digital revenue as percent of U.S. agency revenue.Digital services accounted for more than one-third ofrevenue for U.S. agencies in 2013.
marketingfp2 JC v31.qxp 12/11/2014 3:01 PM Page 28
MARKETING FACT PACK 2015
ADVERTISING AGE DECEMBER 29, 2014 • 29
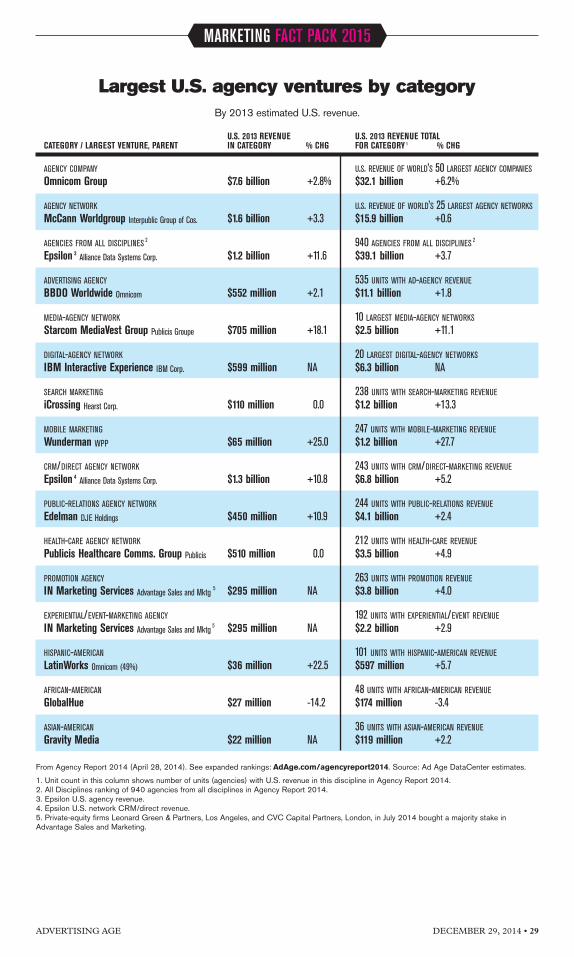
Largest U.S. agency ventures by categoryBy 2013 estimated U.S. revenue.
U.S. 2013 REVENUE U.S. 2013 REVENUE TOTALCATEGORY / LARGEST VENTURE, PARENT IN CATEGORY % CHG FOR CATEGORY 1 % CHG
AGENCY COMPANY U.S. REVENUE OF WORLD’S 50 LARGEST AGENCY COMPANIES
Omnicom Group $7.6 billion +2.8% $32.1 billion +6.2%
AGENCY NETWORK U.S. REVENUE OF WORLD’S 25 LARGEST AGENCY NETWORKS
McCann Worldgroup Interpublic Group of Cos. $1.6 billion +3.3 $15.9 billion +0.6
AGENCIES FROM ALL DISCIPLINES 2 940 AGENCIES FROM ALL DISCIPLINES 2
Epsilon 3 Alliance Data Systems Corp. $1.2 billion +11.6 $39.1 billion +3.7
ADVERTISING AGENCY 535 UNITS WITH AD-AGENCY REVENUE
BBDO Worldwide Omnicom $552 million +2.1 $11.1 billion +1.8
MEDIA-AGENCY NETWORK 10 LARGEST MEDIA-AGENCY NETWORKS
Starcom MediaVest Group Publicis Groupe $705 million +18.1 $2.5 billion +11.1
DIGITAL-AGENCY NETWORK 20 LARGEST DIGITAL-AGENCY NETWORKS
IBM Interactive Experience IBM Corp. $599 million NA $6.3 billion NA
SEARCH MARKETING 238 UNITS WITH SEARCH-MARKETING REVENUE
iCrossing Hearst Corp. $110 million 0.0 $1.2 billion +13.3
MOBILE MARKETING 247 UNITS WITH MOBILE-MARKETING REVENUE
Wunderman WPP $65 million +25.0 $1.2 billion +27.7
CRM/DIRECT AGENCY NETWORK 243 UNITS WITH CRM/DIRECT-MARKETING REVENUE
Epsilon 4 Alliance Data Systems Corp. $1.3 billion +10.8 $6.8 billion +5.2
PUBLIC-RELATIONS AGENCY NETWORK 244 UNITS WITH PUBLIC-RELATIONS REVENUE
Edelman DJE Holdings $450 million +10.9 $4.1 billion +2.4
HEALTH-CARE AGENCY NETWORK 212 UNITS WITH HEALTH-CARE REVENUE
Publicis Healthcare Comms. Group Publicis $510 million 0.0 $3.5 billion +4.9
PROMOTION AGENCY 263 UNITS WITH PROMOTION REVENUE
IN Marketing Services Advantage Sales and Mktg 5 $295 million NA $3.8 billion +4.0
EXPERIENTIAL/EVENT-MARKETING AGENCY 192 UNITS WITH EXPERIENTIAL/EVENT REVENUE
IN Marketing Services Advantage Sales and Mktg 5 $295 million NA $2.2 billion +2.9
HISPANIC-AMERICAN 101 UNITS WITH HISPANIC-AMERICAN REVENUE
LatinWorks Omnicom (49%) $36 million +22.5 $597 million +5.7
AFRICAN-AMERICAN 48 UNITS WITH AFRICAN-AMERICAN REVENUE
GlobalHue $27 million -14.2 $174 million -3.4
ASIAN-AMERICAN 36 UNITS WITH ASIAN-AMERICAN REVENUE
Gravity Media $22 million NA $119 million +2.2
From Agency Report 2014 (April 28, 2014). See expanded rankings: AdAge.com/agencyreport2014. Source: Ad Age DataCenter estimates.
1. Unit count in this column shows number of units (agencies) with U.S. revenue in this discipline in Agency Report 2014.2. All Disciplines ranking of 940 agencies from all disciplines in Agency Report 2014.3. Epsilon U.S. agency revenue. 4. Epsilon U.S. network CRM/direct revenue.5. Private-equity firms Leonard Green & Partners, Los Angeles, and CVC Capital Partners, London, in July 2014 bought a majority stake inAdvantage Sales and Marketing.
marketingfp2 JC v31.qxp 12/11/2014 3:02 PM Page 29

MARKETING FACT PACK 2015
ADVERTISING AGE30 • DECEMBER 29, 2014
Two or moreraces 8.0M
Native Hawaiian/Pacific Islander0.7M
Asian 16.6M
American Indian/Alaska Native4.0M
Black42.1M
White247.4M
Totalpopulation318.9M
Total70+60-6950-5940-4930-3920-2910-190-9
55 .8M
Age:
Circles show number of Hispanics.U.S. total: 55.8 million
0
10
20
30%
2.2M
9.5M
10.7M
9.4M 8.6M
7.2M
5.2M
3.0M
0
20
40
60
80
100%
20142013201220112010200920082007
88.890.4
RECESSION
Source: Thomson Reuters/University of Michigan index of consumer sentiment. Graph shows final (that is, not preliminary) readings.More info: http://www.sca.isr.umich.edu.
Source: Census Bureau. Projections for July 2014 from national projections released in December 2012. More info: census.gov.
2014 U.S. population by racePopulation in millions.
2014 Hispanic population by ageHispanics account for more than one-fifth of the U.S.population for every age up to 39. Total U.S. Hispanicpopulation: 55.8 million.
Index of consumer sentimentConsumer confidence rose in 2014, with the Thomson Reuters/University of Michigan index of consumer sentiment
climbing to 88.8 in November. That’s the highest monthly final reading since prerecession July 2007.
CONSUMERS
marketingfp2 JC v31.qxp 12/11/2014 3:02 PM Page 30

MARKETING FACT PACK 2015
ADVERTISING AGE DECEMBER 29, 2014 • 31
How Americans use leisure timeAmericans age 15+ on average had 5.3 hours of leisure time per day in 2013.
Watching TV is by far the No. 1 leisure activity.
1. Including travel related to leisure and sports activities. Source: Bureau of Labor Statistics' 2013 American Time Use Survey. More info: bls.gov/tus.
AVERAGE LEISURE HOURS IN 2013 AVERAGE WEEKDAY LEISURE HOURS SPENT IN 2013 ON...Playing games Participating in Other leisure
Weekends, Socializing and and computer sports, exercise Relaxing/ and sportsAge All days Weekdays holidays Watching TV communicating use for leisure Reading and recreation thinking activities 1
15-19 5.6 5.1 6.8 1.9 0.7 0.9 0.2 0.7 0.1 0.720-24 5.2 4.8 6.4 2.1 0.7 0.6 NA 0.5 0.3 0.425-34 4.3 3.7 5.7 1.9 0.6 0.4 0.1 0.2 0.2 0.335-44 4.1 3.4 5.7 1.9 0.5 0.3 0.1 0.2 0.2 0.245-54 4.7 4.1 5.9 2.5 0.4 0.3 0.2 0.2 0.3 0.355-64 5.7 5.2 6.9 3.1 0.5 0.3 0.4 0.2 0.4 0.365-74 7.1 6.8 7.9 3.9 0.6 0.5 0.7 0.3 0.4 0.475+ 7.5 7.4 7.8 4.2 0.6 0.4 0.9 0.2 0.7 0.415+ 5.3 4.7 6.5 2.6 0.5 0.4 0.3 0.3 0.3 0.3Men 5.6 5.0 7.1 2.7 0.5 0.5 0.3 0.4 0.3 0.4Women 4.9 4.5 5.9 2.5 0.6 0.3 0.4 0.2 0.3 0.3
RECESSIONYEAR
RECESSIONYEARS40,000
50,000
$60,000
201320122011201020092008200720062005200420032002200120001999
$56,895$51,939+0.2%
-2.2% -3.6% -0.7%
2013 51.0%23.0%14.4%8.4%
LOWEST 20% SECOND THIRD FOURTH TOP 20%
1970 43.3%24.5%17.4%10.8%
1980 44.1%24.7%16.8%10.2%
1990 46.6%24.0%15.9%9.6%
2000 49.8%23.0%14.8%8.9%
2007 49.7%23.4%14.8%8.7%
Income distribution amonghouseholds rich to poor Share of aggregate income by household-incomequintiles. The poorest quintile accounted for just 3.2%of income in 2013; the top fifth accounted for 51.0%.
Median household incomeMedian household income in inflation-adjusted 2013 dollars.
Real median household income edged up 0.2% to $51,939 in 2013, the first increasesince prerecession 2007. Household income peaked in 1999.
Mean (average) income forhouseholds rich to poorMean income for household-income quintiles in 2013;percent change vs. prerecession 2007. Rich householdshave rebounded faster than poor households.
Source: Census Bureau's Current Population Survey (Annual Social and Economic Supplements). More info: census.gov.
TOP20%FOURTHTHIRDSECOND
LOWEST20%
ALLHOUSEHOLDS
-1.9%
-6.0%
-6.8%
-4.4%
-10.2%
-7.8%$72,641
$11,651
$30,509$52,322
$83,519
$185,206
Source: Census Bureau’s Current Population Survey (Annual Social and Economic Supplements). Bottom right graphic: Percent change based on real (inflation-adjusted) mean income. More info: census.gov.
marketingfp2 JC v31.qxp 12/11/2014 3:02 PM Page 31

MARKETING FACT PACK 2015
ADVERTISING AGE32 • DECEMBER 29, 2014
Get smart: Household, personal use of smart devices Popularity of emerging smart-technology products.
12
6
9 3
1
5
11
7
2
48
10
Talk:72.7%
Listen to music: 8.6%
Messaging:75.7%
Visit websites: 50.3%
Camera:13.3%
Play games: 22.4%
Social networking 39.4%
Email: 55.3%
GPS:12.3%
Watch downloaded/streamed video: 8.9%
Download app: 11.8%
IM/chat: 11.9%
Source: Experian Marketing Services’ Internet of Things report (November 2014). More info: experian.com/marketingservices.
Source: Experian Marketing Services’ Simmons Connect. Adult smartphone users, spring 2014. More info: experian.com/marketingservices.1. Percentages indicate unduplicated aggregate percentage of smartphone owners who engage in the activity in that hour at least once during atypical week. For example, 39.4% of smartphone owners use a phone for social networking between 8 p.m. and 9 p.m. at least once in a week.
When and how smartphone owners use their devicesMore than three-fourths of adult smartphone owners message around 5 p.m. at least once during a typical week.
Clock shows peak time (all p.m.) for each activity and percentage of smartphone users who do the activity in that hour. 1Low point for all smartphone activities: 3 a.m.
18%Percent of adults who have
smart entertainment (TV or speakers) in the home
14%Percent of U.S. households that
have smart home devices (light bulbs, outlets/wall switches,smart locks, alarms, thermostat,
window coverings, cameras)
11%Percent of adults who use
connected wearables (fitness devices, smart watch orvisual enhancement devices)
marketingfp2 JC v31.qxp 12/11/2014 3:02 PM Page 32
MARKETING FACT PACK 2015
ADVERTISING AGE DECEMBER 29, 2014 • 33
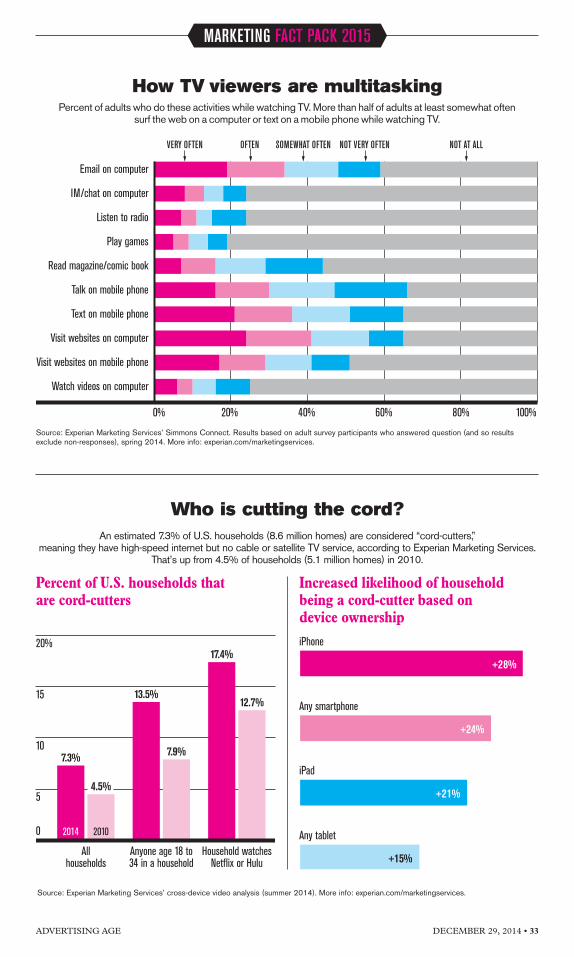
Source: Experian Marketing Services’ Simmons Connect. Results based on adult survey participants who answered question (and so resultsexclude non-responses), spring 2014. More info: experian.com/marketingservices.
VERY OFTEN OFTEN SOMEWHAT OFTEN NOT VERY OFTEN NOT AT ALL
0% 20% 40% 60% 80% 100%
Watch videos on computer
Visit websites on mobile phone
Visit websites on computer
Text on mobile phone
Talk on mobile phone
Read magazine/comic book
Play games
Listen to radio
IM/chat on computer
Email on computer
How TV viewers are multitaskingPercent of adults who do these activities while watching TV. More than half of adults at least somewhat often
surf the web on a computer or text on a mobile phone while watching TV.
Source: Experian Marketing Services’ cross-device video analysis (summer 2014). More info: experian.com/marketingservices.
Who is cutting the cord?An estimated 7.3% of U.S. households (8.6 million homes) are considered “cord-cutters,”
meaning they have high-speed internet but no cable or satellite TV service, according to Experian Marketing Services.That’s up from 4.5% of households (5.1 million homes) in 2010.
Percent of U.S. households thatare cord-cutters
0
5
10
15
20%
2014 2010
7.3%
4.5%
13.5%
7.9%
17.4%
12.7%
Household watchesNetflix or Hulu
Anyone age 18 to34 in a household
Allhouseholds
Increased likelihood of householdbeing a cord-cutter based ondevice ownership
Any smartphone
+24%
iPhone
+28%
Any tablet
+15%
iPad
+21%
marketingfp2 JC v31.qxp 12/11/2014 3:02 PM Page 33

0
50,000
150,000
250,000
2014201320122011201020092008200720062005200420032002
RECE
SSIO
N
RECESSION
20012000
Internet-media jobs
103,600
196,100
197,100
163,600Ad agency jobs
MARKETING FACT PACK 2015
ADVERTISING AGE34 • DECEMBER 29, 2014
2000
22.2% 10.7% 16.2% 10.8%40.1%
2007
23.9% 38.8%8.6% 12.6%16.1%
2014
25.9% 21.5% 12.7% 12.6%27.4%
RADIONEWSPAPERTV MAGAZINEINTERNET
-5
0
5
2014*200920041999
*11 months
Source: Ad Age DataCenter analysis of Bureau of Labor Statistics data. Numbers rounded. See expanded data: AdAge.com/adjobs.
1. Internet-media businesses and web-search portals.2. TV, internet media, newspaper, magazine, radio. December 2000; November 2007; October 2014.3. Change in total nonfarm private employment (seasonally adjusted), year end vs. year end; 2014 is November 2014 vs. year-end 2013.
U.S. media employmentShare of media2 jobs in 2000 (dot-com bubble),
2007 (eve of recession) and now. Internet media nowaccount for more than one-fifth of U.S. media jobs.
Job growth in millionsAnnual increase (decrease) in total U.S. employment3.
The economy added 2.7 million jobs in the first 11months of 2014, putting 2014 on track to score the
biggest job gains since 1999.
U.S. ad agency and internet-media employmentAd agency staffing (197,100) is near its highest point since 2001. Internet-media1 staffing (163,600)
is at a record high and has nearly doubled since 2009.
JOBS
marketingfp2 JC v31.qxp 12/11/2014 3:03 PM Page 34

©2015 Neustar, Inc.This information is compiled at the household level using Neustar’s products and services and is not based on actual online behavioral data.
REFUSES TO EAT BACON. FORMAL STUDY PENDING.
It’s not strange they own a dog, even the only one who hates bacon. Or that they rank highly for buying weight-management dog food and watching the Thanksgiving Day National Dog Show. But it might surprise you to learn that families like the Wagner’s are just as likely to own a fish. Maybe that explains their fondness for aquariums, lakefront vacations and zooming around on jet skis. Learn more about our Neustar’s trusted identity data and insights. Go to www.neustar.biz/wagners.
WAGS WAGNER / / FOOD SNOB
AA012786p35.indd 1 12/11/14 1:20 PM

©2015 Neustar, Inc.This information is compiled at the household level using Neustar’s products and services and is not based on actual online behavioral data.
“HI, YOU’VE REACHED THE WAGNERS. MAKE IT RELEVANT.” BEEP!
What makes the Wagner family click, visit, learn and buy? Targeted, relevant messages that build a one-to-one dialogue. Neustar’s identity data and insights help you do that. Understand your audiences, personalize more effectively and drive conversions throughout all your marketing channels. Learn more at www.neustar.biz/wagners.
AA012786p36.indd 1 12/11/14 1:19 PM


![file.henan.gov.cn · : 2020 9 1366 2020 f] 9 e . 1.2 1.3 1.6 2.2 2.3 2.4 2.5 2.6 2.7 2. 2. 2. 2. 2. 2. 2. 2. 2. 2. 2. 2. 2. 2. 2. 2. 2. 2. 2. 2. 17](https://static.fdocuments.in/doc/165x107/5fcbd85ae02647311f29cd1d/filehenangovcn-2020-9-1366-2020-f-9-e-12-13-16-22-23-24-25-26-27.jpg)