Marketing Orientation and Company Performance: A ... · 1 Marketing Orientation and Company...
28
1 Marketing Orientation and Company Performance: A Comparative Study of Industrial vs. Consumer Goods Companies by George J. Avlonitis and Spiros P. Gounaris Professor of Marketing Research Associate Contact address: Athens University of Economics & Business, Department of Management Sci- ence & Marketing, 76 Patission Str., Athens 104 34, GREECE Dr. George J. Avlonitis is Professor of Marketing at the Department of Management Science & Market- ing of the Athens University of Economics & Business. Dr. Spiros P. Gounaris received his PhD from the Department of Management Science & Marketing of the Athens University of Economics & Business where he is currently a research associate. Date of Submission: November, 29 th 1995
Transcript of Marketing Orientation and Company Performance: A ... · 1 Marketing Orientation and Company...
1
Marketing Orientation and Company Performance: A Comparative Study of Industrial vs. Consumer Goods Companies
by
George J. Avlonitis and Spiros P. Gounaris Professor of Marketing Research Associate
Contact address: Athens University of Economics & Business, Department of Management Sci-
ence & Marketing, 76 Patission Str., Athens 104 34, GREECE
Dr. George J. Avlonitis is Professor of Marketing at the Department of Management Science & Market-ing of the Athens University of Economics & Business.
Dr. Spiros P. Gounaris received his PhD from the Department of Management Science & Marketing of
the Athens University of Economics & Business where he is currently a research associate. Date of Submission: November, 29th 1995

2
Abstract/Summary:
Marketing orientation, still an intriguing concept for many, carries the pledge of superior company performance through the satisfaction of customers’ needs. In this paper, drawing conclusions from an empirical investigation, the authors show that this relationship does really exist and, in the case of industrial mar-kets, building a marketing orientation it is indeed a significant contributor to the company’s performance.

3
1. Introduction
Recent studies [1,2,3] have tried to collect empirical evidence in order to investigate whether the adoption of marketing orientation leads to better performance in the market. However, the way that marketing orientation is conceptualised tends to differ. For instance, while Hooley, Lynch and Shepherd [1] conceptualised marketing orientation as a set of specific beliefs that form a certain company atti-tude/culture, Narver and Slater [2] as well as Kohli and Jaworski [3] explained the concept as a certain behaviour. Furthermore, most of the available empirical investigations of the association between mar-keting orientation and company performance tend to draw general conclusions about this association as no effort has been made to examine the nature, and the importance, of this association in specific market environments (e.g. industrial markets vs. consumer markets).
Thus, reviewing the existing literature on marketing orientation and company performance, two ma-jor questions arise. First, given the fact that different companies are characterised by different levels of marketing orientation adoption, could a classification scheme be derived so that companies could be classified, in a meaningful way, depending on the degree to which they have developed a marketing ori-entation ? Secondly, to what extent the magnitude of the relationship between marketing orientation and company performance is independent of the market the company participates in ? While this paper does not report definite answers to such questions, it does detail some interesting empirical evidence that could help shedding some light on such questions.
Basically, the purpose of this paper is twofold: a) To develop and suggest a meaningful classification scheme for companies that are characterised by different levels of marketing orientation adoption and b) To examine the relationship between the degree of marketing orientation adoption and company per-formance in a comparative study of industrial and consumer goods companies.
In the following pages a review of the available literature and a number of hypotheses designed to serve the purpose of this paper are offered.
2. Background and Hypotheses
2.1. Explicating Marketing Orientation and Classifying Companies on the Basis of Marketing Orientation Adoption
Contrary to what one might expect, the essence of the marketing orientation concept is still an issue under debate. In fact, two different approaches seem to prevail, one treating marketing orientation as ba-sically a company philosophy while the other regards it as mainly a company behaviour.
More specifically, in an effort to provide a definition of marketing orientation, Drucker [4] stated that «marketing is not a specific company activity. On the contrary, it involves the entire organisation. It is the organisation viewed from the customers’ point of view». Similarly, Felton [5] has also described marketing orientation with emphasis on the attitudinal qualities of the concept. He regarded it as «a way of thinking in doing business that is based on the integration and co-ordination of all marketing activities which, in turn, will integrate with the rest activities of the company in an effort to maximise long-term profitability».
Much later, at the 1990 Marketing Science Institute (MSI) conference on «Organising to Become Market Driven», Fr. Cespedes [6] treated the organisation of marketing and the concept of marketing orientation differently: While marketing organisation was used to describe the functional department of the company that executes marketing related activities (e.g. pricing, distribution, promotion etc.), the concept of marketing was associated with a certain way of thinking concerning the company’s priorities and goals. In a similar direction it is also the opinion of Deshpande and Webster [7] who assign a philo-sophical/cultural quality to marketing orientation. In fact, when they attempted to investigate the innova-tiveness of Japanese companies they used the degree of marketing orientation to explain the companies’ propensity to innovate [8]. In doing so, they employed the term «customer orientation» to describe a specific set of beliefs that puts the customers’ interests first and ahead of those of all other stakeholders (e.g. owners, managers, employees). In their view, this set of beliefs should be considered as part of a broader, and more fundamental, corporate culture.
4
Baker [9] approaches the concept of marketing orientation in a similar way. More specifically, al-though he avoids to provide a specific definition of marketing or marketing orientation, he explicitly suggests that for a company to develop marketing orientation, «massive changes in the way it thinks about business» are required. In an indirect way, he specifies these required changes by emphasising how easy is to understand the philosophy of marketing. In his view, what is needed is producers to start conscientious efforts to identify and specify customers’ needs and then mobilise their companies’ assets to serve these needs in a framework of mutually satisfying exchanges.
The above citations that approach marketing orientation as a company philosophy are merely indica-tive and by no means exhaustive. Others [10,11] have also put forward similar views, all treating market-ing orientation as mainly a company philosophy. Clearly, if the adoption of marketing orientation re-quires changes of the company’s prevailing set of beliefs and attitudes, then marketing orientation represents a specific culture. Indeed, Hooley, Lynch and Shepherd [1] on the basis of the attitudes to-wards marketing held by a broad sample of Marketing Directors in Britain developed a classification scheme in which they classified companies into four groups, each exhibiting a different level of market-ing orientation adoption.
More specifically, they distinguished the “Marketing Philosophers”, i.e. the companies that have fully embraced marketing orientation as a company-wide philosophy, the “Departmental Marketers”, i.e. the companies that perceive that the concept of marketing orientation is confined in what the Marketing and/or the Sales departments do, the “Sales Supporters”, i.e. the companies that conceive the marketing concept as a tool for supporting the sales effort and, finally, the “Unsurers”, i.e. the companies that are still confused about the meaning of the marketing concept. Based on these empirical results, the authors concluded that marketing orientation represents a distinctive company philosophy that is grounded upon specific attitudes and beliefs. On these grounds, we propose that:
H1 A classification scheme for companies that is based on different attitudes towards marketing, reflecting different levels of Marketing Orientation adoption, is possible.
However, another approach which views marketing orientation as being primarily a specific company behaviour has also been developed. Trout and Ries [12] for example perceive marketing orientation as an effort to compile market intelligence upon which the effort to build a competitive advantage is based. In fact, they take it a step further and support that customer orientation, although important, is not as crucial as competitor orientation as the latter will enable the company to identify the weaknesses of its competitors and strike them back where they are weaker.
A behavioural approach in explaining marketing orientation, but from a different viewpoint, is also adopted by Elliot [13]. He suggests that the concept of marketing orientation and the philosophy to set a priority to satisfy customers’ needs, although important, is insufficient and requires revising. He pro-poses that the designing of strategies aiming to achieve customer satisfaction should be considered as part of the marketing orientation concept.
This strategic-behavioural approach in explaining marketing orientation has found acceptance and support by other authors too [14,15]. In fact, attempts have been made to explain that marketing orienta-tion requires the development of marketing skills (with particular emphasis in designing and implement-ing marketing strategies) [16] and changes in the organisational structure and marketing systems of the company [17].
Within this framework of behavioural-strategical approach to marketing orientation, Piercy [18] sug-gests that marketing orientation is comprised of three elements:
¾ Strategies, concerning the critical decision of market definition and market segmentation as well as the identification of potential bases for the differentiation of the company’s products against competitive offerings,
¾ Plans, concerning the development of marketing mix policies and ¾ Information, concerning the entire market and is used for strategy design, planning and control.
With this definition of marketing orientation, Piercy clearly establishes a behavioural approach in defin-ing the concept marketing orientation.
5
Finally, similar to Piercy’s perception of marketing orientation, is also the work of Kohli and Jawor-ski [19,3]. They also view marketing orientation as behaviour and they explicate it on the basis of three pillars: Market intelligence collection (to understand the market), intelligence dissemination through-out the company (to familiarise it with the market) and responsiveness to the intelligence (through the strategies and plans that the company designs and implements).
However, since the end-goal of marketing orientation is increased adaptability of the company to its market, it is intuitively attractive to assume that in order to achieve maximum adaptability both company attitude and behaviour should be adjusted. Hence, marketing orientation is about developing both a set of attitudes and a set of practices that aim to maximise the company’s adaptability to the market. On these grounds, we suggest that:
H2 A genuine Marketing Orientation adoption requires adjustment of both company attitude and behaviour which are related and inseparable.
2.2. Marketing Orientation Adoption in Industrial vs. Consumer Markets
Although it has been argued that there are no grounds upon which a discrimination between indus-trial and consumer marketing can be justified [20], marketing scholars have long realised the necessity to distinguish the transactions that take place between organisations (industrial marketing) from the ones that emerge between organisations and individual consumers (consumer marketing) [21]. Apparently, the differences in the nature of the markets, the products, the demand and, more importantly in the mo-tives and the buying behaviour of organisations acting as buyers, compared to the motives and the buy-ing behaviour characterising individuals, warrant this distinction [22].
However, while the marketing concept cuts across both consumer goods and business marketing [23], consumer goods manufacturers seem to have embraced this concept more completely than their indus-trial counterparts [22]. Some business marketers are more concerned with the specifications of products than with how these specifications respond to customer needs [24]. Besides, acceptance of the necessity of formal market research has proceeded relatively more slowly in industrial marketing than it has in the consumer goods field [25]. One possible explanation is the “Technological Arrogance” of industrial goods companies in that some of them have grown successfully on the basis of engineering skills and technological development [26]. Many managers in such firms are promoted out of the engineering and the R&D departments. It is not unusual, therefore, that technical values tend to dominate their decision making. Interestingly enough, while more than half of the business schools graduates in the USA are employed in organisations involved in business-to-business transactions, less than 2% have been ex-posed to industrial marketing courses during the college education [27]. On these grounds, we expect that:
H3 Marketing orientation is less developed in industrial goods companies in comparison with their consumer goods counterparts.
2.3. Effect of Marketing Orientation on Company Performance
The association of marketing orientation and company performance has been the focal point of sev-eral research efforts which are summarised in Figure 1.
These studies provide solid grounds that support the existence of a relationship between marketing orientation adoption and company performance. As to the direction of this relationship i.e. whether mar-keting orientation leads to better performance or vice versa, evidence exists which demonstrate that it is the development of marketing orientation that contributes to the company’s performance and not the other way round.
PLACE
FIGURE 1
AROUND HERE
6
More specifically, this issue was raised in the work of Hooley, Lynch and Shepherd [1]. The authors adopted a holistic approach and examined not only the groups that they identified but also the overall market practices that companies in the various groups tended to follow. This approach revealed that the "Marketing Philosophers" are the only ones that a) implement market segmentation strategies, b) main-tain a superior and clearer organisation of their marketing activities and efforts and c) adopt a proactive (rather than a reactive) strategic posture. Clearly, availability of resources, as the consequence of higher performance, is not a prerequisite for such practices. In fact, such practices increase the overall effi-ciency of the marketing effort [33]. In addition these practices were found only among the marketing orientated companies. This led the authors to conclude that marketing orientation is the cause of superior performance and not its outcome.
Besides, other research efforts [34,35,36,37] have also confirmed that specific marketing practices lead to superior performance in the market and not vice versa. However, what seems to be common in all the research efforts mentioned above, with the noticeable exemption of the work of Hooley, Lynch and Shepherd, is that the investigation of the relationship between the degree of marketing orientation adop-tion and the company performance is restricted in two respects. First, company performance was consid-ered only in terms of «achieved» performance. That is to say, important dimensions such as the actual performance vis a vis the company’s performance objectives and the company’s actual performance vis a vis the company’s competitors’ performance were not incorporated in the analyses. However, these two dimensions are equally critical when examining the contribution of marketing orientation to the company’s long-term prosperity and, consequently, we propose that:
H4a Marketing orientation adoption (as attitude and behaviour) has a positive effect on the company’s actual performance vs. its performance objectives, and
H4b Marketing orientation adoption (as attitude and behaviour) has a positive effect on the company’s actual performance vs. the performance of the company’s competitors.
Secondly, another point not addressed by the research efforts mentioned above is the effect that mar-keting orientation has on the performance of companies participating in different markets, and particu-larly in the industrial markets. However, considering that industrial good companies may grow success-fully on the basis of engineering skills and technological development we should expect further improvements in company performance if these companies were to combine their engineering skills with marketing skills and market knowledge.
As Webster [38] argues “a marketing oriented industrial company is often more knowledgeable about its customers and their needs than is the typical marketing oriented consumer company”. There is also evidence to suggest that both new [39,40,41] and mature [42] industrial products successes which assist companies to achieve their financial and market share objectives are strongly linked with marketing re-lated factors. On these grounds, we suggest that :
H5 Marketing orientation adoption will have a greater impact on the performance of industrial goods companies than on the performance of consumer goods companies.
3. Research Methodology
3.1. Sample and Data collection
The hypotheses put forward in this paper were assessed against data from 444 Greek companies as part of a much wider examination of marketing attitudes and practices in the Greek economy. For that purpose, a cross sectional sample was chosen with the intention to increase the generalizability of the findings. At the same time, it was necessary that certain marketing skills should be present among the companies in the sample. Thus, we ensured that larger companies would adequately be represented in the sample since, it was felt that, the larger the company the higher the probability to possess these skills. Consequently, the sample was defined to comprise the following companies:
� all manufacturing companies with more than 40 employees (n=1,843) � a random sample of 600 manufacturing companies with fewer than 40 employees (n=3,362) � all service companies with more than 20 employees (n=1,157),

7
as described in the mailing lists if ICAP1. This procedure produced a sample of 3,500 companies. How-ever, changes in addresses and/or the close-down of some of these companies, eventually reduced the original sample down to 3,200 companies. Clearly, including in the sample such a large number from such diversified industries increases the levels of heterogeneity in the sample. Although increased het-erogeneity has been argued to induce negative effects on the quality of the findings [43,44] cross-sectional samples with increased levels of heterogeneity are frequently used in research efforts in order to increase the researchers’ ability to generalise [1,3].
In order to collect the data, a detailed and lengthy questionnaire was designed. In doing so, particular emphasis was given in avoiding leading questions as well as complex or sensitive ones (especially in the beginning of the questionnaire) that could influence the respondent negatively [45]. Prior to mailing it, the questionnaire was extensively pre-tested in order to increase the content validity of the research in-strument. For that purpose, 12 personal interviews were conducted with Marketing Managers who had agreed to provide assistance and comments on the development of the questionnaire.
3.1.1. Response Rate
The initial mailing and follow-up efforts generated 452 responses. However, 9 of those responses were excluded from the analysis due to excessive missing data, thus reducing the effective sample to 444 cases, giving a response rate of approximately 14%.
A higher response rate was probably impossible because of the length of the questionnaire (12 pages) and the confidential nature of the information requested in some questions. Besides, in research designs in which cross-section samples are used [3,46,47, 48] response rates ranging from 12% to 20% are gen-erally considered acceptable. Table 1 summarises the structure of the respondents. In order to investigate whether non-response bias exists in the data, the t-test was used to examine differences in measured lev-els of marketing attitudes and practices between early and late (follow-up mailing) respondents. This sta-tistical analysis indicated that there were no significant differences between early and late respondents.
3.1.2. Marketing Manager
Respondents within companies were selected to have a deep knowledge of the company’s overall marketing culture and practices. At the same time, they had to be senior enough to provide information on the company’s strategies. Consequently, the Marketing Manager (or the Sales Manager where a Marketing Manager did not exist) was the appropriate person to contact.
The choice to use the single respondent approach was compelled by both the size of the sample and the respondent’s familiarity with the research topic and the information sought. The large size of the sample rendered the mailing of additional questionnaires to more respondents per company prohibitive in financial terms. Besides, similar studies in the broader field of marketing have also employed the key respondent approach without any flaws to the reliability of the data [2, 49].
3.2. Variables Measurement
The testing of the hypotheses put forward in this study necessitated the measurement of 3 blocks of variables: a) Marketing Orientation, measured as an attitudinal concept, b) Marketing Orientation meas-ured as a behavioural concept and c) Company Performance.
3.2.1. Marketing Orientation Measured as An Attitudinal Concept
In order to measure the respondents’ level of marketing orientation adoption (as attitude), they were presented with the 15 statements that have been found to adequately describe different attitudinal ap-proaches to marketing orientation [1]. Then, using a Likert scale (1=«I Fully Disagree» to 5=«I Fully
1 The Gallup’s subsidiary in Greece.
PLACE
TABLE 1
AROUND HERE

8
Agree») they were asked to indicate the degree of agreement or disagreement with each statement. In order to avoid potential bias in the responses induced by the possibility that some respondents might be inclined to systematically tick at the extremes of the scale, attention was given to phrase the sentences in a manner that higher levels of agreement would not always represent a more positive attitude towards marketing orientation. Later, during the analysis phase and where necessary, the scales were reverted so that higher levels of agreement would always indicate more positive attitude toward marketing orienta-tion. The 15 statements, as well as the pertinent descriptive statistics, are presented in the Appendix.
3.2.2. Marketing Orientation Measured as A Behavioural Concept
The measurement used by Kohli and Jaworski [19] for marketing orientation as behaviour was em-ployed to gauge the degree of marketing orientation (as behaviour) of the respondents (see appendix). Thus using a 5-point scale (1=«It Does Not Represent Our Company At All» to 5=«It Fully Represents Us»), we measured (a) the degree of market intelligence collection, (b) the degree of company-wide dissemination of the intelligence, and (c) the degree of responsiveness to the market intelligence gathered. The means and the standard deviation, as well as a reliability analysis for the scale, are pre-sented in the Appendix.
3.2.3. Company Performance
In order to evaluate the performance of the respondents’ companies, we employed subjective weighted measures of performance.
First, using a 4-point scale (1=«Little or Not Significant» to 4=«Extremely Significant»), the respon-dents were asked to state the significance conceded to the following performance criteria:
� Profits, � Annual Turn-Over, � ROI and � Market Share.
Then, using the same scale as above, the respondents were also asked to state the significance attached to
� Actual Performance vs. Performance Target and � Actual Performance vs. Competitor’s Performance as criteria in the evaluation process of their company’s performance.
Finally, the respondents were asked to evaluate, using a 3-point scale (1=«Worse», 2=«The Same» and 3=«Better»), their company’s performance over a 4 years period (in terms of profits, annual turn-over, ROI and market share) against both their performance objectives and their main competitors’ per-formance.
Using the ratings provided by the respondents, we proceeded to calculate eight weighted measures of performance that are summarised as follows:
x Profits vs. Targets significance attached to profits (1 to 4) * significance attached to performance vs. Targets (1 to 4) * actual profits vs. per-formance objectives (1 to 3) over the last 4 years period (mean:20,1 st.dev.:11,24)
x Annual Turn-Over vs. Tar-gets
significance attached to annual turn-over (1 to 4) * signifi-cance attached to performance vs. targets (1 to 4) * actual an-nual turn-over vs. performance objectives (1 to 3) over the last 4 years period (mean:22,58 st.dev.:11,57)
x Market-Share vs. Targets significance attached to market-share (1 to 4) * significance attached to performance vs. targets (1 to 4) * actual market-share vs. performance objectives (1 to 3) over the last 4 years period (mean:21,23 st.dev.:11,53)
x ROI vs. Targets significance attached to ROI (1 to 4) * significance attached to performance vs. targets (1 to 4) * actual ROI vs. perform-ance objectives (1 to 3) over the last 4 years period (mean:16,63 st.dev.:10,26)

9
x Profits vs. Competition significance attached to profits (1 to 4) * significance attached to performance vs. competition (1 to 4) * actual profits vs. competition (1 to 3) over the last 4 years period (mean:19,81 st.dev.:12,09)
x Annual Turn-Over vs. Com-petition
significance attached to annual turn-over (1 to 4) * signifi-cance attached to performance vs. Competition (1 to 4) * ac-tual annual turn-over vs. Competition (1 to 3) over the last 4 years period (mean:21,080st.dev.:12,52)
x Market-Share vs. Competi-tion
significance attached to market-share (1 to 4) * significance attached to performance vs.. Competition (1 to 4) * actual market-share vs. competition (1 to 3) over the last 4 years pe-riod (mean:19,94 st.dev.:12,82)
x ROI vs. Competition significance attached to ROI (1 to 4) * significance attached to performance vs. Competition (1 to 4) * actual ROI vs. com-petition (1 to 3) over the last 4 years period (mean:17,51 st.dev.:11,91)
As to the reasoning of the use of the aforementioned performance measures, they were preferred on the grounds that «objective» figures would, in any case, be provided by the respondents and our ability to check for the integrity of the responses would have been limited due to the anonymity offered to the respondents. In considering the use of this objective approach in measuring company performance, we felt that a high possibility existed that some of the respondents might, for reasons of confidentiality and despite the anonymity assertions offered from our part, be unwilling to «reveal» accurate figures of their performance. However, when asked to express their assessment of their company’s performance in terms of «better», «worse» etc., we expected that the respondents would feel more prompted to answer accu-rately as no revelation of company figures was necessary.
The employment of subjective measures of performance is not a new approach in studies that seek to investigate potential relations between company performance and various aspects of management. Simi-lar studies have also used subjective measures of performance for this purpose [50,51]. In addition, it is worth mentioning that studies that had used both objective and subjective measures of performance, have found strong correlation between them [52,53]. This warrants the validity of using subjective per-formance measures in order to evaluate the company’s actual performance.
Furthermore, as it has been suggested [54], when working with cross-sectional samples, the hetero-geneity characterising the various sectors included in the sample may induce significant bias in the analysis of company performance as a certain performance level (e.g. in terms of profits, profitability etc.) that indicates good performance in one section could be unacceptably low for a different sector. However, by asking the respondents to characterise their performance themselves this problem is suffi-ciently handled. Finally, the practice to weight performance measures according to the significance at-tached by the management to the measure in question has also been suggested [55] on the basis that no performance measure is really important unless the Management of the company perceives it to be im-portant.
4. Data Analysis and Results
4.1. Explication of Marketing Orientation and Companies’ Classification (H1 and H2)
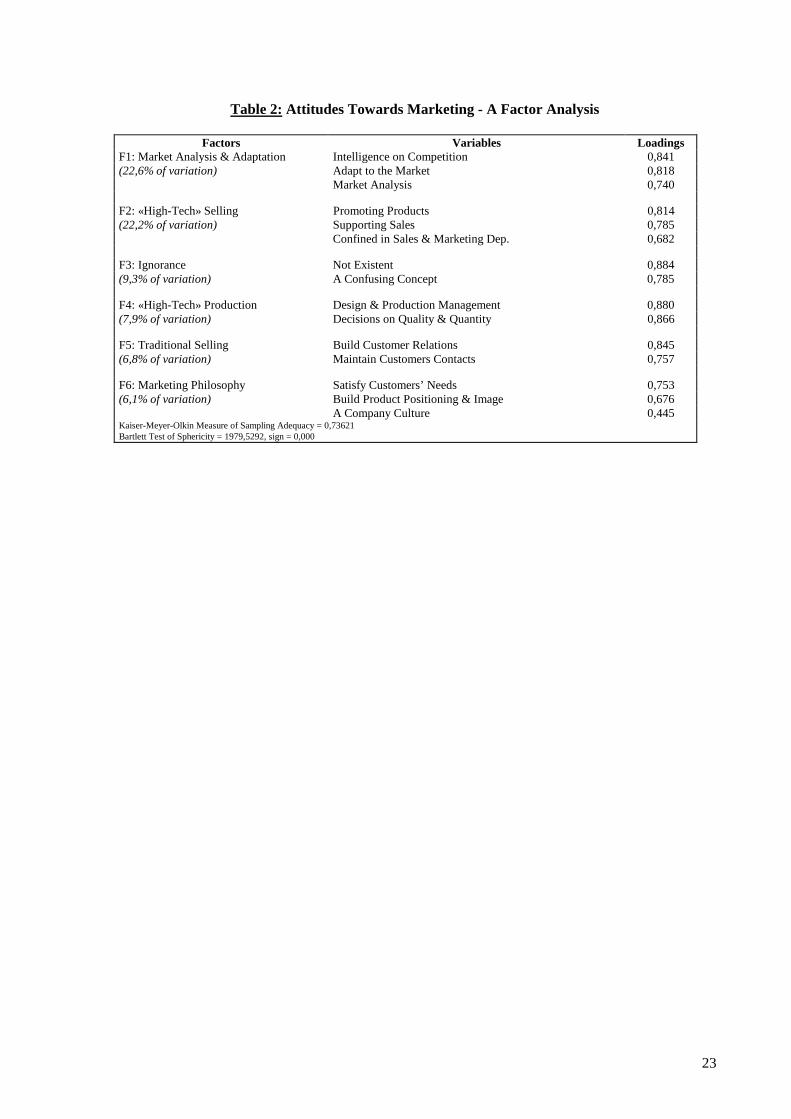
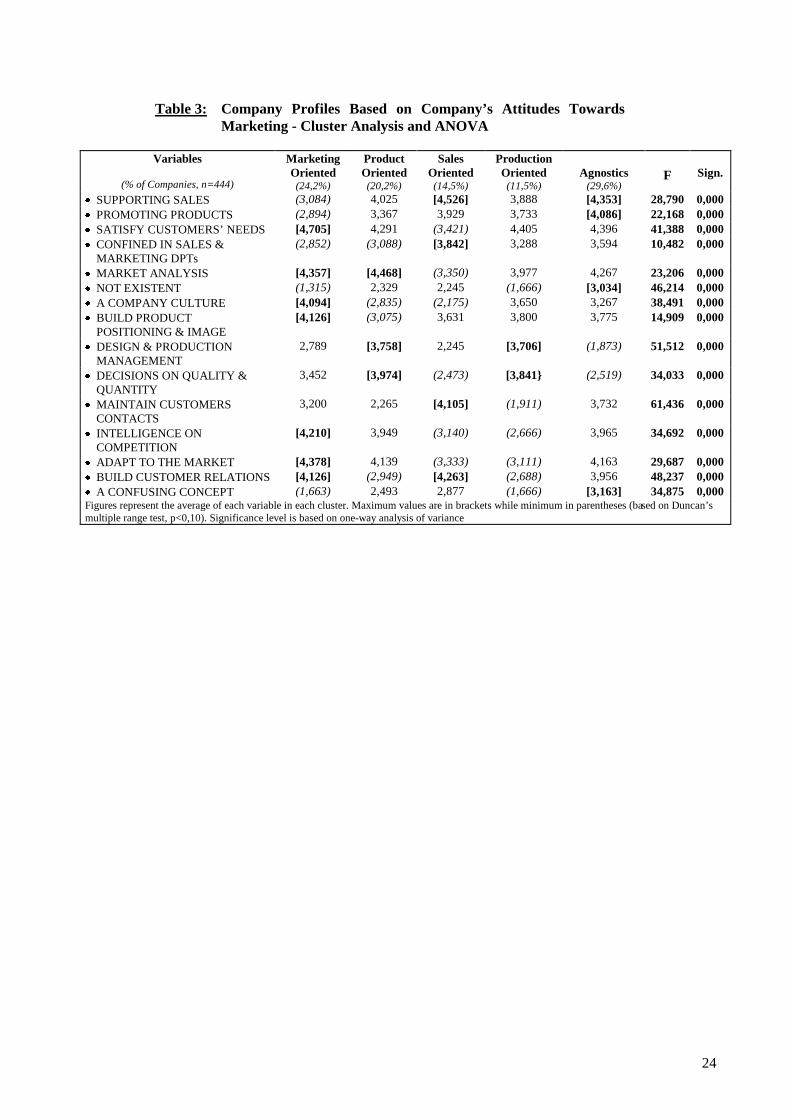
An examination of the correlation matrix of the 15 statements used to probe the degree of marketing orientation adoption in attitudinal terms, revealed that it might be possible to derive distinctive attitudes towards marketing orientation underlying the original 15 variables. To exploit this possibility we per-formed a Principal Components Factor Analysis. This analysis is particularly useful when the re-searcher seeks to identify underlying factors that potentially characterise a specific group of variables. Table 2 shows the results of that analysis.
As can be seen from Table 2, the P.C. Factor Analysis produced 6 specific attitudes toward marketing orientation, each one representing a different perception of the concept. The first factor represents a conceptualisation of marketing orientation that places emphasis on specific actions that are directed to-
PLACE
TABLE 2

10
wards increasing the company’s level of adaptation to changing market conditions (market analysis and adaptation, intelligence collection on competition and adaptation to the market). The second factor de-scribes a much different attitude towards marketing. According to this approach, marketing orientation is nothing more than «high-tech selling» with the company’s emphasis remaining on the selling effort (promoting products, supporting sales and being the responsibility of the Marketing/Sales department).
The third factor describes complete ignorance of the concept. This factor does not describe any spe-cific approach to marketing orientation. Rather, it proves that some companies still consider marketing orientation as a «confusing concept» and, consequently, do not apply it. The fourth factor describes a production-based approach to marketing orientation (design and management of the production process and decision-taking on production qualities and quantities) with the emphasis of the company placed on the production process. The fifth factor corresponds to an approach that maintains a traditional selling conceptualisation of marketing orientation (building customer relations and maintaining customer con-tacts), while, finally, the sixth factor describes a cultural approach to marketing orientation (a company culture, customer satisfaction and building product positioning and image).
Having identified a set of generic attitudes towards marketing orientation, we then tried to classify the respondents on the basis of these attitudes. To do so, we performed a cluster analysis using the fac-tor scores derived from the P.C. Factor Analysis as independent variables.
For the clustering of the data we used the Quick Cluster routine of spss/win, a statistical program for P/C. Quick Cluster is an alternative to the more common hierarchical clustering, offering efficient use of computer resources while identifying clear and distinct clusters.
The objective of Quick Cluster is to form a predetermined number of clusters from a large sample such that the clusters display a high degree of internal similarity while being distinct from each other. Because the number of clusters is predetermined for Quick Cluster, there can be a problem in identifying the number of clusters necessary to give a good solution for any set of data. In our analyses, we exam-ined the 3, 4 and 5 clusters solution. The 3 clusters solution resulted in large clusters with unacceptably diverse membership while the 4 clusters solution did not significantly improve the description of the data. Thus, the 5 clusters solution was tentatively adopted.
To test the clarity of the 5 cluster solution we run an analysis of variance along with Dunkan’s multi-ple range test for each of the original variables (from which the factors were derived) and across each cluster. This analysis revealed that the 5-clusters solution was fitting the data in a meaningful way. Ta-ble 3 summarises the results of this analysis.
As can be seen in Table 3, the first cluster, represents the Marketing Oriented companies. These companies believe that marketing is primarily a company culture with a priority in satisfying customers’ need. They also believe that marketing orientation encompasses certain activities, such as collecting market information and intelligence on competitors, so that the company can adapt to the market and of-fer customer satisfaction. Within that framework, they believe that building relations with customers helps in better understanding their needs while, proper product positioning and product image improves their ability to satisfy more than the core need (e.g. psychological needs, social needs etc.).
The second cluster consists of those companies that have developed a Product Orientation. More spe-cifically, product oriented companies approach marketing with an emphasis on collecting market infor-mation for the purpose of managing the production and taking decisions regarding the quality and the quantity of the production. However, no particular emphasis is placed on associating these efforts with the objective of offering satisfaction to specific customer’s needs. Hence, they cannot claim adoption of the marketing concept. Rather, they seem to be closer to the definition of product orientation offered by Kotler [56] who describes product oriented companies as those which in order to gain a competitive ad-vantage, attempt to increase the attraction of their product through the addition of extra features, or the use of modern technology, while neglecting to specify customer’s needs and a manner to serve these specific needs better than competition.
PLACE
TABLE 3
AROUND HERE
11
The third cluster describes the companies that maintain a Sales Orientation. These companies be-lieve that marketing is primarily a sales-support function and is better left to the Marketing or the Sales departments. Typical of their attitude towards marketing is the neglect of any market analysis and the rejection of marketing as a company culture. Within this framework, they try to build relationships with their customers and maintain regular contacts not as means of increasing their understanding of their customers’ needs but rather as a way to increase the effectiveness of their sales effort.
The fourth cluster consists of the Production Oriented companies. These companies hold the attitude that their marketing effort should focus on decisions regarding the management of their production proc-ess and the quality and the quantities of the production output. They see no benefits in engaging with activities such as market analysis, collecting intelligence from competitors and adapting to market condi-tions.
Finally, the fifth cluster, Agnostics, describes those companies which have a general picture of mar-keting as something that has to do something with the sales function. Still, marketing remains to them a confusing concept that they do not apply to their business activities.
When examining the characteristics of the five distinctive groups of companies derived from the analysis, it is clear that these groups are characterised by different levels of marketing orientation adop-tion. Indeed, the «Marketing Oriented» group is characterised by maximum adoption of the concept since, as can be seen in Table 3, they place emphasis on market analysis, collection of intelligence on competition and market adaptation.
The «Product Oriented» companies on the other hand are characterised by a lower level of marketing orientation adoption. Although they also emphasise the need for market analysis (so that they can incor-porate «competitive technology and features» in their products), they fail to take into full consideration the needs and demands of their customers and translate them to their technological offerings. Next in terms of marketing orientation adoption is the «Sales Oriented» group. For this group the only evidence of marketing orientation adoption is their selling effort. However, this effort occurs without any attempt to adapt to the needs and demands of their customers and the market in general.
Then, the «Production Oriented» group follows. As Table 3 shows, this group of companies is basi-cally concerned with production related issues, ignore the market developments and make no effort to collect intelligence on competition or to adapt to the market.
Finally, the «Agnostics» group of companies appear to be the group with the minimum adoption of the marketing orientation concept as they do not give any particular emphasis on any, internal or exter-nal, development. Thus, it would appear that the findings presented in Table 3 demonstrate that it is pos-sible to classify companies on the basis of their different attitudes towards marketing which, in turn, re-flect different levels of marketing orientation adoption. This evidence supports our first hypothesis (H1).
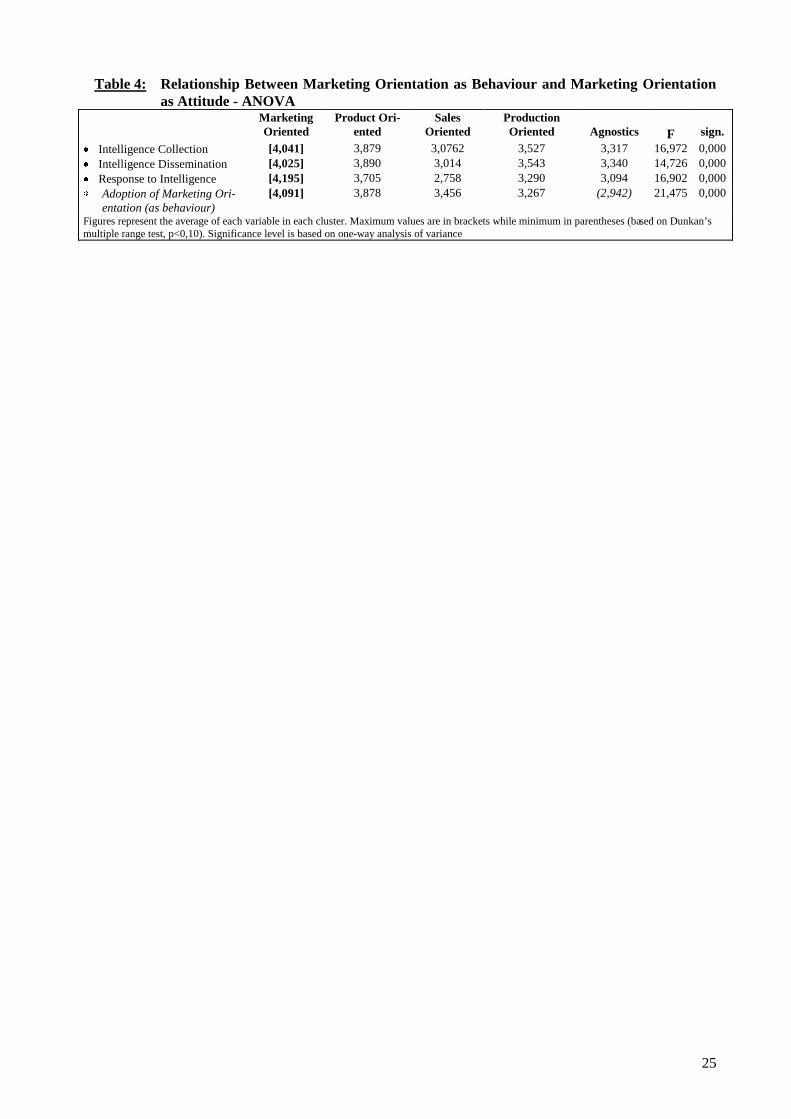
The next stage of the analysis involved the investigation of the potential relationship between market-ing orientation as an attitude and marketing orientation as behaviour. For this purpose, we performed ANOVA using the attitudinal profiles derived from the previous stage of the analysis as independent variables and the measurements of marketing orientation (as behaviour) as dependent ones. Basically, we examined whether the means of the variables employed to measure the degree of marketing orienta-tion adoption (as behaviour) varied among companies exhibiting different attitudinal profiles. Table 4 presents the findings of that analysis.
The findings presented in Table 4 clearly demonstrate that the adoption of marketing orientation, as behaviour, is associated with the adoption of marketing orientation, as attitude. More specifically, the «Marketing Oriented» companies place much greater emphasis on intelligence collection and dissemination as well as on responsiveness to intelligence and generally are the ones that undertake the set of activities that the literature suggests that comprise marketing orientation as behaviour. At the other extreme, the «Agnostics», which view marketing as a confusing concept, are the ones that demon-strate the lowest level of marketing orientation adoption (as behaviour).
PLACE
TABLE 4
AROUND HERE
12
This finding is particularly important in the sense that it manifests that marketing orientation consists of a certain set of beliefs about marketing (which form a specific attitude toward marketing) and of a certain set of activities that actually materialise the positive attitudes towards marketing into practice. Thus, on the basis of these findings, we accept our hypothesis that a genuine marketing orientation adop-tion requires adjustment of both the company’s attitude and behaviour (H2).
4.2. Marketing Orientation Adoption in Industrial vs. Consumer Markets (H3)
In order to investigate the hypothesis that marketing orientation is less developed in industrial goods companies in comparison with consumer goods companies, we carried out two kinds of analyses.
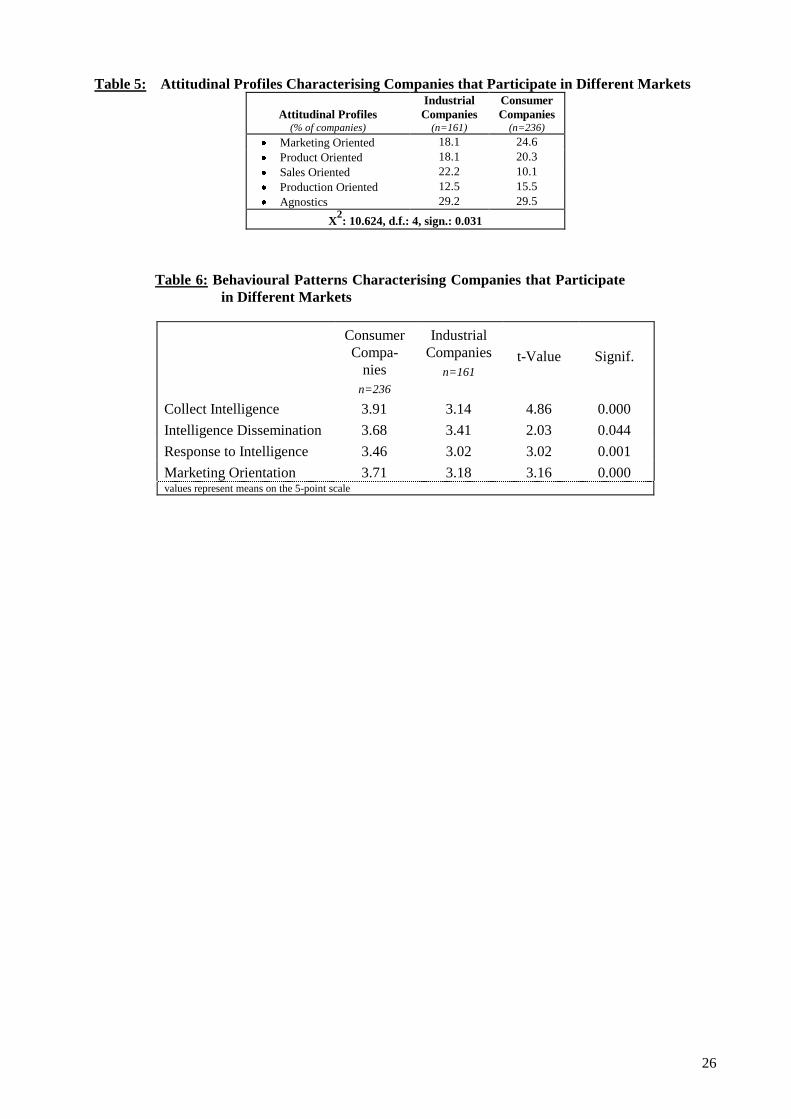
First we examined whether the distribution of companies characterised by various attitudinal profiles tend to differ when the companies are` broken down by the market in which they participate. Table 5 describes this analysis.
One interesting finding that is derived from Table 5 is the large number of both industrial and con-sumer companies falling in the «Agnostics» group. This finding is significant as it clearly indicates that the confusion about the meaning and the content of the marketing concept transcends markets and indus-tries.
The findings of Table 5 also demonstrate some differences between industrial and consumer compa-nies. More specifically, the findings suggest that industrial companies are, primarily, prone to develop a sales orientation while consumer companies are more inclined in building a marketing orientation.
Secondly, we investigated whether the emphasis placed on the components of marketing orientation as behaviour, namely intelligence collection, intelligence dissemination and response to intelligence, tends to differ between industrial and consumer goods companies. Table 6 show the results of this analysis.
As the findings presented in Table 6 demonstrate, industrial companies, when compared to the con-sumer goods companies, are clearly left behind in the development of a behavioural pattern that would manifest adoption of the marketing orientation concept (as behaviour). More specifically, consumer goods companies are more inclined in collecting market intelligence and in disseminating this intelli-gence company-wide. Consumer goods companies have also the tendency to adjust their products to the market conditions to a larger degree than industrial companies do. On these grounds, we accept our third hypothesis that marketing orientation is less developed in industrial goods companies in comparison with their consumer counterparts (H3).
4.3. Effect of Marketing Orientation on Company Performance (H4a, H4b, H5)
Our analysis was next turned into the examination of a possible relationship between marketing ori-entation adoption and company performance as well as into the investigation of the significance that marketing orientation adoption has for the performance of industrial companies as compared to their consumer counterparts. Initially, the relationship between marketing orientation adoption (as attitude) and company performance was investigated for the total sample. For that purpose we carried out an One Way Analysis of Variance in order to examine whether the performance measures varied across the 5 at-titudinal profiles.
As can be seen from Table 7, the results of the analysis for the sample as a whole revealed that the «Marketing Oriented» companies outperform companies with different attitudinal profiles in both di-mensions of performance, namely Performance vs. Targets and Performance vs. Competition. From this
PLACE
TABLE 5
AROUND HERE
PLACE
TABLE 6
AROUND HERE
13
general picture only a single exception was observed. The ability of Production Oriented companies tp achieve and frequently exceed their performance objectives
However, when performance is evaluated against the performance of their main competitors then «Production Oriented» companies, as all other companies that do not share a marketing orientation ap-
proach, are left behind in all four measures of performance (sales volume, market share, profits and ROI). As the company’s performance against its competition is the most critical issue regarding the company’s viability in the future, the data suggest that, only marketing orientation safeguards the com-pany’s long-term prosperity against its competitors.
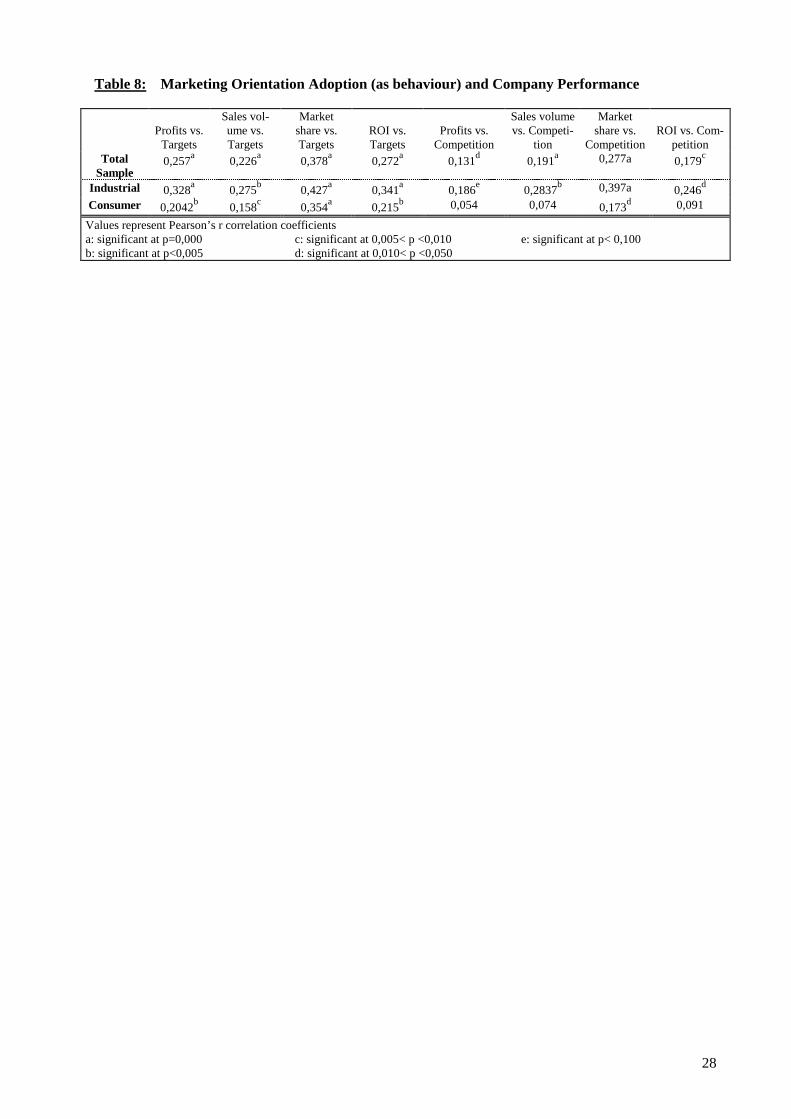
Similar is the picture when the relationship between marketing orientation (as behaviour) and com-pany performance is investigated for the total sample (Table 8). Indeed, the examination of the Pearson’s correlation coefficients between the marketing orientation adoption and all eight measures of company performance show positive and statistically significant associations.
These findings support our hypotheses that marketing orientation adoption (both as attitude and as
behaviour) has a positive effect on both the company performance vs. the performance objectives (H4a) and company performance vs. the company’s competitors’ performance (H4b).
Next, the effects of marketing orientation on company performance for companies operating in dif-ferent markets was examined. Tables 7 and 8 show that marketing orientation has a greater impact on the performance of industrial goods companies than it has on the performance of the consumer goods com-panies. More specifically, as Table 7 shows, «Marketing Oriented» companies in industrial markets, when compared to the companies with different attitudinal profiles, achieve significantly higher per-formance in all performance measures. On the other hand, the «Marketing Oriented» companies in con-sumer markets achieve better performance only in terms of sales volume and market share vs. competi-tors.
When the association between marketing orientation (as behaviour) and company performance is in-vestigated (Table 8), it is revealed that, while for the industrial companies the adoption of marketing ori-entation is positively and statistically significantly associated with all the performance measures exam-ined, for the consumer companies, this association exists only for some of the performance measures. Certain performance measures (profits, sales-volume and ROI vs. competition), exhibit positive but not statistically significant association with marketing orientation adoption.
On these grounds, we accept our hypothesis that, overall, marketing orientation adoption has a greater impact on the performance of the industrial companies than it has on the performance of their consumer counterparts (H5).
5. Conclusions and Implications
The empirical findings presented in this paper provide important insights pertaining to both the con-cept of marketing orientation and its influence on company performance.
As the analysis has shown, the attitudinal and the behavioural aspects of marketing orientation are in-terrelated. Indeed, our findings suggest that the attitude to consider marketing as the culture of satisfying customers’ needs and of adapting products to the customers’ needs and wants leads to specific actions that must be taken in the market place. On the other hand, unless a certain attitude is formed, these ac-tions never emerge. This clarification is particularly important for researchers who try to investigate
PLACE
TABLE 7
AROUND HERE
PLACE
TABLE 8
AROUND HERE
14
how various aspects of management relate to the espousal of marketing orientation. Up to now, most at-tempts to examine several phenomena in the field of marketing and/or management and how these phe-nomena relate to marketing orientation adoption were done by treating marketing orientation as either a set of attitudes or a set of practices-behaviour [1, 2, 3 ]. Our empirical findings suggest that such disas-sociation should be avoided.
This finding is also significant for practitioners who wish to re-orientate their companies and build a genuine marketing orientation since it helps to explain why companies striving to build a marketing ori-entation often fail.
Starting from the main principle that marketing oriented companies stand in the market to satisfy cus-tomers’ needs, their Management usually attempts to foster a marketing oriented approach either to the company’s system of believes or to their company’s structural arrangements. Our analysis has shown that by placing emphasis solely on the company’s attitudes, through manipulation of the prevailing sys-tem of beliefs, marketing orientation cannot flourish. At best, people will start thinking in terms of satis-fying customers’ needs but, the knowledge of what these needs exactly are and how they can be satis-fied, will be absent. Unless the skills to collect intelligence from the market are incorporated in the company and the structural arrangements are re-designed to accommodate the necessary intradepart-mental flow of communication, the company will be unable to show responsiveness to customers’ needs and satisfy them.
Thus, the establishment of the interrelationship between the two pivots of the marketing orientation serves in guiding the efforts of the companies that attempt to become marketing orientated. Their efforts need to focus on both the aspects of the concept if «lip-service» to marketing is to be avoided.
Another interesting finding is the one concerning the degree of adoption of the marketing orientation concept by industrial companies. Our analysis has shown that industrial companies, when compared to consumer ones, are less likely to develop a marketing orientation. On the contrary, industrial companies are more inclined to develop a sales, production or a product orientation.
This finding demonstrates how the majority of industrial goods companies attempt to develop a com-petitive advantage. Many of them tend to focus on their sales effort. Others attempt to improve their business through the attraction of customers by adding extra features to their products, using modern technology or by focusing on their production process. However, they do not bother to evaluate the benefits that these actions will bring to their customers. Only a fraction of industrial companies appear to actively seek to adapt their products to the specific needs and wants of their customers.
Thus, corrective actions with regard to both the attitudes held and the practices employed by indus-trial goods companies is necessary. This necessity stems from the fact that, as this study has shown, marketing orientation leads to better performance and, for industrial companies specifically, this rela-tionship is even stronger.
Indeed, our data show a statistically positive association between marketing orientation adoption and company performance. Previous studies [ 1, 2, 3, 19, 36, 37 ] support the view that developing a market-ing orientation leads to performance improvements. Our study examined two important dimensions of company performance (performance vs. performance objectives and performance vs. competition per-formance) and has shown that the adoption of marketing orientation improves both of them.
Indeed our analysis has shown that Marketing Oriented companies outperform companies with dif-ferent orientations in both dimensions of performance. From this general picture only a single exception was observed: The ability of Production Oriented companies to achieve, and frequently exceed, their performance objectives. This point was also suggested by Narver and Slater [2] who noticed that SBUs operating in certain markets (e.g. commodity businesses) and maintaining a production orientation may achieve high performance. They explicated this “paradox” by stressing the ability of Production Orien-tated companies to be very consistent and efficient in what they do. As a result, they may be able to achieve high performance through a low cost strategy and penetration pricing.
In addition to this, one should keep in mind that companies pursuing a production orientation have more stable and predictable business, serve regular customers and receive steady cash-flows. Hence, based on their previous experience and in their pursuit for efficiency, they can set realistic expectations about performance that they can easily achieve. However, when the performance against main competi-
15
tors was examined, Production Oriented companies were unable to demonstrate equally high perform-ance.
Consequently, our findings suggest that marketing orientation has a significant impact on company’s performance and, more importantly, on its performance against the company’s competitors. Thus, mar-keting orientation development may very well serve as a powerful and fruitful base upon which a com-petitive advantage can be established.
This is particularly true for companies competing in industrial markets. As our findings suggest, in-dustrial companies that are characterised by higher levels of marketing orientation adoption, tend to achieve better performance, not only against their own performance goals, but also, and more impor-tantly, against their competitors. More specifically, the profits, R.O.I, sales volume and market share of the marketing oriented industrial companies, compared with the respective figures of the non-marketing oriented ones, are significantly higher.
Clearly, industrial companies that invest in understanding the customers and adapting their offerings to the customers’ needs gain in terms of the preference they enjoy in the market as potential suppliers. This preference is translated into better performance, not only in terms of the performance objectives they set but also, and more importantly, in comparison with the performance achieved by their main competitors.
6. Limitations of the Study and Future Research
Our study has certain limitations that need to be mentioned. One first limitation concerns the cross-sectional nature of the research design. Although cross-sectional samples enable generalisation of the findings, they prevent close investigation of several aspects of the relationships identified in this study. For instance, it may be possible that for certain market conditions marketing orientation may have a greater or a lower impact on company performance. Replication of our study within a single sector or between two or three different sectors might give us a more detailed view of the nature of the relation-ships identified in this study.
A second limitation concerns the context of the study (Greece) which put constraints on the gener-alizability of the results to other companies and other national contexts. However, the use of a country other than United States increases our understanding of the role of marketing orientation in other con-texts and helps to demonstrated the universality and global importance of the concept. Future research that replicates this study in other national contexts would be welcome and would further improve our understanding of the significance that marketing orientation has on company performance in general and on the performance of industrial goods companies in particular.
Some other interesting directions for future research also spring from this study. One direction relates to the need of constructing a single measurement of marketing orientation that will comprise both the at-titudinal and the behavioural pivots of the concept. In this study, marketing orientation was measured by using two different measures for each different aspect of the concept. Future attempts should seek to de-velop and validate, through empirical evidence, a single measure that will incorporate both of them. Such measure would facilitate further research in the field of marketing and specifically the investiga-tion of relationships and/or causalities between the adoption of marketing orientation and other manage-rial considerations.
Future research is also needed in order to investigate the conditions under which marketing orienta-tion is developed. As this research has shown, different orientations exist and one can identify compa-nies that pursue them. Future research should attempt to answer questions like: Why does the majority of the companies fail to follow a marketing orientation, especially when the latter is admittedly a solid source of competitive advantage ? Are there any company-specific, or environment-specific conditions that influence the development of marketing orientation ? The identification of mediating variables that influence the development of marketing orientation will be particularly useful to the companies that struggle to develop it as it will depict the issues the company needs to tackle in order to do so.
Finally, another area for future research relates to the reasons why industrial goods companies, when compared with the consumer goods companies, are left behind in developing marketing orientation. As our findings have shown, marketing orientation is not widespread among industrial companies. Answer-

16
ing why this is so goes beyond the scope of this study. Yet, the identification of the reasons why indus-trial goods companies tend not to develop a marketing orientation will help to design specific corrective actions that will assist the diffusion of marketing orientation among industrial goods companies.

17
Appendix A
3 Marketing Orientation as Attitude - Means and Standard Deviations of 15 Statements Describing Different Attitudinal Approaches to Marketing Orientation
Marketing is: Marketing is,
Means
Standard Deviations
x Primarily a sales-support function 3,975 1,097 x About promoting our products 3,582 1,097 x About identifying/specifying our customers’ needs and satisfying them 4,319 0,817 x What the Marketing and/or the Sales Dpts do 3,315 1,137 x The effort to analyse market conditions 4,146 0,851 x Literally non-existent to our company 3,253 1,512 x The philosophy/culture leading our company 3,253 1,211 x About building an image/positioning for our products 3,697 0,982 x A way to handle decisions concerning the quality and quantity of the production
process 3,260 1,211
x About managing the production process 2,824 1,185 x A way to create customer contacts and closing deals 3,163 0,990 x The effort to collect intelligence on competition 3,752 0,933 x Adapting to changing market conditions 3,933 1,021 x Building customer relationships 3,674 1,021 x A confusing concept 2,470 1,226
3 Marketing Orientation as Behaviour - Means, Standard Deviations and Reliability Analysis of the Items Comprising the Kohli and Jaworski Scale
Means
Standard Deviations
Variable to Scale Corre-
lation
Cronbach’s Alfa without the variable
Cronbach’s Alfa
Collect Market Intelligence 0,675 x Collect information from users on their future needs 3,651 1,288 0,431 0,594 x Company is slow in identifying changes in preferences 3,450 1,290 0,327 0,667 x Information is collected from the user to evaluate prod-
uct’s quality 3,509 1,301 0,498 0,565
x Frequent contacts with potential influences of the end-users buying decisions
3,476 1,411 0,422 0,595
x Delays in identifying and comprehending major changes in the market environment
3,739 1,322 0,423 0,596
Intelligence Dissemination 0,805 x Minimal communication between Marketing and the
other departments about market developments 3,606 1,371 0,536 0,781
x Information on customers’ satisfaction is disseminated throughout the organisation and hierarchical levels
2,945 1,397 0,560 0,776
x Marketing people meet managers from other depart-ments to discuss future needs of the end-users
3,237 1,391 0,670 0,749
x When something big happens to a major customer or market the whole organisation knows about it in a short term
3,845 1,246 0,548 0,778
x Marketing employees meet regularly with employees of other functional units to discuss future trends in the market
3,651 1,249 0,628 0,761
x The various departments are slow to become informed on matters related to competition, customers etc.
3,870 1,234 0,441 0,788
Response to Intelligence 0,682 x Employees from different functional units meet fre-
quently to design the company response to changing market conditions
3,434 1,219 0,456 0,566
x Strategies and plans are based more on the company’s production capabilities rather than market research re-sults
2,614 1,329 0,310 0,524
x There is a tendency to ignore changes in the preference patterns of the end-users regarding the products they buy
3,711 1,253 0,469 0,554
x New product development procedures are often scruti-nised in order to ensure that they produce the right products that will satisfy the customers
3,368 1,391 0,449 0,555

18
Means
Standard Deviations
Variable to Scale Corre-
lation
Cronbach’s Alfa without the variable
Cronbach’s Alfa
Marketing Orientation (as behaviour) 3,474 0,775 0,822 ¡ Intelligence collection 3,559 0,894 0,649 0,781 ¡ Intelligence dissemination 3,527 0,934 0,692 0,737 ¡ Response to intelligence 3,290 0,879 0,687 0,744
19
References 1. Hooley Gr., J. Lynch and J. Shepherd, The Marketing Concept: Putting the Theory into Practice, European
Journal of Marketing, 24, no. 9, 7-23, 1990 2. Narver J. and St. Slater, The Effect of Market Orientation on Business Profitability, Marketing Science
Institute, Report no. 89-120, Cambridge Massachusetts, 1989 3. Kohli A. and B. Jaworski, Market Orientation: Antecedents and Consequences, Marketing Science Institute,
Report no. 92-104, Cambridge, Massachusetts 1992 4. Druker P., The Practice of Management, Harper and Row Publishers Inc., N. York,. 1954 5. Felton A. Making the Marketing Concept Work, Harvard Business Review, 37, no. 4, 55-65, 1959 6. Swartz G., Organising to Become Market Driven, Marketing Science Institute, Report no. 90-123, Boston
Massachusetts, 1990 7. Deshpande R and Fr. Webster, Organisational Culture and Marketing: Defining the Research Agenda,
Journal of Marketing, 53, no. 1, 3-15, 1989 8. Deshpande R., J. Farley and Fr. Webster, Corporate Culture, Customer Orientation and Innovativeness in
Japanese Firms: A Quadrant Analysis, Marketing Science Institute, Report no. 92-100, Boston Massachusetts, 1992
9. Baker M., Marketing - A New Philosophy of Management ?, The Quarterly Review of Marketing, Winter, 1-4, 1989
10. Houston Fr., The Marketing Concept: What It Is And What It Is Not, Journal of Marketing, 50, no. 2, 23-39, 1986
11. Dixon R., Marketing as Production: The Development of a Concept, Journal of The Academy of Marketing Science, 18, no. 4, 337-343, 1990
12. Trout J. and A. Ries, Marketing Warfare, McGraw Hill, N. York, 1985 13. Elliot G., The Marketing Concept: Necessary but Sufficient ?, European Journal of Marketing, 21, no. 2, 20-
30, 1987 14. Bonoma T., The Marketing Edge: Making Strategies Work, Free Press, N. York, 1985 15. Bonoma T. and B. Clark, Marketing Performance Assessment, H.B.S. Press, Massachusetts, 1992 16. Canning G., Is Your Company Marketing Oriented ?, Journal of Business Strategy, 9, no. 3, 34-36, 1989 17. Payne A., Developing a Market Oriented Organisation, Business Horizons, 31, no. 3, 46-53, 1988 18. Piercy N., Market-Led Strategic Change, Butterworth-Heinemann, Oxford, 1992 19. Kohli A. and B. Jaworski, Market Orientation: The Construct, Research Propositions and Managerial
Implications, Marketing Science Institute, Report no. 90-113, Cambridge, Massachusetts, 1990 20. Fern E. F. and Brown J. R., The Industrial/consumer Marketing Dichotomy: A Case of Insufficient Justification,
Journal of Marketing, 48, no.2, 68-77, 1984. 21. Lilien G. L., Business Marketing: Present and Future, Report 1/1986, Institute for the Study of Business
Market, College of Business Administration, the Pennsylvania State University 22. Webster F. E., Management Science in Industrial Marketing, Journal of Marketing, 42, no.1, 21-27,1978 23. Reeder R.R., E.G. Brierty and B.H. Reeder, Industrial Marketing, Prentice-Hall, N. York, 1991 24. Hutt M. and Th. Speh, Business Marketing Management, Dryden Press, N. York, p. 5, 1992, 4th ed. 25. McTarish E. and Maitland Ang., Industrial Marketing, Macmillan Press Ltd, London, p. 76, 1980 26. abid, p. 77 27. Hlavacek J., “Business Schools Need More Industrial Marketing”, Marketing News, 13, April, 1980 28. Slater S. and Narver J., Market Orientation, Performance and the Moderating Influence on Competitive
Environment, Marketing Science Institute, Report no. 92-118, Cambridge Massachusetts, 1992 29. Ruekert R., Developing a Market Orientation: An Organisational Strategy Perspective, International Journal of
Research in Marketing, 9, no.4, 225-45, 1992 30. Diamantopoulos A. and Hart S., Linking Market Orientation and Company Performance: Preliminary Work on
Kohli and Jaworski's Framework, Journal of Strategic Marketing, 1, no.2, 93-122, 1993 31. Wong V. and Saunders J., Business Orientations and Company Success, Journal of Strategic Marketing, 1,
no.1, 20-40, 1993 32. Greenley G. E., Forms of Market Orientation in UK Companies, Journal of Management Studies, 32, no.1, 47-
66, 1995 33. Urban G and Star S., Advanced Marketing Strategy, Prentice Hall, London, 1991 34. Takeuchi H. and Quelch J, Quality Is More Than Making A Good Product, Harvard Business Review, 61,
no.4, 139-145, 1983 35. Saunders J. and V. Wong, In Search of Excellence in the UK, Journal of Marketing Management, 1, no. 2, 119-
137, 1985 36. Alexander M, Creative Marketing and Innovative Consumer Product Design - Some Case Studies, Design
Studies, 6, no. 1, 41-50, 1985
20
37. Hooley Gr. and J. Shepherd, Lessons from the UK’s High-Flying Companies, Journal of Marketing Management, 1 no. 1, 65-74, 1985
38. Webster F.E. Jr., Industrial Marketing Strategy, John Wiley & Sons, N. York, 1991, 3rd edition 39. Cooper R.G., The Impact of New Product Strategies, Industrial Marketing Management, 12, 243-56, 1983 40. Cooper R.G., New Products: What Distinguishes the Winners, Research Technology Management, Nov-Dec,
27-31, 1990 41. Cooper R.G. and Kleinschmidt, New Products: The Key Factors in Success, American Marketing Association,
Chicago, 1990 42. De Vasconcellos J.A., Key Success Factors in Marketing Mature Products, Industrial Marketing Management,
20, 263-78, 1991 43. Dubinsky A. and Ingram T, A Factor Analysis Study of criteria Examined in the First-Lines Sales Manager
Promotion Process, in An Assessment of Marketing Thought and Practice, B. Walker et al. (editors), AMA Educator’s Conference Proceedings, Chicago, 224-7, 1982
44. Bilkey W., The Export Behaviour of Small Sized Wisconin Firms, Journal of International Business Studies, 8, spring/summer, 93-98, 1978
45. Golden B. R., SBU Strategy and Performance: The Moderating Effects of the Corporate-SBU Relationship, Strategic Management Journal, 13, 145-58, 1992
46. Cavusgil S., Differences Among Exporting Firms Based on Their Degree of Internationalisation, Journal of Business Research, 12, 3, 195-208, 1984
47. Tull D. and D. Hawkins, Marketing Research: Measurement and Method, Macmillan Inc., N. York, 1987 (4th ed.)
48. Churchill G., Marketing Research: Methodological Foundations, Dryden Press, Orlando, 1991 (5th ed.) 49. Donaldson W. G., Manufacturers Need to Show Greater Commitment to Customer Service, Industrial
Marketing Management, 24, no.5, 1995 50. Verhage B.J. and Waarts E., Marketing Planning for Improved Performance: A Competitive Analysis,
International Marketing Review, 15, no.2, 20-30, 1988 51. Robinson and Pearce, Planned Patterns of Strategic Behaviour and their Relationship to Business-Unit
Performance, Strategic Management Journal, 9, 43-60, 1988 52. Venkatraman E. and Ramanujam V., Measurement of Business Performance in Strategy Research: A
Competitive Analysis, Academy of Management Review, 11, no.4, 801-14, 1986 53. Child J., Managerial and Organisational Factors Associated With Company Performance - Part II: A
Contingency Analysis, The Journal of Management Studies, February, 12-27, 1975 54. Chaganti R. and R. Chaganti, A Profile of Profitable and Not-So-Profitable Small Firms, Journal of Small
Business Management, July, 43-51, 1983 55. Kotler Ph., Marketing Management, Prentice Hall, N. York, 1988 6th edition

21
Figure 1: Summary of empirical studies Empirical Study Mrng Orntn/ Per-
formance asso-ciation
Moderator Variables Market variables/ per-formance association
Sample & Scope of Mrng Orntn/ Performance In-vestigation
Narver & Slater (1989) [2]
Positive Not investigated Relative cost, techno-logical change, market growth.
SBUs from single company - across sample
Hooley, Lynch & Shepherd (1990) [1]
Weak positive Not investigated Not investigated Random cross-section sample - across entire sample
Kohli & Jaworski (1990 sample 1) [19]
Positive None identified Product quality, com-petitive intensity, sup-plier power.
Purposive sample - across entire sample
Kohli & Jaworski (1992 sample 2) [3]
Positive None identified Competitive intensity. Random cross-section sample - across entire sample
Slater & Narver (1992) [28]
Positive Market turbulence with ROI. Technological change with new prod-uct success. Market growth with sales growth
Relative size, relative cost, ease of market entry, competitive hos-tility
SBUs form 2 compa-nies - across sample
Ruekert (1992) [29]
Positive Not investigated Not investigated SBUs from single company - across sample
Diamantopoulos & Hart (1993) [30]
Weak positive Competitor hostility Not investigated Purposive sample - comparative between above- and below-average performers
Wong & Saun-ders (1993) [31]
Positive Not investigated Not investigated Purposive sample - across entire sample
Greenlay (1995) [32]
None Market turbulence with ROI. Technological change with new prod-uct success. Customer power with sales growth.
Relative size, relative cost, technological change, market growth
Random cross-section sample - across entire sample

22
Consumer Industrial Services TOTALSb Main Market 236 161 40 437 Small Medium Large Sizea 106 189 143 438 a The definition of size took into consideration the characteristics, in terms of employment level and annual turn-over, of Greek companies. Thus, as small were defined those companies that employed up to 50 employees and had an annual turn over no more than US$ 2 mil. As medium were defined those companies that employed from 50 up to 250 em-ployees and had an annual turn over from US$ 2 mil. up to US$ 11 mil. As large were defined those companies that employed more than 250 employees and had an annual turn over exceeding US$ 11 mil. b Totals do not add to 444 as some respondents did not indicate the size of the company while others failed to indicate the market that their company participated in.
Table 1: Structure of the Respondents
23
Table 2: Attitudes Towards Marketing - A Factor Analysis
Factors Variables Loadings F1: Market Analysis & Adaptation Intelligence on Competition 0,841 (22,6% of variation) Adapt to the Market 0,818 Market Analysis 0,740 F2: «High-Tech» Selling Promoting Products 0,814 (22,2% of variation) Supporting Sales 0,785 Confined in Sales & Marketing Dep. 0,682 F3: Ignorance Not Existent 0,884 (9,3% of variation) A Confusing Concept 0,785 F4: «High-Tech» Production Design & Production Management 0,880 (7,9% of variation) Decisions on Quality & Quantity 0,866 F5: Traditional Selling Build Customer Relations 0,845 (6,8% of variation) Maintain Customers Contacts 0,757 F6: Marketing Philosophy Satisfy Customers’ Needs 0,753 (6,1% of variation) Build Product Positioning & Image 0,676 A Company Culture 0,445 Kaiser-Meyer-Olkin Measure of Sampling Adequacy = 0,73621 Bartlett Test of Sphericity = 1979,5292, sign = 0,000
24
Variables
(% of Companies, n=444)
Marketing Oriented (24,2%)
Product Oriented (20,2%)
Sales Oriented (14,5%)
Production Oriented (11,5%)
Agnostics
(29,6%)
F
Sign.
x SUPPORTING SALES (3,084) 4,025 [4,526] 3,888 [4,353] 28,790 0,000 x PROMOTING PRODUCTS (2,894) 3,367 3,929 3,733 [4,086] 22,168 0,000 x SATISFY CUSTOMERS’ NEEDS [4,705] 4,291 (3,421) 4,405 4,396 41,388 0,000 x CONFINED IN SALES &
MARKETING DPTs (2,852) (3,088) [3,842] 3,288 3,594 10,482 0,000
x MARKET ANALYSIS [4,357] [4,468] (3,350) 3,977 4,267 23,206 0,000 x NOT EXISTENT (1,315) 2,329 2,245 (1,666) [3,034] 46,214 0,000 x A COMPANY CULTURE [4,094] (2,835) (2,175) 3,650 3,267 38,491 0,000 x BUILD PRODUCT
POSITIONING & IMAGE [4,126] (3,075) 3,631 3,800 3,775 14,909 0,000
x DESIGN & PRODUCTION MANAGEMENT
2,789 [3,758] 2,245 [3,706] (1,873) 51,512 0,000
x DECISIONS ON QUALITY & QUANTITY
3,452 [3,974] (2,473) [3,841} (2,519) 34,033 0,000
x MAINTAIN CUSTOMERS CONTACTS
3,200 2,265 [4,105] (1,911) 3,732 61,436 0,000
x INTELLIGENCE ON COMPETITION
[4,210] 3,949 (3,140) (2,666) 3,965 34,692 0,000
x ADAPT TO THE MARKET [4,378] 4,139 (3,333) (3,111) 4,163 29,687 0,000 x BUILD CUSTOMER RELATIONS [4,126] (2,949) [4,263] (2,688) 3,956 48,237 0,000 x A CONFUSING CONCEPT (1,663) 2,493 2,877 (1,666) [3,163] 34,875 0,000 Figures represent the average of each variable in each cluster. Maximum values are in brackets while minimum in parentheses (based on Duncan’s multiple range test, p<0,10). Significance level is based on one-way analysis of variance
Table 3: Company Profiles Based on Company’s Attitudes Towards Marketing - Cluster Analysis and ANOVA
25
Table 4: Relationship Between Marketing Orientation as Behaviour and Marketing Orientation as Attitude - ANOVA Marketing
Oriented Product Ori-
ented Sales
Oriented Production Oriented
Agnostics
F
sign.
x Intelligence Collection [4,041] 3,879 3,0762 3,527 3,317 16,972 0,000 x Intelligence Dissemination [4,025] 3,890 3,014 3,543 3,340 14,726 0,000 x Response to Intelligence [4,195] 3,705 2,758 3,290 3,094 16,902 0,000 Adoption of Marketing Ori-
entation (as behaviour) [4,091] 3,878 3,456 3,267 (2,942) 21,475 0,000
Figures represent the average of each variable in each cluster. Maximum values are in brackets while minimum in parentheses (based on Dunkan’s multiple range test, p<0,10). Significance level is based on one-way analysis of variance
26
Table 5: Attitudinal Profiles Characterising Companies that Participate in Different Markets
Attitudinal Profiles (% of companies)
Industrial Companies
(n=161)
Consumer Companies
(n=236) x Marketing Oriented 18.1 24.6 x Product Oriented 18.1 20.3 x Sales Oriented 22.2 10.1 x Production Oriented 12.5 15.5 x Agnostics 29.2 29.5
X2: 10.624, d.f.: 4, sign.: 0.031
Consumer Compa-
nies n=236
Industrial Companies
n=161
t-Value
Signif.
Collect Intelligence 3.91 3.14 4.86 0.000
Intelligence Dissemination 3.68 3.41 2.03 0.044
Response to Intelligence 3.46 3.02 3.02 0.001
Marketing Orientation 3.71 3.18 3.16 0.000 values represent means on the 5-point scale
Table 6: Behavioural Patterns Characterising Companies that Participate in Different Markets

27
Table 7: Marketing Orientation Adoption (as Attitude) and Company Performance
TOTAL SAMPLE
n=444 Marketing Oriented
Product Oriented
Sales Oriented
Production Oriented
Agnostics
F
sign
Profits vs. targets [24,960] 20,831 (14,120) [25,180] 18,791 10,498 0,000 Sales volume vs. targets [22,670] 23,338 (16,016) [27,285] 20,534 12,775 0,000 Market share vs. targets [27,367] 23,292 (16,250) [26,565] (18,446) 10,113 0,000 ROI vs. targets [23,521] 17,400 (12,833) [23,681] 15,943 10,436 0,000 Profits vs. competitors [22,560] 18,521 (12,137) 21,840 15,735 9,802 0,000 Sales volume vs. competitors [25,911] 20,437 (14,426) 21,985 18,198 9,960 0,000 Market share vs. competitors [29,039] 24,167 (14,895) 20,477 (16,815) 7,688 0,000 ROI vs. competitors [21,536] 14,908 (10,812) 20,568 (13,680) 10,290 0,000
INDUSTRIAL COMPANIES
n=161 Marketing Oriented
Product Oriented
Sales Oriented
Production Oriented
Agnostics
F
sign
Profits vs. targets [26,555] 21,391 17,935 20,400 17,710 2,310 0,061 Sales volume vs. targets [26,889] 24,956 21,032 24,391 (19,184) 2,001 0,098 Market share vs. targets [25,222] 24,272 (17,517) 24,409 (17,000) 2,794 0,029 ROI vs. targets [23,176] 14,833 15,565 16,800 14,320 2,182 0,076 Profits vs. competitors [28,750] 23,000 (15,800) 21,475 (15,458) 4,935 0,001 Sales volume vs. competitors [30,687] 26,235 (19,120) (21,409) (15,293) 4,313 0,003 Market share vs. competitors [29,533] 25,294 (14,041) 20,810 (12,370) 6,704 0,000 ROI vs. competitors [26,363] 18,285 11,555 18,187 12,165 3,351 0,014 CONSUMER COMPANIES
n=236 Marketing Oriented
Product Oriented
Sales Oriented
Production Oriented
Agnostics
F
sign
Profits vs. targets 21,886 19,743 19,833 22,533 16,849 1,961 0,102 Sales volume vs. targets 24,021 22,359 22,600 24,007 20,867 0,852 0,494 Market share vs. targets 25,285 23,333 (20,411) 24,808 (18,607) 9,705 0,019 ROI vs. targets 17,775 15,794 16,052 20,761 15,108 1,524 0,197 Profits vs. competitors 22,305 19,733 15,846 20,461 19,675 0,670 0,614 Sales volume vs. competitors [26,159] 20,562 20,077 20,222 20,145 5,923 0,000 Market share vs. competitors [26,789] 21,333 16,416 19,769 19,936 2,516 0,043 ROI vs. competitors 22,680 15,880 18,100 21,250 16,314 1,624 0,173 Figures represent the average of each variable in each cluster. Maximum values are in brackets while minimum in parentheses (based on Dunkan’s multiple range test, p<0,10). Significance level is based on one-way analysis of variance
28
Table 8: Marketing Orientation Adoption (as behaviour) and Company Performance
Profits vs. Targets
Sales vol-ume vs. Targets
Market share vs. Targets
ROI vs. Targets
Profits vs.
Competition
Sales volume vs. Competi-
tion
Market share vs.
Competition
ROI vs. Com-
petition Total
Sample 0,257
a 0,226
a 0,378
a 0,272
a 0,131
d 0,191
a 0,277a 0,179
c
Industrial 0,328a 0,275
b 0,427
a 0,341
a 0,186
e 0,2837
b 0,397a 0,246
d
Consumer 0,2042b 0,158
c 0,354
a 0,215
b 0,054 0,074 0,173
d 0,091
Values represent Pearson’s r correlation coefficients a: significant at p=0,000 c: significant at 0,005< p <0,010 e: significant at p< 0,100 b: significant at p<0,005 d: significant at 0,010< p <0,050