Marketing on Marginporkcdn.s3.amazonaws.com/sites/all/files/documents/2011 Swine... · Marketing on...
29
Marketing on Margin 2011 NPB Swine Educators Inservice Mark Storlie ISU Swine Field Specialist 563-425-3331 or [email protected]
Transcript of Marketing on Marginporkcdn.s3.amazonaws.com/sites/all/files/documents/2011 Swine... · Marketing on...

Marketing on Margin
2011 NPB Swine Educators Inservice
Mark Storlie ISU Swine Field Specialist 563-425-3331 or [email protected]

Margin Blitz ….
Markets …
Eye on Margin …
ISU Extension Education efforts …
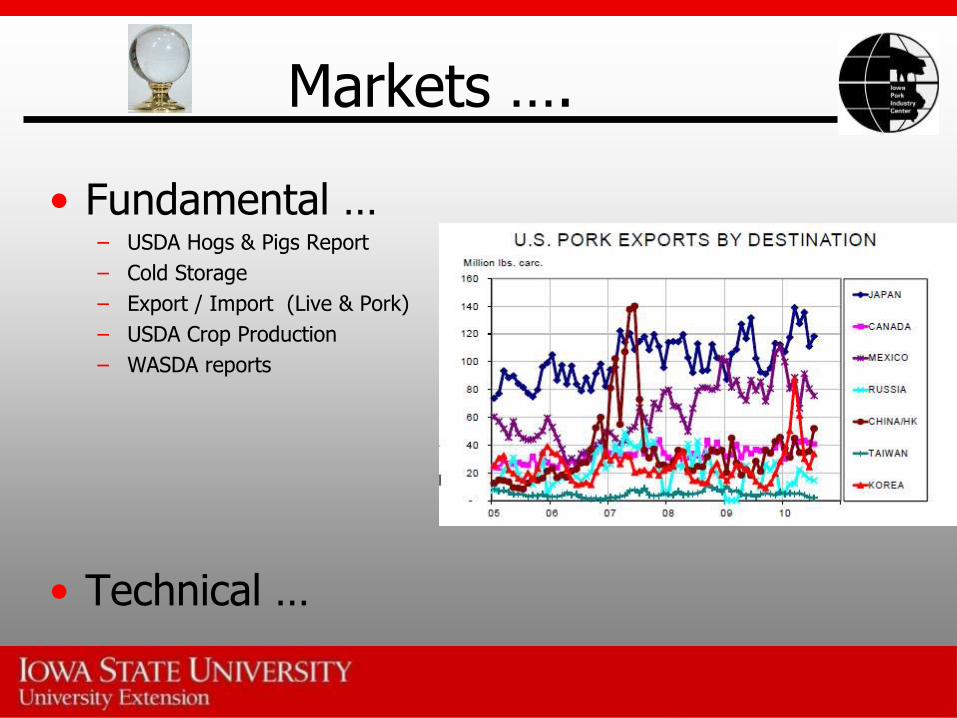
Markets ….
• Fundamental … – USDA Hogs & Pigs Report
– Cold Storage
– Export / Import (Live & Pork)
– USDA Crop Production
– WASDA reports
• Technical …

7/15/11
$90.77
8/21/09
$43.07
Lean Hogs
Dec LT Weekly

4/1/11
$104.35
6/5/09
$56.37
Lean Hogs
June LT Weekly

9/2/11
$7.79
6/27/08
$7.99 Corn
Dec
LT Weekly

US $
Dec
LT Weekly

US $
Dec
LT Monthly
7/01
$121.99
4/08
$71.05

Corn - Dec
US $ - Dec

Eye on margin ….

Revenue: • Market Hog $$$$ Expense: • Pig Expense - $$ • CORN - $$ • SOYBEAN MEAL - $$ = Crush Margin Remaining Expenses: • Feed Other and Additives $ 11.35 • Grind, mix deliver $ 3.62 • Veterinary and medical $ 4.15 • Labor and administration $ 5.67 • Operating interest $ 2.67 • Utilities $ 2.57 • Transportation $ 2.00 • Facilities $ 8.45
$ 40.48
Profit/Loss:
$$$
- $$
$$
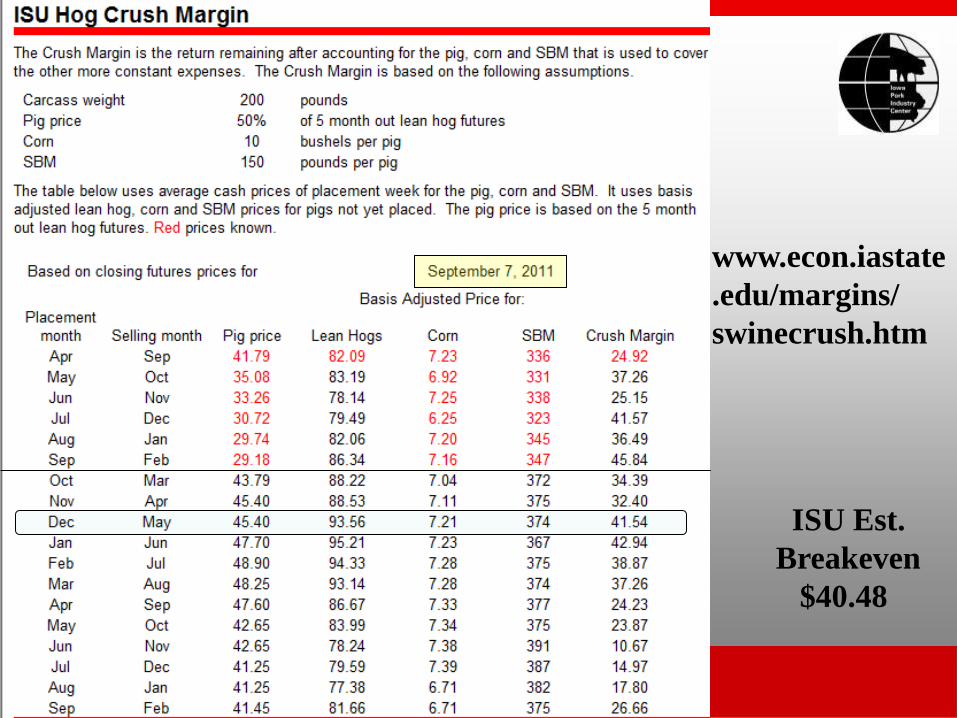
www.econ.iastate
.edu/margins/
swinecrush.htm
ISU Est.
Breakeven
$40.48

ISU Est.
Breakeven
$40.48

Wean-Finish Crush Margin ($/Head) by Sale Month Pigs Placed in Next 5 Months: Wednesday Futures Prices for
Lean Hogs, Weaned Pigs, Corn and SBM
ISU Est.
Breakeven
$40.48


GT Data: Finisher (2008-2010)
Data Base
Avg.
Enter Wt. 52.13
Mkt. Wt 270.1
Mortality 3.57%
ADG 1.68
F/G 2.98
2.56 to 3.81
Feed/hd Mkt 632
Top 10%
Sort on ADG
63.57
291.8
2.11%
2.09
2.82
2.57 to 3.31
638
Top 10%
Sort on F/G
52.62
274.63
2.71%
1.81
2.67
2.57 to 2.72
579

Why have group records...
Management Decisions
• establish Cost of Production
• know the PIG CRUSH for your operation
• monitor changes in feed or medication
• evaluation of genetic sources
• compare building types
• compare contract producers
Communication
• lenders, veterinarian, labor, etc.

Mange Risk by
Managing Margin
• Cost of Production
• Budget Management
• Manage your Margin
“If you can’t measure it, then you can’t manage it.” - origin unknown

What Tools do you have in your Tool Box ???
Cash marketing Forward Contracts Futures Contracts Options Contracts
Insurance based products …
Livestock Risk Protection (LRP) Livestock Gross Margin (LGM)

Revenue: • Market Hog $$$$ Expense: • Pig Expense - $$ • CORN - $$ • SOYBEAN MEAL - $$ = Crush Margin Remaining Expenses: • Feed Other and Additives $ 11.35 • Grind, mix deliver $ 3.62 • Veterinary and medical $ 4.15 • Labor and administration $ 5.67 • Operating interest $ 2.67 • Utilities $ 2.57 • Transportation $ 2.00 • Facilities $ 8.45
$ 40.48
Profit/Loss:
$$$
- $$
$$

ISU Est.
Breakeven
$40.48

ISU Extension Education ….
• ISU Website … http://www.econ.iastate.edu/margins/
• Margin Maker Workshops … 3 to 4 hr; education and participant work with simulated marketing for 2 group of pigs (Excel)
• Risk Mgmt Seminar … Nov.-Dec. 2011, 3 locations
– Follow up – 4 to 6, 1 hr session over 6 month period via live or web. Participants will paper manage a 2,400 head finisher.

Questions …
E-mail: [email protected]
Snouts & Tails - Electronic Newsletter – 6x/year
“Failing to plan is a plan to fail” - Effie Jones
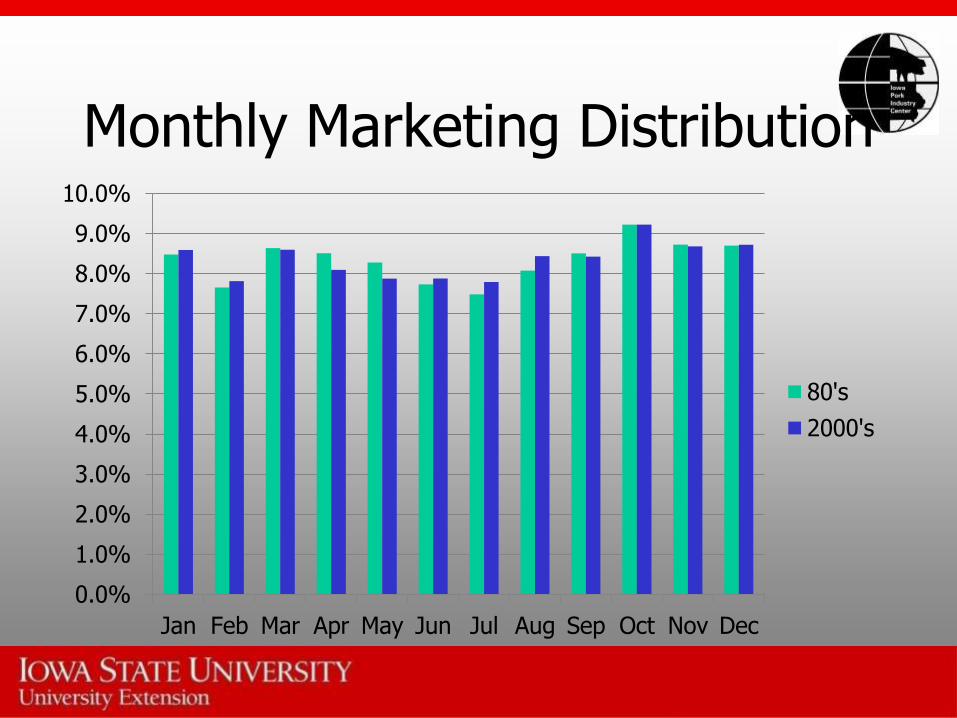
Monthly Marketing Distribution
0.0%
1.0%
2.0%
3.0%
4.0%
5.0%
6.0%
7.0%
8.0%
9.0%
10.0%
Jan Feb Mar Apr May Jun Jul Aug Sep Oct Nov Dec
80's
2000's

ISU Estimated Returns Farrow to Finish, 2000-2009
Average profit per head = $4.20 2000 2001 2002 2003 2004
$9.76 $14.71 -$15.03 -$3.13 $27.64
2005 2006 2007 2008 2009
$31.42 $21.03 $3.14 -$21.53 -$26.04
Should this impact pig flow ?
Does this impact your breeding?

ISU Estimated Returns Farrow to Finish, 2000-2009
Average profit per head / month
May June July Aug Avg. Profit
$17.69 $18.78 $15.84 $12.05 $16.09
Nov Dec Jan Avg. Profit
- $9.26 - $7.54 - $4.90 - $5.86
Litter
(9 pigs
market)
$144.81
$197.55
$-52.74

Seasonal Impact
Farrowing Rate - month Farrowed (Pig ChampTM: Farrowing Rate Report)
Jan 74.00% Apr 89.00% Jul 90.00% Oct 81.00%
Feb 81.00% May 86.00% Aug 88.00% Nov 77.00%
Mar 85.00% Jun 89.00% Sep 87.00% Dec 76.00%
Farrowing Rate - month Bred
Jan 86.00% Apr 88.00% Jul 77.00% Oct 81.00%
Feb 89.00% May 87.00% Aug 76.00% Nov 85.00%
Mar 90.00% Jun 81.00% Sep 74.00% Dec 89.00%
month MARKETED - ISU Estimated Livestock Returns, Farrow to Finish,
10 yr monthly average profit
Jan $ -4.90 Apr $ 3.94 Jul $ 15.84 Oct $ -1.75
Feb $ 1.49 May $ 17.69 Aug $ 12.05 Nov $ -9.26
Mar $ 0.49 Jun $ 18.78 Sep $ 3.57 Dec $ -7.54
4 months
6 months
Bred
Farrow
MKT

Planned … Seasonal Management
Maximize Minimize
Hog Mkt May-Jun-Jul-Aug Oct-Nov-Dec-Jan
$144.81/litter $-52.74/litter
Lactation Feed Intake Jun-Jul-Aug-Sept
Breeding Target (#) Jul-Aug-Sept-Oct Dec-Jan-Feb-Mar
Observed Farrowing Nov-Dec-Jan-Feb
Quality Matings Jul-Aug-Sept-Oct
all year !!

Planned … Seasonal Management
Maximize Minimize
Hog Mkt May-Jun-Jul-Aug Oct-Nov-Dec-Jan
$144.81/litter $-52.74/litter
Quality Matings Jul-Aug-Sept-Oct
Cull Repeat Breeders Jun-Jul-Aug-Sept
Increase Gilt Pool Jun-Jul-Aug-Sept
Maternal Mating Aug-Sept-Oct-Nov Jan-Feb ?
Oxytocin in semen Jul-Aug-Sept-Oct ?


![swine flu kbk-1.ppt [Read-Only]ocw.usu.ac.id/.../1110000141-tropical-medicine/tmd175_slide_swine_… · MAP of H1 N1 Swine Flu. Swine Influenza (Flu) Swine Influenza (swine flu) is](https://static.fdocuments.in/doc/165x107/5f5a2f7aee204b1010391ac9/swine-flu-kbk-1ppt-read-onlyocwusuacid1110000141-tropical-medicinetmd175slideswine.jpg)