Marketing Mix
18
DOI: 10.2501/JAR-52-4-433-449 December 2012 JOURNAL OF ADVERTISING RESEARCH 433 INTRODUCTION Social media are a game-changing technology with a major impact on business. Early adopters who integrated social media into their strategy and operations are well placed to capture new opportunities. Based on a sur- vey of more than 3,000 senior executives across industries, geographies, and functions, a recent McKinsey report indicated that companies quali- fied as “networked” (those that used collabora- tive Web 2.0 technologies intensively to connect the internal efforts of employees and extend the organization’s reach to customers, partners, and suppliers) outperformed other companies in terms of market share, profitability, and market leader- ship (Bughin and Chui, 2010; Shearman, 2011). The impact of social media has been widely reported in the lay press, trade journals, and aca- demic research. In fact, the growth of social-media advertising spending in the United States will out- pace search advertising by 34 percent to 15 percent on a compound annual basis over the next 5 years (Forrester, 2010). This “paid-for” use of social media accounts for only a fraction of its real impact on brand marketing. Potentially far more powerful— though less well understood—is the accelerated trend in unpaid-for so-called earned, unsolicited communications originating with consumers that are beginning to shape (and reshape) the successes and failures of brands and companies. Companies need to do more than just listen. They need to engage in brand conversations. The traditional notion of a “target customer” in the brand-communication paradigm must be enriched to take account of the fact that the consumer now has a voice and wants to be heard. In this study, the authors propose a methodology to measure and quantify the impact of this “people power” on the sales and profits of brands and companies. Wikipedia describes “social media” as “Media for social interaction, using highly accessible and scalable publishing techniques. Social media use Web-based technologies to turn communication into interactive dialogues.” Although this definition is informative, it offers no practical help to companies wanting to The Power of Evil The Damage of Negative Social Media Strongly Outweigh Positive Contributions MARCEL CORSTJENS INSEAD marcel.corstjens@ insead.edu ANDRIS UMBLIJS McKinsey andris_umblijs@ mckinsey.com Media activities generated by consumers or communities that are neither paid for nor induced by brand owners are claimed to have a potentially game-changing impact on communication and brand building. In this study, the authors propose a rigorous methodology to assess the impact of this type of social media activities on the actual performance of brands in the market. The article begins by developing a four-step process to condense the complex reality of micro-social-media events for a brand into a manageable set of social media indicators (SMI). These SMI subsequently are used as a subset of the drivers, together with more traditional marketing-mix elements—in a general market-response model—to estimate their relative impact on brand performance in the market. This methodology is illustrated with two real-world examples—one in the market for flat-screen-television market and the other in the set of Internet broadband-service providers.
description
Marketing Mix
Transcript of Marketing Mix
DOI: 10.2501/JAR-52-4-433-449 December 2012 JOURNAL OF ADVERTISING RESEARCH 433
INTRoDuCTIoNSocial media are a game-changing technology with
a major impact on business.
Early adopters who integrated social media
into their strategy and operations are well placed
to capture new opportunities. Based on a sur-
vey of more than 3,000 senior executives across
industries, geographies, and functions, a recent
McKinsey report indicated that companies quali-
fied as “networked” (those that used collabora-
tive Web 2.0 technologies intensively to connect
the internal efforts of employees and extend the
organization’s reach to customers, partners, and
suppliers) outperformed other companies in terms
of market share, profitability, and market leader-
ship (Bughin and Chui, 2010; Shearman, 2011).
The impact of social media has been widely
reported in the lay press, trade journals, and aca-
demic research. In fact, the growth of social-media
advertising spending in the United States will out-
pace search advertising by 34 percent to 15 percent
on a compound annual basis over the next 5 years
(Forrester, 2010). This “paid-for” use of social media
accounts for only a fraction of its real impact on
brand marketing. Potentially far more powerful—
though less well understood—is the accelerated
trend in unpaid-for so-called earned, unsolicited
communications originating with consumers that
are beginning to shape (and reshape) the successes
and failures of brands and companies.
Companies need to do more than just listen.
They need to engage in brand conversations. The
traditional notion of a “target customer” in the
brand-communication paradigm must be enriched
to take account of the fact that the consumer now
has a voice and wants to be heard. In this study, the
authors propose a methodology to measure and
quantify the impact of this “people power” on the
sales and profits of brands and companies.
Wikipedia describes “social media” as “Media
for social interaction, using highly accessible and
scalable publishing techniques. Social media use
Web-based technologies to turn communication
into interactive dialogues.”
Although this definition is informative, it
offers no practical help to companies wanting to
The Power of EvilThe Damage of Negative Social Media
Strongly outweigh Positive Contributions
MARCEL CoRSTJENSInsEADmarcel.corstjens@
insead.edu
ANDRIS uMBLIJSMckinseyandris_umblijs@
mckinsey.com
Media activities generated by consumers or communities that are neither paid for
nor induced by brand owners are claimed to have a potentially game-changing impact
on communication and brand building. In this study, the authors propose a rigorous
methodology to assess the impact of this type of social media activities on the actual
performance of brands in the market. The article begins by developing a four-step
process to condense the complex reality of micro-social-media events for a brand into a
manageable set of social media indicators (sMI). These sMI subsequently are used as a
subset of the drivers, together with more traditional marketing-mix elements—in a general
market-response model—to estimate their relative impact on brand performance in the
market. This methodology is illustrated with two real-world examples—one in the market
for flat-screen-television market and the other in the set of Internet broadband-service
providers.

434 JOURNAL OF ADVERTISING RESEARCH December 2012
THE POWER OF EvIL
capitalize in a meaningful and system-
atic way on the opportunities that social
media provide. Companies need to make
a distinction between three types of social
media activities:
• type 1: induced and encouraged—but
not paid for—by brand owners;
• type 2: produced by consumers for
brand owner at the brand owner’s
request; and
• type 3: generated by consumers or com-
munities that are neither paid for nor
induced by brand owners.
As example of the first type of social-
media activity, the “evolution” video is
used by Unilever to advertise the Dove
brand on YouTube. Unilever did not pay
for ad space and time; it initiated a dia-
logue between consumers about Dove and
what it stood for.
The second category often consists of
social media grounded in “user-generated
content” (UGC). Again, at Unliever, Dove
uses the UGC approach to generate a num-
ber of comments that are subsequently
shared in a variety of media, traditional,
and/or social. The production process is
different from traditional communication
approaches, but the advertisements that
result from UGC are shown in paid-for
media.
Type 3 social-media activities are unique
in that they are initiated, developed, and
produced by consumers rather than brand
owners. Examples stretch from consumer
feedback on a restaurant experience
through Twitter to comments on a publica-
tion on the Amazon Web site all the way to
a consumer-generated video on YouTube
accusing Unilever of destroying palm
forests in Indonesia to produce the palm
oil used in the production of its soap
brands.
This article focuses on this third group
of social-media activities and their impact
on brand performance. Types 1 and 2
already have been featured in the litera-
ture (Marchanda, Dube, Goh, and Chin-
tagunta, 2006; Robinson, Wysocka, and
Hand, 2007; Baye and Gatti, 2009; Shang
and Ghose, 2010; Pfeiffer and Zinnbauer,
2010; Campbell, Pitt, and Parent, 2011),
whereas type 3 can benefit from further
analyses and new approaches.
THE SoCIAL-MEDIA CoNTEXTNew and traditional media seem to be
worlds apart. When discussed together,
they tend to fuel controversy about their
respective roles and their potential syn-
ergies—a conflict illustrated by a clash
between Martin Sorrell, WPP ceo, and
Keith Weed, Unilever cmo (Marketing
Week, June 25, 2010).
Sorrell stated that research showed that
traditional media were still best for brand
building; Weed countered by insisting,
“Brands are being built when consumers
engage online.” Affirming that Unilever’s
objective was to double its growth while
reducing its environmental footprint, he
added:
Digitisation and globalisation feed off each
other creating exponential impact… The
more digital you are, the more global you
can become. The more global you are, the
more digital you can become. You have to
be ahead of your consumers in digital, you
cannot be at the same level as them.
A second issue surrounding the use of
social media in marketing is related to
measurement: How does one generate
meaningful measures that capture the full
qualitative and quantitative richness of
type 3 social-media activities for a particu-
lar brand and/or company?
The discussion begins with the rapid
rise of digital-communication channels
and the consequent split of marketing
analy tics into two camps:
“Traditionalists” analyze well-
established traditional marketing-mix
elements (shelf space, radio, print, tele-
vision advertising, price, promotions,
macroeconomic factors, and so on) using
well-developed methodologies, linking
these marketing activities to sales and
profitability.
“Digitalists,” whose roots are in technol-
ogy, focus on the measurement of many
very detailed parameters available in the
digital space in isolation of other market
mix elements.
Because of abundance of very detailed,
granular data, one trend in social-media
measurement (“listening”) has been to
provide a multitude of measures to cap-
ture activities in the social-media space
and provide estimates of their significance.
One can argue that television advertis-
ing also has a very complex structure and
can be measured at a very granular level.
Indeed, exposure frequency and reach of
different target audiences at individual
television advertising spot level regularly
is measured with good accuracy, and these
data are readably available. Actually, “tra-
ditionalists” use a more aggregated meas-
ure: Gross rating points (GRP) that capture
the market pressure of television advertis-
ing campaigns. The reason for using this
more aggregated measure is that more
granular levels of data do not always pro-
duce better analytical results (Kros, 2010).
The digital community currently oper-
ates almost independently from such
Early adopters who integrated social media
into their strategy and operations are well
placed to capture new opportunities.
December 2012 JOURNAL OF ADVERTISING RESEARCH 435
THE POWER OF EvIL
“traditionalists” and often considers itself
superior because its metrics can capture
the richness of social-media activities in
a more sophisticated, multi-dimensional
way not demonstrable with a simple GRP
television measure.
This multitude of measures, however,
makes it difficult to get an overall view of
the importance of social-media activities
over a specific period of time for a specific
brand. Many services track and measure a
wide array of such content indicators for a
range of social media (Figure 3).
Although each has its idiosyncrasies,
by and large these measurement systems
focus on
• the number of messages activated,
• the sentiment of each message, and
• the number of viewers weighted by
their respective importance.
The user of such data can drill down to a
microscopic level of a particular message,
in a particular medium, on a particular
day, aired by a particularly important per-
son (e.g., “Mrs Jones, an opinion leader”).
Although this level of detail is impressive,
marketers need a fuller perspective if such
information is to be actionable. The aggre-
gate view largely is missing in this set of
social-media metrics. It is like having an
elaborate dashboard with multiple gauges
but no mechanism to integrate all the bits
of information.
Yet another concern with existing
social-media research is the absence of
a methodology to link the intensity of
these activities with brand/company per-
formance. The viral YouTube Indonesian
palm-forest attack on Unilever could have
been considered a serious concern for
Unilever, but the basic question—“How
significant was its impact on Unilever and
the Dove brand?”—remained unanswered
absent a rigorous methodology for such
determination.
Given the recent emphasis on return
on marketing investments, establishing
a methodology to measure the return on
investment in social media—in particu-
lar for type 3 social-media activities—is
becoming a key managerial priority and is
one of the objectives of this article.
The current research makes a two-part
contribution:
• the development of a replicable meth-
odology enabling marketers to gener-
ate a manageable set of “Social-Media
Rating” (SMR) parameters that capture
the full richness of Type 3 social-media
activities, and
• the authors’ proposal that the inte-
gration of these parameters into a
marketing-response model and the
explicit estimation of the relative impact
of social-media activities on a brand/
company’s economic performance.
This is valuable not only because it allows
marketers to estimate social-media impact
on sales and profits but it improves the
validity of the estimation of the impact of
other (more traditional) elements of the
marketing mix on sales and profits.
Indeed, omitting SMR parameters from
marketing-mix models may distort the
results because a potentially major sales
driver has been overlooked.
In the next section, the authors explain
the proposed methodology to aggregate
a large variety of social-media measures
into a small set of parameters or SMR
indicators. The authors explain how these
indicators can be integrated into a rigor-
ous marketing-mix model and how their
impact can be estimated and compared to
the impact of such traditional marketing-
mix elements as price, promotions and
traditional media. The authors then illus-
trate the application of the methodology to
a major electronics brand.
METHoDoLoGYThe ultimate objective of the current study
was to determine the impact of social-
media activities on the variability of sales
over time (Figure 1).
The first stage was the construction of
a meaningful, manageable set of social-
media activity indicators (in the limit a
single indicator) that captured the large
quantity, variety, and richness of ongoing
social-media activities in the marketplace.
The value of these indicators over time
is then used in a marketing-mix response
model alongside other stimuli such as
television advertising, print, competitive
activities, coupons, promotions, macro-
economic factors, and the like to explain
the variability in sales of the focal brand/
company.
One can argue that television advertising
also has a very complex structure and can
be measured at a very granular level.
Yet another concern with existing social-media research
is the absence of a methodology to link the intensity
of these activities with brand/company performance.

436 JOURNAL OF ADVERTISING RESEARCH December 2012
THE POWER OF EvIL
The process of condensing the complex
world of micro-social-media events hap-
pens in four stages (Figure 2).
Stage I: DefineIn the “define” stage, management artic-
ulates the relevant categories for which
SMR ratings will be constructed.
There usually are four types of topics
covered by social media:
• Product Functionality and Quality
For example, the agency that managed
Samsung’s social-media strategy played
a critical role in creating a viral flow of
information about the so-called “grip”-
effect technical flaw in the first itera-
tion of the iPhone 4. (When the mobile
was handled in a certain way, the new
design antenna lost reception, and the
call was dropped.)
• Product and Ingredient Sourcing
Ethical sourcing grounds a variety of
social media discussions that range in
topic from child labor in poor countries,
to rainforest destruction, to impoverish-
ment of farmers, and so on.
• Service Quality
Consumer complaints about a variety
of customer-service issues such as long
waits on phone-response lines.
• Industry-Specific Concerns
Just as the arrival times and tarmac waits
are regular fodder for transportation-
related social media discussions, so do
any number of other industries foster
discussions specific to their practices.
The define stage is different for each social-
media project and driven by what man-
agement wants to understand about how
specific types of social-media messages
have an impact on sales. For example, to
explain what effect social media have on
sales of Brand A flat-screen television sets,
management identified four specific top-
ics of interest: pricing, technology, product
features, and brand image. Typically, these
topics need to be narrowed down fur-
ther by identifying a set of keywords and
phrases (topics) for each category:
• Price: high price, low price, overpriced,
value for money, promotion, rebate, and
so on;
• Technology: Plasma, LCD, LED, 3D,
and so on;
• Product Features: screen size, contrast
ratio, sound quality, ease of use, HDMI
ports, and so on; and
Time (weeks)
Social Media Rating (SMR) time series
Weighting/aggregation methodology
Market mix regression model
Weekly SMR (SM Negative)
SM Listening Results
Sales
Time (3 years)
Base
SM Positive
SM Negative
POS Advertising
TV Advertising
Competitive advertising
Promotional Price
MarketingStimuli
Regression
Figure 1 Illustrative Representation of Inclusion of social Media into a Marketing-Mix Regression Model Explaining sales by Market stimulus, Including social-Media Pressure
In the “define” stage,
management articulates
the relevant categories
for which SMR ratings
will be constructed.

December 2012 JOURNAL OF ADVERTISING RESEARCH 437
THE POWER OF EvIL
• Brand Image: Brand A, Brand B (com-
petition), trust, consistent quality, reli-
able service, and so on.
Stage II: ListeningIn the “listening” stage of the methodol-
ogy, data are collected on the quantity and
the quality of social-media events per-
taining to the specific topics identified in
Stage I. There are many social-media lis-
tening service providers in the market-
place (See Figure 3; Rappaport, 2010).
Listening services provide rich infor-
mation regarding each individual social-
media event—Tweet, Facebook entry,
product-rating entry, and the like. For the
construction of SMR time series indicators,
the following information provided by
social-media listening service providers is
particularly relevant:
• filtering all individual social-media
events (Tweets, Facebook entries, and so
on) containing selected topics;
• estimating the sentiment of each of the
filtered events into one of the following
three groups: positive, negative, and
neutral;
• providing information about the origi-
nator of each social-media event:
– reach of each social-media event orig-
inator—number of friends on Face-
book, number of followers on Twitter,
and the like; and
– information regarding status of
the author in the social-media
Sub-Category 2
Category
Sub-Category n
Sub-Category 1
Topic 1
(+)Sentiment
(1)Sentiment
(–)SentimentTopic …
Topic n
Keywords/Phrase
Keywords/Phrase
Keywords/Phrase
Topic’s unique
followers
Topicrelevance
KOL
Followers
Keywords/Phrase
Keywords/Phrase
Define Listen Weight Aggregate
Figure 2 Methodology for the conversion of Large numbers of Individual social-Media Events into social-Media Rating (sMR) Indicators
Figure 3 some of the companies Providing social-Media Listening services

438 JOURNAL OF ADVERTISING RESEARCH December 2012
THE POWER OF EvIL
community—key opinion leaders
(KOL), and so on.
• providing information on the size of
the chain reaction of each social-media
event (topic), with analysis including:
– number of topic’s unique followers;
– total number of secondary, third,
fourth, and so on degree events; and
– further chain-reaction communica-
tions on the particular topic initiated
by the original author.
• providing information on the relevance
of the topics. To that end, most social-
media listening-service providers
deploy linguistic-analysis algorithms
to determine the relevance of each com-
munication to the original topic of the
communication.
Stage III: EvaluationIn the third phase of the current program,
the “listening” points are integrated for
each social-media event by weighing the
event according to the level of the compo-
nents described above.
The communication pressure of each
event in the marketplace is determined by
the size of audience reached—weighted by
• the “importance” (or KOL status) of
people originating the event;
• the size of the chain reaction the event
creates; and
• the relevance of the specific communica-
tion topic.
More specifically, the weighting procedure
is performed as follows (each original
communication has a starting value of 1):
• apply weight to this starting value
depending on the KOL status of the com-
munication originator;
TABLE 1Illustrative Example of the Weighting Procedure (Messages in the Table are for Demonstration Purposes)
Message Category Sentiment
Stage of weighting
Total score
A B C D E
Message count
KoL weight Reach
Chain reaction
Topic relevance
Brand A is the leader in LED technology and their LED Tvs are best on the market. I bought a 42 inch one and it has the best picture I have seen.
Technology Positive 1 2 3 2 3 36
I bought Brand A LED Tv. The black was really black on the screen—the contrast ratio is excellent. The Brand A are producing really good LED screens! And the Tv is so thin—excellent product!
Technology Positive 1 3 3 1 3 27
I spent hours to set up my new Tv. The Brand B really is not good in this sense and does not think about convenience of usage of their products—you need an engineering degree to set up their Tv!
Technology negative 1 1 1 2 2 4
My new Brand A Tv died 2 hours after plugged in! I will not buy Brand B Tvs any more. I sent it back and asked to exchange it for a different Tv.
Technology negative 1 1 3 1 3 9
Brand A Tvs are overpriced. Price negative 1 1 1 1 3 3
Brand A Tvs are worth every penny I paid for—good price for this quality product!
Price Positive 1 2 3 1 3 18
Brand c products are cheap, but you get what you pay for—I would not take one for free!
Price negative 1 3 3 3 3 81
With the manufacturer rebate Brand A Tvs are good value for money! The rebate offer lasts only one more month! Hurry!
Price Positive 1 2 2 1 3 12

December 2012 JOURNAL OF ADVERTISING RESEARCH 439
THE POWER OF EvIL
• apply additional weight depend-
ing on the reach of the originator of the
communication;
• apply additional weight depending on
the size of the chain reaction following the
original communication; and
• apply additional weight depending on
the relevance of the rated communication
topic to the original topic.
To keep the transformation process man-
ageable, the authors started the weighting
process by scoring each item at each step
in the process on a three-point scale (small,
medium, large). After each social-media
event was weighted according to the pro-
cedure articulated previously, it would
register a score between a minimum value
of 1 (if factors 2–5 in the preceding list had
the “small” weight of 1) and a maximum
value for a single event (Tweet, Facebook
entry, etc.) of 81 (the maximum weight of 3
to the power of 4—having four weighting
factors in the system).
Step IV: AggregationIn the final stage, the information gath-
ered in the first three phases is aggregated.
Weighted scores of all events are aggre-
gated into SMR indicators for
• each analysis topic (in our example,
price, technology, product features, and
brand image), and
• each sentiment (positive, neutral, and
negative).
The authors proposed 1 week as the unit
of time in the proposed procedure.
The preceding example—with four cat-
egories (topics) and three sentiments—
would produce 12 individual weekly SMR
time-series variables. Depending on the
purpose of the analysis and the number of
weekly data observations (i.e., degrees of
freedom), the number of category and sen-
timent variables can be further reduced. In
the most extreme case, phase 4 may result
in a single SMR indicator using a priori
weights for each of the categories and for
each of the sentiment dimensions, where
these weights can be determined together
with management.
Preparation of SMA-data time-series
using this methodology involved a
relatively large data processing effort.
First, historic data (2 to 3 years) on social-
media activities were required. Leading
social-media listening enterprises have
access to individual event-level social-
media databases covering at least a 2-year
history.
All this historic data should be pro-
cessed at the level of the individual event
(Tweet, Facebook entry, etc.) to assign
weights following the proposed method-
ology. This process can be automated, but
requires a significant set-up effort.
Subsequently, these variables are
entered into a market mix response model
to estimate the impact of these SMR on
sales.
Based on observed SMR time-series
trends and the sales responsiveness to the
specific SMR, companies have to decide
how to act upon the social-media pres-
sure. Practically and economically, it is not
possible to act indiscriminately upon
all raised SMR levels in all monitored
channels.
At this point, the ability to measure the
sales impact of SMR proposed in this arti-
cle comes into play. Depending on both
the SMR pressure level and the resulting
sales effect, a company may channel the
response into a variety of directions:
• Ignore: If the SMR pressure level and/
or the sales effects are small.
• Invigorate: If the SMR is positive and
has a positive sales effect. Invigoration
is performed by viral marketing—seed-
ing a company’s generated content into
networks and chat rooms or by commu-
nicating to opinion leaders on a given
positive topic, which conversations, in
turn, had caught imagination of people
on social-media networks.
• Re-invigorate: If a positive social-
media communication wave is losing its
momentum but still is very beneficial to
the company in terms of sales impact.
• Problem-Solve: If the negative senti-
ment SMR pressure is relatively large or
if it is rapidly growing even if it started
at a relatively small point. In this case,
the ability to measure the sales effect
(using the method proposed in this
study) is very important.
Reaction to the negative SMR could be
chosen with very different implications to
the cost and effort this action requires.
For example, if the negative social-media
pressure regarding Unilever personal-care
brands that use palm oil as an ingredient,
and the social-media campaign is about
rainforest destruction by large corpora-
tions, the reaction would depend on the
sales impact of this particular SMR.
If the sales impact is not large, the com-
pany could choose to react by communi-
cation and explanation of the situation
through proactive direct or viral social-
media communications or by dedicated
advertising activities. If the sales impact is
large, however, the company could choose
to change the entire ingredient-sourcing
strategy, which has much larger cost and
effort implications. The ability to meas-
ure sales impact of user generated social-
medial, therefore, is of vital importance to
companies.
APPLICATIoN 1: FLAT SCREEN TELEVISIoNSTo illustrate the methodology used to esti-
mate the impact of type 3 social-media
activities on brand sales, the authors report
on the products of a global manufacturer
of electronic consumer goods—flat-screen
televisions—with prominent market

440 JOURNAL OF ADVERTISING RESEARCH December 2012
THE POWER OF EvIL
exposure in a major European country, to
illustrate the methodology used to esti-
mate the impact of type 3 social-media
activities on brand sales.
The criterion variable in the model is
unit retail sales of the brand of flat-screen
televisions. Explanatory variables cover
the full spectrum of the manufacturer’s
marketing investments, product pricing,
and factors capturing the macroeconomic
situation at the time and seasonality. To
these traditional explanatory variables, the
authors add type 3 SMR variables derived
according to the methodology described
earlier.
Manufacturer’s marketing investments
include the following major channels:
• retail investment,
• television,
• Internet,
• print,
• radio, and
• outdoor.
The consumer confidence index is the key
macroeconomic variable that has a signifi-
cant impact on brand unit sales.
Within the category, the largest effect
captured in the seasonality variable is the
sales increase from late November to the
first week of January, capturing the typical
increase in television sales over the Christ-
mas/New Year holiday season.
The type 3 social-media impact is rep-
resented by three separate independent
SMR variables:
• SMR with positive sentiment,
• SMR with neutral sentiment, and
• SMR with negative sentiment.
A multivariate time-series analysis was
performed to estimate the relationship
between the unit brand sales and explana-
tory variables (as described earlier): mar-
keting activities, social-media activities,
macroeconomic factors, and seasonality
(Table 2).
The marketing investments variables
are measured as follows (See Table 2):
• Retail: Weekly euro investment in retail
advertising, mostly circulars (Source:
company internal financial records);
• Internet: Weekly euro investment in
Internet advertising—more precisely,
Internet display advertising plus invest-
ment in paid search (Source: media
agency);
• Print: Weekly euro investment in print
advertising, specifically magazines and
newspapers (Source: media agency);
• Television: Weekly euro investment in
television advertising (Source: media
agency);
• Radio: Weekly euro investment in radio
advertising (Source: media agency);
• Outdoor: Weekly euro investment in
outdoor advertising, including bill-
boards, posters, etc. (Source: media
agency); and
• Price: Average product (flat-screen tel-
evision set) unit price paid by the con-
sumer in Euros. (Source: retail panel
data—information provided by third-
party supplier that produces these data
based on in-store sales scanning data,
including online sales.)
Generally, rising consumer confidence is
a precursor to higher consumer spending,
and consumer surveys produced a macro-
economic consumer confidence index
variable. For euro-zone countries, GfK
provided a consumer confidence index
that measured the level of confidence
among households in economic perfor-
mance in each country. The GfK consumer
confidence barometer is closely watched
by economists and politicians. The index
is produced monthly based on 2,000 con-
sumer surveys in each euro-zone country.
The model in the current study is
weekly, and the authors used the same
monthly consumer confidence index in
each week during each month.
TABLE 2Descriptive statistics of Model variables
Mean unitsMinimum units
Maximum units
Standard Deviation
sales Units 9,316 3,672 45,832 6,937
Retail 486,748 31,235 1,671,086 369,207
Internet 445,222 3,374 898,531 292,601
Print 157,902 0 1,397,164 350,366
Tv 411,208 0 2,933,487 662,219
Radio 41,941 0 455,241 115,273
Outdoor 12,724 0 450,266 66,113
Disposable Income 8,822 8,666 9,135 117
ccI 45 26 61 11
Price 739 600 854 52
Positive social Media 301 0 1,800 401
neutral social Media 91 0 984 146
negative social Media –68 –589 0 316

December 2012 JOURNAL OF ADVERTISING RESEARCH 441
THE POWER OF EvIL
Social-media variables (positive, neutral,
and negative) are type 3 SMR-calculated,
according to the methodology presented
in the previous section (See Table 2).
In all likelihood, the relatively high
correlations between positive and neu-
tral social media were caused by the fact
that social-media “chatter” often clusters
around the same events (new product
launch, big advertising campaign, etc.).
Some consumers give positive comments,
some neutral. The cause events of this
social-media chatter are frequently the
same and, therefore, result in higher cor-
relation between these variables.
Negative social-media comments usu-
ally trigger additional discussions in social
networks. This increases general chatter
on the subject. This phenomenon could
be one explanation for the high correla-
tion between negative and neutral social
media.
The analysis period in the current study
included the economic downturn from
late 2008 to 2009, during which consumer
confidence fell dramatically and retailers
tried to maintain sales levels with signifi-
cant price reductions—considerations that
help explain the observed high correlation
between the consumer confidence index
and price.
The authors are less certain as to why,
in this example, positive social-media had
a relatively high correlation with radio.
It could be just a coincidence—a com-
pany’s radio advertising campaign aired
during a period when increased positive
social-media activity took place. Such
correlations sometimes are observed dur-
ing advertising-supported new product
launches (Table 3).
The variables correlation matrix indi-
cated no major multicollinearity problems
for the estimation of the parameters of the
response function. A multivariate time-
series regression was used to estimate the
relationship between sales and independ-
ent variables (Equation 1; Corstjens et al.,
2011):
Sales market
marketing
t ti
i i
jj j
j j
= +
+
∑∑
β β
β λ ω
0
( ) (1)
where
• market: macroeconomic market vari-
able—consumer confidence index,
• marketing: product-marketing activity
and social-media rating (positive, nega-
tive, and neutral):
marketing marketingji
ii
j t ijλ λ= ∑ −( )
The macroeconomic market variable is
modeled as having a linear effect on sales
within the relevant range of the data obser-
vations. Usually, there is no major varia-
tion in values of macroeconomic variable
over the relevant time period (See Table 2).
The non-linear impact of marketing vari-
ables is captured by two distinct effects:
• dynamic effects (lambda), and
• diminishing returns to scale (omega).
Dynamic effects refer to the fact that many
marketing activities still influence sales
after the activity itself has been completed;
consumers remember the marketing activ-
ity and act upon it in their future purchase
decisions. This effect (lambda) is taken into
TABLE 3Model Independent variable correlation Matrix
CCI PriceNegative SM
Positive SM
Neutral SM Radio Print Retail outdoor Internet TV
ccI 1.00 0.77 –0.32 –0.44 –0.44 –0.32 –0.19 –0.19 0.21 0.56 0.24
Price 1.00 –0.17 –0.28 –0.29 –0.22 –0.22 0.03 0.11 0.31 0.13
negative_social_Media 1.00 0.49 0.89 0.38 0.00 0.03 –0.04 –0.27 –0.12
Positive_social_Media 1.00 0.51 0.57 0.19 0.10 –0.10 –0.16 –0.13
neutral_social_Media 1.00 0.31 –0.08 0.11 –0.02 –0.34 –0.23
Radio 1.00 0.35 0.22 –0.06 0.08 0.07
Print 1.00 0.51 –0.06 0.41 0.06
Retail 1.00 0.06 0.28 –0.19
Outdoor 1.00 0.09 –0.13
Internet 1.00 0.20
Tv 0.65
Note: The variables correlation matrix indicated no major multicollinearity problems for the estimation of the parameters of the response function.

442 JOURNAL OF ADVERTISING RESEARCH December 2012
THE POWER OF EvIL
account by the traditional Koyck transfor-
mation approach.
Sales typically respond non-linearly
to the intensity of marketing activity: too
much investment pushes sales into dimin-
ishing returns (omega).
The authors used a stochastic intercept
βt, which is estimated over time using the
State Space or the Dynamic Linear Model-
ling approach (Kalman, 1969; Sriram and
Kalwani, 2007). This estimation process of
the stochastic intercept βt extracts most out
of the available data by accounting for the
parameters that influenced sales that were
not explicitly included in the parameteri-
zation of the market response function.
The authors also tested for “halo” and
“cannibalisation” effects: whether adver-
tising of other products under the same
brand name influenced sales of the focal
product. In the case of the current study,
neither of these effects was statistically sig-
nificant in the model.
The estimation of Equation 1 requires
simultaneous estimation of multiple
parameters:
• parameters for dynamic effects,
• parameters for diminishing returns, and
• estimates for the stochastic intercept.
Given the limited number of observa-
tions, the authors used a combination of
simulation and estimation to calibrate the
response function. The estimation pro-
cedure systematically tested the entire
multi-dimensional surface of potential
transformation parameters with small
regular increments. Simultaneously, the
procedure then estimated the linear coeffi-
cient associated with each marketing vari-
able (beta) and the stochastic intercept βt
using the State Space technique. This com-
plex tailor-made estimation methodology
requires high computer processing power
and usually takes multiple hours.
The methodology in the current study
automatically and systematically elimi-
nated all potential solutions that did not
meet face validity: for example, marketing
drivers should have a positive relationship
with sales; price should have a negative
relationship with sales; and sales should
be non-zero when all marketing activities
are zero.
For those solutions that passed the face-
validity test, a battery of statistical tests
were used to select the best solutions.
These included tests for autocorrelation,
statistical significance of the estimated
parameters, and the overall goodness of fit
(Table 4) provides key statistical results of
the selected estimation of the model. (For
a more detailed explanation of the estima-
tion procedure, see Corstjens et al., 2011.)
The model results were satisfactory in
terms of lack of autocorrelation and heter-
oskadasticity, and all of the coefficients for
the explanatory variables had statistical
significance at reasonable significance
level.
Results of the model in terms of the per-
centage contribution of each explanatory
variable to the modeled unit product sales,
together with p-values of each explanatory
variable β coefficient estimate are shown
in Table 5.
Of 12 explanatory variables, 11 proved
to be statistically significant in the model.
TABLE 4key statistical Results of the selected Estimation of the current ModelR-square 93%
Adjusted R-square 90%
DW 1.85
normality p-value 0.06
Q-stat p-value 0.05
TABLE 5Model Results and statistics for Each variable
Lambda (%) omega
Contri-bution (000)
Contri-bution (%) p-value VIF Lag
Base 1,383 51.9 0.002 1.2
seasonality 84 3.2 <0.0001 1.4
Consumer Confidence Index 19 0.7 0.002 3.5
Price –49 –1.8 0.004 4.0
negative social Media 20 0.2 –184 –6.9 0.050 2.1 1
Positive social Media 20 0.8 186 7.0 0.018 1.4 0
neutral social Media 10 0.8 14 0.5 <0.0001 1.9 1
Radio 50 0.5 153 5.7 0.049 2.2 3
Print 0 0.8 184 6.9 0.001 2.7 1
Retail 0 0.8 307 11.5 0.045 2.1 0
Outdoor 0 0.2 71 2.7 0.016 1.1 0
Internet 20 0.8 311 11.6 0.050 2.0 1
Tv 60 0.8 188 7.0 0.016 2.3 1
Note: Results of the model in terms of the percentage contribution of each explanatory variable to the modeled unit product sales, together with p-values of each explanatory variable β coefficient estimate.

December 2012 JOURNAL OF ADVERTISING RESEARCH 443
THE POWER OF EvIL
(Disposable Income was not statistically
significant.) Analysis was a relatively
slow-moving variable and usually lagged
the weekly “action” in the marketplace.
During the economic downturn of
2008–2009, consumers became cautious
about making relatively large purchases
(such as flat-screen televisions) much
faster than the decline of their real dispos-
able incomes that showed up in statistics
would have suggested. The consumer
confidence index, therefore, picked up this
aspect of consumer behavior better than
the disposable income variable.
For established products, the base typi-
cally accounts for 80 percent to 90 per-
cent (or even more) of the variation in
volume. The situation usually is differ-
ent for new innovative products (in the
current study case, flat-screen televisions
with light emitting diodes technology that
were introduced just before the modeling
period). The new technology generated a
much better television picture, consumes
significantly less power, and is much flat-
ter and lighter than previous televisions.
In this study, the brand owner’s com-
munication of these features was a critical
part of the appeal of the new technology
by consumers. When consumers still did
not know anything about the new product,
both the purchase volume and the base
were zero. Once the brand owner started
to communicate benefits of the new prod-
uct, the sales started picking up—in fact,
most of the increase could be attributed
to being incremental-communications-
driven volume.
Only after some time was the base
established at levels close to more mature
products. Therefore, new-products mar-
keting (including the push in retail chan-
nels, which is part of the incremental in
the current example) generated a portion
of sales larger than for mature products.
New products usually also generate more
social-media chatter—one reason, in fact,
why the authors chose this product cat-
egory for this illustration. Also, the impact
of social media (not only company's)
advertising was included in the incremen-
tal sales performance, making the increase
look relatively large.
Social media were modeled as separate
effects from positive, negative, and neutral
sentiments. As shown by p-values statis-
tics, all three types of social-media vari-
ables were statistically significant in the
model (See Table 5).
Positive SMR incrementally generated
7.0 percent sales of the product, and the
confidence level of this estimate is very
strong. Neutral SMR showed 0.5 percent
incremental sales generated, with very
strong p-value. Negative SMR is shown
to be causing a –6.9 percent sales decline,
with statistically significant presence in
the model.
It is important to note that the relative
SMR pressures for positive, neutral, and
negative sentiments over the analysis
period were very different. The authors
observed 14.8 k positive, 4.5 k neutral and
only 3.3 k negative SMR pressures over the
period of analysis (Table 6).
At the same time, the respective impact
on sales of these three sentiments was +7.0
percent, +0.5 percent, and –6.9 percent,
respectively. Each thousand negative-
sentiment SMR generated 4.42 times more
negative sales impact than a thousand
positive-sentiment SMR. Neutral SMR
generated even less impact from each
SMR—only one-fourth of the level gener-
ated by the positive sentiment per unit of
SMR (Figure 4).
The authors also estimated the model
without social-media variables (Table 7).
TABLE 6sMR Market Pressures and Incremental sales per Unit of sMR Relative to the Positive sMR Impact
Positive SM Neutral SM Negative SM
Total social Media Ratings (sMR) 14,762 4,457 3,320
sales uplift generated (% of total sales) 7.0% 0.5% –6.9%
sales uplift per thousand sMR 0.47% 0.12% –2.08%
Relative uplift per sMR point (Positive = 1) 1.00 0.25 –4.42
Social Media Rating (SMR)
Time
PositiveNeutralNegative
Figure 4 sMR of All Three sentiments over Time

444 JOURNAL OF ADVERTISING RESEARCH December 2012
THE POWER OF EvIL
As the results demonstrate, with-
out social-media variables, the model’s
explanatory power was reduced. Most
notably, the p-value of television advertis-
ing increased from 0.016 if social-media
variables were included, to the 0.061 when
social-media variables are excluded from
the set of explanatory variables.
Without social-media variables, the
robustness of the model was reduced: the
absence of the significant sales stimuli
data regarding social media made the
model incomplete.
APPLICATIoN 2: BRoADBAND SERVICESTo further test the efficacy and impact
of social media, the authors considered
the performance of a broadband-services
provider in a major European country. To
examine the robustness of their model, the
authors used the same approach in this
application as they did in the flat-screen-
television application. The analysis in the
broadband services industry was based on
60 weekly observations.
The criterion variable in the model is
customer acquisitions (i.e., the number of
broadband service customers who sub-
scribe or renew the broadband services
provided by this particular company).
Explanatory variables cover the full
spectrum of the manufacturer’s marketing
investments—both “traditional” televi-
sion advertising and print advertising, and
“digital”—online displays and affiliates.
Explanatory variables also cover product
pricing, promotions, and seasonality.
To these traditional explanatory varia-
bles, the authors add type 3 SMR variables
derived according to the methodology
described in Methodology section, using
three separate independent variables:
SMR with positive sentiment, SMR with
neutral sentiment, and SMR with negative
sentiment
A multivariate time-series analysis,
similar to the one used in the flat-screen
television application, is performed to esti-
mate the relationship between customer
acquisitions and explanatory variables,
as described earlier: marketing activities,
social-media activities, pricing, promo-
tions, and seasonality.
Table 2 summarizes the descriptive sta-
tistics of the variables used in the model.
The dependent variable (customer acqui-
sitions) is the weekly number of customers
subscribing to the company’s broadband
product. Acquisition numbers also include
subscription renewals of customers who
previously had used this service. The mar-
keting investments variables are measured
as follows:
• Television: Weekly GRP in television
advertising (Source: media agency);
• Print: Weekly impressions in print
advertising: general content maga-
zines and computer magazines (Source:
media agency);
• Online Display: Weekly online display
advertising impressions (Source: digital
agency);
• Online Affiliates: Weekly online affili-
ates impressions. Affiliates is a “rented”
advertising space (banners, etc.) on
other companies’ Web sites; the adver-
tiser pays the Web site owner for each
click on the advertisement (Source: digi-
tal agency);
• Price: Average subscription price paid
by the consumer in euros (Source: com-
pany’s internal records); and
• Promotions: Weekly promotions:
reduced price subscription to the ser-
vice. In the current sample, the authors
had three separate weeks of such weekly
promotional events (Source: company’s
internal records).
Social-media variables (positive, neutral,
and negative) are type 3 SMR calculated
according to the methodology presented
in the previous section (Table 8).
The relatively high negative correla-
tion of –0.63 between online display and
online affiliates is caused by the fact
that these two activities have been
TABLE 7Model Results with social-Media variables Removed
TypeLambda (%) omega Lag
Contri-bution (000)
Contri-bution (%) p-value VIF
Base 1,632 51.7 0.000 1.3
seasonality 83 2.6 <0.0001 1.4
Consumer Confidence Index 38 1.2 0.000 3.5
Price –45 –1.4 0.001 2.5
Radio 50 0.5 3 118 3.7 0.050 2.3
Print 0 0.8 1 168 5.3 0.005 2.3
Retail 0 0.8 0 274 8.7 0.030 1.9
Outdoor 0 0.2 0 65 2.0 0.050 1.1
Internet 20 0.8 1 403 12.8 0.020 1.7
Tv 70 0.6 1 422 13.4 0.023 3.5
Note: R-square 85%; Adjusted R-square 83%; DW 1.63; Normality p-value 0.01; Q-stat p-value 0.05

December 2012 JOURNAL OF ADVERTISING RESEARCH 445
THE POWER OF EvIL
planned interchangeably with each other.
Display and affiliates by nature are very
similar online activities and, when one
type by the marketing planners is used,
the other is not, and vice versa. No other
major correlations surfaced between
the explanatory variables in the model
(Table 9).
The same type multivariate time-series
regression as in the flat-screen-television
application was used to estimate the rela-
tionship between sales and independent
variables (Equation 1), and provide key
statistical results of the selected estimation
of the model (Table 10).
The model results were satisfactory in
terms of lack of autocorrelation and hetero-
skadasticity, and all of the coefficients
for the explanatory variables had statis-
tical significance at a reasonable signifi-
cance level.
Results of the model in terms of the per-
centage contribution of each explanatory
TABLE 8Descriptive statistics of Model variables; Broadband Application
Mean Minimum MaximumStandard Deviation
Acquisitions 12,904 9,867 24,017 2,465
Tv 85 0 263 68
Print 3.88 0 18.01 3.88
Display 96.9 0 436.1 107.9
Affiliates 8.53 0 38.54 10.86
Price 18.44 15.99 23.41 1.97
Promotions 0.02 0 1.00 0.13
Positive social Media 299 120 520 107
neutral social Media 818 160 2,035 472
negative social Media –1,097 –280 –1,720 –287
Note: Social-media variables (positive, neutral, and negative) are Type 3 SMR calculated according to the methodology presented in the previous section.
TABLE 9The variables correlation Matrix, Indicating no Major Multicollinearity Problems for the Estimation of the Parameters of the Response Function
Acquisitions TV Print Display Affiliates Price Promotions
Positive Social Media
Neutral Social Media
Negative Social Media
Acquisitions 1.00 0.43 0.29 0.27 0.48 –0.18 0.19 –0.28 0.26 –0.14
Tv 1.00 –0.24 –0.20 0.36 –0.06 –0.10 –0.19 0.10 –0.04
Print 1.00 0.03 –0.06 0.10 0.05 0.19 0.11 –0.18
Display 1.00 –0.63 –0.32 0.05 0.10 0.33 –0.37
Affiliates 1.00 0.55 –0.08 –0.34 0.22 –0.11
Price 1.00 –0.02 –0.14 0.15 –0.11
Promotions 1.00 0.08 0.12 –0.15
Positive social Media 1.00 0.26 0.01
neutral social Media 1.00 –0.01
negative social Media 1.00
Note: The variables correlation matrix, indicating no major multicollinearity problems for the estimation of the parameters of the response function.
TABLE 10key Model statistics: Broadband ApplicationR-square 93%
Adjusted R-square 90%
DW 2.01
normality p-value 0.05
Q-stat p-value 0.05
446 JOURNAL OF ADVERTISING RESEARCH December 2012
THE POWER OF EvIL
variable to the modeled unit product sales,
together with p-values of each explanatory
variable β coefficient estimate, are shown
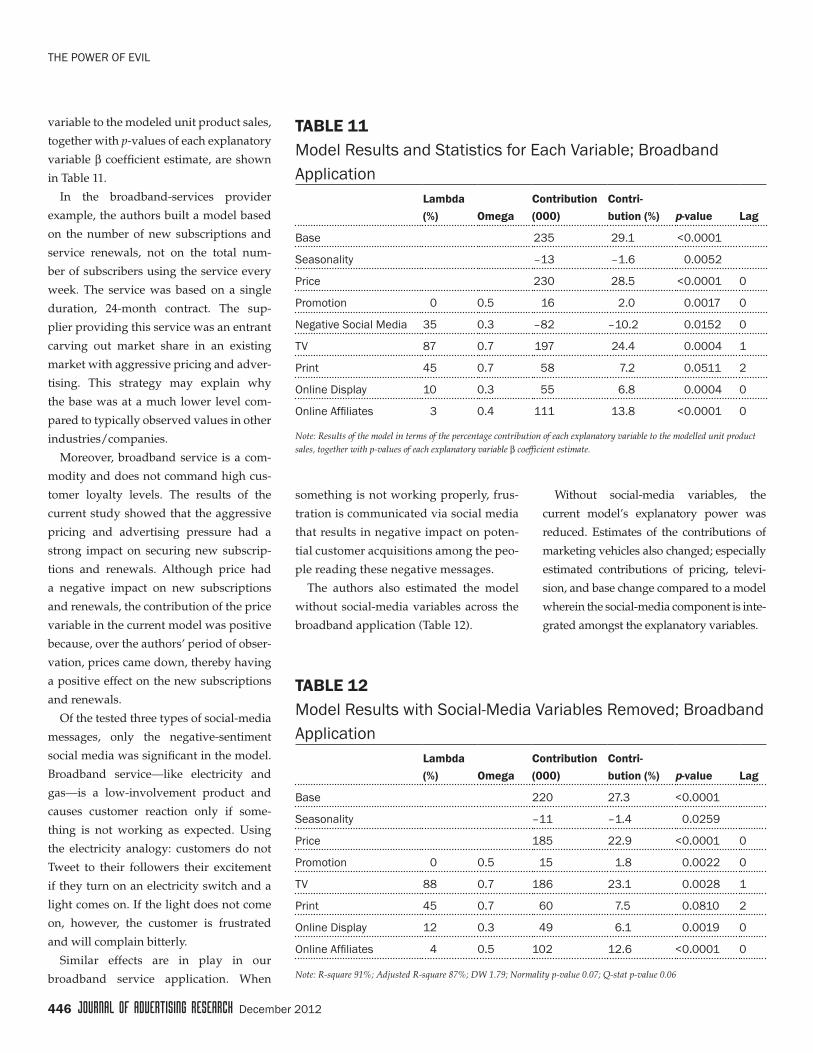
in Table 11.
In the broadband-services provider
example, the authors built a model based
on the number of new subscriptions and
service renewals, not on the total num-
ber of subscribers using the service every
week. The service was based on a single
duration, 24-month contract. The sup-
plier providing this service was an entrant
carving out market share in an existing
market with aggressive pricing and adver-
tising. This strategy may explain why
the base was at a much lower level com-
pared to typically observed values in other
industries/companies.
Moreover, broadband service is a com-
modity and does not command high cus-
tomer loyalty levels. The results of the
current study showed that the aggressive
pricing and advertising pressure had a
strong impact on securing new subscrip-
tions and renewals. Although price had
a negative impact on new subscriptions
and renewals, the contribution of the price
variable in the current model was positive
because, over the authors’ period of obser-
vation, prices came down, thereby having
a positive effect on the new subscriptions
and renewals.
Of the tested three types of social-media
messages, only the negative-sentiment
social media was significant in the model.
Broadband service—like electricity and
gas—is a low-involvement product and
causes customer reaction only if some-
thing is not working as expected. Using
the electricity analogy: customers do not
Tweet to their followers their excitement
if they turn on an electricity switch and a
light comes on. If the light does not come
on, however, the customer is frustrated
and will complain bitterly.
Similar effects are in play in our
broadband service application. When
something is not working properly, frus-
tration is communicated via social media
that results in negative impact on poten-
tial customer acquisitions among the peo-
ple reading these negative messages.
The authors also estimated the model
without social-media variables across the
broadband application (Table 12).
Without social-media variables, the
current model’s explanatory power was
reduced. Estimates of the contributions of
marketing vehicles also changed; especially
estimated contributions of pricing, televi-
sion, and base change compared to a model
wherein the social-media component is inte-
grated amongst the explanatory variables.
TABLE 11Model Results and statistics for Each variable; Broadband Application
Lambda (%) omega
Contri bution (000)
Contri-bution (%) p-value Lag
Base 235 29.1 <0.0001
seasonality –13 –1.6 0.0052
Price 230 28.5 <0.0001 0
Promotion 0 0.5 16 2.0 0.0017 0
negative social Media 35 0.3 –82 –10.2 0.0152 0
Tv 87 0.7 197 24.4 0.0004 1
Print 45 0.7 58 7.2 0.0511 2
Online Display 10 0.3 55 6.8 0.0004 0
Online Affiliates 3 0.4 111 13.8 <0.0001 0
Note: Results of the model in terms of the percentage contribution of each explanatory variable to the modelled unit product sales, together with p-values of each explanatory variable β coefficient estimate.
TABLE 12Model Results with social-Media variables Removed; Broadband Application
Lambda (%) omega
Contribution (000)
Contri-bution (%) p-value Lag
Base 220 27.3 <0.0001
seasonality –11 –1.4 0.0259
Price 185 22.9 <0.0001 0
Promotion 0 0.5 15 1.8 0.0022 0
Tv 88 0.7 186 23.1 0.0028 1
Print 45 0.7 60 7.5 0.0810 2
Online Display 12 0.3 49 6.1 0.0019 0
Online Affiliates 4 0.5 102 12.6 <0.0001 0
Note: R-square 91%; Adjusted R-square 87%; DW 1.79; Normality p-value 0.07; Q-stat p-value 0.06

December 2012 JOURNAL OF ADVERTISING RESEARCH 447
THE POWER OF EvIL
From the results of the current study,
the authors observed that negative
social media seemed to reduce sub-
stantially (10 percent) the company’s
new-subscriptions and renewals rates.
Clearly, the services supplier needed
to address this issue. More specifically,
it needs to investigate what the nega-
tive social-media contributors complain
about. And, based on this assessment,
it needs to plan how to fix the problems
that generate this negative chatter and esti-
mate how much this adjustment will cost.
MANAGERIAL IMPLICATIoNSAs shown by two applications from
very different industries—flat-screen tel-
evisions and broadband services—type 3
social media have a distinct and measur-
able impact on brand sales.
Managing the negative social-media
sentiment is crucial for many industries.
Alternatively, positive social-media senti-
ments and threads—if boosted and rein-
vigorated—can have a significant positive
impact on sales and profits.
In summary, the current model enabled
the authors to distinguish three major
brand sales components:
• sales not directly driven by market
activities: these consist of base sales,
seasonality, consumer confidence, and
other exogenous factors depending on
the industry;
• paid-for media and marketing stimuli:
television, Internet, outdoor, retail,
radio, price, and other endogenous
factors depending on the industry;
and
• type 3 social media—positive, neutral,
and negative social media—have a sig-
nificant effect on brand sales.
The effect of social media on brand sales
depends on the type of product category and
the competitive landscape of the industry.
In the television application, the posi-
tive social-media sentiments contributed
incremental 7 percent to sales. At the
same time, negative social media caused
a –6.9-percent sales decrease. As expected,
neutral sentiment social media contrib-
uted a much smaller 0.5 percent to sales.
These three social-media types, how-
ever, had different levels of SMR pressure
in the marketplace. Per comparable unit
of SMR pressure, negative social media
caused 4.4 times more sales decline than
a unit of positive SMR. Neutral social
media, conversely, had only one-fourth of
the sales contribution (per unit of SMR)
delivered by a unit of positive SMR.
These results confirm previous findings
about the asymmetric impact of positive
and negative messages and the dominant
impact of negative messages (Reichelt,
2003; Ferguson, 2005; Park and Lee, 2009).
The relatively higher impact of negative-
sentiment social media also was observed
in the broadband-services application,
showing a major detrimental effect of 10
percent to new subscriptions and renew-
als. In this case, positive and neutral social
media did not have a detectable effect on
business outcomes.
In the authors’ examples, the type 3
social-media effects had lesser effect on
brand sales than the exogenous factors or
the paid-for marketing activities. With-
out a doubt, the impact of social media
will grow as more and more customers
spend more and more time in social-media
environments.
Neglecting the type 3 social-media
impact on brand sales is already a major
shortcoming, and the problem of such
neglect will grow in future.
Social media have given customers a
voice. These customers are no longer just
“targets”—a concept that still prevails
among marketing practitioners—for com-
panies to talk down to. Successful compa-
nies are changing their one-way targeting
approach to two-way communications.
In an era when an unhappy society can
use social media to topple a government,
brand owners should be ready for the
social media–induced paradigm shift in
marketing.
When building a social-media cap-
ability, the first step for a company is to
understand what impact social media
have had on product/brand sales so that
company managers know where out-
bound social-media activities should be
concentrated.
It is no easy task to build an outbound
social-media capability. In traditional
one-way customer communication, a
30-second advertisement is produced
in a multi-month cycle by teams of
creative people working on the con-
tent, with multiple approvals required at
different stages. With social media,
companies need large teams of skilled
people to get involved on a daily basis
in a vast volume of customer communi-
cations. There is no time for crafting and
refining the message or for multi-layer
approvals.
A company’s ability to measure the
impact of social media on sales, therefore,
will become vital for marshalling scarce
and expensive social-media management
The effect of social media on brand sales
depends on the type of product category and
the competitive landscape of the industry.

448 JOURNAL OF ADVERTISING RESEARCH December 2012
THE POWER OF EvIL
resources to the right products and con-
versation topics.
A word of caution: as with any new
approach, the early user has to be sensi-
tive to a number of potential limitations in
using the proposed methodology to iden-
tify the sales effect of social media. In the
current study:
• If the sales effect does not exist, it can-
not be measured. Intuitively, it would
seem that, for low-involvement prod-
uct category brands such as detergents,
household products, some commodity
food categories, and the like, there is not
enough consumer emotional involve-
ment to generate significant chatter in
social media to distinguish a detectable
effect on sales.
The authors’ examination of social
media’s impact on a broadband-services
application, however, showed that even
in some low-involvement product cat-
egories, the impact of social media—
especially negative messages—should
be analyzed carefully.
• Few existing social-media listening
engines have appropriate linguistic
algorithms to divide social-media mes-
sages correctly into positive, neutral,
and negative. The large number of mes-
sages that need to be classified means
that manual filtering can be time con-
suming and expensive.
Automatic message filtering by senti-
ment is a relatively complex area. Ran-
dom checks of social-media messages
filtered as negative by automated filtering
methods sometimes reveal that there
could be a word in the message with a
negative connotation, but this negativ-
ity is not directed toward the brand, and
the message is wrongly classified as a
negative sentiment. Therefore, state-of-
the-art linguistic algorithms should
be used to minimize such wrong
classifications.
Linguistic filtering problems could be
caused by names with identical spelling
but different meaning. For example, the
authors’ attempt to filter social-media
messages regarding the credit-card com-
pany Visa ran into difficulties because
“visa” also means a document to allow
entry into a foreign country.
• There is also a challenge to assess accu-
rately the reach of each message in
social media.
Social-media listening engines know how
many friends on Facebook or how many
followers on Twitter each originator of a
message has. Not all friends and follow-
ers, however, read all messages. This dif-
ficulty is overcome by simultaneously
assessing what percentage of friends or
followers actually reads the message.
This assessment is performed by using
online panel data in parallel with social-
media listening. One should check on the
online panel which percentage of friends
and/or followers is assessing the URL
where the message is published. This
percentage from a representative sample
of the entire population can be used to
estimate the actual reach of social-media
communications.
Leading companies are setting up dedi-
cated capabilities to monitor and actively
manage social-media conversations. To
be effective means understanding which
social-media activities to respond to from
the multi-million activities out there, and
developing triage capabilities to deter-
mine the relevant response: ignore; stop;
perform damage limitation; boost; reinvig-
orate; and so on.
The social-media impact-measurement
method described in this study is able to
account for the sales impact of different
social-media categories and topics such
as pricing, product quality, service levels,
ethical sourcing, etc. By better understand-
ing the sales impact of each social-media
category/topic, companies will be able to
direct social-media management resources
toward those with the greatest impact on
sales and profits.
This ability also is vital for the measure-
ment of the impact of a company’s out-
going social-media messages to enable
continuous improvement of its social-
media management capability.
maRceL coRstJens is the Unilever Professor of Marketing
at InsEAD. His research focuses on economics and
marketing science modeling approaches in the areas of
communication, distribution channels, and retailing.
andRis umbLiJs is senior expert at Mckinsey. Before that,
he was at Accenture, where he led development of
marketing analytics offerings and managed key client
projects in fact-based marketing-decision support across
multiple industries.
When building a social-media capability, the first
step for a company is to understand what impact
social media have had on product/brand sales so
that company managers know where outbound
social-media activities should be concentrated.

December 2012 JOURNAL OF ADVERTISING RESEARCH 449
THE POWER OF EvIL
REFEREncEs
Baye, m., and J. gatti. “Clicks, Discontin-
uities, and Firm Demand Online.” Journal of
Economics & Management Strategy 18, 4 (2009):
935–975.
Bughin, J., and m. chui. “The Rise of the Net-
worked Enterprise: Web 2.0 Finds Its Payday.”
McKinsey Quarterly, December, 2010.
camPBell, c., l. Pitt, and m. Parent. “Track-
ing Back-Talk in Consumer-Generated Adver-
tising: An Analysis of Two Interpretative
Approaches.” Journal of Advertising Research 51,
1 (2011): 224–238.
corStJenS, m., a. umBliJS, and c. Wang.
“The Power of Inertia.” Journal of Advertising
Research 51, July (2011): 356–372.
FerguSon, B. “Black Buzz and Red Ink.”
In Connected Marketing: The Viral, Buzz and
Word of Mouth Revolution, J. Kirby and P. Mars-
den, P., eds. London: Butterworth-Heinemann,
2005.
ForreSter. 2010. “US Interactive Marketing
Forecast 2009–2014.” Forrester Research, January,
2010.
Kalman, r. “A New Approach to Linear Fil-
tering and Prediction Problems, Transactions
of the ASME.” Journal of Basic Engineering 82,
Series D (1969): 35–45.
KroS, J., and c. Keller. “Seasonal Regression
Forecasting.” Advances in Business and Manage-
ment Forecasting 7 (2010): 71–96.
machanda, P., J. duBe, y. goh, and P. chin-
tagunta. “The Effect of Banner Advertising
on Internet Purchasing.” Journal of Marketing
Research 43, February (2006): 98–108.
ParK, l., and m. lee. “Information Direction,
Web site Reputation and eWOM Effect: A Mod-
erating Role of Product Type.” Journal of Busi-
ness Research 62, 1 (2009): 61–67.
PFeiFFer, m., and m. zinnBauer. “Can Old
Media Enhance New Media?” Journal of Adver-
tising Research 50, March (2010): 42–49.
raPPaPort, S. “Listening Solutions: A Market-
er’s Guide to Software and Services.” Journal of
Advertising Research 50, June (2010): 197–213.
reichheld, F. “The One Number You Need
to Grow.” Harvard Business Review, December
(2003): 1–11.
roBinSon, h., a. WySocKa, and c. hand.
“Internet Advertising Effectiveness.” Interna-
tional Journal of Advertising 24, 4 (2007): 527–541.
Shang, y., and a. ghoSe. “Analyzing the
Relationship Between Organic and Sponsored
Search Advertising: Positive, Negative, or
Zero Interdependence?” Marketing Science 29, 4
(2010): 602–623.
Shearman, S. “Proving Social Media’s ROI.”
Marketing Magazine, January (2011).
Sriram, S., and m. KalWani. “Optimal Adver-
tising and Promotion Budgets in Dynamic
Markets with Brand Equity as a Mediating Vari-
able.” Management Science 53, 1 (2007): 46–60.

Copyright of Journal of Advertising Research is the property of Warc LTD and its content may not be copied or
emailed to multiple sites or posted to a listserv without the copyright holder's express written permission.
However, users may print, download, or email articles for individual use.