Market Timing Using Market Internals - Nomura Group · PDF filemarket timing using market...
16
© Market Timing Using Market Internals ANY AUTHORS NAMED ON THIS REPORT ARE RESEARCH ANALYSTS UNLESS OTHERWISE INDICATED PLEASE SEE ANALYST(S) CERTIFICATION(S) ON PAGE 92 AND IMPORTANT DISCLOSURES BEGINNING ON PAGE 95 May 2010 Shanthi Nair [email protected] +44 20 7102 4518
Transcript of Market Timing Using Market Internals - Nomura Group · PDF filemarket timing using market...

©©
Market Timing Using Market Internals
ANY AUTHORS NAMED ON THIS REPORT ARE RESEARCH ANALYSTS UNLESS OTHERWISE INDICATED
PLEASE SEE ANALYST(S) CERTIFICATION(S) ON PAGE 92 AND IMPORTANT DISCLOSURES BEGINNING ON
PAGE 95
May 2010
Shanthi Nair
+44 20 7102 4518
Market Timing is a difficult task
Fewer independent bets or breadth
Need high level of skill to achieve a reasonable level of IR
Signals need to be intuitive and provide reasoning
A market timing signal based on market internals.
Information derived only from the market
1
Global Market Timing Indicator
Based on signals derived from market movements
We categorise the market’s internal characteristics along five broad dimensions:
Volume
Breadth
Volume Divergence
Trend
Risk Aversion
Provides an intuitive framework within which to analyse market movements
2

Global Market Timing Indicator
Component Signals - Volume
Market ‘internal’ that depends on supply and demand for securities
Volume generally used to determine the conviction of a move in stocks
Empirical findings support the relationship between positive volume and price change.
Behavioural reasons for formation and continuation of volume trends
Market movements stronger when supported by increasing volume in that direction.
3

Page 5
Global Volume Signal and FTSE World Index
100
150
200
250
300
350
400
450
Apr-01 Apr-02 Apr-03 Apr-04 Apr-05 Apr-06 Apr-07 Apr-08 Apr-09 Apr-10
-1.2
-1
-0.8
-0.6
-0.4
-0.2
0
0.2
0.4
0.6
0.8
1
1.2
Source: Nomura Strategy Research
Index
Global Net Volume
Signal (RHS)FTSE World Index (LHS)
Level
4

Global Market Timing Indicator
Component Signals - Breadth
Market breadth refers to the fraction of the overall market participating in an up or down move.
Indicative of sentiment
Positive market breadth implies that bullish sentiment controlling momentum
Two component indicators:
Price dispersion: Measures the spread of directional price movements.
Volume dispersion: Measures how widely dispersed directional volume movements are.
5

Page 7
Global Breadth Signal and FTSE World Index
100
150
200
250
300
350
400
450
500
Apr-01 Apr-02 Apr-03 Apr-04 Apr-05 Apr-06 Apr-07 Apr-08 Apr-09
-1.2
-0.8
-0.4
0.0
0.4
0.8
1.2
Source: Nomura Strategy Research
Index Global Breadth
Signal (RHS)FTSE World Index (LHS)
Level
6
Global Market Timing Indicator
Component Signals – Volume Divergence
The amount of volume in a market is generally seen as an indicator of liquidity.
Low volume could imply market movements in excess of normal relationships.
Some evidence that certain investors underreact to the information contained in order flow.
Volume-divergence signal measures extent to which returns have moved in excess of underlying
volume.
Liquidity is generally mean-reverting and this signal captures the possibility of reversion.
7

Page 9
Global Volume Divergence Signal and FTSE World Index
100
150
200
250
300
350
400
450
Apr-01 Apr-02 Apr-03 Apr-04 Apr-05 Apr-06 Apr-07 Apr-08 Apr-09 Apr-10
-1.0
-0.8
-0.6
-0.4
-0.2
0.0
0.2
0.4
0.6
0.8
1.0
Source: Nomura Strategy Research
Index
Global Vol.
Divergence Signal
(RHS)
FTSE World Index (LHS)Level
8
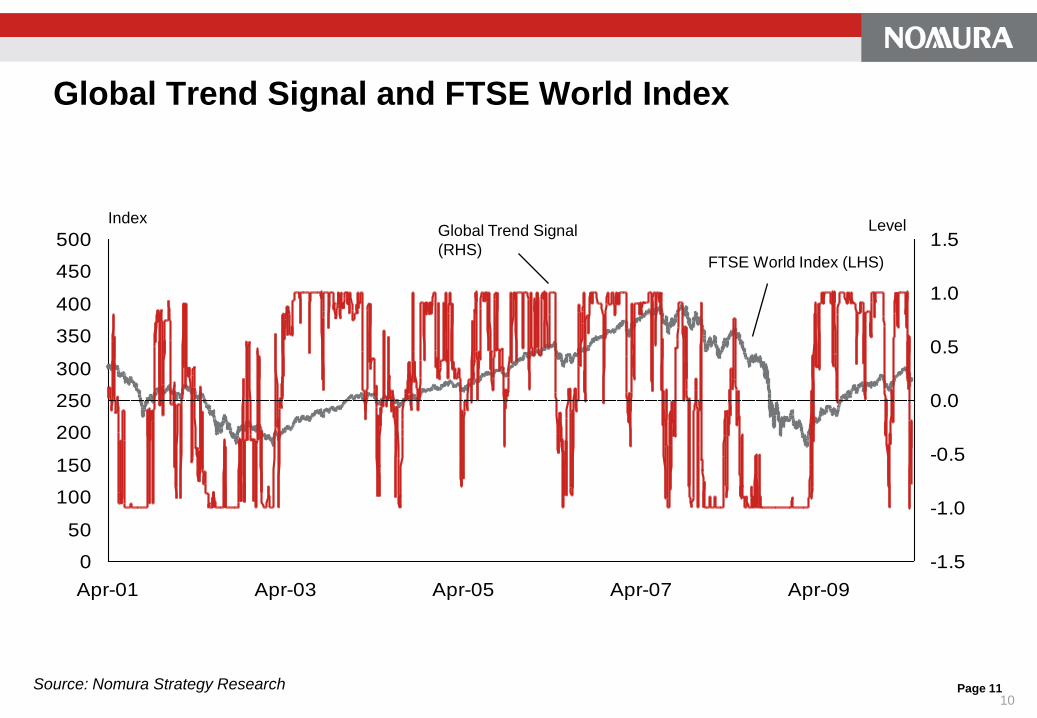
Global Market Timing Indicator
Component Signals – Trend
Several behavioural reasons why trend occur
‘Representativeness heuristic’: causes trend-chasing as people believe trends have systematic
causes.
Important to assess whether the market is following a trend.
Many trend strategies underperform due to the lags involved.
Adaptive moving average: more responsive and takes into account how noisy recent market
movements have been.
9
Page 11
Global Trend Signal and FTSE World Index
0
50
100
150
200
250
300
350
400
450
500
Apr-01 Apr-03 Apr-05 Apr-07 Apr-09
-1.5
-1.0
-0.5
0.0
0.5
1.0
1.5
Source: Nomura Strategy Research
IndexGlobal Trend Signal
(RHS)FTSE World Index (LHS)
Level
10

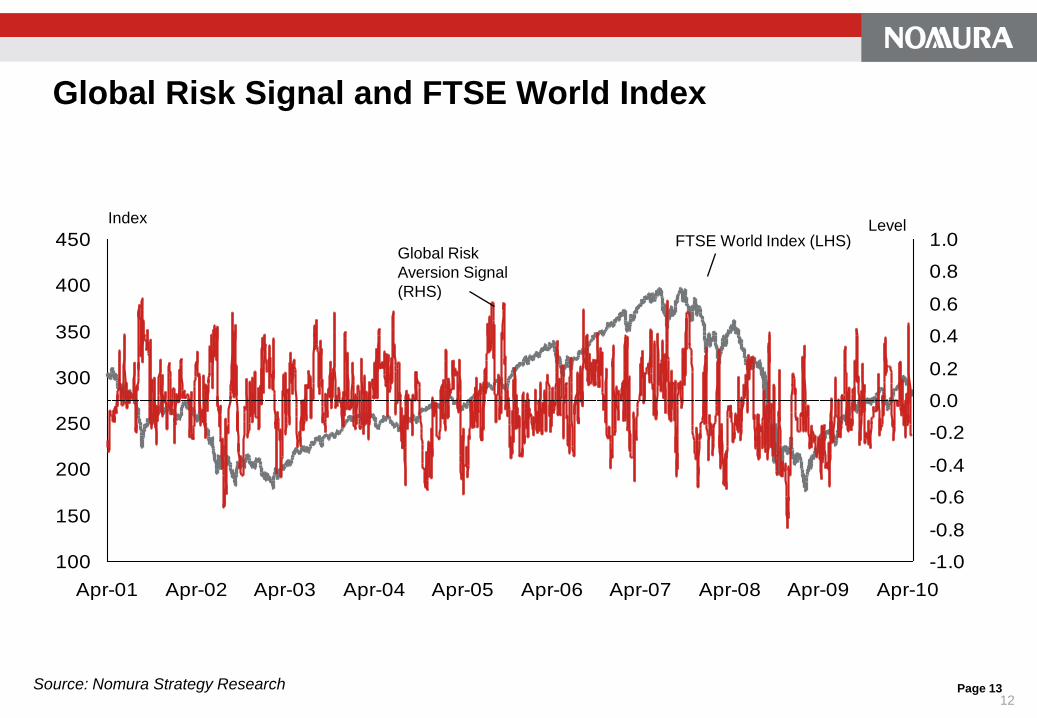
Global Market Timing Indicator
Component Signals – Risk
Risk is fundamental to all asset pricing models
High risk aversion indicates that market is generally close to a bottom
Three components:
Implied to realised volatility
Put-call ratio
Average idiosyncratic volatility
11
Page 13
Global Risk Signal and FTSE World Index
100
150
200
250
300
350
400
450
Apr-01 Apr-02 Apr-03 Apr-04 Apr-05 Apr-06 Apr-07 Apr-08 Apr-09 Apr-10
-1.0
-0.8
-0.6
-0.4
-0.2
0.0
0.2
0.4
0.6
0.8
1.0
Source: Nomura Strategy Research
Index
Global Risk
Aversion Signal
(RHS)
FTSE World Index (LHS)Level
12
Page 14
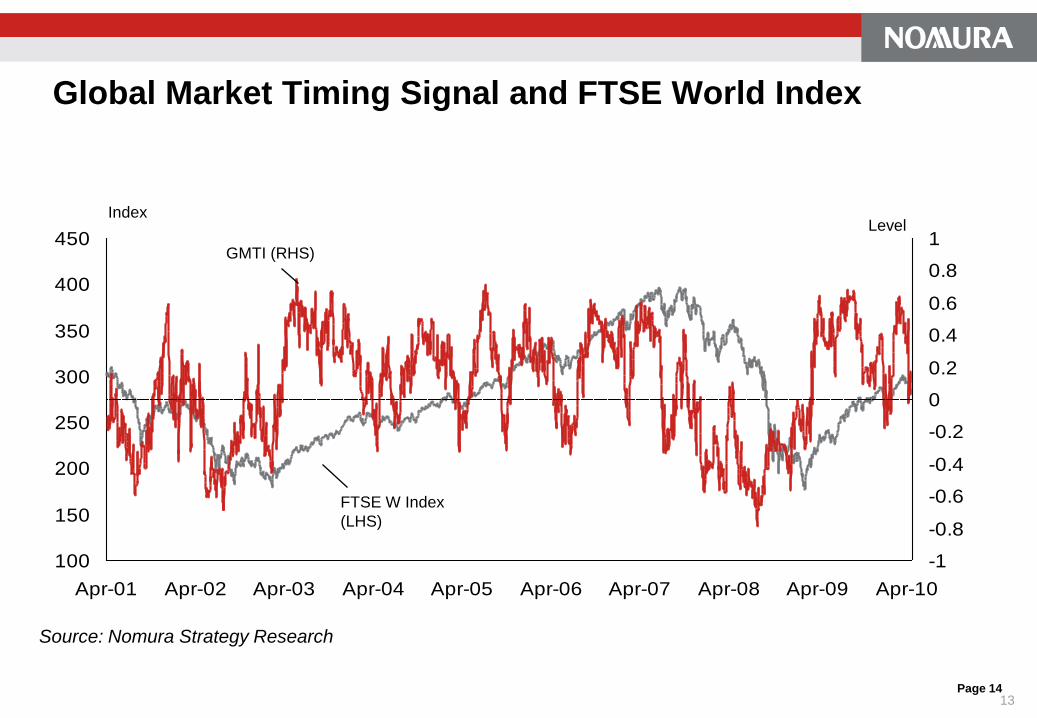
Global Market Timing Signal and FTSE World Index
100
150
200
250
300
350
400
450
Apr-01 Apr-02 Apr-03 Apr-04 Apr-05 Apr-06 Apr-07 Apr-08 Apr-09 Apr-10
-1
-0.8
-0.6
-0.4
-0.2
0
0.2
0.4
0.6
0.8
1
Source: Nomura Strategy Research
Index
GMTI (RHS)
FTSE W Index
(LHS)
Level
13
Page 15
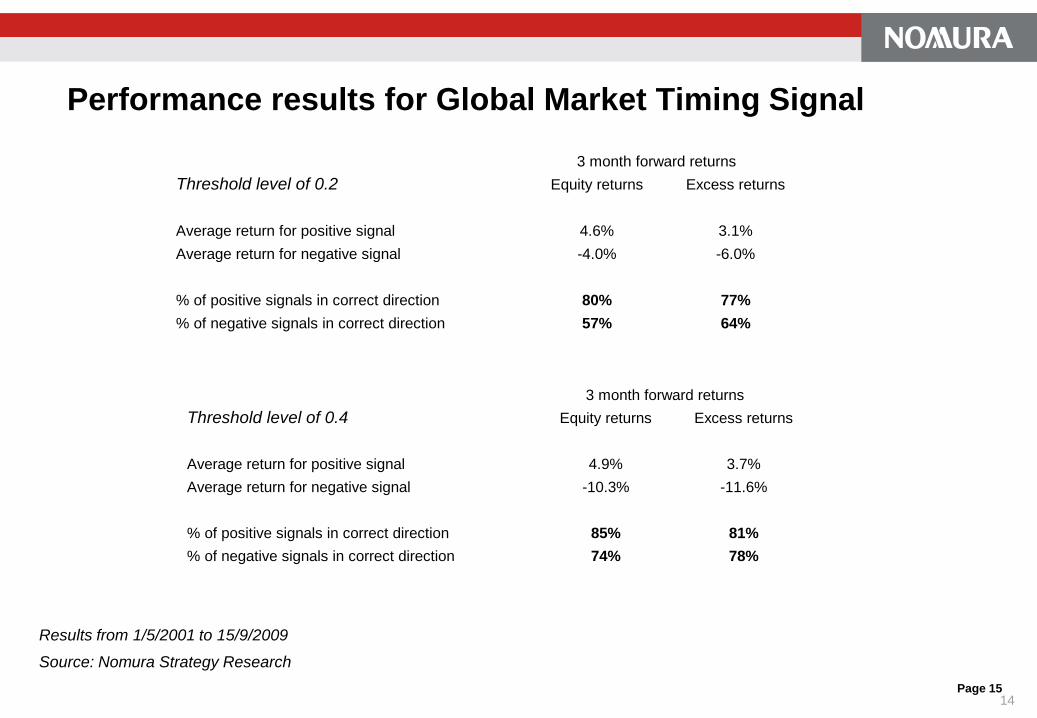
Performance results for Global Market Timing Signal
3 month forward returns
Threshold level of 0.2 Equity returns Excess returns
Average return for positive signal 4.6% 3.1%
Average return for negative signal -4.0% -6.0%
% of positive signals in correct direction 80% 77%
% of negative signals in correct direction 57% 64%
3 month forward returns
Threshold level of 0.4 Equity returns Excess returns
Average return for positive signal 4.9% 3.7%
Average return for negative signal -10.3% -11.6%
% of positive signals in correct direction 85% 81%
% of negative signals in correct direction 74% 78%
Results from 1/5/2001 to 15/9/2009
Source: Nomura Strategy Research
14

Performance of Global Market Timing Indicator – Long/ShortWeekly rebalancing
50
100
150
200
250
300
350
400
450
05/2001 05/2002 05/2003 05/2004 05/2005 05/2006 05/2007 05/2008 05/2009 05/2010
Chart shows the absolute performance of the strategy using the Global Market Timing Signal to go long/short equities (FTSE World Index, total
returns, $ terms) with the remaining proportion in Cash (6m LIBOR). The signal is smoothed over 10 days and the rebalancing is done on a
weekly basis. Performance is shown prior to transactions costs.
Source: Nomura Equity Strategy
May 2001=100
Market Timing
strategy
Signal level % Equities
< -0.4 -100%
>-0.4 and < -0.2 -50%
>-0.2 and < 0.2 0%
> 0.2 and < 0.4 50%
> 0.4 100%
Return Risk Return/Risk
Market Timing 16.1% 12.9% 1.25
15