Market Structure and Corporate Payout Policy: Evidence from a … · 2019-06-30 · constrained...
53
Market Structure and Corporate Payout Policy: Evidence from a Controlled Experiment * Xiongshi Li Guangxi University Mao Ye University of Illinois, Urbana-Champaign and NBER Miles Zheng University of Illinois, Urbana-Champaign March 14, 2019 In 2016, the Securities and Exchange Commission increased tick size for 1,200 randomly selected firms and imposed restrictions on dark-pool trading on 400 of them. We find that firms reduce share repurchases by 67% and reduce total payouts by 50% when they face constraints in both stock exchanges and dark pools. Surprisingly, firms with larger increases in depth reduce their payouts more because rule 10b-18 discourages issuers from using market orders, turning a market with great depth into an illiquid market for them. The conflicts between rule 10b-18 and the newly imposed trade-at rule also contribute to reductions in payouts. (JEL: G10, G18, G35) Keywords: tick size, dark pool, payout policy, regulation, market liquidity * We thank Heitor Almeida, Tarun Chordia, Jiekun Huang, Mathias Kronlund, Mark Leary, George Pennacchi, Joshua Pollet, Martin Schmalz, Ji Shen, Antoinette Schoar, Alexei Tchistyi, Scott Weisbenner, Yufeng Wu, Yuhai Xuan, Chen Yao, and participants at Case Western Reserve University, Emory University, George Washington University, Guanghua International Symposium on Finance, the University of British Columbia, and the University of Illinois for their helpful suggestions. Ye acknowledges support from National Science Foundation grant 1838183 and the Extreme Science and Engineering Discovery Environment (XSEDE). Send correspondence to Mao Ye, the University of Illinois at Urbana-Champaign, 340 Wohlers Hall, 1206 South 6th Street, Champaign, IL, 61820. E-mail: [email protected].
Transcript of Market Structure and Corporate Payout Policy: Evidence from a … · 2019-06-30 · constrained...

Market Structure and Corporate Payout Policy: Evidence
from a Controlled Experiment*
Xiongshi Li
Guangxi University
Mao Ye
University of Illinois, Urbana-Champaign and NBER
Miles Zheng
University of Illinois, Urbana-Champaign
March 14, 2019
In 2016, the Securities and Exchange Commission increased tick size for 1,200 randomly selected
firms and imposed restrictions on dark-pool trading on 400 of them. We find that firms reduce
share repurchases by 67% and reduce total payouts by 50% when they face constraints in both
stock exchanges and dark pools. Surprisingly, firms with larger increases in depth reduce their
payouts more because rule 10b-18 discourages issuers from using market orders, turning a market
with great depth into an illiquid market for them. The conflicts between rule 10b-18 and the newly
imposed trade-at rule also contribute to reductions in payouts. (JEL: G10, G18, G35)
Keywords: tick size, dark pool, payout policy, regulation, market liquidity
* We thank Heitor Almeida, Tarun Chordia, Jiekun Huang, Mathias Kronlund, Mark Leary, George Pennacchi, Joshua
Pollet, Martin Schmalz, Ji Shen, Antoinette Schoar, Alexei Tchistyi, Scott Weisbenner, Yufeng Wu, Yuhai Xuan,
Chen Yao, and participants at Case Western Reserve University, Emory University, George Washington University,
Guanghua International Symposium on Finance, the University of British Columbia, and the University of Illinois for
their helpful suggestions. Ye acknowledges support from National Science Foundation grant 1838183 and the Extreme
Science and Engineering Discovery Environment (XSEDE). Send correspondence to Mao Ye, the University of
Illinois at Urbana-Champaign, 340 Wohlers Hall, 1206 South 6th Street, Champaign, IL, 61820. E-mail:
1
Miller and Modigliani (1961) find that the level of payouts does not matter for firms and investors,
nor does it matter whether payouts are executed through dividends or share repurchases. One key
assumption driving these two irrelevances of payout policy is that firms can repurchase shares
without facing market microstructure frictions. In reality, firms pay transaction costs when
executing repurchases. In a fragmented market with more than 10 stock exchanges and 40 dark
pools, they need to decide where to repurchase shares. Finally, SEC Rule 10b-18 imposes
regulatory friction on when and how firms can repurchase shares. In this paper, we find that these
three market microstructure frictions (liquidity, market fragmentation, and regulations) have first-
order effects on both the level and structure of corporate payouts.
In October 2016, the U.S. Securities and Exchange Commission (SEC) included 2,399 stocks
in a tick size pilot study. The SEC randomly selected 1,200 of these stocks as test stocks and
increased their tick size (the minimum price increment) from 1 cent to 5 cents, whereas the tick
sizes of the remaining 1,199 control stocks remained at 1 cent. The SEC also randomly assigned
1, 200 test stocks to three test groups, and 400 stocks in test group 3 faced restrictions on dark pool
trading.
We find that tick-constrained firms in test group 3 reduced repurchase payouts by 67%
compared with similar stocks in the control group following the implementation of tick size pilot.
Tick-constrained firms have below-median quoted spreads before the Pilot was implemented, and
an increase in the tick size is more likely to widen the bid-ask spread and to reduce liquidity in the
stock exchange for these stocks than to unconstrained stocks. We find, however, that liquidity
increases in dark pools for stocks in test groups 1 and 2, and those stocks do not experience
statistically significant reductions in repurchase payouts. For stocks in test group 3, both stock-
exchange and dark-pool liquidity decreases, and firms dramatically reduce their share repurchases.
Our results indicate that 1) a reduction in liquidity reduces repurchase payouts, and 2) firms use
dark pools to repurchase shares.
Regulatory frictions affect share repurchases, because they can change the definition of liquidity
for distinct groups of market participants. For example, a market with great depth is generally

2
considered a more liquid market, particularly for large traders (Goldstein and Kavajecz (2000)).
Surprisingly, we find that, within tick-constrained firms, those with significant increases in depth
reduced share repurchases to a greater extent following the implementation of the Pilot. SEC rule
10b-18 can explain this surprising result. This rule states that an issuer must repurchase shares at
a price that does not exceed the highest independent bid or last transaction price. The purpose of
the rule is to discourage price manipulation, because firms may inflate their prices by aggressively
consuming liquidity at the offer side. SEC rule 10b-18 encourages firms to repurchase shares
through buy-limit orders, which wait on the bid side of the market to be executed. One (unintended)
consequence of this rule is that it changes the implications of “a liquid market” for issuers. A
market with great depth, especially on the bid side, can be an illiquid market for issuers in modern
markets. When the tick size is binding, execution priority in stock exchanges is determined by
speed competition at the same price (Yao and Ye (2018)). As firms and their brokers may not be
as fast as high-frequency traders (HFTs),1 limit orders to repurchase shares may fail to be executed.
We find that depth on the bid side harms issuers more than depth on the offer side, suggesting that
a combination of tick-size constraints and SEC rule 10b-18 should be one driver of this
counterintuitive result.
Alternative trading systems such as dark pools also help share repurchases, because one way to
avoid the long queue in stock exchanges is to send orders that match the national best bid and
offers (NBBOs) to dark pools (SEC (2018)). Combining the trade-at rule imposed on test group 3
with SEC rule 10b-18 essentially destroys this price-matching strategy. The trade-at rule prevents
the execution of orders in dark pools unless those orders substantially improve the NBBO.
Therefore, buy orders from issuers need to be executed at a price higher than national best bids
(NBBs) in dark pools. However, SEC rule 10b-18 discourages firms from buying shares above the
highest independent bid. The internal conflicts between these two regulations impose constraints
1 The SEC (2018, p. 18) reports: “sophisticated proprietary trading firms, who invest substantial sums in technology,
often are likelier to be first or among the first posting the best prices, resulting in their passive orders being filled more
often than those of ‘natural’ investors. Brokers representing institutional and individual investors, in such instances,
often wind up consuming liquidity provided by these prop-trading firms.”

3
on tick-constrained firms in test group 3. Indeed, we find that share repurchases in test groups 1
and 2, where firms face no restrictions on price-matching in dark pools, do not change, even for
firms with larger increases in depth.
We find that tick-constrained firms in test group 3 announce share repurchases of similar
magnitude relative to repurchases made by control firms following the implementation of the tick
size pilot. Therefore, the dramatic reduction in share repurchases comes mostly from the actual
execution of repurchases, which provides another piece of evidence supporting the market-
structure channel. Although market structure does not significantly reduce the incentive to
announce repurchases, firms or their brokers reduce the actual amounts of repurchases when they
face increased market microstructure frictions. We also find that firms do not switch to alternative
repurchase methods such as self-tender offers or accelerated share repurchases (ASRs). The results
are consistent with the notion that self-tender offers and ASRs are not popular because of their
high cost and less flexibility.
Brown, Liang, and Weisbenner (2007) find that firms reduced share repurchases when they
increased dividend payouts following the 2003 tax cut. We do not find substitution effects in the
opposite direction: firms do not increase dividends when market structure shocks force them to cut
share repurchases. This result is consistent with the dividend-smoothing motive (Leary and
Michaely (2011), Michaely and Roberts (2012)). In turn, tick-constrained firms in test group 3
reduce their total payouts by 50% (from 0.82% of total assets to 0.41% of total assets).
As a consequence, the structure of the payouts (repurchase vs. dividends) changes. Tick-
constrained firms in test group 3 used to have a normal payout structure, that is, a payout structure
dominated by repurchases (Farre-Mensa, Michaely, and Schmalz (2014)). After the Tick Size Pilot
Program was implemented, the proportions of repurchases and dividends became roughly equal.
Therefore, repurchase payouts do not necessarily need to dominate dividend payouts. When the
cost of repurchases increases, firms scale back share repurchases.
To the best of our knowledge, our study is the first to establish the causal impact of market
structure on share repurchases. In a survey conducted by Brav et al. (2005), financial executives

4
indicate that stock market liquidity is an important factor when they make repurchasing decisions
(e.g. they would begin repurchasing when their stock’s liquidity increases). Our paper provides
the first casual evidence for this claim. More broadly, we contribute to the literature on market
structure and corporate finance. Previous studies in this literature focus on liquidity in general.2
Our paper indicates two new important research dimensions of liquidity: “liquidity-for-whom” and
“liquidity-of-where.”
Regarding liquidity-for-whom, our results indicate that one form of liquidity does not fit all, and
we need to define liquidity differently for different agents. For example, greater depth means
higher liquidity for traders who use market orders, but it may work against issuers when regulatory
constraints force them to use limit orders.
Regarding liquidity-of-where, we find that dark pools matter for share repurchases. As firms
can choose where to trade, a reduction in liquidity on one type of platform does not necessarily
reduce share repurchases. Therefore, liquidity across all markets, and its distribution across types
of platforms, are more important than liquidity on one type of platform.
Existing debate on liquidity and payout policy focuses on whether firms can increase their stock
liquidity by repurchasing shares.3 Our results indicate two possible drivers of this controversy.
The first is reverse causality. Using the Tick Size Pilot as a controlled experiment, we find that
firms repurchase fewer shares when liquidity is low. This reverse causality indicates that a positive
correlation between share repurchase and liquidity does not imply that share repurchases increase
liquidity. The second possibility involves mechanical effects fueled by SEC Rule 10b-18. Because
this regulation encourages the use of limit orders, we may see a temporary increase in liquidity
around repurchases, but such a mechanical increase does not imply that firms can increase their
long-run liquidity by repurchasing which reduces the number of shares outstanding in their firms.
2 Bhide (1993) and Bolton and von Thadden (1998) show that liquidity affects corporate governance. Booth and
Chua (1996) and Ellul and Pagano (2006) find that liquidity affects initial public offerings, while Levine and Zervos
(1998) and Grullon, Michenaud, and Weston (2015) show that liquidity affects investment policy.
3 Brockman and Chung (2001) and Ginglinger and Hamon (2007) find, using data from Hong Kong and French,
respectively, that repurchases have a negative effect on liquidity. In contrast, Cook, Krigman, and Leach (2003) and
Hillert, Maug, and Obernberger (2016), using a sample of U.S. firms, show that repurchases increase liquidity.

5
Our results can inform a unified interpretation of two important puzzles in the corporate payout
literature (Farre-Mensa, Michaely, and Schmalz (2014)): 1) Why do share repurchases increase
relative to dividends? 2) Why do share repurcashes not drive out dividends completely?
Regarding the first puzzle, Farre-Mensa, Michaely, and Schmalz (2014) show that none of the
traditional theories, such as signaling (Grullon and Michaely (2004), Bargeron, Kulchania, and
Thomas (2011)) and agency conflicts (Jensen 1986, Jagannathan, Stephens, and Weisbach (2000)),
can explain the secular change in share repurchases. Relative taxation advantages (Chetty and Saez
(2006), Hanlon and Hoopes (2014)) have only a second-order impact on payout policy. Market
timing (Dittmar and Field (2015), Bond and Zhong (2016)) and catering (Baker and Wurgler
(2004a, 2004b)) also fail to explain this secular increase, unless we assume an increase in equity
undervaluation or a preference for repurchases over time. The failure of these traditional channels
motivates researchers to find alternative mechanisms, such as growth in stock-option
compensation (Fenn and Liang (2001)) and executive stock ownership (Brown, Liang, and
Weisbenner (2007)), offsetting earnings-per-share (EPS) dilution caused by the exercise of options
(Kahle (2002), Hribar, Jenkins, Johnson (2006)). The results of our controlled experiment suggest
that several tick-size reductions and improved market liquidity over time (Angel, Harris and Spatt
(2011, 2015)) may provide one explanation for the secular increase in share repurchases relative
to dividend payouts.
The second important puzzle is the reverse of the secular change in repurchases: Why have share
repurchases not completely replaced dividends? Existing explanations focus on the benefits of
dividends beyond those of paying cash, such as their disciplinary role (Easterbrook (1984)), their
information content (Bhattacharya (1979)), and institutional investors’ preferences for dividends
(Allen and Michaely (2003)). Our paper, on the other hand, focuses on the cost of repurchases led
by market-structure frictions. In summary, share repurchases have increased over the past three
decades due to reduced market-structure frictions. Share repurchases cannot completely drive out
dividend payouts, however, because these frictions still exist.

6
I. The Controlled Experiment: Tick Size Pilot Program
The 2016 SEC Tick Size Pilot Program provides an ideal controlled experiment to identify how
stock market structure affects corporate payout policies. Figure 1 displays the timeline of the
Program. In 2012, The Jumpstart Our Business Startups Act (“JOBS Act”) directed the SEC to
study whether the reductions in US stock tick sizes in the late 1990s could be driving the decline
in the number of initial public offerings (IPOs). In the summer of 2014, the SEC directed the
Financial Industry Regulatory Authority (FINRA) and the National Securities Exchanges (NSE)
to discuss the Pilot Program. The goal of the Program was to stimulate initial public offerings
(IPOs) and research activity among small capitalization companies in an effort to create more jobs
(Weild, Kim, and Newport (2012)).
Insert Figure 1 about Here
On August 25, 2014, the FINRA and the NSE proposed the Tick Size Pilot Program. On May
6, 2015, the SEC issued an order approving the National Market System (NMS) plan to implement
this Program beginning on October 3, 2016, for a two-year period (SEC (2016)).
All stocks included in the Pilot were chosen from the universe of Reg NMS securities that satisfy
the following criteria during the measurement period (a three-month period before Program
implementation): a given stock must have a price of at least $1.50 each day, a volume-weighted
average price of at least $2, and an average sales volume of less than one million shares during the
measurement period; moreover, the stock must have market capitalization below $3 billion and a
closing price above $2 on the last day of the measurement period. This process identified 2,399
stocks, which were then divided into 27 categories based on having (1) a low, medium, or high
share price; (2) low, medium, or high market capitalization; and (3) low, medium, or high volume.
The stocks were then drawn randomly into three test groups from each category, so that each test
group contains 400 stocks. The remaining stocks were assigned to a control group. On September
3, 2016, FINRA announced the final list of the 2,399 stocks which were included in the pilot and
also the group assignments.
We summarize the rules governing the four groups in Table Ⅰ. Stocks in the control group

7
continued to be quoted and traded at the existing 1 cent tick size; stocks in test group 1 could be
quoted only in $0.05 increments but could still be traded at 1 cent increment; stocks in test group
2 could be quoted and traded only in $0.05 minimum increments; there were no restrictions on
dark-pool trading for test groups 1 and 2. Stocks in test group 3 adhered to all the same
requirements as those in test group 2 and in addition were subject to a “trade-at” requirement,
which granted execution priority to displayed orders, unless non-displayed orders could provide
meaningful price improvement, with certain exceptions (SEC (2015)). The trade-at rule prevents
dark pools from executing orders by matching the NBBO. As a white paper by ITG Algorithm
states: Dark-pool non-displayed, Iceberg, and peg offset orders all lost much of their appeal
(Pearson and Li (2016)). From October 3 to October 17, 2016, new rules were activated for stocks
in test groups 1 and 2. From October 17 to October 31, 2016, new rules were activated for stocks
in test group 3.
Insert Table Ⅰ about Here
II. Empirical Design
In this section, we describe our empirical design. Subsection Ⅱ.A explains the specification for
the difference-in-differences (DID) test; Subsection Ⅱ.B presents the data and descriptive statistics.
A. Methodology
To measure the effects of the Tick Size Pilot Program on corporate payout policy, we conduct
difference-in-differences (DID) tests for firms in the test group and control group before and after
the Pilot implementation. We define the four fiscal quarters in 2015 as the pre-treatment period
and the four fiscal quarters in 2017 as the post-treatment period.4 We estimate the following
equation:
𝑦𝑖,𝑡 = 𝜂𝑖 + 𝜆𝑡 + 𝛽 × 𝑃𝑜𝑠𝑡 × 𝑇𝑒𝑠𝑡# + 𝜁′ × 𝑋𝑖,𝑡 + 𝜀𝑖,𝑡, (1)
4 We define fiscal year 2016 as the transition year and exclude the corresponding quarters in our DID tests to
alleviate any potential confounding effects.

8
where i indexes the firm, t indexes time. 𝑦𝑖,𝑡 is the corporate payout variable. 𝜂𝑖 is firm fixed
effects, which capture time-invariant heterogeneity across firms. 𝜆𝑡 is year-quarter fixed effects,
which capture time-varying shocks. 𝑃𝑜𝑠𝑡 is a dummy variable that equals one if the observation
is in the post-treatment period and zero if it is in the pre-treatment period. 𝑇𝑒𝑠𝑡# is a dummy
variable equal to one if a firm is in a test group# and zero if it is in the control group. 𝑋𝑖,𝑡 are
control variables,5 for which we use size, profitability, and growth opportunities (market-to-
book), following Fama and French (2001). 𝜀𝑖,𝑡 is an error term. The main coefficient of interest
is 𝛽, which compares the effects of the Tick Size Pilot Program on 𝑦 for the test firms relative to
the control firms.
B. Data
We obtained the list of test and control group stocks from FINRA’s website. We obtained
corporate policy data from Compustat’s North America Fundamentals Quarterly files. Dark-pool
trading volume data came from the FINRA Alternative Trading System (ATS) Transparency
website. We calculate spread and depth measures based on Daily TAQ (DTAQ) data.
In Table Ⅱ we characterize our sample selection process. First, we keep only the stocks that
remained in the Pilot Program as of August 2018. We then merge these stocks with the Compustat
Database. Finally, we exclude regulated utility firms (SIC codes 4800-4829 and 4900-4999) and
financial firms (SIC codes 6000-6999). These filters result in 780, 248, 243, and 221 firms in the
control group and test groups 1, 2, and 3, respectively.
Insert Table Ⅱ about Here
In Table Ⅲ we report the summary statistics for our main variables in the pre-shock period
for all test groups and the control group. We list the definitions for these variables in Appendix
Table A.Ⅰ. Specifically, repurchase payouts equal total expenditures in common stock repurchases
in the current quarter divided by total asset value in the previous quarter (in percentages). The
quoted spread is the time-weighted difference between the consolidated offer price and the
consolidated bid price. The effective spread equals twice the signed difference between the trade
5 The results are robust when we interact the control variables with the Post variable.

9
price and the midpoint of the consolidated bid and offer at the time of order receipt, which captures
the cost for a marketable order. The percent spreads are the corresponding spreads divided by the
midpoint of the consolidated bid and offer at the time of order receipt, and the units are
percentages. The average repurchase payout in our sample is around 0.43%, and the average
dividend payout is around 0.23%. In our sample, the average percent quoted spread is around
0.74%, while the average daily lit turnover is around 0.79% and the average daily dark turnover is
around 0.13%.
Insert Table Ⅲ about Here
III. Effects of the Tick Size Pilot Program on Corporate Payout Policies
In this section, we report the effects of the Tick Size Pilot Program on corporate payout policies.
In Subsection Ⅲ.A we show the causal effects of the market structure change on corporate
repurchase payouts; in Subsection Ⅲ.B we show that the Tick Size Pilot Program has almost no
effects on corporate dividend payouts; in Subsection Ⅲ.C we show that firms do not switch to
alternative repurchasing methods such as self-tender offers or ASRs; in Subsection Ⅲ.D we show
the impacts of the Tick Size Pilot Program on corporate total payouts and payout structure.
A. Tick Size Pilot Program and corporate repurchase payouts
We begin by exploring the effects of the Tick Size Pilot Program on corporate repurchase
payouts. Firms with high pre-treatment quoted spreads are less sensitive to an increase in the tick
size than firms with low quoted spreads. To account for the sensitivity differences, we split the
firms in each group equally to form tick-constrained and unconstrained samples based on their
average dollar-quoted spreads from 2016 Q1 through 2016 Q3. Tick-constrained firms have an
average dollar-quoted spread during the three quarters that is lower than the median values for the
group. The cutoff median values are 6.09, 7.33, 6.79, and 6.36 cents for the control group and test
groups 1, 2, and 3, respectively. We define other firms as unconstrained. To minimize the impacts
of observable pre-shock differences between treatment and control firms, we created a matched

10
sample from the control group based on average repurchase payouts, dividend payouts, dollar-
quoted spreads, and the three control variables (size, profitability, and growth opportunities) in the
pre-treatment period. All of our matching variables are measured prior to the treatment to ensure
that the matching variables are unaffected by the treatment (Roberts and Whited (2013)). We use
the nearest-neighbor matching method introduced in Abadie et al. (2004), which minimizes the
Mahalanobis distance between treated and control firms in the vector of observed covariates.6 In
Appendix Table A.Ⅱ we provide an example to illustrate the matching results for tick-constrained
firms in test group 3. The following results use matched samples as the control group.
The results reported in columns (1), (2), (4), and (5) in Table Ⅳ reveal no significant changes
in repurchase payouts for tick-constrained or unconstrained firms in test groups 1 and 2. The results
reported in columns (3) and (6) in Table Ⅳ show that, within test group 3, unconstrained firms do
not significantly change their repurchase payouts, but tick-constrained firms show statistically
significant reduction in their repurchase payouts by 0.36%, which represents a 67% decline
compared with the pre-shock level (0.54%, Table A.Ⅱ).
Tick-constrained firms in test group 3 face both an increase in the tick size and a trade-at
restriction on dark-pools, and their stocks’ market liquidities are affected most heavily. The results
indicate market liquidity as the underlying channel, which we explore in Section IV.
Insert Table Ⅳ about Here
B. Tick Size Pilot Program and corporate dividend payouts
In Panel A of Table Ⅴ we report the DID results on dividend payouts. The coefficients on the
interaction term are all insignificant for both tick-constrained and unconstrained samples in all test
groups. Therefore, the market structure change hardly affects corporate dividend payouts.
Following the implementation of the Tick Size Pilot Program, tick-constrained firms in test group
6 For each tick-constrained or unconstrained stock in a test group, we match the control stock with a replacement.
Therefore, there are fewer firms in the control matched sample than in the test group 3 constrained sample. This
method makes better matches possible and reduces estimation bias, but at the cost of higher variance (Abadie et al.
(2004)). We follow Roberts and Whited (2013) as matching with replacement is preferred for proper identification in
empirical corporate finance studies.

11
3 reduce repurchase payouts but do not substitute toward dividend payouts. The results are
consistent with the dividend-smoothing motive (Leary and Michaely (2011), Michaely and
Roberts (2012)): firms are more likely to adjust their dividend policies in response to permanent
shocks than to temporary shocks. If firms increase dividends during the Pilot, they may want to
resume repurchasing and would need to cut dividends when the Pilot ends, an action they typically
avoid because of the negative market reaction to dividend cuts.
Insert Table Ⅴ about Here
C. Do firms switch to alternative methods to repurchase?
In addition to repurchasing shares through the open market, firms can also repurchase through
self-tender offers or ASRs, both of which are affected less severely by stock market liquidity. With
a self-tender offer, a firm commits to offering its existing shareholders the opportunity to sell their
shares directly back to the firm within a short period of time after the offer date. In an ASR, a
company hires an investment bank to borrow shares from existing investors and has shares
immediately eliminated; the bank then covers its short position by purchasing shares in the open
market over several months. We find that alternative share-repurchase methods cannot make up
for the decrease in open market share repurchases among tick-constrained firms in test group 3.
The data on self-tender offers from SDC Mergers and Acquisitions show that only four firms in
test group 2 repurchased through self-tender offers in 2015 and there are no cases in 2017 among
all test stocks, while no firms in test group 3 conducted self-tender offers in 2015 or 2017. We then
search the SEC Edgar database for any filings that mention an ASR and find only one case of an
ASR for tick-constrained firms in test group 3—and that case occurred in 2015. The results show
that firms do not switch to alternative repurchase methods and are consistent with the findings
reported in the previous literature that self-tender offers and ASRs are less popular repurchase
vehicles than open-market repurchases. These results highlight the flexibility inherent in open-
market share repurchase programs compared with alternative repurchase methods, as these
alternatives are firm commitments to repurchase shares.

12
D. Tick Size Pilot Program, total payouts, and payout structure
In this subsection, we examine the impact of the Pilot on total payouts and the structure of
payouts. We report the DID results pertaining to total payouts in Panel B of Table Ⅴ. For tick-
constrained firms in test group 3, the reduction in repurchase payouts and unchanged dividend
payouts lead to a 0.41% reduction in total payouts, representing a -50% decline from the pre-
treatment average payouts of 0.82%. Tick-constrained firms in test groups 1 and 2 and
unconstrained firms in all groups experience no significant changes in total payouts.
In Panel C of Table Ⅴ we report the DID results for the payout structure. We define payout
structure as (repurchase payouts +1)/(dividend payouts +1). 7 The payout structures of tick-
constrained firms in test groups 1 and 2 and unconstrained firms in all groups do not change,
whereas the payout structure of the tick-constrained firms in group 3 decreases by 0.35. For these
firms, the average payout structure ratio was 1.42 before the Pilot. This ratio follows the typical
pattern in which repurchases dominate dividends as the main vehicle for payouts (Farre-Mensa,
Michaely, and Schmalz (2014)). Following the implementation of the Pilot, the payout structure
ratio decreases to 1.07. Thus, the composition of the payout becomes roughly equal between
repurchase payouts and dividend payouts.
Our results for the Tick Size Pilot Program show the causal effects of changes in stock market
structure (the increase in the tick size and the restriction on dark-pool trading) on corporate payout
structures (firms reduce the proportion of share repurchases over dividends), indicating that the
market structure change (the reduction in the tick size over years, the general increase in market
liquidity, and the proliferation of trading venues) may serve as a viable interpretation of one of the
most important puzzles in the corporate payout literature: the secular increase in share repurchases
over dividends (Farre-Mensa, Michaely, and Schmalz (2014)) .
7 We add 1 to both the repurchase payouts ratio and the dividend payouts ratio because the latter is often zero (Fama
and French (2001))

13
IV. Underlying Channel
In this section, we explore the underlying channel for the reduction in corporate payouts. In
Subsection IV.A, we show that the reduction does not come from announced share-repurchase
amounts but from the implementation of actual share repurchases. In subsection IV.B, we show
that the Pilot Program causes the reduction in liquidity in both stock exchanges and dark pools for
tick-constrained firms in test group 3, which are firms that drastically reduce their payouts. In
Subsection IV.C, we show the surprising result that large depth reduces share repurchases, and we
rationalize this surprising result using rule 10b-18. In Subsection IV.D, we discuss the conflict
between rule 10b-18 and the newly imposed trade-at rule as a driver of the dramatic reduction in
payouts for tick-constrained firms in test group 3.
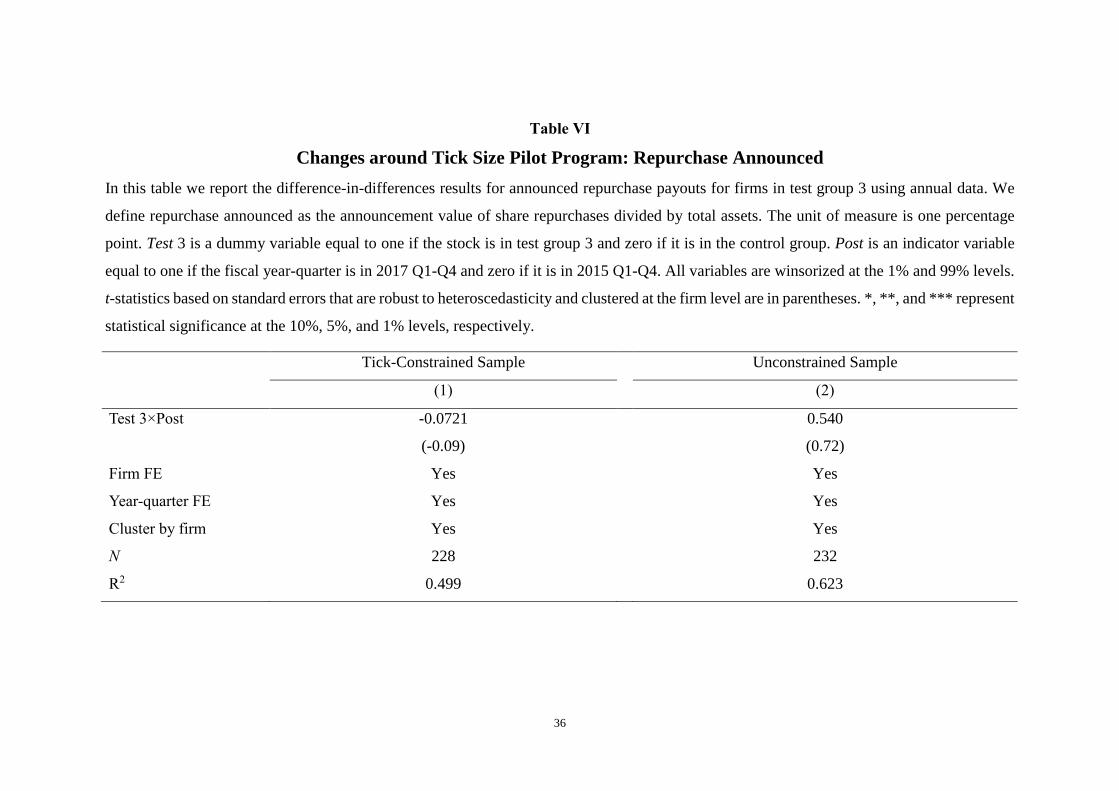
A. Tick Size Pilot Program and corporate repurchase announcements
In Section III, we examine firms’ actual repurchases. Firms typically announce their intended
repurchasing amounts without committing firmly to those amounts. In this section, we test whether
the Tick Size Pilot Program reduces the amounts of share repurchases that firms announce. We
define “Repurchase announced” as the annual announcement value of share repurchases (from
SDC Mergers and Acquisitions data) divided by total asset value. As the results reported in Table
Ⅵ indicate, we find no significant reduction in announcement repurchase values. Therefore, the
dramatic reduction in share repurchases should not come from announced share repurchases but
from the actual implementation of repurchases. The latter is more likely to be affected by market
microstructure frictions.
Insert Table Ⅵ about Here
B. The exogenous shock on market liquidity
In this subsection, we examine the impacts of the Tick Size Pilot Program on stock market
liquidity. We use percent spreads, lit turnover, and market depth as liquidity measures for lit
exchanges. We use FINRA Alternative Trading System (ATS) trading to proxy for dark-pool

14
trading.8 As FINRA’s ATS Transparency website provides only dark-pool trading-volume data,
where percent spreads and market depth are not available,9 we use turnover to measure the
liquidity in dark pools following SEC (2018).10
In Panels A and C of Table Ⅶ we show that percent quoted spreads and market depth increased
for tick-constrained firms in test groups 1 and 2. The turnover in the lit market decreases, but the
turnover in dark pools increases (although the increase is not statistically significant for test group
2). These results indicate a redistribution of liquidity from lit exchanges to dark venues for tick-
constrained firms in test groups 1 and 2. The results reported in Panels B and D of Table Ⅶ show
little change in liquidity measures for unconstrained firms in test groups 1 and 2.
The results reported in Panel E of Table Ⅶ show that liquidity in both exchanges and dark
venues declines for constrained firms in test group 3. In particular, lit (dark) turnover decreased
0.36% (0.08%), which represents a decline of 37% (45%) compared with the pre-treatment mean.11
The effective spread shows little change for any group.12 As seen in Panel F, we find that there
is less change in market liquidity for unconstrained firms in the Tick Size Pilot Program compared
with the constrained firms.
8 We follow the definition in Tuttle (2014) according to which dark pools are any ATSs that do not provide top-of-
book quotations to a public venue. Under this definition all registered ATSs are dark, with the exception of electronic
communication networks (ECNs) which accounts for a very small fraction of total transaction volume (Menkveld,
Yueshen, and Zhu (2017)).
9 FINRA began publishing monthly Appendix B data on August 31, 2017, which covers data for the period
beginning in April 2016. The data include realized spread and effective spread information at the stock-trading-center
level and are aggregated in groups to distinguish between ATSs and non-ATSs. We do not conduct DID analysis with
the data since the data cover a very short period that does not overlap with the period of our Compustat data.
10 In our study setting, greater volume can be interpreted as a sign of better market quality because, in the thinly
traded securities covered by the Pilot, excessive intermediation is not an issue (SEC (2018)).
11 The SEC rule 10b-18 volume condition prohibits firms from purchasing more than 25% of the preceding four-
week average daily volume. One another potential market liquidity channel for the share repurchase reduction is that
the volume condition becomes more binding after tick size pilot for the test stocks. It is hard to test this channel
directly, however, as we cannot observe daily repurchasing activity. Firms report monthly repurchasing activity in
their quarterly reports, so it is difficult to determine whether the volume condition is binding before or after the pilot.
12 The results for the effective spread are consistent with the joint assessment of the impact of the Tick Size Pilot
(SEC (2018)).

15
In summary, for unconstrained stocks, neither liquidity in the exchange nor liquidity in dark
venues changes, which is consistent with their insignificant changes in share repurchases.
Liquidity in exchanges declines for tick-constrained stocks in all three test groups, but only tick-
constrained stocks in test group 3 incur a reduction in dark liquidity. Therefore, our results provide
further evidence that stock market liquidity is one channel that drives the drop in share
repurchasing for tick-constrained stocks in test group 3. This evidence provides further support for
our claim that liquidity matters for firm repurchases, and that firms use dark venues for their share
repurchases.
Insert Table Ⅶ about Here
C. Increased depth and corporate share repurchases
The DID results we report in Table Ⅶ Panel E indicate that there is a significant increase (241%)
in market depth for tick-constrained firms in test group 3. We split tick-constrained firms in test
group 3 equally based on changes in average market depth from 2016 (before the Pilot) to 2017
and run the DID test for repurchase payouts. As shown in columns (1) and (2) of Table Ⅷ, we
find that the reduction in repurchase payouts concentrates on firms with large increases in market
depth. In contrast, there are no significant changes in repurchase payouts for firms with small
increases in market depth.13
As a market with great depth is generally considered a more liquid market, particularly for large
traders (Goldstein and Kavajecz (2000)), this result is surprising. It motivates us to investigate the
regulations on share repurchases. We find one possible explanation in the SEC’s safe harbor rule
10b-18. The safe harbor rule protects corporations against stock price manipulation charges as long
as firms’ repurchasing activities comply with four conditions. One of the conditions is based on
price: a repurchase price should not exceed the greater of the highest bid and the last sale price, so
that firms cannot inflate prices by using aggressive market orders to demand liquidity from the
offer side. This condition implicitly encourages firms to repurchase shares through buy-limit
13 We find that there are no significant changes in repurchase payouts when we split tick-constrained stocks in test
groups 1 and 2 or unconstrained stocks in test group 3 into two samples based on their increased depths (untabulated).

16
orders.14 When the tick size is binding, execution priority is determined by speed competition at
the same price (Yao and Ye (2018)). As firms and their brokers are not as fast as HFTs (SEC
(2018)), limit orders placed by issuers may fail to be executed. Therefore, a market with great
depth, especially on the bid side, can be an illiquid market for issuers.
If rule 10b-18 is the underlying driver, we would expect to observe greater reductions in share
repurchases on the part of firms with large increases in bid-side depth compared with firms with
large increases in offer-side depth. We conduct additional tests of this prediction by splitting tick-
constrained firms in test group 3 based on changes in the average bid-side depth and offer-side
depth.
In columns (3)-(6) of Table Ⅷ the results we report show that the reduction in share
repurchases is indeed greater for firms with large increases in bid-side depth than for firms with
large increases in offer-side depth, in terms of both magnitude and statistical significance. In
contrast, for firms with small increases in bid-side depth or offer-side depth, there are no significant
changes in repurchase payouts. The results indicate that SEC regulations on corporate share
repurchases combined with market microstructure frictions play an important role in corporate
payout policy.
Insert Table Ⅷ about Here
D. Discussion: Trade-at rule, dark-pool trading, and corporate repurchases
The results reported in Subsection Ⅳ.C, which imply that greater market depth harms share
repurchases, are consistent with our findings that the reduction in share repurchases concentrates
on tick-constrained firms in test group 3. The more binding tick size following implementation of
the Pilot Program harms firms that repurchase in exchanges. On the other hand, the trade-at rule
implemented for firms in test group 3 may harm their share repurchases in dark pools, because the
trade-at rule conflicts with SEC rule 10b-18 for issuers. SEC rule 10b-18 discourages firms from
14 Issuers can also place orders at the bid price, followed by purchasing at the offer price only after another
participant pays offer price. However, the previous strategy creates patterns that can be easily identified by HFTs and
increases issuers’ overall execution costs (IEX (2018)).

17
buying at prices above independent bids. Without the trade-at rule, brokers for issuers may go to
a dark pool to price-match independent bids. In so doing, they avoid competing on time priority
with HFTs in stock exchanges. Consistent with our interpretation, SEC (2018) shows that liquidity
providers respond to wider tick size in exchanges by switching trades to dark-pools to gain better
position for stocks in test group 1 and 2, and the behavior is most pronounced with tick-constrained
stocks. This explains why there is no significant reduction in share repurchases for tick-constrained
firms in test groups 1 and 2.
The trade-at rule destroys this strategy for tick-constrained stocks in test group 3, however, by
requiring their dark-pool trading to improve the best bid by 2.5 cents, with certain exceptions (SEC
(2015)). Such price improvement, however, establishes a price above the independent bid, which
works against SEC rule 10b-18. Therefore, interaction between regulations (the trade-at rule and
rule 10b-18 in this study) can generate unintended consequences for corporations. The results also
indicate that dark pools are important venues where firms repurchase shares. Since there is greater
competition on speed and queue position in the limit-order book after the proliferation of HFTs,
dark pools provide an alternative order-matching mechanism that enables issuers to jump ahead of
the intermarket time priority queues.
V. Robustness checks
In this section we report the results of several robustness checks. In Subsection Ⅴ.A we describe
how we validated the parallel trend assumption and show there are no results in placebo tests;
Subsection Ⅴ.B shows that our results hold when we use nominal share prices as a proxy for tick
constraints; in Subsection Ⅴ.C we show that our results remain robust after controlling for possible
alternative explainations.
A. Parallel trend and placebo tests
In this section, we show that repurchase payouts in the treatment and control groups follow parallel
pre-treatment trends. In Panel A of Table Ⅸ we report the quarter-by-quarter DID results for
18
repurchase payouts made by tick-constrained firms in test group 3 and the counterpart control
group from fiscal quarters running from 2013 Q1 through 2015 Q4. We find that the coefficients
on the interaction terms are all statistically insignificant, indicating the presence of a parallel trend
for payouts in the pre-treatment period.
Insert Table Ⅸ about Here
Our placebo tests also show that the estimated differences in repurchase payout changes are
indistinguishable across tick-constrained firms in test group 3 and the control group from 2013
through 2015, from 2014 through 2015, and from 2013 through 2014 (Panel B of Table Ⅸ).
Therefore, our test-control contrast does not appear in periods with no market-structure change.
B. Using nominal share prices as an alternative proxy for tick constraints
In the abovementioned tests, we use dollar-quoted spreads as a proxy for tick constraints.
Another way to sort stocks into tick-constrained and unconstrained samples is based on the
nominal share price, because a stock with a low nominal share price is constrained to a greater
extent by the uniform tick size compared with a stock with a high nominal share price (SEC (2018),
Yao and Ye (2018)). Thus, low-priced stocks should be affected to a greater extent by the Tick
Size Pilot.
To obtain the results reported in Table A.Ⅲ of the Appendix, we divide stocks equally into high-
priced and low-priced samples based on their share prices at the end of fiscal quarter 2016 Q3. The
stocks in the low-priced group are defined as the constrained sample and the stocks in the high-
priced group are defined as the unconstrained sample. Next, we carry out the same matching
procedure (except that we replace the dollar-quoted spread with the nominal share price as the
matching variable) to find the matched control sample and rerun the DID tests. The results reported
in Table A.Ⅲ of the Appendix show that our main results still hold under this alternative proxy
for tick constraints.
C. Controlling for Alternative Explanations
Farre-Mensa, Michaely, and Schmalz (2014) point out that signaling and agency conflicts
cannot explain the ratio of share repurchases to dividends, and our sample period does not involve

19
tax changes. Thereore, we focus on three remaining channels: market timing, management stock
and option holdings, and offsetting EPS dilution. We find that the results stay the same after
controlling for these three channels.
Firms may time the market and repurchase more shares when their stocks are undervalued
(Dittmar and Field (2015), Bond and Zhong (2016)). For example, firms may repurchase fewer
shares when the share price is high. Albuquerque, Song, and Yao (2018) show that the Tick Size
Pilot Program reduces share prices for firms in the test groups, which would provide them with an
incentive to repurchase more shares. Therefore, the price change cannot explain why share
repurchases decrease after the Tick Size Pilot Program. We also run a DID test on repurchase
payouts while adding share price as an independent variable. As reported in Panel A of Table Ⅹ
column (1), the interaction term remains negative and significant after we control for share price,
ruling out the market-timing explanation.
If share prices decrease after the implementation of the tick size pilot, it is possible that the
reduction on dollar repurchase payouts could be driven by the falling repurchase price, but not by
the reduction in the number of shares that firms repurchase. We then examine the change in the
number of repurchasing shares. The results reported in column (2) of Table Ⅹ show that there is a
significant decline in the number of shares that firms repurchase, confirming that our results cannot
be explained by changes in share prices.
Insert Table Ⅹ about Here
If managers own more stocks, they may favor repurchase payouts over dividend payouts
because of the relative tax advantage of share repurchases (Brown, Liang, and Weisbenner (2007));
managerial option holdings also create incentives not to pay dividends but to repurchase shares, as
dividend payouts reduce per-share value (Fenn and Liang (2001)). We obtain annual management
stock and option holdings data from the Compustat Execucomp database. In Table Ⅹ Panel B, we
report the results of DID tests for repurchase payouts using annual data to control for these
alternative explanatory variables. In column (1) we present the baseline case with no controls for
alterative explanations with annual data. As expected, the coefficients on the interaction term are

20
around three times higher than the coefficients obtained using quarterly data. The -1.42% reduction
on repurchase payouts represents a 67% decline in average repurchase payouts on the part of tick-
constrained firms in test group 3 before the Pilot (2.12%, untabulated). The results reported in
column (2) show a -1.33% decrease in repurchase payouts after controlling for managers’ stock
and option holdings. Therefore, our results are robust after controlling for the managers’ bonus
incentive explanation.
Firms may engage in share repurchases to manage EPS, thereby mitigating the dilutive effects
of stock-option exercises (Kahle (2002), Hribar, Jenkins, Johnson (2006)). Almeida, Fos, and
Kronlund (2016) identify the real effects of EPS-motivated repurchases: managers are willing to
trade off investments and employment for stock repurchases that enable them to meet analyst EPS
forecasts. As Compustat data on exercised and exercisable options are also annual, we run the DID
tests on repurchase payouts while controlling for exercisable options and exercised options using
annual data and report the results in column (3) of Table Ⅹ, Panel B. We find that the results remain
robust, ruling out the EPS dilution explanation. Finally, the results reported in column (4) of Table
Ⅹ, Panel B show that our results for repurchase payouts hold when we control for manager stock
holding, manager option holding, exercised options, and exercisable options simultaneously.
Overall, the reduction in share repurchases for tick-constrained stocks in test group 3 do not
appear without Tick Size Pilot, and the reduction after the Tick Size Pilot is implemented is robust
after we control for possible alternative explanations of share repurchases. All these results provide
further support that market structure plays a first-order role in corporate repurchase payouts.
VI. Conclusion
Using the 2016 SEC Tick Size Pilot Program as an exogenous shock, we show that market
structure has a first-order effect on corporate payout policy. Liquidity certainly plays an important
role, because we find that the reduction in share repurchases exists only for firms whose bid-ask
spreads are constrained by the tick size. For these firms, an increase in the tick size from 1 cent to
5 cents is more likely to mechanically increase the bid-ask spreads and reduce liquidity. Besides

21
its implications for liquidity in general, our paper indicates two new important research dimensions
to the literature: liquidity-for-whom and liquidity-of-where.
Regarding liquidity-for-whom, we find that regulations can change the definition of liquidity
for distinct groups of agents. SEC rule 10b-18, which aims to prevent price manipulation using
aggressive market orders, encourages issuers to use limit orders on the bid side. As firms and their
brokers may not be as fast as HFTs, great depth under a constrained tick size may harm issuers,
because their limit orders may fail to execute. As a consequence, although a market with great
depth is generally considered a liquid market, a market with great depth, particularly on the bid
side, may be illiquid for issuers.
Regarding liquidity-of-where, we show that a reduction in liquidity on stock exchanges does
not reduce firms’ payouts as long as they are not subjected to the trade-at rule in dark pools. On
the other hand, firms that are constrained by both the tick size increase and the trade-at rule reduce
their repurchase payouts by 67%. Insofar as they do not increase their dividend payouts, their total
payouts decline by 50%. Before the implementation of the Pilot, these firms make payouts mainly
through share repurchases. After the Pilot was launched, the proportions of repurchase payouts
and dividend payouts become roughly equal. Our results indicate the importance of dark pools in
share repurchasing, possibly because dark pools provide the opportunity to buy shares back at the
best bid price while at the same time enabling firms to avoid the competition on time priority in
stock exchanges. The trade-at rule destroys this price-matching strategy, because this new rule
implies that firms need to repurchase shares at prices above the best bid, a practice discouraged by
SEC rule 10b-18.
Our results can reconcile two seemingly contradictory puzzles in the corporate payout literature.
First, a reduction in market structure frictions over time, such as improved liquidity, reduced tick
size, and a proliferation of alternative trading venues may explain the secular upward trend toward
paying out through repurchases over dividends. Second, market microstructure frictions always
exist, which can explain why share repurchases cannot completely drive out dividend payouts.
Finally, our paper contributes to recent policy debates on tick sizes and the trade-at rule. First,

22
our results show that an increase in the tick size harms firms, and Yao and Ye (2018) show that an
increase in the tick size benefits HFTs. Taken together, these results show that regulators should
revoke the initiative to increase the tick size from 1 cent to 5 cents, because the intent of this policy
initiative was to help long-term investors and firms while curbing HFTs. Second, we show that
new and existing regulations may conflict in unintended ways. The newly imposed trade-at rule
forces firms to buy back shares at prices above NBBs in dark pools, whereas the old SEC rule 10b-
18 discourages firms from repurchasing shares at prices above NBBs. The conflicts between the
old and new rules impose constraints on issuers. Therefore, we believe the first step toward
imposing a new regulation should be to conduct due diligence to gauge how it might interact with
existing regulations. It would also be fruitful for researchers and regulators to consider a new
generation of regulations when accounting for the evolving market structure.

23
REFERENCES
Abadie, Alberto, David Drukker, Jane Leber Herr, and Guido Wilhelmus Imbens, 2004,
Implementing matching estimators for average treatment effects in Stata, Stata Journal 4,
290-311.
Albuquerque, Rui A., Shiyun Song, and Chen Yao, 2018, The price effects of liquidity shocks: A
study of SEC's tick-size experiment, Working paper, Boston College, Warwick University,
and Chinese University of Hong Kong.
Allen, Franklin, and Roni Michaely, 2003, Payout policy, Handbook of the Economics of Finance
1, 337-429.
Almeida, Heitor, Vyacheslav Fos, and Mathias Kronlund, 2016, The real effects of share
repurchases, Journal of Financial Economics 119, 168-185.
Alon Brav, John R. Graham, Campbell R. Harvey, Roni, Michaely, 2005, Payout policy in the 21st
century, Journal of Financial Economics 77, 483-527.
Angel, James J., Lawrence E. Harris, and Chester S. Spatt, 2011, Equity Trading in the 21st
Century, Quarterly Journal of Finance 1,1–53.
Angel, James J., Lawrence E. Harris, and Chester S. Spatt, 2015, Equity trading in the 21st century:
An update, Quarterly Journal of Finance 5,1–39.
Baker, Malcolm, and Jeffrey Wurgler, 2004a, A catering theory of dividends, Journal of Finance
59, 1125-1165.
Baker, Malcolm, and Jeffrey Wurgler, 2004b, Appearing and disappearing dividends: The link to
catering incentives, Journal of Financial Economics 73, 271-288.
Bargeron, Leonce, Manoj Kulchania, and Shawn Thomas, 2011, Accelerated share repurchases,
Journal of Financial Economics 101, 69-89.
Bhattacharya, Sudipto, 1979, Imperfect information, dividend policy, and “the bird in the hand”
fallacy, Bell Journal of Economics 10,259-270.
Bhide, Amar, 1993, The hidden costs of stock market liquidity, Journal of Financial
Economics 1,31-51.

24
Bolton, Patrick, and Ernst‐Ludwig Von Thadden, 1998, Blocks, liquidity, and corporate
control, Journal of Finance 1,1-25.
Bond, Philip, and Hongda Zhong, 2016, Buying high and selling low: Stock repurchases and
persistent asymmetric information, Review of Financial Studies 29,1409-1452.
Booth, James R., and Lena Chua, 1996, Ownership dispersion, costly information, and IPO
underpricing, Journal of Financial Economics 2,291-310.
Brockman, Paul, and Dennis Y. Chung, 2001, Managerial timing and corporate liquidity: evidence
from actual share repurchases, Journal of Financial Economics 61, 417-448.
Brown, Jeffrey R., Nellie Liang, and Scott Weisbenner, 2007, Executive financial incentives and
payout policy: Firm responses to the 2003 dividend tax cut, Journal of Finance 62, 1935-
1965.
Chetty, Raj, and Emmanuel Saez, 2006, The effects of the 2003 dividend tax cut on corporate
behavior: Interpreting the evidence, American Economic Review 96, 124-129.
Cook, Douglas O., Laurie Krigman, and J. Chris Leach, 2003, On the timing and execution of open
market repurchases, Review of Financial Studies 17, 463-498.
Dittmar, Amy, and Laura Casares Field, 2015, Can managers time the market? Evidence using
repurchase price data, Journal of Financial Economics 115, 261-282.
Easterbrook, Frank H, 1984, Two agency-cost explanations of dividends, American Economic
Review 74, 650-659.
Ellul, Andrew, and Marco Pagano, 2006, IPO underpricing and after-market liquidity, Review of
Financial Studies 2,381-421.
Fama, Eugene F., and Kenneth R. French, 2001, Disappearing dividends: changing firm
characteristics or lower propensity to pay? Journal of Financial Economics 60, 3-43.
Farre-Mensa, Joan, Roni Michaely, and Martin Schmalz, 2014, Payout policy, Annual Review of
Financial Economics 6, 75-134.
Fenn, George W., and Nellie Liang, 2001, Corporate payout policy and managerial stock
incentives, Journal of Financial Economics 60, 45-72.

25
Ginglinger, Edith, and Jacques Hamon, 2007, Actual share repurchases, timing and
liquidity, Journal of Banking & Finance 31, 915-938.
Goldstein, Michael A., and Kenneth A. Kavajecz, 2000, Eighths, sixteenths, and market depth:
changes in tick size and liquidity provision on the NYSE, Journal of Financial Economics
56, 125-149.
Grullon, Gustavo, and Roni Michaely, 2004, The information content of share repurchase
programs, Journal of Finance 59, 651-680.
Grullon, Gustavo, Sébastien Michenaud, and James P. Weston, 2015, The real effects of short-
selling constraints, Review of Financial Studies 6,1737-1767.
Hanlon, Michelle, and Jeffrey L. Hoopes, 2014, What do firms do when dividend tax rates change?
An examination of alternative payout responses, Journal of Financial Economics 114, 105-
124.
Hillert, Alexander, Ernst Maug, and Stefan Obernberger, 2016, Stock repurchases and liquidity,
Journal of Financial Economics 119, 186-209.
Hribar, Paul, Nicole Thorne Jenkins, and W. Bruce Johnson, 2006, Stock repurchases as an
earnings management device, Journal of Accounting and Economics 41, 3-27.
Investors Exchange, 2018, Petition for rulemaking to amend rule 10b-18, New York, NY.
Jagannathan, Murali, Clifford P. Stephens, and Michael S. Weisbach, 2000, Financial flexibility
and the choice between dividends and stock repurchases, Journal of Financial Economics 57,
355-384.
Jensen, Michael C., 1986, Agency costs of free cash flow, corporate finance, and takeovers,
American Economic Review 76, 323-329.
Kahle, Kathleen M., 2002, When a buyback isn’t a buyback: Open market repurchases and
employee options, Journal of Financial Economics 63, 235-261.
Leary, Mark T., and Roni Michaely, 2011, Determinants of dividend smoothing: Empirical
evidence, Review of Financial Studies 24, 3197-3249.

26
Levine, Ross, and Sara Zervos, 1998, Stock markets, banks, and economic growth, American
Economic Review 3,537–558.
Menkveld, Albert J., Bart Z. Yueshen, and Haoxiang Zhu, 2017, Shades of darkness: A pecking
order of trading venues. Journal of Financial Economics 124, 503-534.
Michaely, Roni, and Michael R. Roberts, 2012, Corporate dividend policies: Lessons from private
firms, Review of Financial Studies 25, 711-746.
Miller, Merton, and Franco Modigliani, 1961, Dividend policy, growth, and the valuation of shares,
Journal of Business 34, 411-433.
Pearson, Philip, and Fangyi Li, 2016, Tick Size 2016 Make Small Caps Great Again, ITG
Algorithms.
Roberts, Michael R., and Toni M. Whited, 2013, Endogeneity in empirical corporate finance,
Handbook of the Economics of Finance 2, 493-572.
Securities and Exchange Commission, 2015, Plan to implement a tick size pilot program,
Washington, DC.
Securities and Exchange Commission, 2016, Investor Alert: Tick Size Pilot Program-What
Investors Need to Know, Washington, DC.
Securities and Exchange Commission, 2018, Assessment of the plan to implement a tick size pilot
program, Washington, DC.
Tuttle, Laura A.,2014, OTC Trading: Description of Non-ATS OTC Trading in National Market
System Stocks, Working Paper, Securities and Exchange Commission.
Weild, David, Edward Kim, and Lisa Newport, 2012, The trouble with small tick sizes, White
Paper, Grant Thornton.
Yao, Chen,, and Ye Mao, 2018, Why trading speed matters: A tale of queue rationing under price
controls, Review of Financial Studies 31, 2157-2183.

27
Figure 1. SEC Tick Size Pilot Program Timeline. This figure displays the major events and dates associated with the SEC Tick Size Pilot
Program.

28
Table Ⅰ
Summary of Rules for Test Groups and Control Group
In this table we summarize the rules that divide the four groups of stocks. Stocks in the control group continue to be quoted and traded at a tick
size of 1 cent; stocks in test group 1 can be quoted only in $0.05 increments but can still be traded at 1 cent increments; stocks in test group 2
can be quoted and traded only in $0.05 minimum increments; stocks in test group 3 adhere to all the requirements of test group 2 and are also
subject to a “trade-at” requirement, which grants execution priority to displayed orders, unless non-displayed orders can provide meaningful
price improvements.
Number of Stocks Quote Rule Trade Rule
Trade-at Rule
Control group 1199
0.01
0.01
No
Test group 1 400
0.05
0.01
No
Test group 2 400
0.05
0.05
No
Test group 3 400
0.05
0.05
Yes

29
Table Ⅱ
Sample Selection Process
In this table we report our sample selection process. First, we keep stocks that remain in the Pilot Program in August 2018. FINRA’s website
provides reasons for removing a firm from the Tick Size Pilot Program, such as delisting, mergers and acquisitions, and price declines below
$1. Next, we match the remaining stocks with Compustat fundamentals quarterly data. Finally, we exclude regulated utility (SIC codes 4800-
4829 and 4900-4999) and financial (SIC codes 6000-6999) firms.
Stocks in the
Beginning of Pilot
Stocks Remaining in Pilot in
August 2018
Merge with
Compustat
Exclude Utility and Financial
Firms
Control group 1199
1080
1061
780
Test group 1 400
344
337
248
Test group 2 400
334
328
232
Test group 3 400
329
323
221

30
Table Ⅲ
Summary Statistics (Before Pilot)
In this table we present the summary statistics on key variables for test groups 1-3 and the control group before implementation of the Tick Size
Pilot Program. See Appendix Table A.Ⅰ for variable definitions. The sample period is fiscal quarters 2015 Q1-2015 Q4. We remove firms with
missing variables or missing observations for the main test period (fiscal quarters in 2015 and 2017) to form balanced datasets. All variables
are winsorized at the 1% and 99% levels.
Test Group 1 Test Group 2 Test Group 3 Control Group
N Mean Std. Dev. N Mean Std. Dev. N Mean Std. Dev. N Mean Std. Dev.
Repurchase payouts 632 0.475 1.195 592 0.485 1.230 496 0.502 1.118 1968 0.375 1.073
Dividend payouts 632 0.211 0.470 592 0.238 0.580 496 0.270 0.664 1968 0.214 0.539
Total payouts 632 0.686 1.315 592 0.724 1.357 496 0.772 1.285 1968 0.590 1.230
Payout structure 632 1.292 1.079 592 1.314 1.153 496 1.330 1.090 1968 1.218 0.954
Lit turnover 632 0.773 0.622 592 0.703 0.648 496 0.735 0.589 1968 0.730 0.631
Dark turnover 632 0.144 0.118 592 0.129 0.124 496 0.136 0.113 1968 0.132 0.115
Percent quoted spread 632 0.724 0.977 592 0.809 1.016 496 0.722 0.894 1968 0.817 1.051
Percent effective spread 632 0.722 1.301 592 0.683 0.910 496 0.834 1.649 1968 0.819 1.480
Market depth 632 0.726 0.508 592 0.657 0.507 496 0.722 0.513 1968 0.654 0.442

31
Table Ⅳ
Changes around the Tick Size Pilot Program: Repurchase Payouts
In this table we report the difference-in-differences results for repurchase payouts. Test # is a dummy variable equal to one if the stock is in test
group # (#indicating the numbers 1, 2, or 3) and zero if it is in the control group. Post is an indicator variable equal to one if the fiscal year-
quarter is in 2017 Q1-Q4 and zero if it is in 2015 Q1-Q4. The tick-constrained sample includes firms if their average dollar-quoted spread
during the three quarters before Pilot implementation is below their median value for each test group and other firms are in the unconstrained
sample. In columns (1), (2), and (3) we report the results for the constrained sample, and in columns (4), (5), and (6) we report the results for
the unconstrained sample. Control variables include size, profitability, and growth opportunity, as in Fama and French (2001). All variables are
winsorized at the 1% and 99% levels. t-statistics based on standard errors that are robust to heteroscedasticity and clustered at the firm level are
in parentheses. *, **, and *** represent statistical significance at the 10%, 5%, and 1% levels, respectively.
Tick-Constrained Sample Unconstrained Sample
Test 1 Test 2 Test 3 Test 1 Test 2 Test 3
(1) (2) (3) (4) (5) (6)
Test #×Post 0.0554 -0.0262 -0.362*** -0.145 -0.0259 -0.0587
(0.40) (-0.19) (-2.85) (-1.17) (-0.17) (-0.35)
Controls Yes Yes Yes Yes Yes Yes
Firm FE Yes Yes Yes Yes Yes Yes
Year-quarter FE Yes Yes Yes Yes Yes Yes
Cluster by firm Yes Yes Yes Yes Yes Yes

32
N 1136 1120 912 1176 1096 928
R2 0.352 0.395 0.570 0.428 0.573 0.361

33
Table Ⅴ
Changes around Tick Size Pilot Program: Dividend Payouts, Total Payouts, and Payout Structure
In this table we report the difference-in-differences results for dividend payouts, total payouts, and payout structure. We report the results for
dividend payouts in Panel A, the results for total payouts in Panel B, and the results for payout structure in Panel C. Test # is a dummy variable
equal to one if the stock is in test group # (#indicating the numbers 1, 2, or 3) and zero if it is in the control group. Post is an indicator variable
equal to one if the fiscal year-quarter is in 2017 Q1-Q4 and zero if it is in 2015 Q1-Q4. The tick-constrained sample includes firms if their
average dollar-quoted spread during the three quarters before Pilot implementation is below their median value for each test group and other
firms are in the unconstrained sample. In each panel, we report the results for the constrained sample in columns (1), (2), and (3), and those for
the unconstrained sample in columns (4), (5), and (6). Control variables include size, profitability, and growth opportunity, as in Fama and
French (2001). All variables are winsorized at the 1% and 99% levels. t-statistics based on standard errors that are robust to heteroscedasticity
and clustered at the firm level are reported in parentheses. *, **, and *** represent statistical significance at the 10%, 5%, and 1% levels,
respectively.
Panel A: Dividend Payouts
Tick-Constrained Sample Unconstrained Sample
Test 1 Test 2 Test 3 Test 1 Test 2 Test 3
(1) (2) (3) (4) (5) (6)
Test #×Post 0.0156 0.0722 -0.0481 -0.0186 -0.0236 -0.0387
(0.37) (1.42) (-0.57) (-0.60) (-0.36) (-0.87)
Controls Yes Yes Yes Yes Yes Yes

34
Firm FE Yes Yes Yes Yes Yes Yes
Year-quarter FE Yes Yes Yes Yes Yes Yes
Cluster by firm Yes Yes Yes Yes Yes Yes
N 1136 1120 912 1176 1096 928
R2 0.784 0.847 0.829 0.634 0.605 0.837
Panel B: Total Payouts
Tick-Constrained Sample Unconstrained Sample
Test 1 Test 2 Test 3 Test 1 Test 2 Test 3
(1) (2) (3) (4) (5) (6)
Test #×Post 0.0711 0.0460 -0.410*** -0.164 -0.0495 -0.0974
(0.49) (0.31) (-2.77) (-1.26) (-0.32) (-0.55)
Controls Yes Yes Yes Yes Yes Yes
Firm FE Yes Yes Yes Yes Yes Yes
Year-quarter FE Yes Yes Yes Yes Yes Yes
Cluster by firm Yes Yes Yes Yes Yes Yes
N 1136 1120 912 1176 1096 928
R2 0.447 0.517 0.618 0.469 0.604 0.530
Panel C: Payout Structure
Tick-Constrained Sample Unconstrained Sample

35
Test 1 Test 2 Test 3 Test 1 Test 2 Test 3
(1) (2) (3) (4) (5) (6)
Test #×Post 0.0724 -0.0664 -0.349*** -0.136 -0.0370 0.0171
(0.56) (-0.53) (-2.78) (-1.37) (-0.26) (0.11)
Controls Yes Yes Yes Yes Yes Yes
Firm FE Yes Yes Yes Yes Yes Yes
Year-quarter FE Yes Yes Yes Yes Yes Yes
Cluster by firm Yes Yes Yes Yes Yes Yes
N 1136 1120 912 1176 1096 928
R2 0.387 0.396 0.616 0.461 0.602 0.353
36
Table Ⅵ
Changes around Tick Size Pilot Program: Repurchase Announced
In this table we report the difference-in-differences results for announced repurchase payouts for firms in test group 3 using annual data. We
define repurchase announced as the announcement value of share repurchases divided by total assets. The unit of measure is one percentage
point. Test 3 is a dummy variable equal to one if the stock is in test group 3 and zero if it is in the control group. Post is an indicator variable
equal to one if the fiscal year-quarter is in 2017 Q1-Q4 and zero if it is in 2015 Q1-Q4. All variables are winsorized at the 1% and 99% levels.
t-statistics based on standard errors that are robust to heteroscedasticity and clustered at the firm level are in parentheses. *, **, and *** represent
statistical significance at the 10%, 5%, and 1% levels, respectively.
Tick-Constrained Sample Unconstrained Sample
(1) (2)
Test 3×Post -0.0721 0.540
(-0.09) (0.72)
Firm FE Yes Yes
Year-quarter FE Yes Yes
Cluster by firm Yes Yes
N 228 232
R2 0.499 0.623

37
Table Ⅶ
Changes around Tick Size Pilot Program: Market Liquidity
In this table we report the difference-in-differences results for market liquidity measures. In Panels A-F we report the results for the tick-
constrained samples and the unconstrained samples in test groups 1-3, respectively. Test # is a dummy variable equal to one if the stock is in
test group # (#indicating the numbers 1, 2, or 3) and zero if it is in the control group. Post is an indicator variable equal to one if the fiscal year-
quarter is in 2017 Q1-Q4 and zero if it is in 2015 Q1-Q4. The tick-constrained sample includes firms if their average dollar-quoted spread
during the three quarters before Pilot implementation is below their median value for each test group and other firms are in the unconstrained
sample. See Appendix Table A.I for variable definitions. All variables are winsorized at the 1% and 99% levels. t-statistics based on standard
errors that are robust to heteroscedasticity and clustered at the firm level are reported in parentheses. *, **, and *** represent statistical
significance at the 10%, 5%, and 1% levels, respectively.
Panel A: Test Group 1 Tick-Constrained Sample
Percent Quoted Spread Market Depth Lit Turnover Dark Turnover Percent Effective Spread
(1) (2) (3) (4) (5)
Test 1×Post 0.306*** 1.206*** -0.171** 0.0304* -0.183
(3.88) (12.04) (-1.98) (1.83) (-0.64)
Firm FE Yes Yes Yes Yes Yes
Year-quarter FE Yes Yes Yes Yes Yes
Cluster by firm Yes Yes Yes Yes Yes
N 1136 1136 1136 1136 1136

38
R2 0.740 0.795 0.669 0.682 0.515
Panel B: Test Group 1 Tick-Unconstrained Sample
Percent Quoted Spread Market Depth Lit Turnover Dark Turnover Percent Effective Spread
(1) (2) (3) (4) (5)
Test 1×Post -0.125 0.329*** -0.0742 -0.00240 -0.120
(-1.53) (5.32) (-0.97) (-0.19) (-1.31)
Firm FE Yes Yes Yes Yes Yes
Year-quarter FE Yes Yes Yes Yes Yes
Cluster by firm Yes Yes Yes Yes Yes
N 1176 1176 1176 1176 1176
R2 0.883 0.789 0.636 0.693 0.815
Panel C: Test Group 2 Tick-Constrained Sample
Percent Quoted Spread Market Depth Lit Turnover Dark Turnover Percent Effective Spread
(1) (2) (3) (4) (5)
Test 2×Post 0.347*** 1.068*** -0.107 0.0237 0.177
(3.95) (11.04) (-1.03) (1.34) (1.01)
Firm FE Yes Yes Yes Yes Yes
Year-quarter FE Yes Yes Yes Yes Yes
Cluster by firm Yes Yes Yes Yes Yes

39
N 1120 1120 1120 1120 1120
R2 0.743 0.773 0.636 0.693 0.828
Panel D: Test Group 2 Tick-Unconstrained Sample
Percent Quoted Spread Market Depth Lit Turnover Dark Turnover Percent Effective Spread
(1) (2) (3) (4) (5)
Test 2×Post 0.0284 0.444*** -0.148* -0.00614 0.228
(0.26) (6.45) (-1.73) (-0.40) (1.17)
Firm FE Yes Yes Yes Yes Yes
Year-quarter FE Yes Yes Yes Yes Yes
Cluster by firm Yes Yes Yes Yes Yes
N 1096 1096 1096 1096 1096
R2 0.846 0.710 0.671 0.720 0.688
Panel E: Test Group 3 Tick-Constrained Sample
Percent Quoted Spread Market Depth Lit Turnover Dark Turnover Percent Effective Spread
(1) (2) (3) (4) (5)
Test 3×Post 0.338*** 1.408*** -0.357*** -0.0829*** -0.251
(3.60) (14.07) (-3.15) (-4.70) (-0.75)
Firm FE Yes Yes Yes Yes Yes
Year-quarter FE Yes Yes Yes Yes Yes

40
Cluster by firm Yes Yes Yes Yes Yes
N 912 912 912 912 912
R2 0.789 0.801 0.629 0.653 0.675
Panel F: Test Group 3 Tick-Unconstrained Sample
Percent Quoted Spread Market Depth Lit Turnover Dark Turnover Percent Effective Spread
(1) (2) (3) (4) (5)
Test 3×Post -0.0245 0.457*** -0.0517 -0.0437*** 0.175
(-0.25) (4.90) (-0.73) (-3.58) (0.85)
Firm FE Yes Yes Yes Yes Yes
Year-quarter FE Yes Yes Yes Yes Yes
Cluster by firm Yes Yes Yes Yes Yes
N 928 928 928 928 928
R2 0.859 0.811 0.727 0.774 0.745

41
Table Ⅷ
Split Tick-constrained Firms Based on Increase in Depth
In this table we report the difference-in-differences results for repurchase payouts when we split the tick-constrained sample in test group 3
equally into two groups based on the increase in depth measures from 2016 (before the Pilot) to 2017. The small depth sample includes firms
whose increase in depth is below the median value. Other firms are defined as the large depth sample. Control variables include size, profitability,
and growth opportunity, as in Fama and French (2001). t-statistics based on standard errors that are robust to heteroscedasticity and clustered
at the firm level are reported in parentheses. *, **, and *** represent statistical significance at the 10%, 5%, and 1% levels, respectively.
Increase in Market Depth Increase in Bid-Side Depth Increase in Offer-Side Depth
Small Large Small Large Small Large
(1) (2) (3) (4) (5) (6)
Test 3×Post -0.210 -0.495*** -0.195 -0.522*** -0.243 -0.462**
(-1.18) (-2.79) (-1.05) (-2.91) (-1.35) (-2.60)
Controls Yes Yes Yes Yes Yes Yes
Firm FE Yes Yes Yes Yes Yes Yes
Year-quarter FE Yes Yes Yes Yes Yes Yes
Cluster by firm Yes Yes Yes Yes Yes Yes
N 456 456 456 456 456 456
R2 0.623 0.535 0.622 0.537 0.615 0.542

42
Table Ⅸ
Parallel Trend and Placebo Tests
In this table we report the results of parallel trend and placebo tests of repurchase payouts for the test group 3 tick-constrained sample. In Panel A
we report the period-by-period difference-in-differences results for repurchase payouts from fiscal year-quarter 2015 Q4 going back to 2013 Q1 (see
Columns (1) - (11)). In Panel B we report the results of placebo tests. Control variables include size, profitability, and growth opportunity, as in
Fama and French (2001). The sample of firms in the tests is consistent with the sample in the main tests. All variables are winsorized at the 1% and
99% levels. t-statistics based on standard errors that are robust to heteroskedasticity and clustered at the firm level are reported in parentheses below
the coefficient estimates. *, **, and *** represent statistical significance at the 10%, 5%, and 1% level, respectively.
Panel A: Parallel Trend Tests
Pre:
2013 Q1
Pre:
2013Q2
Pre:
2013Q3
Pre:
2013Q4
Pre:
2014Q1
Pre:
2014Q2
Pre:
2014Q3
Pre:
2014Q4
Pre:
2015Q1
Pre:
2015Q2
Pre:
2015Q3
Post:
2013Q2
Post:
2013Q3
Post:
2013Q4
Post:
2014Q1
Post:
2014Q2
Post:
2014Q3
Post:
2014Q4
Post:
2015Q1
Post:
2015Q2
Post:
2015Q3
Post:
2015Q4
(1) (2) (3) (4) (5) (6) (7) (8) (9) (10) (11)
Test 3×Post -0.0926 0.172 0.0225 -0.0817 0.00148 0.109 -0.111 -0.0703 0.0856 -0.115 0.207
(-0.45) (0.71) (0.10) (-0.52) (0.01) (0.49) (-0.49) (-0.41) (0.41) (-0.57) (1.15)
Controls Yes Yes Yes Yes Yes Yes Yes Yes Yes Yes Yes
Firm FE Yes Yes Yes Yes Yes Yes Yes Yes Yes Yes Yes
Year-quarter FE Yes Yes Yes Yes Yes Yes Yes Yes Yes Yes Yes

43
Cluster by firm Yes Yes Yes Yes Yes Yes Yes Yes Yes Yes Yes
N 192 190 194 200 204 214 216 226 228 228 228
R2 0.709 0.635 0.608 0.888 0.732 0.742 0.773 0.860 0.791 0.827 0.863
Panel B: Year-by-Year Placebo Tests
Pre:2013 Q1-Q4
Post:2015 Q1-Q4
Pre:2014 Q1-Q4
Post:2015 Q1-Q4
Pre:2013 Q1-Q4
Post:2014 Q1-Q4
(1) (2) (3)
Test 3×Post 0.0347 -0.0874 0.0477
(0.19) (-0.69) (0.32)
Controls Yes Yes Yes
Firm FE Yes Yes Yes
Year-quarter FE Yes Yes Yes
Cluster by firm Yes Yes Yes
N 752 808 736
R2 0.412 0.540 0.410

44
Table Ⅹ
Controlling for Alternative Explanations
In this table we report results we obtain after controlling for alternative explanations. In Panel A we report the results for repurchase payouts
and number of repurchasing shares after controlling for share price. In column (1) we report the results for repurchase payouts, and in
column (2) we report the results for number of repurchasing shares. In Panel B we report the results for repurchase payouts while controlling
for management stock and option holdings, exercisable options, and exercised options, using annual data. In column (1) we report the
baseline regression results without control variables. In column (2) we report the results after controlling for management stock and options
holdings. In column (3) we report the results after controlling for exercisable options and exercised options. In column (4) we report the
results after controlling for management stock and options holdings, exercisable options, and exercised options simultaneously. All variables
are winsorized at the 1% and 99% levels. t-statistics based on standard errors that are robust to heteroskedasticity and clustered at the firm
level are reported in parentheses below the coefficient estimates. *, **, and *** represent statistical significance at the 10%, 5%, and 1 %
level, respectively.

45
Panel A: Control for Share Price
Repurchases Payouts Number of Repurchasing Shares
(1) (2)
Test 3×Post -0.363*** -0.316***
(-2.85) (-2.77)
Share price Yes Yes
Controls Yes Yes
Firm FE Yes Yes
Year-quarter FE Yes Yes
Cluster by firm Yes Yes
N 912 912
R2 0.570 0.460
Panel B: Control for Manager Stock and Option Holding, Exercised Options and Exercisable Options
Repurchase Payouts
(1) (2) (3) (4)
Test 3×Post -1.422*** -1.331** -1.374** -1.311**
(-2.66) (-2.50) (-2.53) (-2.42)
Manager options - -0.519 - -0.467
- (-0.98) - (-0.86)

46
Manager stocks - 3.222 - 2.828
- (1.25) - (1.12)
Exercised options - - -0.00220 0.0222
- - (-0.02) (0.23)
Exercisable options - - 0.297 0.255
- - (1.06) (0.90)
Firm FE Yes Yes Yes Yes
Year FE Yes Yes Yes Yes
Cluster by firm Yes Yes Yes Yes
N 228 228 228 228
R2 0.858 0.860 0.860 0.861

47
Appendix
Table A.Ⅰ
Variable Descriptions
Variable Description
Panel A: Corporate Payout Variables
Repurchase payouts Value of common stock repurchases in current quarter divided by lagged assets in the previous quarter. The
unit of measure is one percentage point. [Compustat data item: 100×(cshopq×prcraq)/L.atq, cshopq is total
shares of common stock repurchases, prcraq is the average repurchase price per share, L.atq is total assets
in the previous quarter.]
Repurchase announced Announcement value of share repurchases divided by total asset value prior to an announcement. The unit
of measure is one percentage point.
Dividend payouts Common stock dividends in the current quarter divided by lagged assets in the previous quarter. The unit
of measure is one percentage point. [Compustat data item: 100×(dvyq-dvpq)/L.atq. dvyq are total dividends;
dvpq are preferred stock dividends.]
Total payouts The sum of repurchase payouts and dividend payouts. [Repurchase Payouts + Dividend Payouts.]
Payout structure The ratio of repurchase payouts to dividend payouts. We normalize the ratio by adding 1 to the numerator
and denominator because dividend payouts are often 0 (Fama and French 2001). [(Repurchase payouts +
1) / (Dividend payouts + 1).]

48
Number of repurchasing shares Total shares of common stock repurchased in the current quarter, divided by the number of common shares
outstanding in the end of previous quarter. The unit of measure is one percentage point. [Compustat data
item: 100×cshopq/L.cshoq. cshoq is the total shares of common stock.]
Share price A stock’s closing price in the current quarter. [Compustat data item: prccq.]
Panel B: Market Liquidity Variables
Percent quoted spread Time-weighted difference between the consolidated offer side and the consolidated bid side divided by the
midpoint of the consolidated bid side and the offer at the time of order receipt. The unit of measure is one
percentage point.
Percent effective spread Twice the signed difference of the trade price minus the midpoint of the consolidated bid side and offer
side at the time of order receipt, divided by the midpoint of the consolidated bid side and offer side at the
time of order receipt. The unit of measure is one percentage point.
Lit turnover Average daily share volume divided by shares outstanding of the stock in the quarter. The unit of measure
is one percentage point.
Dark turnover Average daily dark pool trading volume divided by shares outstanding of the stock in the quarter. The unit
of measure is one percentage point.
Market depth Market depth is calculated as the average of displayed dollar-depth at the NBBO. The unit of measure is
one ten thousand.
Panel C: Control Variables
Size Natural log of the total value of book assets in the previous quarter. [Compustat data item: log (L.atq).]

49
Profitability Income before extraordinary items plus depreciation and amortization in the current quarter, divided by
lagged assets in the previous quarter. The unit of measure is one percentage point. [Compustat data item:
100×(ibq+dpq)/L.atq. ibq is income before extraordinary items, dpq is depreciation and amortization]
Growth The market value of assets in the current quarter divided by lagged assets in the previous quarter.
[Compustat data item: (prccq×cshoq+atq-ceqq-txdbq)/L.atq. prccq is stock closing price, cshoq is common
shares outstanding, atq is the total assets, ceqq is book equity, txdbq is deferred taxes and investment tax
credits.]

50
Table A.Ⅱ
Test Group 3 Tick-constrained Sample Matching Results (Before Pilot)
In this table we report the summary statistics for the key variables for the test group 3 tick-constrained sample and the control group matched
sample.
Test Group 3 Constrained Sample Control Matched Sample
N Mean Std. Dev. N Mean Std. Dev.
Repurchase payouts 248 0.539 1.239 208 0.444 1.137
Dividend payouts 248 0.277 0.747 208 0.254 0.689
Total payouts 248 0.816 1.366 208 0.699 1.262
Payout structure 248 1.417 1.272 208 1.329 1.172
Lit turnover 248 0.961 0.679 208 0.726 0.526
Dark turnover 248 0.176 0.126 208 0.136 0.103
Percent quoted spread 248 0.390 0.427 208 0.557 0.836
Percent effective spread 248 0.673 1.689 208 0.627 1.489
Market depth 248 0.584 0.296 208 0.585 0.320

51
Table A.Ⅲ
Using Nominal Share Price as an Alternative Proxy of Tick Constraint
The results we report in this table indicate that our main results are robust when we use the nominal share price as a proxy of the tick-constraint.
We divide stocks equally into high-price and low-price samples based on their share prices in 2016 Q3. The stocks in the low-price group during
the pre-Pilot period are defined as the constrained sample and the stocks in the high-price group are defined as the unconstrained sample.
Panel A: Results for Repurchase Payouts, Number of Repurchasing Shares, Dividend Payouts, Total Payouts, and Payout Structure
Tick-Constrained Sample Unconstrained Sample
Test 1 Test 2 Test 3 Test 1 Test 2 Test 3
(1) (2) (3) (4) (5) (6)
Repurchase payouts -0.0366 -0.0333 -0.225** -0.192 0.0309 -0.104
(-0.33) (-0.23) (-2.18) (-1.42) (0.20) (-0.62)
Number of -0.0152 -0.0582 -0.234** -0.0666 -0.0197 -0.115
repurchasing shares (-0.15) (-0.54) (-2.55) (-0.63) (-0.17) (-0.88)
Dividend payouts -0.0126 0.0449 -0.0563 -0.0177 -0.0156 -0.0568
(-0.37) (0.84) (-1.05) (-0.51) (-0.23) (-0.74)
Total payouts -0.0491 0.0116 -0.281** -0.209 0.0154 -0.161
(-0.43) (0.07) (-2.39) (-1.46) (0.10) (-0.89)
Payout structure -0.0385 -0.0579 -0.208** -0.108 -0.00307 -0.0602
(-0.36) (-0.42) (-2.14) (-0.92) (-0.02) (-0.37)

52
Controls Yes Yes Yes Yes Yes Yes
Firm FE Yes Yes Yes Yes Yes Yes
Year-quarter FE Yes Yes Yes Yes Yes Yes
Cluster by firm Yes Yes Yes Yes Yes Yes
N 1160 1072 952 1184 1096 928
Panel B: Split Tick-Constrained Firms of Test Group 3 Based on Increase in Depth
Increase in Market Depth Increase in Bid-Side Depth Increase in Offer-Side Depth
Small Large Small Large Small Large
(1) (2) (3) (4) (5) (6)
Test 3×Post -0.0738 -0.382*** -0.122 -0.323** -0.204 -0.286**
(-0.51) (-2.75) (-0.79) (-2.52) (-1.21) (-2.22)
Controls Yes Yes Yes Yes Yes Yes
Firm FE Yes Yes Yes Yes Yes Yes
Year-quarter FE Yes Yes Yes Yes Yes Yes
Cluster by firm Yes Yes Yes Yes Yes Yes
N 480 472 480 472 480 472
R2 0.662 0.509 0.663 0.505 0.619 0.573