Market Research Report : Gaming industry in india 2015 - Sample
22
Gaming Industry – India April 2015
-
Upload
netscribes-inc -
Category
Software
-
view
120 -
download
0
Transcript of Market Research Report : Gaming industry in india 2015 - Sample

Gaming Industry – India
April 2015

2 GAMING INDUSTRY IN INDIA 2015.PPT
Executive Summary
Drivers:
Market Overview
Drivers & Challenges
Competitive Landscape
Global gaming industry is expected to grow at a CAGR of x1% between 20-- and 20--
Gaming industry in India is estimated to have grown by x2% to reach the market size of INR x3 bn in 20--
Challenges:
Key Players
Company1 Company2 Company3
Company4 Company5 Company6
Piracy and average revenue per user or unit
Quality of internet services
Penetration in suburban and rural areas
Economic advancement, changing demographics and consumer behavior
Demand for digital entertainment and contents
Internet penetration and next generation cellular networks
Mobile device adoption and colossal wireless subscriber base

3 GAMING INDUSTRY IN INDIA 2015.PPT
•Macro Economic Indicators
•Introduction
•Market Overview
•Drivers and Challenges
•Market Trends
•Competitive Landscape
•Consumer Insights
•Strategic Recommendations
•Appendix

4
Economic Indicators (-/-)
GDP at Factor Cost: Quarterly
Inflation Rate: Monthly
11
12
13
14
15
INR tn
Q4
c4
d2 c2
b2
a2
Q1
d1 b4
a4
Q3
c3
b3
a3
Q2
c1
b1
a1
2013-14 2012-13 2011-12 2010-11
0.0
0.5
1.0
1.5
2.0
%
Oct 2013 - Nov 2013
t
Sep 2013 - Oct 2013
s
Aug 2013 - Sep 2013
r
Jul 2013 - Aug 2013
q
Jun 2013 - Jul 2013
p
GAMING INDUSTRY IN INDIA 2015.PPT

5
Introduction
Video Gaming – Overview
GAMING INDUSTRY IN INDIA 2015.PPT
• Video game is an interactive entertainment product that uses Personal Computers, Televisions, dedicated display, or mobile devices as a services delivery platform
These interactive entertainment products require somewhat constant and direct user-interaction or participation
• Gaming products can be broadly categorized in two segments, gaming hardware products and gaming software products
Gaming hardware products would include gaming consoles or video gaming systems, gaming peripherals, and other gaming -dedicated hardware
Gaming software products would include games itself in CD, DVD, Blu-Ray and other media platforms or in digital format, and game
add-on or downloaded contents (DLCs)
• Various genres of games are available on gaming platforms to cater to varied user preferences
Some of the major game genres are Action, Action-Adventure, Adventure, Arcade, Fighting, Horror, Racing, Role-Playing Game (RPG), Shooting, Simulation, Strategy, and Sports
• Quick emerging online and mobile gaming has revolutionized the industry with new genres and have attracted new
audience

6
Product1 and Product2 are the most popular in India
Gaming Industry – Market Size & Growth
Market Overview – India (-/-)
• Gaming industry in India is estimated to have grown by a1% to reach the market size of INR a2 bn in 20--
In 20--, revenue contributions by major gaming segments were as below,
– PC gaming – a3%
– Console gaming – a4%
– Mobile gaming – a5%
– Online gaming – a6%
•Media and entertainment industry in India is poised to register a CAGR of a7% to reach INR a8 bn by 20--
INR bn
+y%
20--
a6
20--
a5
20--
a4
20--
a3
20--
a2
20--
a1
GAMING INDUSTRY IN INDIA 2015.PPT

7 GAMING INDUSTRY IN INDIA 2015.PPT
Drivers & Challenges – Summary
Drivers
Economic advancement, changing demographics and consumer behavior
Demand for digital entertainment and contents
Internet penetration and next generation cellular networks
Mobile device adoption and colossal wireless subscriber base
Challenges
Piracy and average revenue per user or unit
Quality of internet services
Penetration in suburban and rural areas

8
Trends (-/-)
• text text text text text text text text text text text text text text text text text text text
• text text text text text text text text text text text text text text text text text text text text text text text text text text text text text text
Trend1
• text text text text text text text text text text text text text text text text text text text text text text text text text text text text text text
• text text text text text text text text text text text text text text text text text text text
Trend2
• text text text text text text text text text text text text text text text text text text text text text text text text text text text text text text
• text text text text text text text text text text text text text text text text text text text
Trend3
• text text text text text text text text text text text text text text text text text text text text text text text text text text text text text text
• text text text text text text text text text text text text text text text text text text text
Trend4
GAMING INDUSTRY IN INDIA 2015.PPT

9 GAMING INDUSTRY IN INDIA 2015.PPT
SAMPLE Porter’s Five Forces Analysis
Bargaining Power of Buyers • Text text text text text text text
text text text text text text text text text text text text text text text text text text
Impact High
Threat of New Entrants • Text text text text text text text
text text text text text text text text text text text text text text text text text text
Impact Medium
Bargaining Power of Suppliers • Text text text text text text text
text text text text text text text text text text text text text text text text text text
Impact Medium
Threat of Substitutes • Text text text text text text text
text text text text text text text text text text text text text text text text text text
Impact Low
Competitive Rivalry • Text text text text text text text text
text text text text text text text text text text text text text text text text text text text text text text text text text
Impact Medium

10
SAMPLE Public: Domestic Company – Company 1 (1/4)
Key People
Products and Services
Company Information Offices and Centres – India
Corporate Address
Tel No.
Fax No.
Website
Year of Incorporation
Ticker Symbol
Stock Exchange
Category Products/Services
Sectors (EPC)
Name Designation
Head Office
GAMING INDUSTRY IN INDIA 2015.PPT

11
SAMPLE Financial Snapshot Key Ratios
Financial Summary
• The company incurred a net loss of INR - bn in FY 2013, as compared to net profit of INR - bn in FY 2012
• The company reported total income of INR - bn in FY 2013, registering a decrease of -% over FY 2012
• The company earned an operating margin of -% in FY 2013, a decrease of - percentage points over FY 2012
• The company reported debt to equity ratio of - in FY 2013, an increase of -% over FY 2012
Key Financial Performance Indicators
Indicators Value (17/01/2014)
Market Capitalization (INR mn)
Total Enterprise Value (INR mn)
EPS (INR)
PE Ratio (Absolute)
Particulars y-o-y change
(2013-12) 2013 2012 2011 2010
Profitability Ratios Operating Margin
Net Margin
Profit Before Tax Margin
Return on Equity
Return on Capital Employed
Return on Working Capital
Return on Assets
Return on Fixed Assets
Cost Ratios Operating costs (% of Sales)
Administration costs (% of Sales)
Interest costs (% of Sales)
Liquidity Ratios Current Ratio
Cash Ratio
Leverage Ratios Debt to Equity Ratio
Debt to Capital Ratio
Interest Coverage Ratio
Efficiency Ratios Fixed Asset Turnover
Asset Turnover
Current Asset Turnover
Working Capital Turnover
Capital Employed Turnover
Improved Decline
Net Profit/Loss Total Income
0
2010
s1
t1
INR bn INR bn
2013
t4
s4
2012
s3
t3
2011
s2
t2
Public: Domestic Company – Company 1 (2/4)
GAMING INDUSTRY IN INDIA 2015.PPT
12
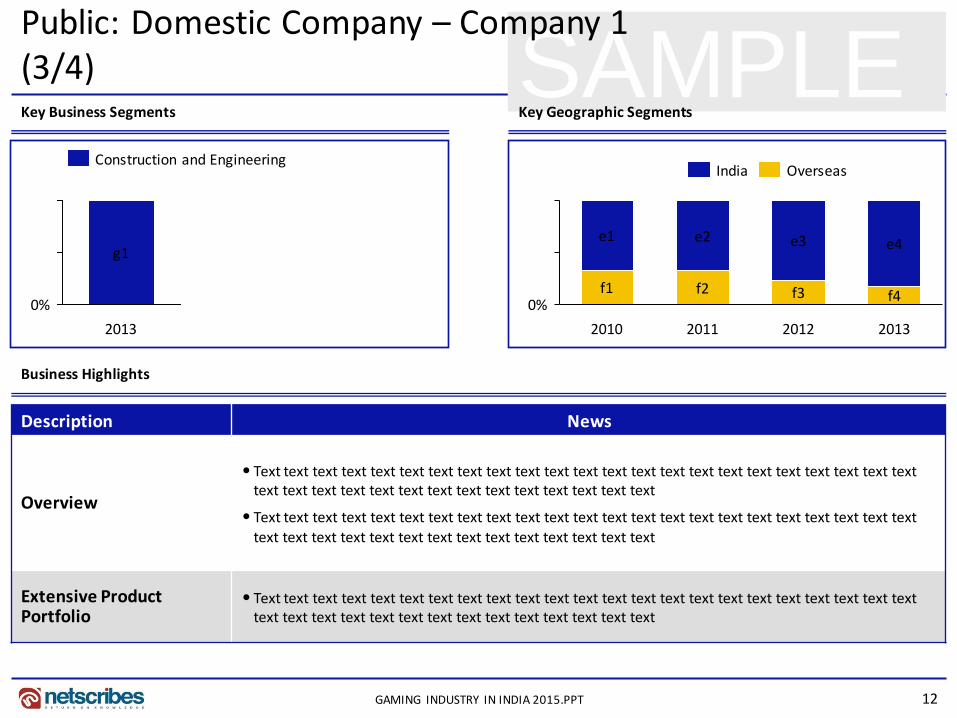
SAMPLE Key Business Segments Key Geographic Segments
Business Highlights
Description News
Overview
• Text text text text text text text text text text text text text text text text text text text text text text text text text text text text text text text text text text text text text
• Text text text text text text text text text text text text text text text text text text text text text text text text text text text text text text text text text text text text text
Extensive Product Portfolio
• Text text text text text text text text text text text text text text text text text text text text text text text text text text text text text text text text text text text text text
0%
2013
g1
Construction and Engineering
0%
e2
f2
2011
e3
2010
f1
2013
f4
e4
2012
f3
e1
Overseas India
Public: Domestic Company – Company 1 (3/4)
GAMING INDUSTRY IN INDIA 2015.PPT

13
SAMPLE Public: Domestic Company – Company 1 (4/4)
T O
W S
GAMING INDUSTRY IN INDIA 2015.PPT

14
SAMPLE Private: Domestic Company – Company 2 (1/5)
Key People
Products and Services
Company Information Offices and Centres – India
Category Products/Services
Products
Name Designation
Ahmedabad
Corporate Address
Tel No.
Fax No.
Website
Year of Incorporation
Head Office
GAMING INDUSTRY IN INDIA 2015.PPT

15
SAMPLE Shareholders of the Company as on 28.09.2012 Ownership Structure
Name No. of Shares held
X
X
Total
30%
70%
Corporate Bodies Foreign holdings
Private: Domestic Company – Company 2 (2/5)
GAMING INDUSTRY IN INDIA 2015.PPT

16
SAMPLE Financial Snapshot Key Ratios
Improved Decline
Financial Summary
• The company earned a net profit of INR - mn in FY 2013, as
compared to net loss of INR - mn in FY 2012
• The company reported total income of INR - mn in FY 2013,
registering an increase of -% over FY 2012
• The company earned an operating margin of -% in FY 2013, an
increase of - percentage points over FY 2012
• The company reported debt to equity ratio of - in FY 2013, a
decrease of -% over FY 2012
Net Profit/Loss Total Income
0 v3
u3
2011 2013
v4
u4
2012
INR mn INR mn
v2
2010
u1
v1
u2
Private: Domestic Company – Company 2 (3/5)
Particulars y-o-y change
(2013-12) 2013 2012 2011 2010
Profitability Ratios Operating Margin
Net Margin
Profit Before Tax Margin
Return on Equity
Return on Capital Employed
Return on Working Capital
Return on Assets
Return on Fixed Assets
Cost Ratios Operating costs (% of Sales)
Administration costs (% of Sales)
Interest costs (% of Sales)
Liquidity Ratios Current Ratio
Cash Ratio
Leverage Ratios Debt to Equity Ratio
Debt to Capital Ratio
Interest Coverage Ratio
Efficiency Ratios Fixed Asset Turnover
Asset Turnover
Current Asset Turnover
Working Capital Turnover
Capital Employed Turnover
GAMING INDUSTRY IN INDIA 2015.PPT

17
SAMPLE Business Highlights
Description News
Overview
• Text text text text text text text text text text text text text text text text text text text text text text text
text text text text text text text text text text text text text text
• Text text text text text text text text text text text text text text text text text text text text text text text
text text text text text text text text text text text text text text
Extensive Product Portfolio
• Text text text text text text text text text text text text text text text text text text text text text text text
text text text text text text text text text text text text text text
Private: Domestic Company – Company 2 (4/5)
GAMING INDUSTRY IN INDIA 2015.PPT

18
SAMPLE Private: Domestic Company – Company 2 – SWOT Analysis (5/5)
T O
W S
GAMING INDUSTRY IN INDIA 2015.PPT

19 GAMING INDUSTRY IN INDIA 2015.PPT
Strategic Recommendations (-/-)
•Text text text text text text text text text text text text text text text text text •Text text text text text text text text text text text text text text text text text
• Text text text text text text text text text text text
text text text text text text
• Text text text text text text text text text text text
text text text text
• Text text text text text text text text text text text
text text text text text text text text text text text
text text text text text text text text
• Text text text text text text text text text text text
text
• Text text text text text text text text text text text
text text text text text text
• Text text text text text text text text text text text
text text text text
• Text text text text text text text text text text text
text text text text text text text text text text text
text text text text text text text text
• Text text text text text text text text text text text
text
Recommendation1 Recommendation2

20
Appendix
Ratio Calculations
Operating Margin (Operating Income/Revenues)*100
Net Margin (Net Profit / Revenues) *100
Profit Before Tax Margin (Income Before Tax / Revenues *100
Return on Equity (ROE) (Net Income / Shareholders Equity)*100
Return on Capital (ROCE) EBIT / (Total Assets – Current Liabilities)*100
Return on Working Capital (EBIT / Working Capital) *100
Return on Assets (EBIT / Total Assets)*100
Return on Fixed Assets (EBIT / Fixed Assets) *100
Operating Costs (% of Sales) (Operating Expenses / Sales) *100
Administration Costs (% of Sales)
(Administrative Expenses / Sales) *100
Interest Costs (% of Sales) (Interest Expenses / Sales) *100
Ratio Calculations
Current Ratio Current Assets / Current Liabilities
Cash Ratio {(Cash & Bank Balance + Marketable Securities) / Current Liabilities)}
Debt to Equity Total Liabilities / Shareholders Equity
Debt to Capital Ratio {Total Debt / (Shareholders Equity + Total Debt)}
Interest Coverage Ratio EBIT / Interest Expense
Fixed Asset Turnover Sales / Fixed Assets
Asset Turnover Sales / Total Assets
Current Asset Turnover Sales / Current Assets
Working Capital Turnover Sales / Working Capital
Capital Employed Turnover Sales / (Shareholders Equity + Total Debt)
GAMING INDUSTRY IN INDIA 2015.PPT

21
Sources of Information
Open Sources
Premium Databases
Company Websites Annual Reports of Companies
Technology Magazines Magazines and Journals
Regulatory Websites Leading Newspapers
Electronic Media Print Media
SECONDARY RESEARCH
PRIMARY RESEARCH
Interviews
Leading Industry Experts
GAMING INDUSTRY IN INDIA 2015.PPT

22
Thank you for the attention Gaming Industry – India 2015 report is a part of Netscribes’ Technology Series. For more detailed information or customized research requirements please contact:
About Netscribes Netscribes is a knowledge-consulting and solutions firm with clientele across the globe. The company’s expertise spans areas of investment & business research, business & corporate intelligence, content-management services, and knowledge-software services. At its core lies a true
value proposition that draws upon a vast knowledge base. Netscribes is a one-stop shop designed to fulfil clients’ profitability and growth objectives.
Disclaimer: This report is published for general information only. Although high standards have been used in the preparation of this report, Netscribes is not responsible for any loss or damage arising from use of this document. This document is the sole property of Netscribes. and prior permission is required for guidelines on reproduction.
Phone: +91 22 4098 7600 E-Mail: [email protected]
GAMING INDUSTRY IN INDIA 2015.PPT