Technical SEO Pitfalls - East Kent B2B Event - 4th November 2015
Upload
jewel-clarkCategory
view
215download
0
Market Research and Advertising
Kent WolfeDecember 4th, 2002
Cente
r for
Ag
ribu
si
ness and Economic D
evelopment

Why Market Research?
“It is easier to sell something people want than it is to sell something that is easy to produce”
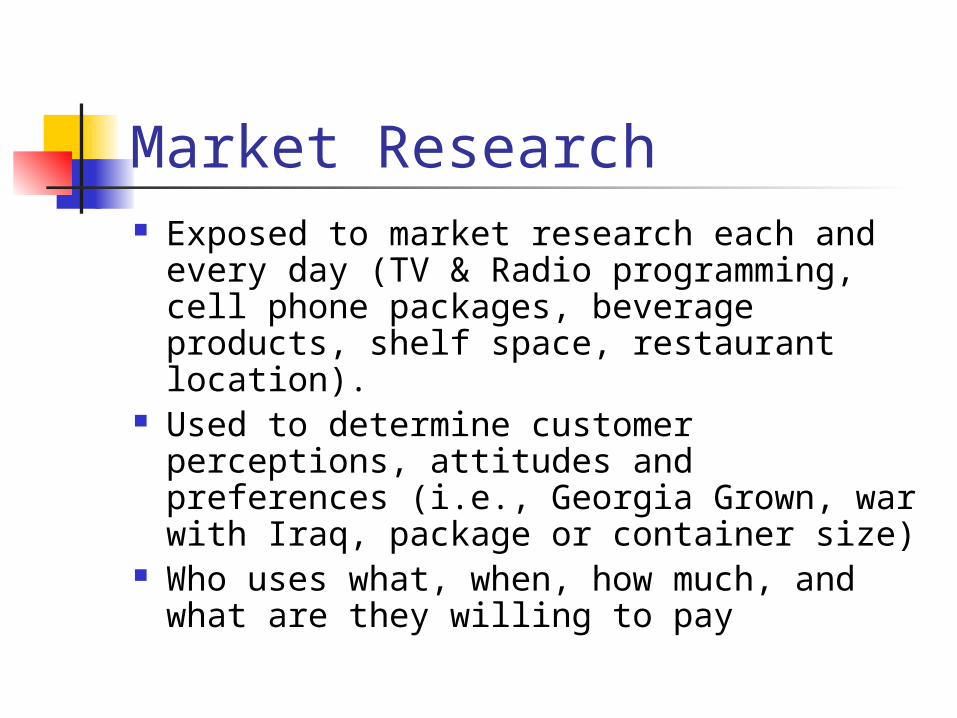
Market Research Exposed to market research each and
every day (TV & Radio programming, cell phone packages, beverage products, shelf space, restaurant location).
Used to determine customer perceptions, attitudes and preferences (i.e., Georgia Grown, war with Iraq, package or container size)
Who uses what, when, how much, and what are they willing to pay

Questions Market Research Can Answer
Age Average Expenditures Environmental analysis
Race Financing needs Pricing
Income Payment methods How to effectively communicate
Gender Current usage Perceptions
Occupation When is it purchased Attitudes
Household size Where do customers shop
Preferences
Primary competitors
Trends Unmet needs
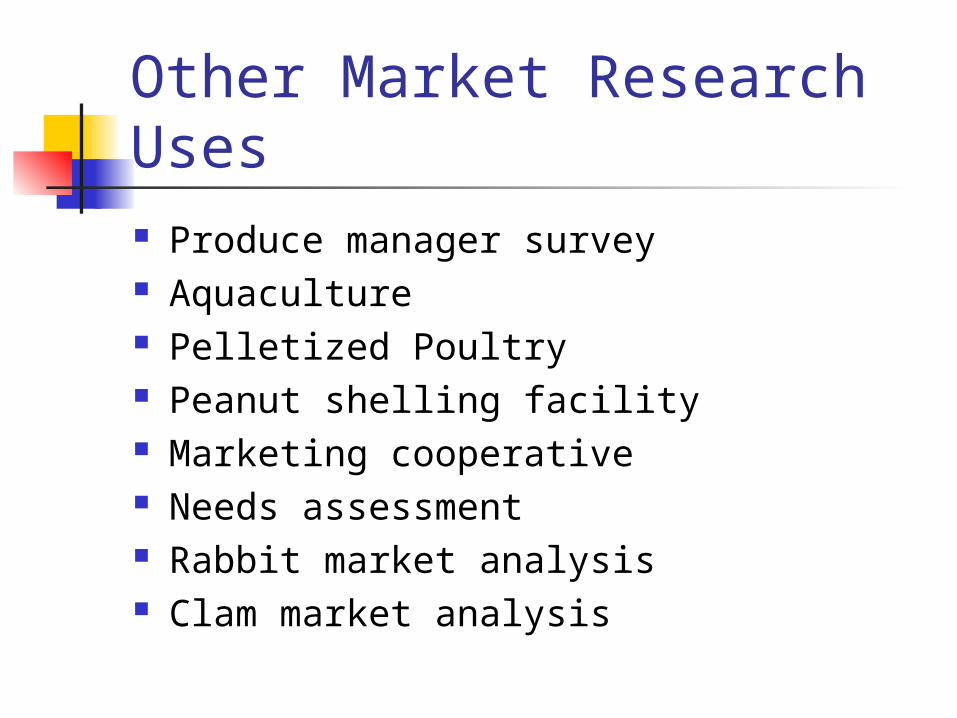
Other Market Research Uses Produce manager survey Aquaculture Pelletized Poultry Peanut shelling facility Marketing cooperative Needs assessment Rabbit market analysis Clam market analysis
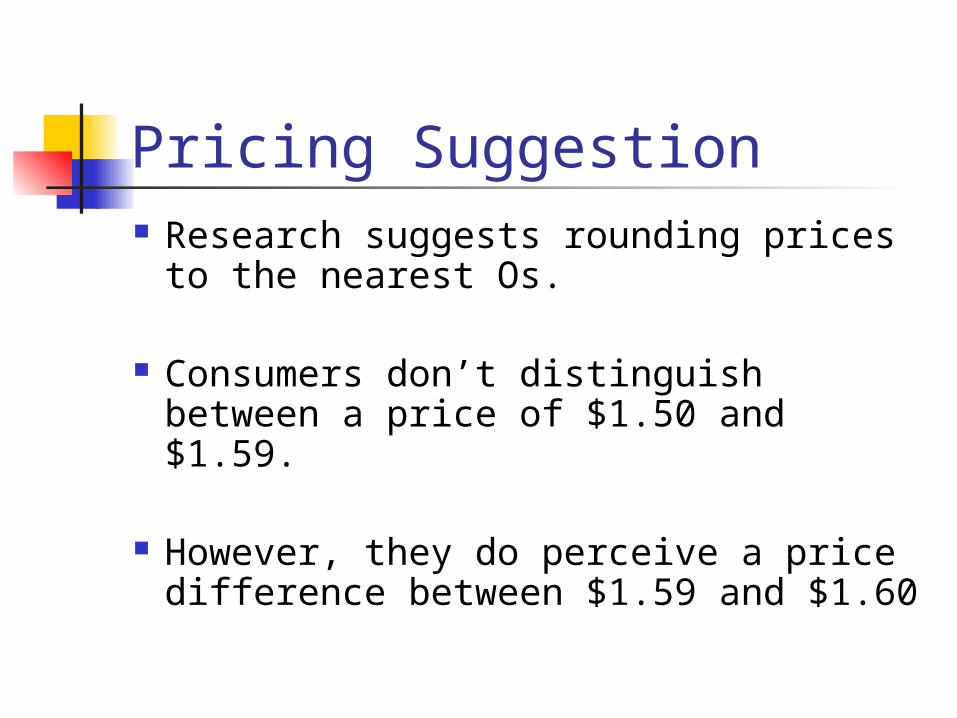
Pricing Suggestion Research suggests rounding prices
to the nearest Os.
Consumers don’t distinguish between a price of $1.50 and $1.59.
However, they do perceive a price difference between $1.59 and $1.60
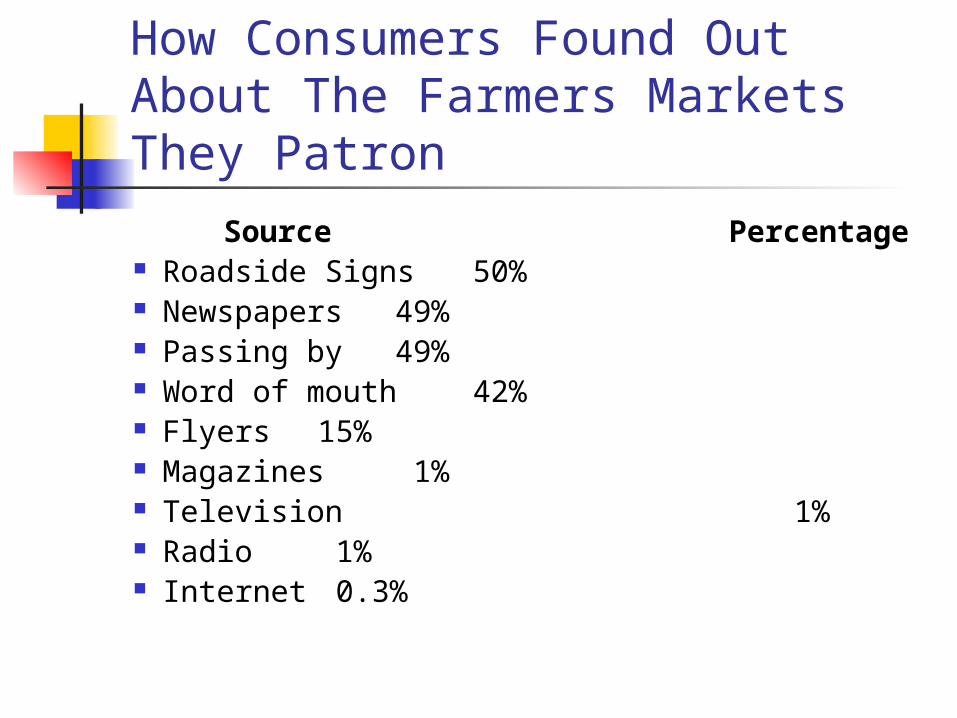
How Consumers Found Out About The Farmers Markets They Patron
Source Percentage Roadside Signs 50% Newspapers 49% Passing by 49% Word of mouth 42% Flyers 15% Magazines 1% Television 1% Radio 1% Internet 0.3%
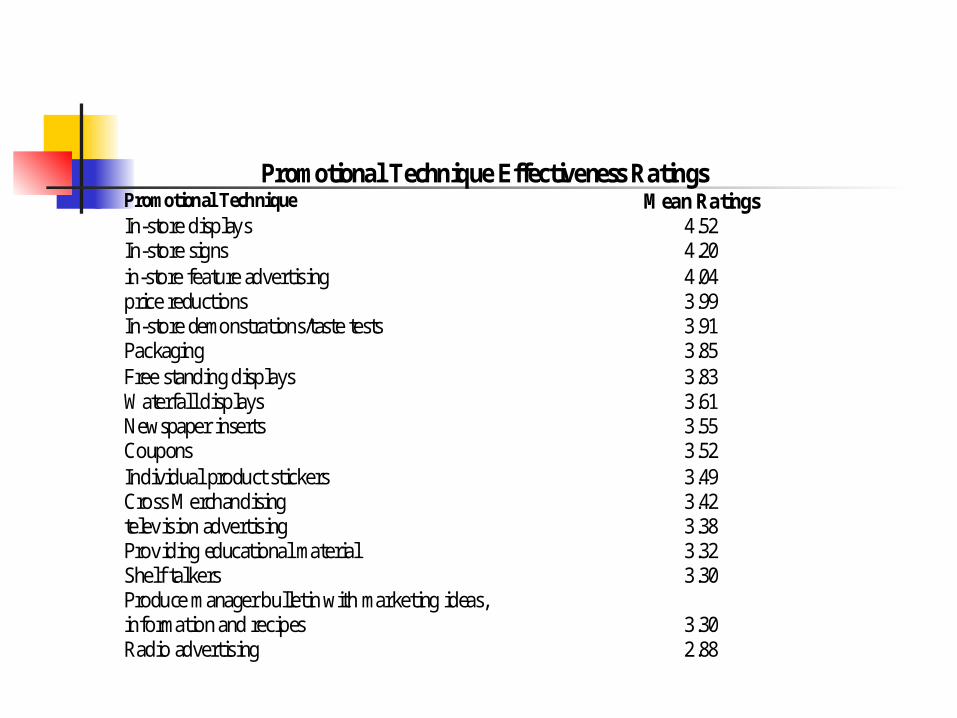
Promotional Technique Effectiveness Ratings Promotional Technique Mean RatingsIn-store displays 4.52In-store signs 4.20in-store feature advertising 4.04price reductions 3.99In-store demonstrations/taste tests 3.91Packaging 3.85Free standing displays 3.83Waterfall displays 3.61Newspaper inserts 3.55Coupons 3.52Individual product stickers 3.49Cross Merchandising 3.42television advertising 3.38Providing educational material 3.32Shelf talkers 3.30Produce manager bulletin with marketing ideas,information and recipes 3.30Radio advertising 2.88

Additional Market Research Uses
Market research guides your communication with current and potential customers
Market research helps you identify opportunities in the marketplace.
Market research minimizes the risk of doing business.

Types of Market Research Focus groups Taste tests in-depth interviews Surveys - mail, telephone and
intercept

New Agribusiness Opportunities – First Step is Target Market Identification
Target Market – A segment of the population that is most likely to use your product or service.
Usually described using demographic variables like, Gender, Income, Race, Age
Used to: Determine market potential Develop product packaging Choose marketing channels Develop marketing mix and advertising strategy
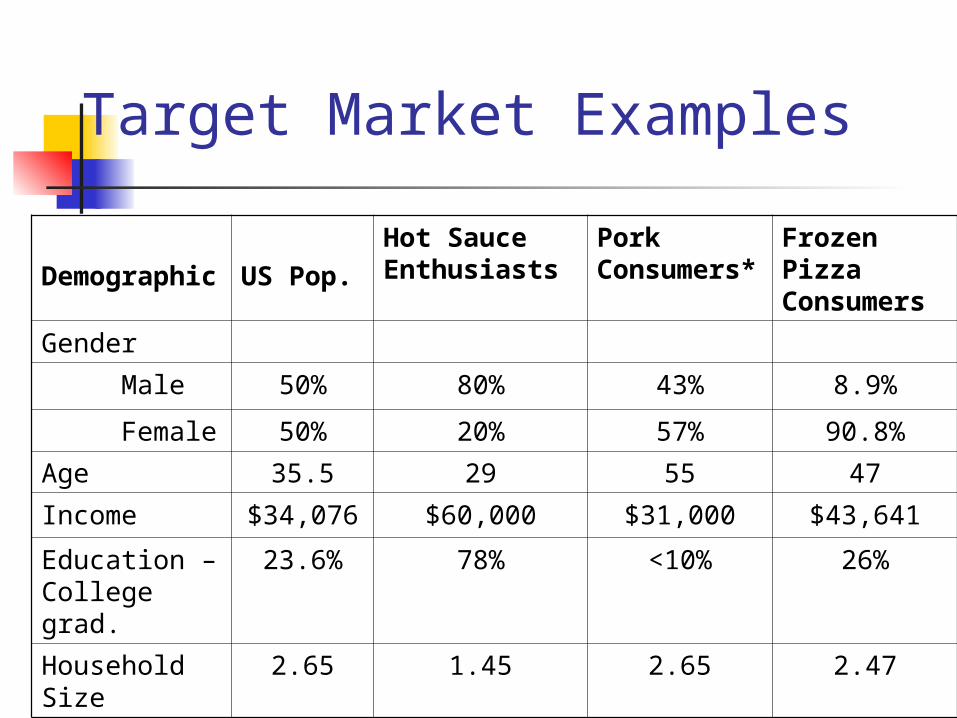
Demographic
US Pop.Hot Sauce Enthusiasts
Pork Consumers*
Frozen Pizza Consumers
Gender
Male 50% 80% 43% 8.9%
Female 50% 20% 57% 90.8%
Age 35.5 29 55 47
Income $34,076 $60,000 $31,000 $43,641
Education – College grad.
23.6% 78% <10% 26%
Household Size
2.65 1.45 2.65 2.47
Target Market Examples
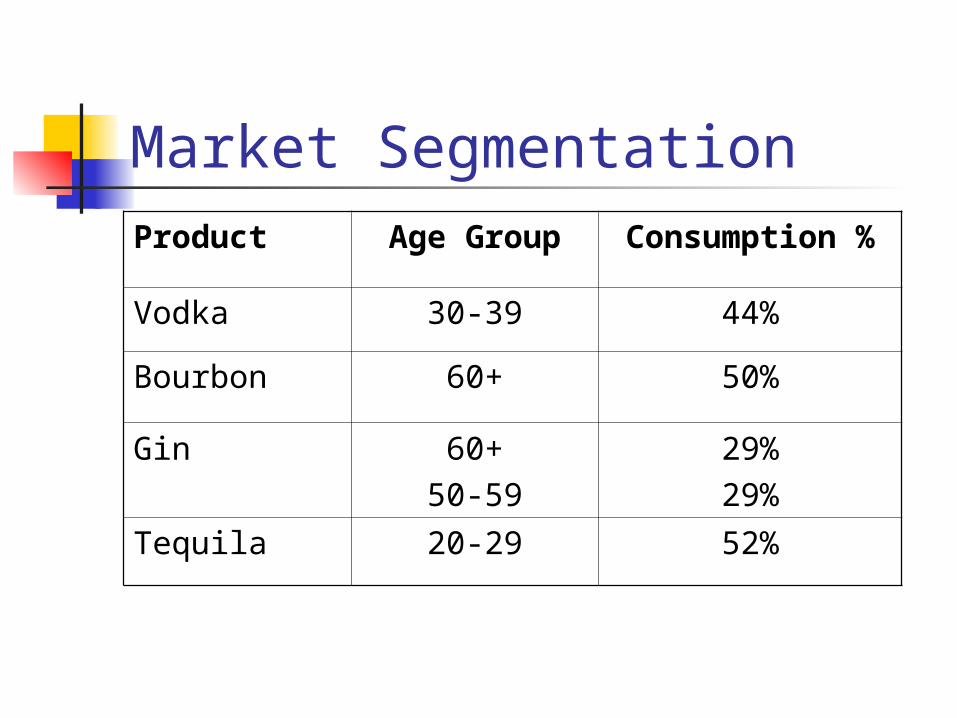
Market SegmentationProduct Age Group Consumption %
Vodka 30-39 44%
Bourbon 60+ 50%
Gin 60+50-59
29%29%
Tequila 20-29 52%
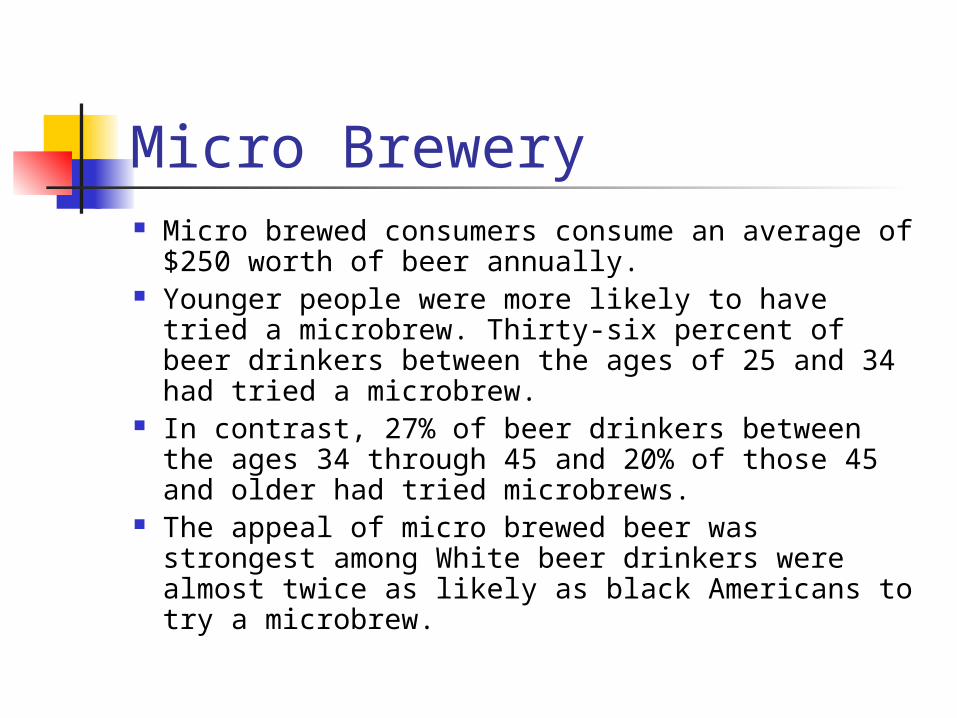
Micro Brewery Micro brewed consumers consume an average of $250
worth of beer annually. Younger people were more likely to have tried a
microbrew. Thirty-six percent of beer drinkers between the ages of 25 and 34 had tried a microbrew.
In contrast, 27% of beer drinkers between the ages 34 through 45 and 20% of those 45 and older had tried microbrews.
The appeal of micro brewed beer was strongest among White beer drinkers were almost twice as likely as black Americans to try a microbrew.
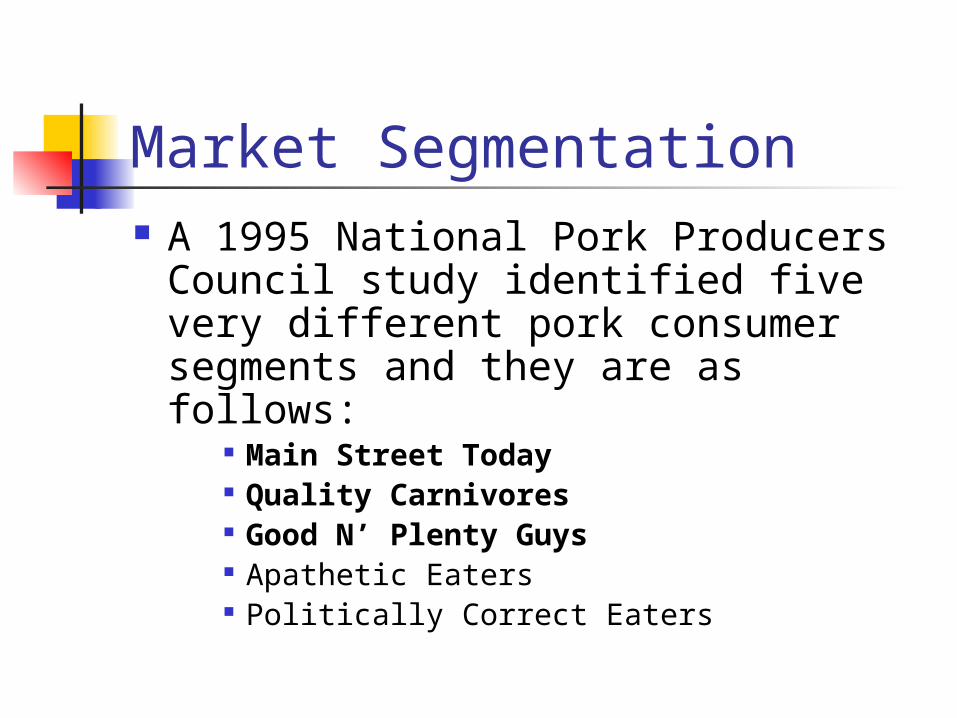
Market Segmentation A 1995 National Pork Producers
Council study identified five very different pork consumer segments and they are as follows:
Main Street Today Quality Carnivores Good N’ Plenty Guys Apathetic Eaters Politically Correct Eaters

Main Street Today Segment Main Street Today Largest segment of the population Consist of strong pork supporters. Very price sensitive- cost conscious shoppers. Purchasing decisions are price based rather than
product preference. • Women (57%)• Middle aged - (20%) being 50-59 years of age• Lowest income $31,000 median household income• Least educated – less than 10% have college degrees• Blue collar occupations• 19% widowed/divorced (more than the other five segments)• Average household size• Most non-white group (29% are African American or Hispanic)
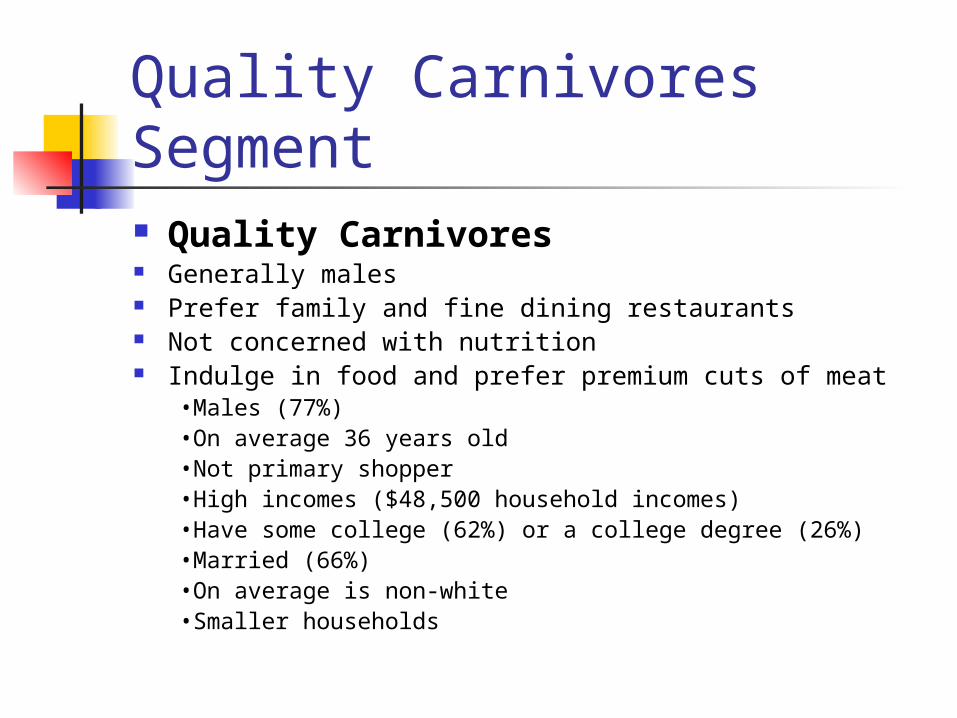
Quality Carnivores Segment Quality Carnivores Generally males Prefer family and fine dining restaurants Not concerned with nutrition Indulge in food and prefer premium cuts of meat
•Males (77%)•On average 36 years old•Not primary shopper•High incomes ($48,500 household incomes)•Have some college (62%) or a college degree (26%)•Married (66%)•On average is non-white•Smaller households
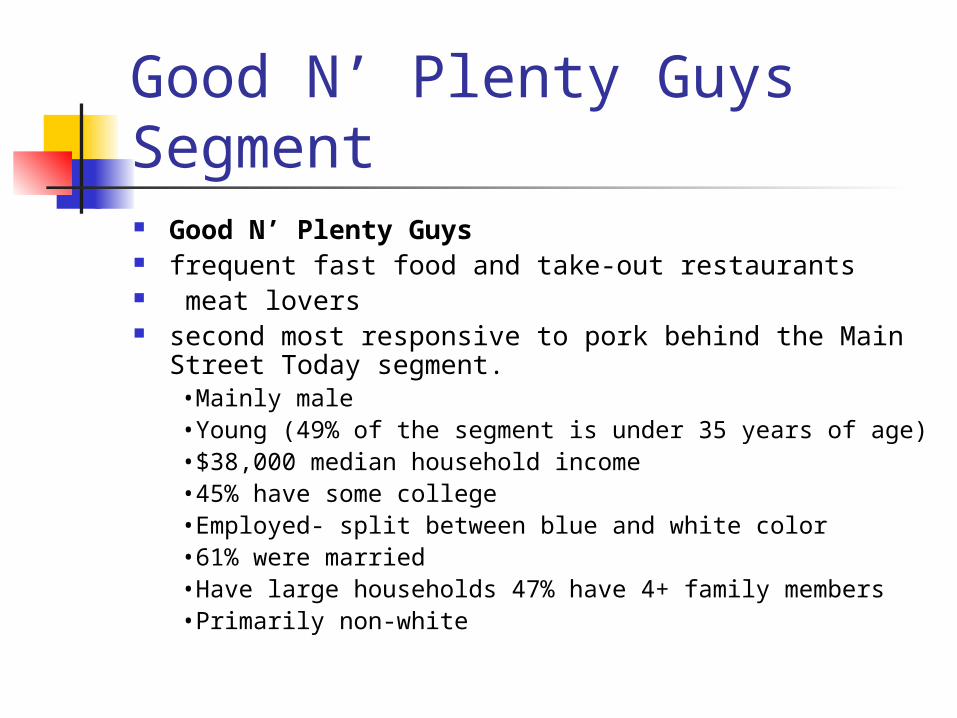
Good N’ Plenty Guys Segment Good N’ Plenty Guys frequent fast food and take-out restaurants meat lovers second most responsive to pork behind the Main Street
Today segment. •Mainly male•Young (49% of the segment is under 35 years of age)•$38,000 median household income•45% have some college•Employed- split between blue and white color •61% were married•Have large households 47% have 4+ family members•Primarily non-white
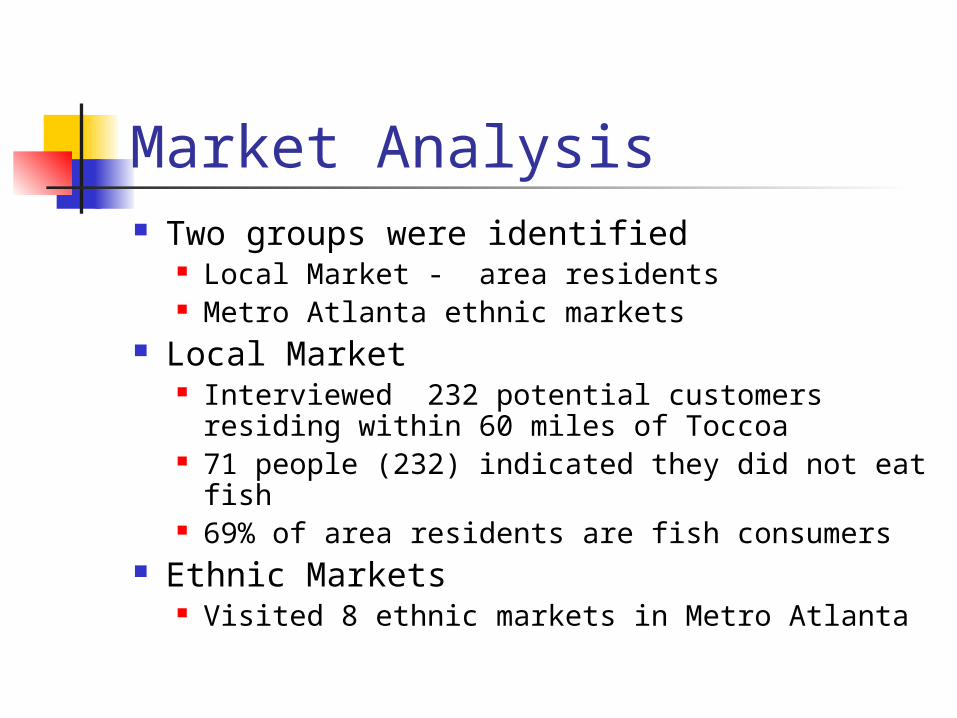
Market Analysis Two groups were identified
Local Market - area residents Metro Atlanta ethnic markets
Local Market Interviewed 232 potential customers residing
within 60 miles of Toccoa 71 people (232) indicated they did not eat fish 69% of area residents are fish consumers
Ethnic Markets Visited 8 ethnic markets in Metro Atlanta
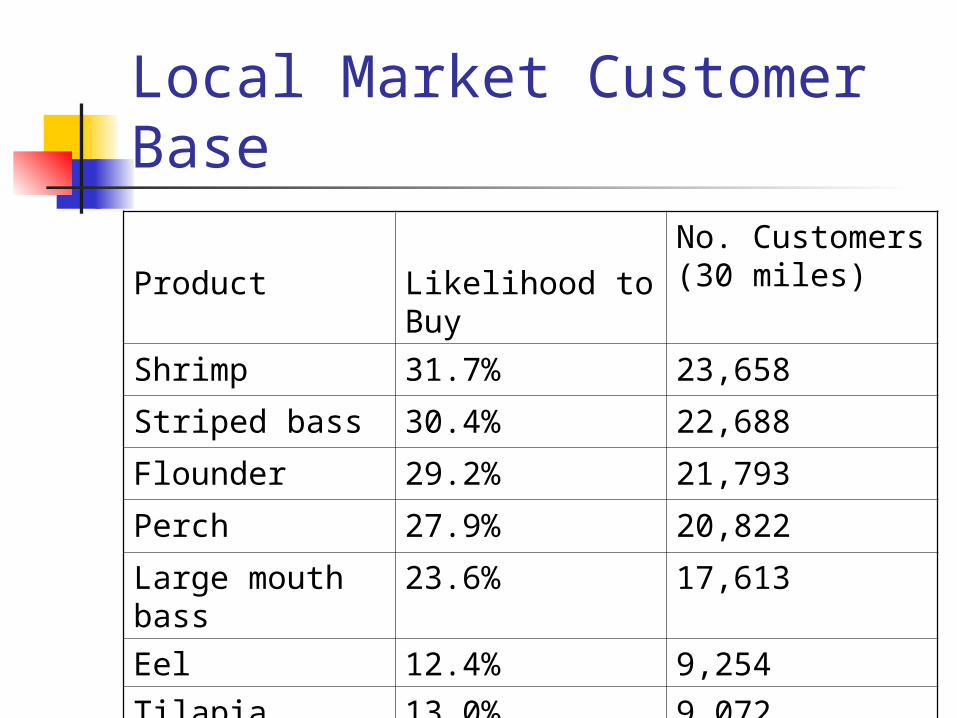
Local Market Customer Base
Product Likelihood to Buy
No. Customers (30 miles)
Shrimp 31.7% 23,658
Striped bass 30.4% 22,688
Flounder 29.2% 21,793
Perch 27.9% 20,822
Large mouth bass
23.6% 17,613
Eel 12.4% 9,254
Tilapia 13.0% 9,072
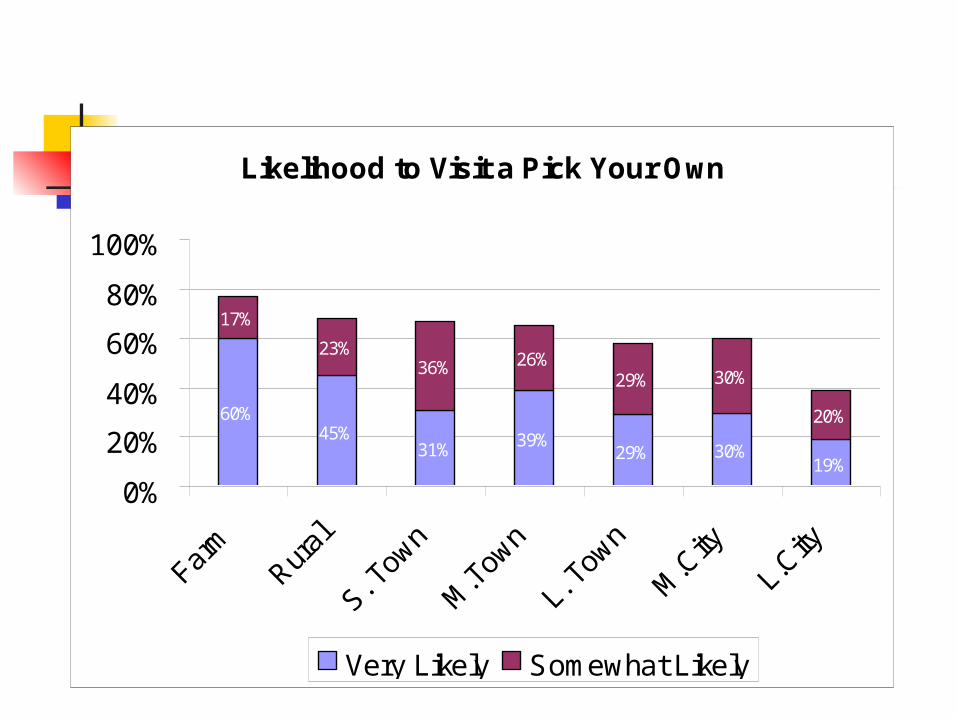
Likelihood to Visit a Pick Your Own
60%45%
31% 39%29% 30%
19%
17%
23%36% 26%
29% 30%
20%
0%
20%
40%
60%
80%
100%
Very Likely Somewhat Likely

Market Potential Market Potential – the maximum
sales opportunities achieved by all sellers in the market.
Sets the upper limit on consumption units
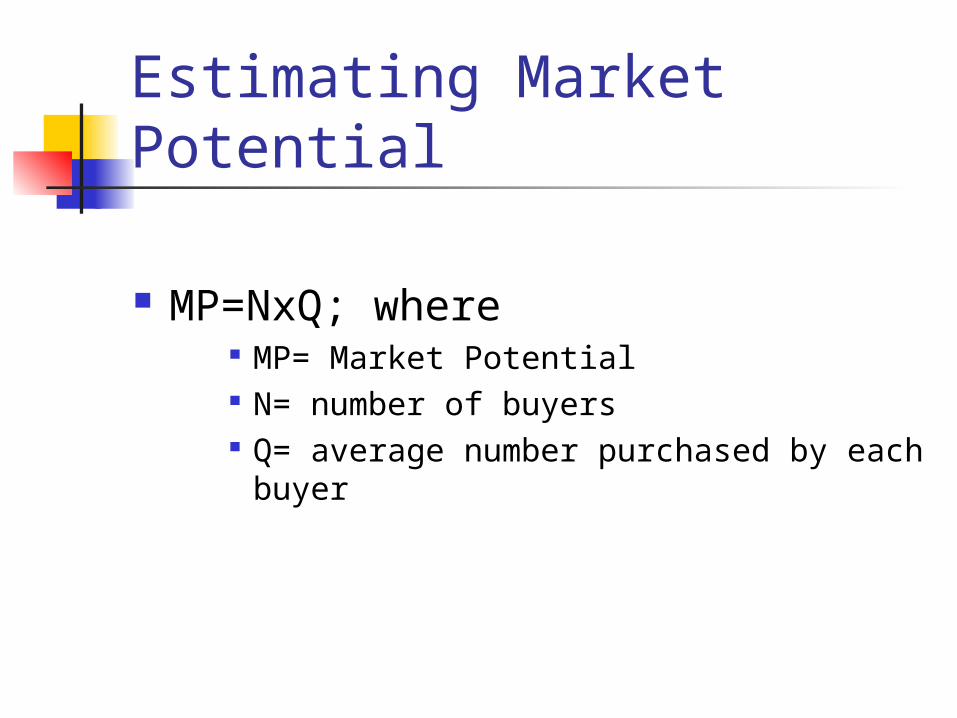
Estimating Market Potential
MP=NxQ; where MP= Market Potential N= number of buyers Q= average number purchased by each
buyer
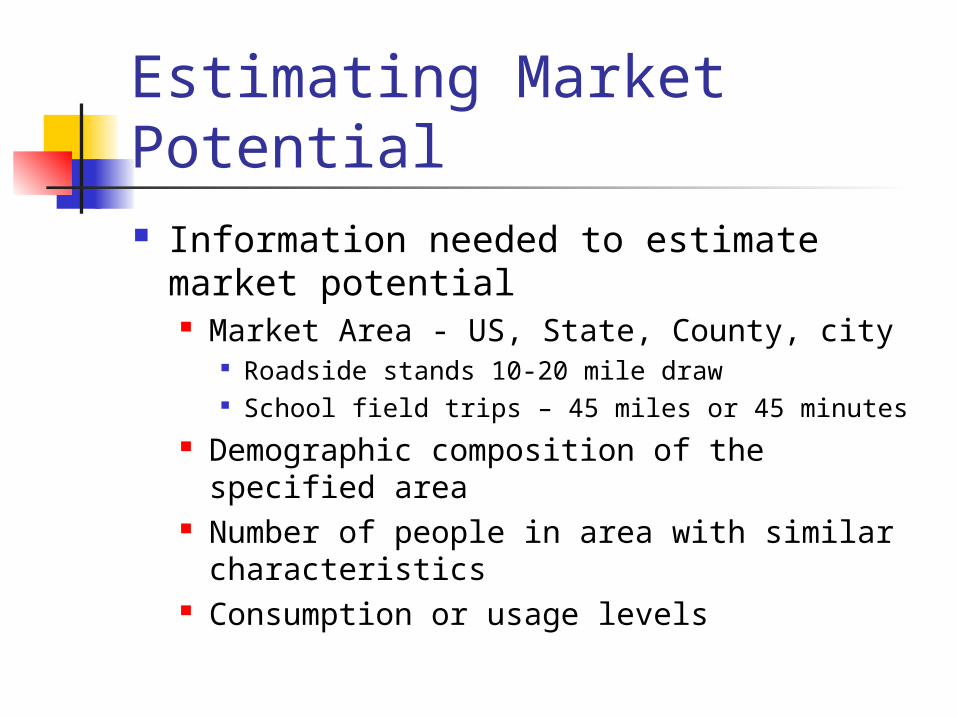
Estimating Market Potential Information needed to estimate market
potential Market Area - US, State, County, city
Roadside stands 10-20 mile draw School field trips – 45 miles or 45 minutes
Demographic composition of the specified area
Number of people in area with similar characteristics
Consumption or usage levels
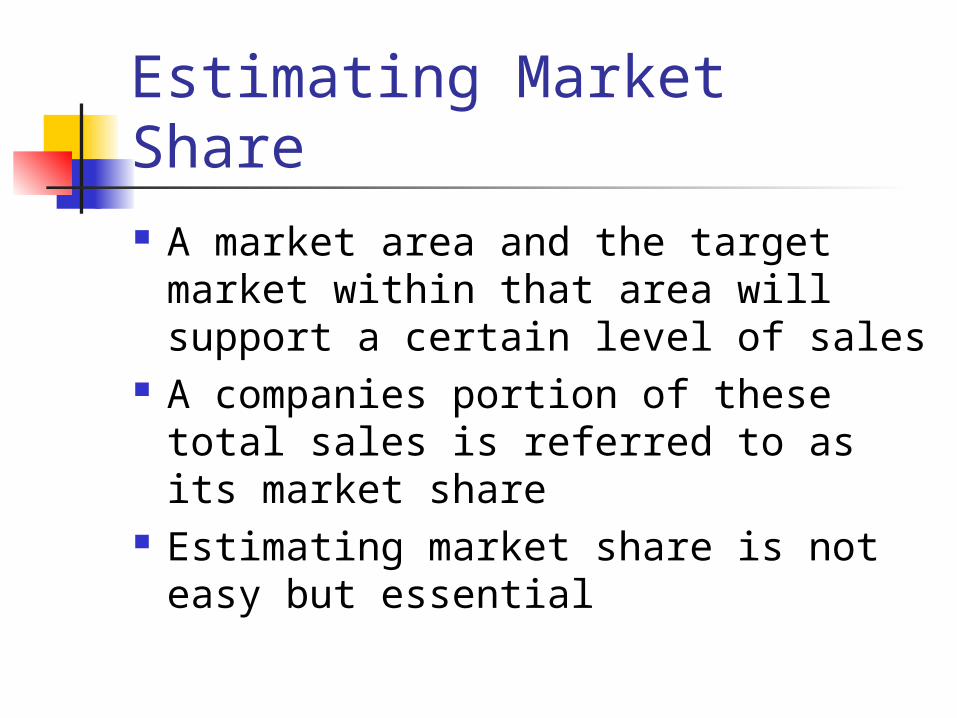
Estimating Market Share A market area and the target
market within that area will support a certain level of sales
A companies portion of these total sales is referred to as its market share
Estimating market share is not easy but essential
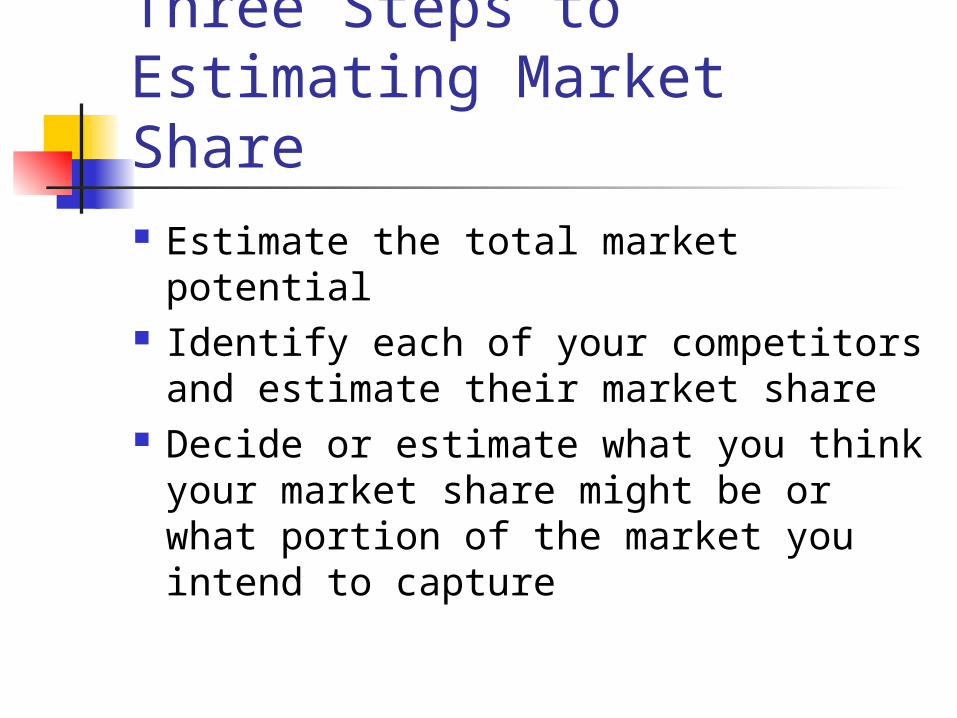
Three Steps to Estimating Market Share Estimate the total market potential Identify each of your competitors
and estimate their market share Decide or estimate what you think
your market share might be or what portion of the market you intend to capture

Example Market Share Calculation
Market share for new hot sauce to be marketed locally
A supermarket visit identified 10 sauce competitors
Market share data is not available, assume each product captures and equal share of the market (10%)
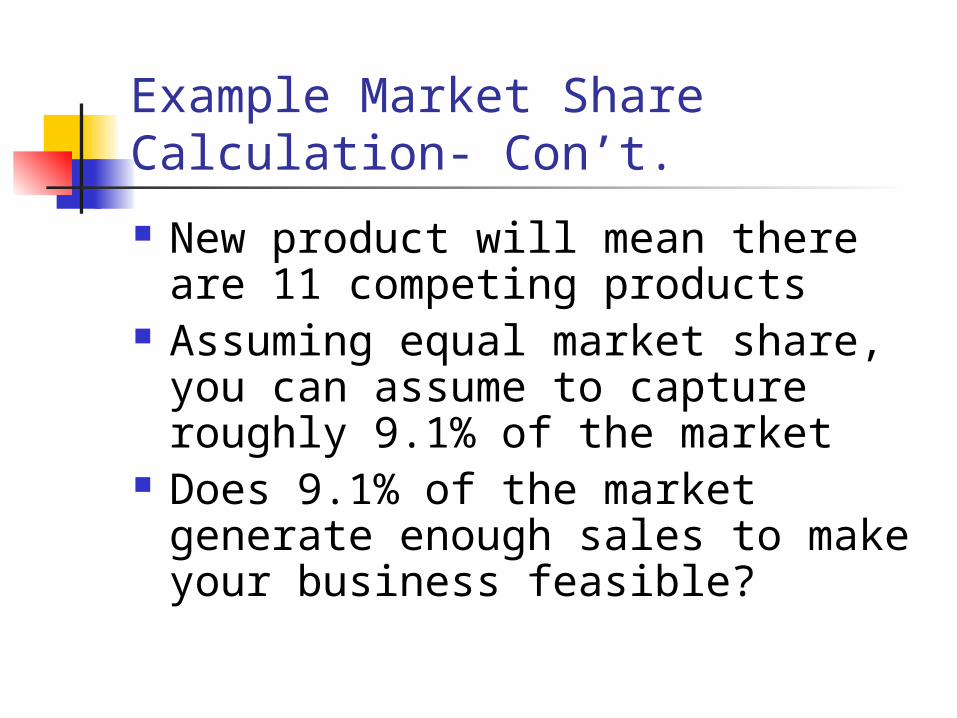
Example Market Share Calculation- Con’t.
New product will mean there are 11 competing products
Assuming equal market share, you can assume to capture roughly 9.1% of the market
Does 9.1% of the market generate enough sales to make your business feasible?

Estimated Retail Sales The potential retail sales for a specific retail operation
can be estimated by using a standard formula:ES= P x EXP x (ADI/MDI) x MS where
ES= Estimated Sales P= Trade Area population EXP= Average expenditures for retail outlet category ADI = Area Estimated Average Household Disposable
Income MDI = Georgia Average Household Disposable Income MS= Estimated Market Share
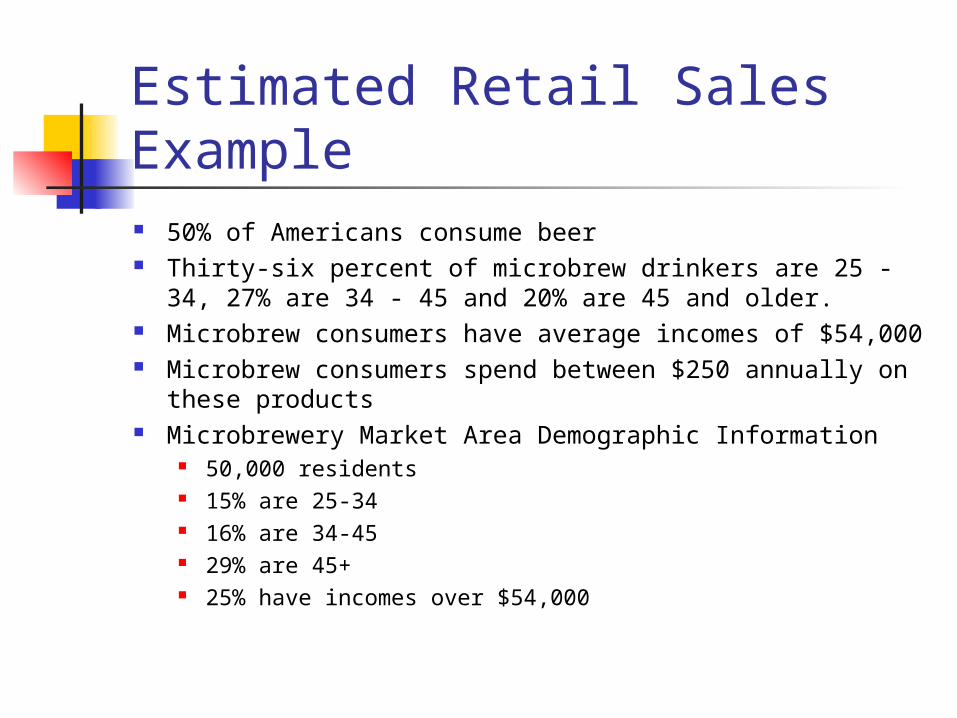
Estimated Retail Sales Example 50% of Americans consume beer Thirty-six percent of microbrew drinkers are 25 -34, 27% are 34 - 45
and 20% are 45 and older. Microbrew consumers have average incomes of $54,000 Microbrew consumers spend between $250 annually on these products Microbrewery Market Area Demographic Information
50,000 residents 15% are 25-34 16% are 34-45 29% are 45+ 25% have incomes over $54,000
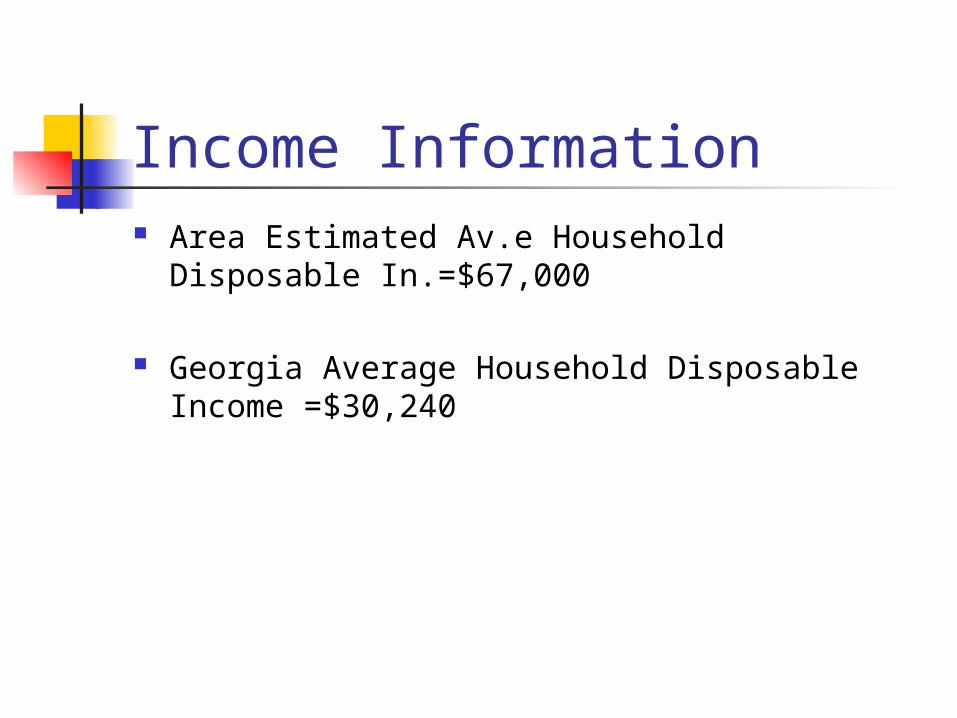
Income Information Area Estimated Av.e Household Disposable In.=$67,000
Georgia Average Household Disposable Income =$30,240

Trade Area Sales Estimate ES= P x EXP x (ADI/MDI) x MS P= 50,000 x 50% (percentage of beer drinkers) =25,000
25,000 x 15% = 3,750 25,000 x 16% = 4,000 25,000 x 29% = 7,250
15,000 37% of area residents have incomes over 50K 15,000 *37% = 5,550
EXP=$250 (ADI/MDI)=($67,000/$30,240) MS = Estimated Market Share = 10%
ES= 5,550 x $250 x ($67,000/30,240) x 10% = $307,416
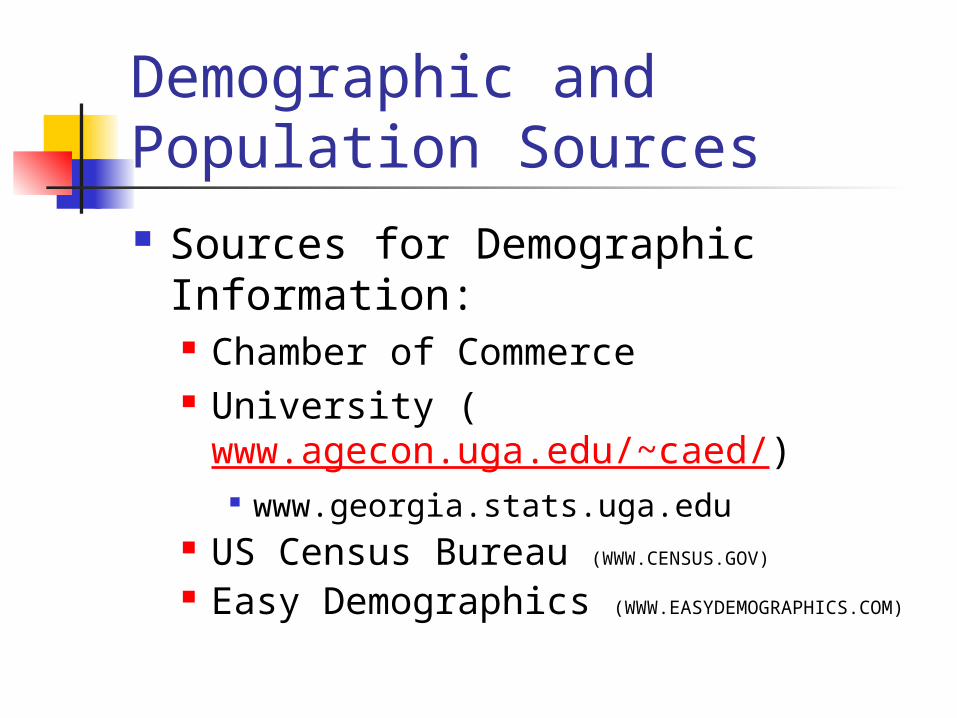
Demographic and Population Sources Sources for Demographic
Information: Chamber of Commerce University (
www.agecon.uga.edu/~caed/) www.georgia.stats.uga.edu
US Census Bureau (WWW.CENSUS.GOV)
Easy Demographics (WWW.EASYDEMOGRAPHICS.COM)

Easy Demographic Data (WWW.EASIDEMOGRAPHICS.COM)
Miles 20 15 10 Population: 82,683 59,644 36,409Households: 31,974 22,806 13,773 White Population: 77,003 56,126 34,497Black Population: 4,881 2,901 1,506 Asian Population: 623 473 307Hispanic Population: 719 518 275Median Age: 37.0 36.7
36.4 Med. HH Inc.($): $29,572 $30226 $32,214 Av. HH Inc. ($): $40,855 $41,877 $43,165
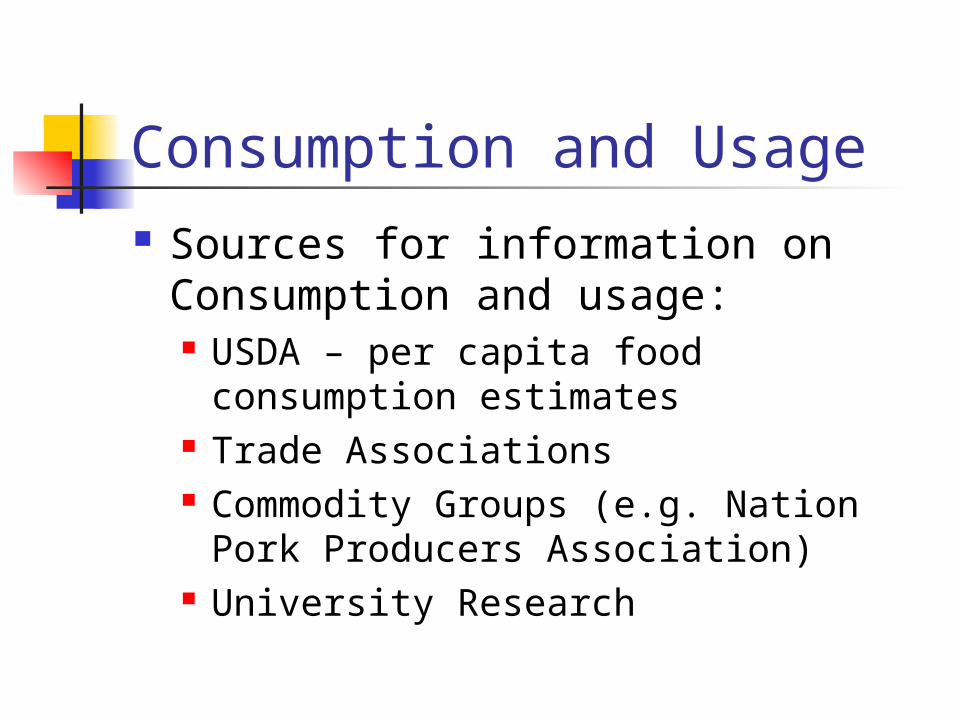
Consumption and Usage Sources for information on
Consumption and usage: USDA – per capita food consumption
estimates Trade Associations Commodity Groups (e.g. Nation Pork
Producers Association) University Research
Marketing
There is no “silver bullet” or formula for success
Marketing is more like an art than a science
What is Marketing? “Marketing is the process of
planning and executing the conception, pricing, promotion, and distribution of ideas, goods, and services to create exchanges that satisfy individual and organizational objectives.”
-American Marketing Association
What Exactly Does That Mean?
Marketing is...
All the actions you & your employees take that promote the sale of your products.
Building good relationships with your customers.
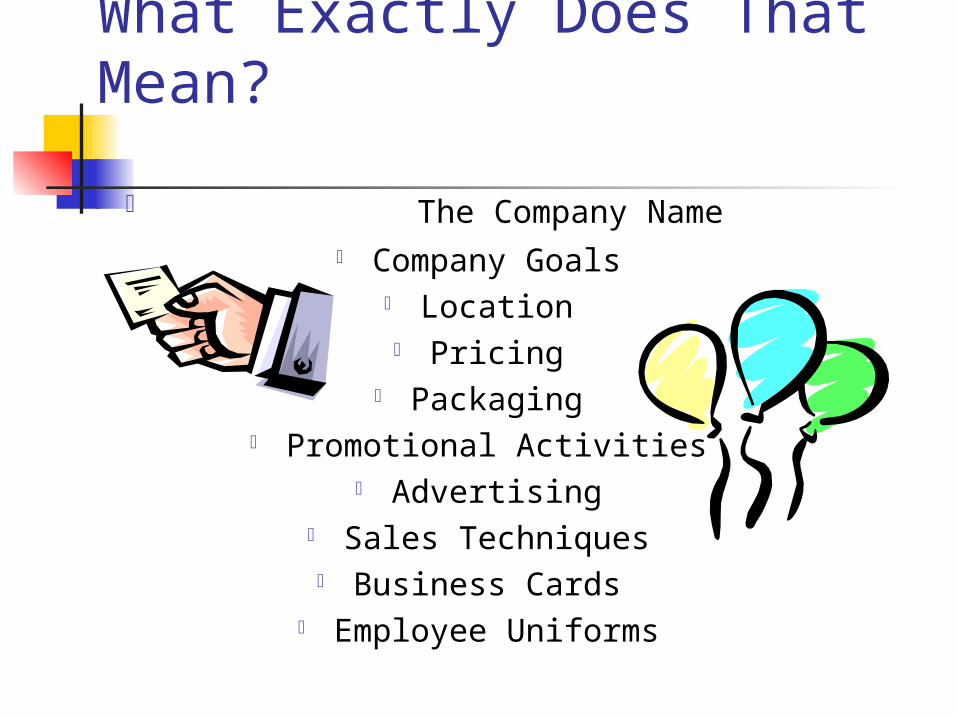
What Exactly Does That Mean?
The Company Name Company Goals
Location Pricing
Packaging Promotional Activities
Advertising Sales Techniques Business Cards
Employee Uniforms

The Goal of Marketing To present your products/services
to the market in a way that makes them more attractive than the products/services of
your competitors.
Advertising/Promotion Advertising – Delivers information Promotion – Involves generating
consumer response Publicity – inexpensive or free
advertising
Types of Advertising
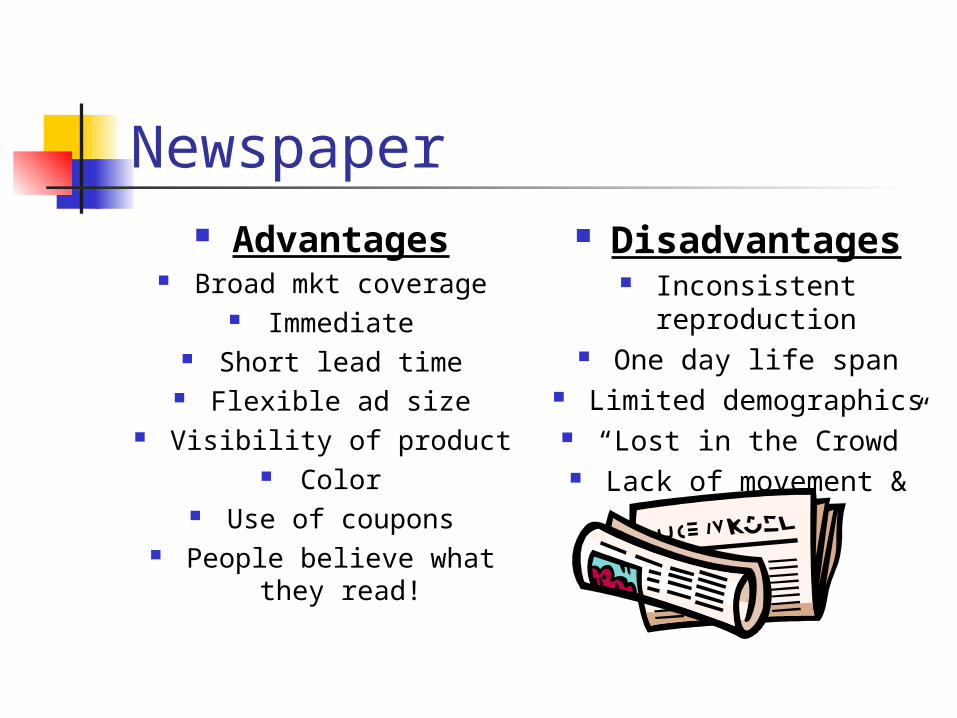
Newspaper Advantages
Broad mkt coverage Immediate
Short lead time Flexible ad size
Visibility of product Color
Use of coupons People believe what
they read!
Disadvantages Inconsistent
reproduction One day life span
Limited demographics “Lost in the Crowd”
Lack of movement & sound

Radio Advantages
Demographic selection High frequency
Immediate Sound reinforcement
Quick flexibility
Disadvantages Restrictive message
length Need for repetition Short recall factor
Cluttered placement

Television Advantages
Use of sight, sound, motion, & color
Mass coverage Immediate
Demographic selection
Disadvantages Short exposure
Expensive production Expensive to air
Cluttered placement Viewing time drops as
income increases
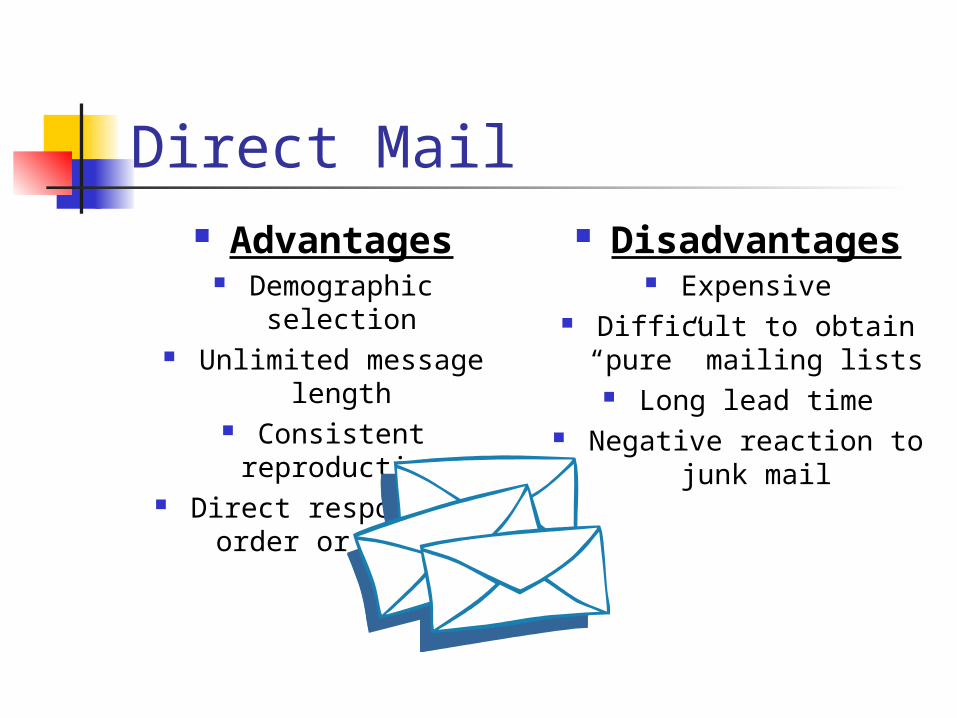
Direct Mail Advantages
Demographic selection Unlimited message
length Consistent reproduction
Direct response by order or coupon
Disadvantages Expensive
Difficult to obtain “pure” mailing lists Long lead time
Negative reaction to junk mail
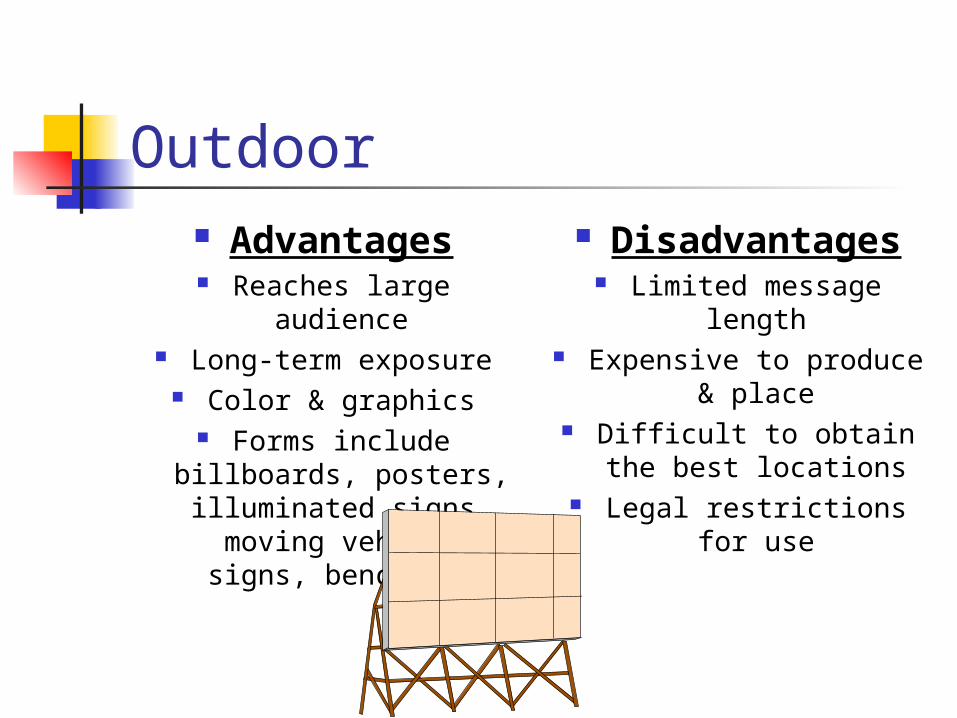
Outdoor Advantages
Reaches large audience Long-term exposure
Color & graphics Forms include billboards, posters, illuminated signs,
moving vehicle signs, bench ads
Disadvantages Limited message length Expensive to produce &
place Difficult to obtain the
best locations Legal restrictions for
use
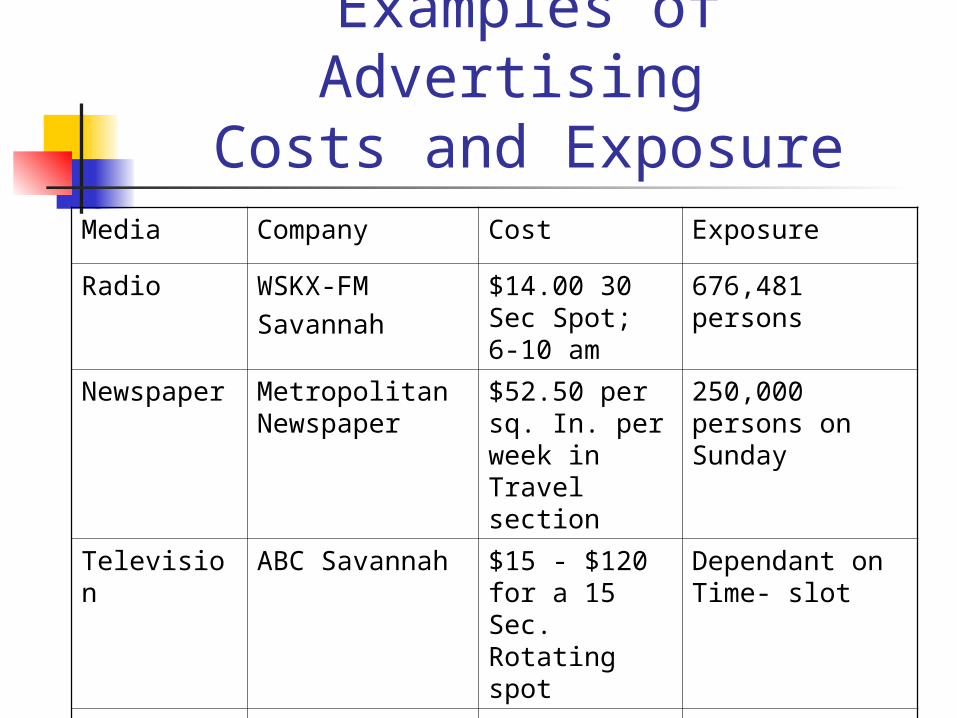
Examples of Advertising Costs and Exposure
Media Company Cost Exposure
Radio WSKX-FMSavannah
$14.00 30 Sec Spot; 6-10 am
676,481 persons
Newspaper Metropolitan Newspaper
$52.50 per sq. In. per week in Travel section
250,000 persons on Sunday
Television ABC Savannah $15 - $120 for a 15 Sec. Rotating spot
Dependant on Time- slot
Outdoor Lamar Bill board
$500-7,500 per month
Dependent on location
Direct Mail Your business 1.68/Contact Limited to mailing list
Signage is important Information that should be included on
your sign: Location Business hours Special Promotions Seasonal Products Other attractions
Sign should reflect the stands personality
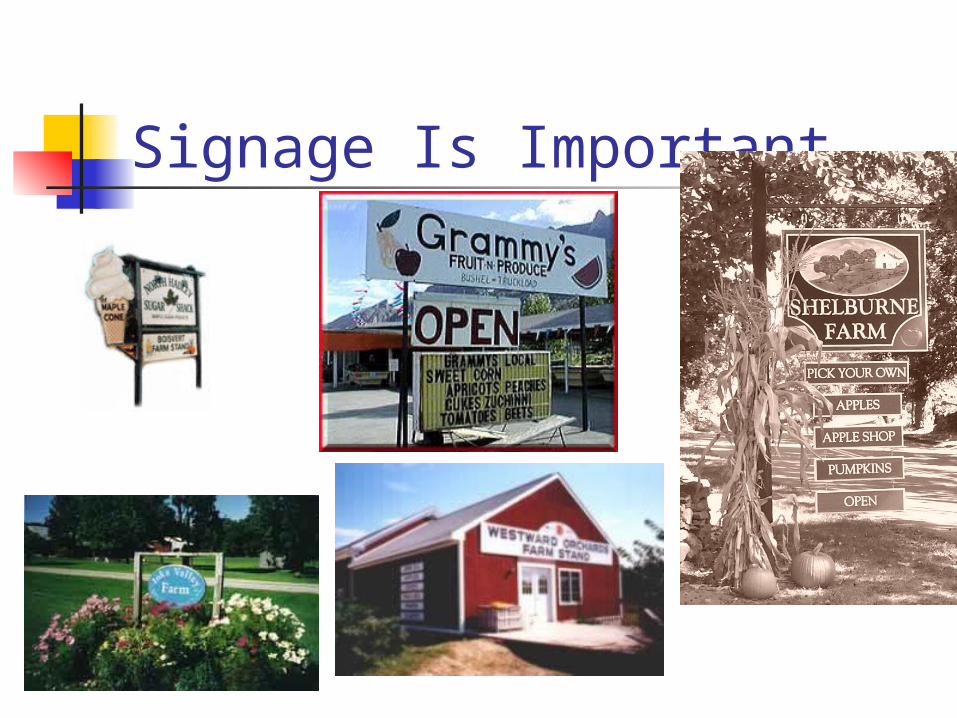
Signage Is Important

Words Read At Various Speeds
Number of Words at Speed
Distance(ft)
LetterWidth
(inches)
LetterHeight(inches)
30(mph)
40(mph)
50(mph)
60(mph)
50 d 1 ¾ 4 2 1 0
100 ¾ 3 ½ 8 5 4 3
200 1 d 7 15 11 8 6
300 2 3/16 11 22 16 13 10
400 2 f 14 30 22 17 14
500 3 ½ 17 ½ 38 28 22 18
Source: Should I Grow Fruits and Vegetables? Roadside Stands,” Loyd, Renee, M. and Daniel S.Tilley. Oklahoma State University Extension Service, Facts, No. 186.

Packaging Counts – Specialty Food Expert Have a beautiful product, including jar
and label Use expensive beautiful glass Go to trade shows to show product as
well as find out what the competition is doing
Make your product presentation count-90%of the purchases of these niche products is based on product presentation.
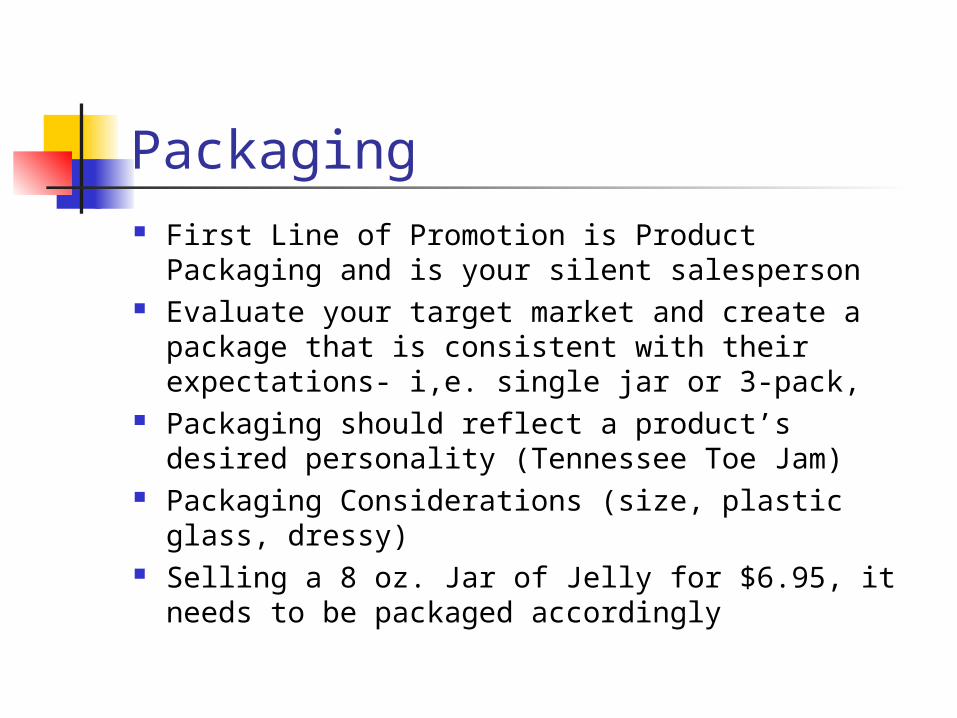
Packaging First Line of Promotion is Product Packaging and
is your silent salesperson Evaluate your target market and create a
package that is consistent with their expectations- i,e. single jar or 3-pack,
Packaging should reflect a product’s desired personality (Tennessee Toe Jam)
Packaging Considerations (size, plastic glass, dressy)
Selling a 8 oz. Jar of Jelly for $6.95, it needs to be packaged accordingly

Packaging Examples

Hot Sauce Packaging Examples
$6.95 (5 oz)$6.29 (5 oz) $7.59 (4 oz)

Jams and Jelly Packaging Examples
$4.50 (16 oz) $5.25 (10 oz)
$5.00 (9.9 oz)

Know Your Target Market Where and when does my target
market look for information What is the most effective means
of reaching my target market ? i.e., television, radio, print material, etc..
What type of packaging are they expecting

“Adding Value to Georgia’s Agricultural Economy Through Research and Extension”
www.agecon.uga.edu/~caed/
College of Agricultural & Environmental Sciences
Cente
r for
Ag
ribu
si
ness and Economic D
evelopment