Market Report GRP+CRP - avk-tv.de · GRP pipes and tanks manufactured using the centrifugal casting...
44
6 October 2014 Page 1/44 Composites Market Report 2014 Market developments, trends, challenges and opportunities The European GRP Market – Dr. Elmar Witten (AVK) The Global CRP Market – Thomas Kraus, Michael Kühnel (CCeV) October 2014
Transcript of Market Report GRP+CRP - avk-tv.de · GRP pipes and tanks manufactured using the centrifugal casting...
6 October 2014 Page 1/44
Composites Market Report 2014 Market developments, trends, challenges and opportunities The European GRP Market – Dr. Elmar Witten (AVK) The Global CRP Market – Thomas Kraus, Michael Kühnel (CCeV)
October 2014

6 October 2014 Page 2/44
Contents
The European GRP market in 2014 ......................................................................... 4
Market observations ................................................................................................. 5
Trends in the development of processes/components ......................................... 7
Application industries at a glance ........................................................................ 12
GRP production in 2014 by country ...................................................................... 13
Other composite materials .................................................................................... 15
Outlook .................................................................................................................... 16
The global CRP market .......................................................................................... 20
General .................................................................................................................... 20
Explanation of terms .............................................................................................. 21
The global carbon fibre market ............................................................................. 21
By manufacturer ................................................................................................. 22
By region ............................................................................................................ 24
By application ..................................................................................................... 25
The global carbon composites market ................................................................. 26
By matrix ............................................................................................................ 27
By manufacturing process .................................................................................. 29
By region ............................................................................................................ 30
By application ..................................................................................................... 31
Aerospace & defence .............................................................................. 31
Wind turbines ........................................................................................... 32
Sport/Leisure ........................................................................................... 34
Automotive ............................................................................................... 34
Trends and outlook ................................................................................................ 36
Aerospace & defence ......................................................................................... 36
Wind turbines ..................................................................................................... 38
Automotive ......................................................................................................... 39
Sport/Leisure ...................................................................................................... 40
Construction ....................................................................................................... 40
Final observations .................................................................................................. 41
Literature ................................................................................................................. 43

6 October 2014 Page 3/44 Dr. Elmar Witten
The European
GRP-market 2014
Author
Dr. Elmar Witten is Managing Director of the AVK - Industrievereinigung Verstärkte
Kunststoffe e.V. (Federation of Reinforced Plastics). The AVK, as the German professional
association for fibre composite plastics/composites, represents the interests of producers
and processors of reinforced plastics/composites on a national and a European level.
Its services include organisation of task forces, seminars and conferences as well as provid-
ing market relevant information (www.avk-tv.de).
The AVK is one of the four national pillars of the GKV – Gesamtverband
Kunststoffverarbeitende Industrie and an international member of the European composites
confederation EuCIA – the European Composites Industry Association.
The AVK is a foundation member of Composites Germany.
6 October 2014 Page 4/44 Dr. Elmar Witten
The European GRP market in 2014
Continued growth
The volume of glass fibre reinforced plastics (GRP) manufactured in Europe
will grow by over 2% in 2014. Growth has therefore stabilised in this segment,
which is by far the largest area of the fibre reinforced plastics and composites
industry. As the major applications for GRP components lie in transport and
construction – vital areas of the overall European economy – the trend for the
GRP market tends to mirror that of the European economy
The composites market is extremely heterogeneous not only in terms of com-
pany size and the processing techniques used in GRP production but also in
the types of components and products manufactured. There are also regional
differences: growth is above average in some European nations such as Ger-
many, the UK/Ireland and Eastern European countries. A number of southern
European countries have returned to growth – albeit slight – while a contrac-
tion is being observed in Scandinavian countries and France.
The dynamics of the market vary widely depending on the industry for which
the components are destined.
The European market trend cannot be separated entirely from the development
of the worldwide market because even the many small European GRP compa-
nies are participants in global developments. Cross-border considerations in-
creasingly affect decisions regarding procurement, production and sales. Even
though growth in Europe continues to lag behind the worldwide trend and the
European share of the global GRP market is becoming smaller, there are still
many opportunities for highly specialised European companies - even in a Eu-
rope characterised by slow growth.

6 October 2014 Page 5/44 Dr. Elmar Witten
Market observations
As in previous years, the European GRP market report 2014 is based on data for
those European countries, for which production figures can be recorded and validat-
ed. Turkish production is considered but (still) stated separately due to the lack of
data for long-term comparison.
In the following report, the term GRP refers to all glass fibre reinforced plastics with a
thermoset matrix as well as glass mat reinforced thermoplastics (GMT) and long fibre
reinforced thermoplastics (LFT). Data on the production of short fibre reinforced
thermoplastics is only available as an overall quantity and are stated separately.
The report also states the sizes of the markets for other reinforcing fibres (natural
and basalt fibres). Carbon fibre reinforced plastics (CRP) are dealt with separately in
the second section of this market report. GRP production in 2014: Overall develop-
ment
European GRP production enjoyed an excellent start to the year in 2014. The first six
months and especially Q1 exceeded the expectations of most market participants.
Although growth is expected to weaken slightly in the second half of the year, the
overall trend is one of continuous growth. The European market as a whole is ex-
pected to grow by over 2% to an estimated 1.04 million t (see Fig. 1).

6 October 2014 Page 6/44 Dr. Elmar Witten
Fig. 1: GRP production by volume in Europe since 2004 (in '000 tonnes)
(2014* = estimate)
Observers of the long-term trend for GRP will see that it tends to follow the pattern of
the general economy. This is hardly surprising as the largest buyers of GRP compo-
nents are in the transport and construction sectors, which play a major role in nation-
al economies. As Europe's gross domestic product (GDP) contracts as a share of
global GDP, the volume of GRP it manufactures as a percentage of worldwide GRP
production also continues to decline. Production and consumption are shifting per-
ceptibly towards the BRIC countries (Brazil, Russia, India, China) whose share of
global GDP is growing steadily. GRP production in Europe is expanding but failing to
keep pace with the worldwide trend.
In 2014, the European GRP market has returned to the absolute level of 2004 and
thus not yet regained the level it achieved before the financial and economic crisis.
However, the market trends vary widely depending on the type of manufacturing pro-
cess, the requirements of the corresponding application industries and even the spe-
cific European country in question. It is therefore vital to differentiate between these
in order to make a well founded assessment of the European trend (see below).
1.041 1.0651.132
1.195
1.058
815
1.0151.049
1.010 1.020 1.043
0
200
400
600
800
1.000
1.200
1.400
2004 2005 2006 2007 2008 2009 2010 2011 2012 2013 2014*

6 October 2014 Page 7/44 Dr. Elmar Witten
Trends in the development of processes/components
Fig. 2: GRP production volumes in Europe according to processes/components
(Kt = kilotonnes, 2014* = estimate)
2014* 2013 2012 2011 2010
Kt Kt Kt Kt Kt
SMC 190 184 188 198 198
BMC 74 71 70 69 69
∑ SMC/BMC 264 255 258 267 267
Hand lay-up 138 142 145 160 160
Spray-up 94 90 90 98 92
∑ Open mould 232 232 235 258 252
RTM 132 126 120 120 113
Sheets 84 84 78 77 72
Pultrusion 48 47 47 51 47
∑ Continuous processing 132 131 125 128 119
Filament winding 79 78 80 86 82
Centrifugal casting 66 66 67 69 66
∑ Pipes and Tanks 145 144 147 155 148
GMT/LFT 121 114 108 105 100
Others 17 18 17 16 16
Sum: 1.043 1.020 1.010 1.049 1.015
6 October 2014 Page 8/44 Dr. Elmar Witten
Thermosetting materials
SMC/BMC
After enduring a difficult 2013, the automobile industry has provided considerable
stimulus in 2014, which has benefited its suppliers and GRP manufacturers. Although
China is the largest growth market, there are positive developments in the car and
commercial vehicle sectors in Europe and especially in Germany, which is the lead-
ing market. These have not only boosted the number of vehicle registrations and
production volumes but also, and especially, the number of new orders received by
manufacturers of GRP components. Manufacturers of SMC (sheet moulding com-
pound) and BMC (bulk moulding compound) components, the overwhelming majority
of which are used in the automotive industry, have been among those to profit. As
well as its applications in the electronics industry, BMC is still overwhelmingly used to
manufacture headlamp reflectors. After the drop in SMC production last year and de-
spite competition from other materials – especially thermoplastics – the volume of
SMC/BMC grew by over 3% in 2014.
This is by far the largest area of the composites market and still accounts for over
one quarter of the total volume of GRP manufactured, yet it still receives very little
media attention in comparison, e.g. to the CRP market. European production in this
area alone is significantly larger than the global CRP market. Technologies for the
mass production of components using pressing (SMC) and injection moulding (BMC)
processes are mature and have been in operation for many years.
The use of carbon fibre in SMC manufacturing ("C-SMC") is considered promising by
industry experts. Even though the quantities produced are scarcely relevant at the
moment, a number of manufacturers are working hard to develop new applications
for the automotive and aviation sectors.

6 October 2014 Page 9/44 Dr. Elmar Witten
Open mould
Production of GRP using "open processes" has stagnated in 2014. The number of
components manufactured using hand lay-up techniques continues to fall. In con-
trast, good growth has been observed in the spray-up sector after the stagnation of
last year. The many small companies operating in these markets not only have to
compete with "closed processes" (e.g. RTM) but also, and importantly, with non-
European competitors. Production of individual, large area components has, to some
extent, shifted from Western Europe to Eastern Europe, the Middle East and Asia.
Little growth can be expected for these barely automated processes in high wage,
European countries in the near future. For many years, manufacturers of high quality
components have been battling with the damage to their image caused by poor quali-
ty products from "low cost suppliers", which have created deep-seated reservations
against GRP materials among their potential customers. Nevertheless, the peculiari-
ties and advantages of open mould processes have enabled them to retain a relative-
ly high share of the European market.
RTM
Growth in the production of RTM (resin transfer moulding) components has contin-
ued the trend of stronger than average growth (nearly 5%) observed last year. This
category includes all components manufactured using a closed mould although the
processes sometimes differ significantly (infusion and injection). The automobile in-
dustry, in particular, is working very hard to develop and refine these processes and
materials, although the volume of these components in series production remains
below that of, e.g. SMC. The advantages of this process compared to other technol-
ogies lie in the greater variability of process parameters as well as the option for us-
ing a wider variety of raw materials and even (dry) semi-finished products.
6 October 2014 Page 10/44 Dr. Elmar Witten
Continuous Processing
After enjoying relatively strong growth last year, European production of GRP using
"continuous processes" has stagnated in 2014. Panels are primarily produced for use
in vehicles, e.g. truck side panels, caravan bodies or the conversion of commercial
vehicles. The most significant applications for GRP pultrusion profiles are in the con-
struction sector, e.g. in the production of bridge elements, railing and ladder systems
or plant construction. Official approval procedures and a lack of standardisation have
hindered the widespread use of GRP composites in bridge construction in particular.
The continuous processing segment is characterised by its relatively high level of
automation. However, the processes of the relatively few manufacturers operating in
this sector are adapted very specifically to the requirements of the individual compa-
nies and dominated by in-house developments.
Pipes and tanks
GRP pipes and tanks manufactured using the centrifugal casting and filament wind-
ing processes are primarily used in the oil/gas and chemical industries. The Europe-
an market, which accounts for around one quarter of worldwide production, is stag-
nating. The market is dominated by a few large manufacturers not least because of
the relatively high quantities of material involved per order. Worldwide, the largest
five suppliers have a market share of approx. 75%. The industry sees significant
growth opportunities especially in pipes for water and waste water projects, although
the most dynamic markets in this sector are currently to be found outside Europe.
The potential is, of course, enormous because these projects involve millions of kilo-
metres of pipelines. In Germany, for example, many of the pipes used by the water
supply and wastewater disposal sector are in need of repair or replacement. In other
places, such as many Eastern European countries, these systems are still being built
and expanded.

6 October 2014 Page 11/44 Dr. Elmar Witten
Thermoplastic materials
GMT/LFT
Glass mat reinforced thermoplastics (GMT) and long fibre reinforced thermoplastics
(LFT) are still growing at an above average rate of over 6% in 2014. Like other pro-
cesses that primarily serve the automobile industry, companies in this sector have
been participating in and benefiting from the development of new applications as well
as the general market dynamic in Europe. Moreover, the substitution of components
previously made from thermosetting materials (e.g. SMC) offers the possibility of fur-
ther growth.
Over recent years, an increase in project and research activities has been observed
in this area in particular. The processing and use of thermoplastic, pre-impregnated
semi-finished materials with a specified fibre orientation is often considered a particu-
larly promising area of endeavour. These are processed, for example, using "tapes"
or belts which are laid automatically and with a load-conforming alignment. In addi-
tion, many researchers are working on ways to process large surface area, semi-
finished materials known as "organosheets". Considerable testing has already been
taken place, for example, on overmoulding pre-formed, semi-finished products within
a tool.
Short fibre reinforced thermoplastics
The large market segment of short fibre reinforced thermoplastics must be mentioned
in addition to the quantities of GMT/LFT stated in the GRP figures in this section of
the market report. At approx. 1,160 kt, the European market for thermoplastic, glass
fibre reinforced compounds in 2013 was somewhat larger than the market for the
GRP products that are the major focus of this report (thermosetting materials plus
GMT/LFT) during the same period. Production volumes in this segment are growing
significantly faster at around 5% per year due to the high level of automation (injec-
tion moulding processes) (Source: AMAC). The majority of applications for these
compounds, which are primarily based on polyamide and polypropylene, are to be
found in the transport sector as well as the electro/electronic and sport/leisure seg-
ments.
6 October 2014 Page 12/44 Dr. Elmar Witten
Application industries at a glance
Despite the slightly different trends observed in the markets for the various manufac-
turing processes, the proportions of GRP used by the major application industries in
Europe remain constant. The transport and construction sectors each consume one
third of total production. Other application industries include the electro/electronics
sector and the sport and leisure segment (see Fig. 3).
The transport sector includes not only road vehicles (cars and commercial vehicles)
but also railway locomotives and rolling stock, boats and aircraft. Lightweight con-
struction solutions, which are required above all to meet official CO2 emission stand-
ards, continue to be the principal market driver in vehicle construction. The produc-
tion of components for wind turbines – a market driven principally by political deci-
sions – is included in the figures for the construction sector. The number of offshore
wind energy projects still awaiting planning approval and the many opportunities for
onshore repowering suggest that the potential of this area is far from exhausted even
for participants in the European market.
It is, of course, also important to differentiate between the aspects of added value –
not explicitly a focus of this report – and volume for the specific applications. Added
value tends to be lower in the construction and electro/electronics sectors. However,
even within the construction sector, it can be quite high in some areas, e.g. wind tur-
bines. In the transport sector, added value is higher relatively than in other segments
– and considerably so in the area of aircraft construction.

6 October 2014 Page 13/44 Dr. Elmar Witten
Fig. 3: GRP production in Europe for different application industries (year: 2013)
GRP production in 2014 by country
Fig. 4 clearly shows that there is no uniform market trend throughout Europe. There
are regions with above average growth but also others that are contracting. The key
growth factors are the state of the national economy of the country in question and
the trends for the major GRP applications used in that country.
The continuous, above average growth in Germany, UK/Ireland as well as in Eastern
European countries has stabilised. As recently as 2009, Germany was the third-
largest producer of GRP in Europe. It climbed to the No. 2 spot in 2010 and – with
the currently fastest growing economy in Europe – has been the No. 1 in the compo-
sites industry since 2012. This trend is principally supported by the automotive indus-
try in Germany and by the construction sector in the UK. Eastern European compo-
sites markets are driven by a variety of different factors and forces, frequently major
GRP orders in the areas of pipe and plant construction.
35%
15%34%
15%1%
Transport Electro / Electronic
Construction Sports & Leisure
Others

6 October 2014 Page 14/44 Dr. Elmar Witten
For the first time, there has been a slight increase in GRP production volume in
Spain, Portugal and Italy. However, French output has fallen once again. These de-
velopments are due to shifting trends in the core industries in these countries, such
as the automotive and boatbuilding sectors as well as construction and infrastructure
projects. In the former group of countries, there are currently numerous indications of
economic growth, albeit at a very low level. The effects of this are also benefiting the
GRP industry.
The smaller markets of the Benelux countries, Austria and Switzerland are stable or
growing slightly at a low absolute level.
According to the Turkish composites Association TCMA, the sector in Turkey once
again experienced above average growth of nearly 5% (source: TCMA). The Turkish
market has been included (separately) in this market report since 2011. The Turkish
GRP market is therefore still larger than that of Germany. The major application in-
dustries are entirely different from those of European countries. Pipes and tanks for
infrastructure projects account for around 50% of GRP production. This is due to two
main factors: firstly, there is great potential for construction of new plants; secondly,
decision-makers are much less sceptical of GRP materials than those in other coun-
tries. Other projects in the construction sector make up 20% of the market and the
transport segment a comparatively low 18%.

6 October 2014 Page 15/44 Dr. Elmar Witten
Fig. 4: GRP production volumes in Europe – and Turkey – itemised by country/group of countries
(Kt = kilotonnes / 2014* = estimated / Eastern Europe** = Poland, Czech Republic, Hungary, Roma-nia, Serbia, Croatia, Macedonia, Latvia, Lithuania, Slovakia and Slovenia / Turkey*** = Source: TCMA)
Other composite materials
2014* 2013 2012 2011 2010
Kt Kt Kt Kt Kt
UK / Ireland
146 140 134 126 130
Belgium / Netherlands / Lux-embourg 43 42 43 42 40
Finland / Norway / Sweden / Denmark 42 44 44 52 50
Spain / Portugal 154 152 160 200 217
Italy 148 146 152 165 154
France 108 112 117 122 116
Germany 200 192 182 172 161
Austria / Switzerland 18 17 17 17 16
Eastern Europe** 184 175 161 153 131
Sum: 1.043 1.020 1.010 1.049 1.015
Turkey*** 225 214 195 180

6 October 2014 Page 16/44 Dr. Elmar Witten
GRP are by far the largest group of materials in the composites industry. Glass fibres
are used for reinforcement in over 95% of the total volume of composites (short and
long fibres, rovings, mats …).
Europe is expected to manufacture 2.2 million tonnes of glass fibre reinforced plas-
tics in 2014 with global composites production forecast to exceed 8.5 million tonnes
during this period. Of these, the GRP products studied in detail in this report will ac-
count for 1.04 million t and short fibre reinforced thermoplastics for the remaining
1.16 million t.
Worldwide demand for carbon fibre reinforced plastics (CRP) is estimated at 79,000 t
in 2014 (see the second section of this market report).
92,000 t of components made from natural fibre reinforced plastics, mostly used in
the automotive sector, were manufactured in the EU in 2012. 260,000 t of "wood
plastic" composites were produced in the EU. Germany is by far the largest market
for these products. Biocomposite materials as a whole thus account for approx. 15%
of the volume of composites manufactured in Europe (Source: nova-Institut GmbH).
Interest in basalt fibre reinforced composites is growing for high-performance applica-
tions. Properties such as low electrical conductivity and high thermal stability with a
good price/performance ratio make these materials particularly attractive although
global manufacturing capacity is still many times smaller than that of carbon fibre.
Despite a long history, basalt fibre has not yet been able to gain significant market
share.
Outlook
For the composites industry as a whole, the market currently presents a number of
challenges. The following are also and especially relevant to GRP manufacturers:

6 October 2014 Page 17/44 Dr. Elmar Witten
Thermoplastic materials
Industrial companies see great potential in thermoplastic materials and are investing
accordingly in their future. Consequently, thermoplastics are currently attracting
greater attention in the market than thermosetting materials. Researchers are par-
ticularly interested in material innovations for structural thermoplastic composites. In
the area of series production, it is likely that developments will concentrate more on
thermoplastic than on thermosetting materials. The forming of thermoplastic semi-
finished products and, above all, the overmoulding of continuous structures are just
two examples.
New processes and partnerships for automation:
Machinery manufacturers, in particular, have also identified and committed them-
selves to composites as a key trend of the future. This is due, not least, to well-
publicised flagship projects in the transport and aviation sectors. Recently, it has
been noted that larger companies with greater investment capacity are entering the
market, which smaller companies are unable to access. Large industrial companies
are systematically seeking out new partners, often large companies in their own right.
Project demands frequently exceed the expected financial capabilities of smaller
partners. New processing techniques or combinations of different technologies are
being created, which have until now been common in the plastics processing which
does not process composites.
Hybrid materials
Finding ways to combine different materials remains a major challenge for the future.
Developers and industry are increasingly working on solutions that are based not on
single materials but on efficient and elegant combinations.

6 October 2014 Page 18/44 Dr. Elmar Witten
Expansion into additional applications:
Over recent years, composites have succeeded repeatedly in finding new applica-
tions. For example, the specific requirements of the construction sector offer many
opportunities. Standardisation is currently gaining greater attention within the compo-
sites industry with the aim of permanently opening up the potential of previously un-
explored application segments.
6 October 2014 Page 19/44 Thomas Kraus & Michael Kühnel
The global CRP market 2014
CCeV and the authors
Thomas Kraus and Michael Kühnel are project architects at Carbon Composites e.V.
(CCeV) and took over from Bernhard Jahn as the authors of the CCeV market report
in 2014.
Carbon Composites e.V. (CCeV) is an association of companies and research insti-
tutes in Germany, Austria and Switzerland for the entire value-added chain of high
performance fibre composite materials. It plays an important role in networking scien-
tific research and businesses.
CCeV sees its role as a network of competence for promoting the application of fibre
composites with a focus on "marketable high performance fibre composite struc-
tures". The emphasis is on fibre composite structures with plastic matrix materials,
familiar to the wider public in many applications, as well as on fibre composite struc-
tures with ceramic matrices, which have higher resistance to temperature and wear,
and high performance fibre composites for the construction industry.

6 October 2014 Page 20/44 Thomas Kraus & Michael Kühnel
The global CRP market
General
The composites market report produced by Carbon Composites e.V. (CCeV) and the
AVK has appeared annually since 2010 and is now in its fifth year of publication. The
report is also steadily winning recognition beyond the borders of the German-
speaking world. With 251 members (date: August 2014), the CCeV represents a sig-
nificant number of companies, research institutes and organisations operating in the
carbon fibre (CF) and carbon composites (CC) sectors in Germany, Austria and Swit-
zerland.
In the CF market, for example, CCeV members include SGL, Toray, TohoTenax,
Cytec and Hexcel who were responsible for approx. 53% of global production in 2013
and an annual CF production capacity of 55,200 tonnes. These figures underline the
international influence of the CCeV's membership. The information in this report is
drawn from various sources including data provided by CCeV members. This has
been supplemented and checked against current market data from reports produced
by Lucintel [1] and Acmite [2], among others.

6 October 2014 Page 21/44 Thomas Kraus & Michael Kühnel
Explanation of terms
Some reports do not provide information about the methods used to calculate the
averaged growth rates that are stated in these reports. Sometimes these methods
are confused. In order to ensure transparency in this report, we have included the list
below, which presents the most commonly used growth rates and the methods used
to calculate them:
• Averaged Annual Growth Rate (AAGR) = Arithmetic Mean Return (AMR) =
arithmetic mean of n annual growth rates (AGR):
����(��, ��) = ���(��) + ���(��) + ⋯+ ���(��)� = 1�����(��)
�
���
• Compound Annual Growth Rate (CAGR) = annual growth rate between n
years assuming constant growth in percentage terms:
����(��, ��) = ��(��)�(��)��� − 1 ↔ �(��) = �(��)(1 + ����)�
The growth rates stated in this market report are always calculated using the CAGR
method as these better reflect exponential growth relationships when the market
growth rates are constant. Consequently, the trend lines shown in the following
graphics are also based on exponential curves.
The global carbon fibre market
The 2014 edition of the market report will continue to look at the development of the
global carbon fibre market as it has done over recent years (Fig. 1). At 46,500
tonnes, actual global demand for carbon fibre in 2013 was somewhat lower than es-
timated in last year's market report. Consumption was 6.9% higher than 2012 and
has grown by a total of 47.6% compared to 2008 – this corresponds to an annual
growth rate of 8.1%. If we take 2009, the year after the financial crisis, as the base
year (26,500 t), the annual growth rate calculated is even higher at 15.1%. According
to Acmite, global revenues for the carbon fibre market in 2013 totalled US$1.77 bil-
lion. In 2012, this figure was US$1.63 billion [2].

6 October 2014 Page 22/44 Thomas Kraus & Michael Kühnel
If we look at the development of carbon fibre demand over the last few years (Fig. 1),
we can see that the market has enjoyed steady and continuous growth since the
general economic recession in 2009. During this period, demand for carbon fibre
grew from 26,500 t in 2009 to 46,500 t in 2013 with high annual growth rates starting
at an initial level of over 20% and easing to a current level of nearly 7%. This corre-
sponds to approx. US$1.7 billion on the revenue side [1].
Fig. 1: Global demand for carbon fibre in 1,000 tonnes 2008 – 2020 (*estimate). [1] [2]
The demand forecast provided in the last market report for the next few years has
been revised downwards slightly due to the availability of new and more up-to-date
data. However, it still anticipates high annual growth rates of around 10% until 2020.
By manufacturer
Between 2011 and 2013 all the leading manufacturers of carbon fibre expanded their
production capacity dramatically in order to cope with the continuously growing global
demand. In addition, new capacity was built – especially in Russia, South Korea and
India. Excess capacity of 41% is being reported for 2013 for carbon fibre based on
polyacrylnitrile (PAN) [1]. Consequently, the market leaders barely installed any addi-
tional production capacity in 2013 and the first half of 2014. This is probably due to
the presence of unutilised existing capacity.

6 October 2014 Page 23/44 Thomas Kraus & Michael Kühnel
Fig. 2 shows the carbon fibre production capacities of various manufacturers. Over-
all, the carbon fibre market is concentrated in the hands of 10 market leading fibre
manufacturers, who controlled over 91% of production capacity in 2013.
In March 2014, Toray completed its acquisition of Zoltek and thus significantly ex-
tended its market leading position [3]. SGL has also announced that it will expand its
annual production capacity. SGL and BMW invested US$100 million in a joint project
and increased capacity at the Moses Lake facility in the USA from 3000 to 6000 t [4].
Fig. 2: CF capacities by manufacturer in 1,000 tonnes. (2013)
As these production lines were not yet operational at the time of writing this market
report, they have not yet been included in this overview of manufacturers. In 2014,
the theoretical total production capacity is around 101,200 t of PAN-based carbon
fibre. In Japan, the USA and China, carbon fibres are also manufactured using pitch
as the precursor material. The total capacity for this method is around 3,400 t per
year.
6 October 2014 Page 24/44 Thomas Kraus & Michael Kühnel
By region
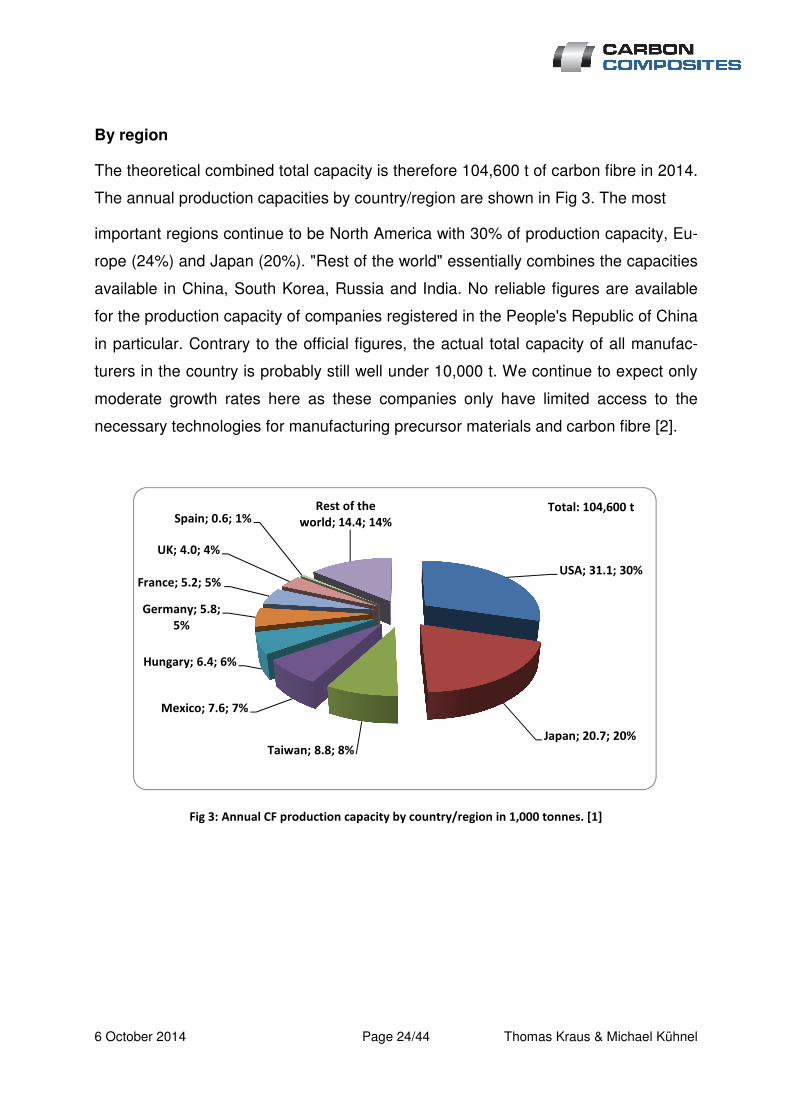
The theoretical combined total capacity is therefore 104,600 t of carbon fibre in 2014.
The annual production capacities by country/region are shown in Fig 3. The most
important regions continue to be North America with 30% of production capacity, Eu-
rope (24%) and Japan (20%). "Rest of the world" essentially combines the capacities
available in China, South Korea, Russia and India. No reliable figures are available
for the production capacity of companies registered in the People's Republic of China
in particular. Contrary to the official figures, the actual total capacity of all manufac-
turers in the country is probably still well under 10,000 t. We continue to expect only
moderate growth rates here as these companies only have limited access to the
necessary technologies for manufacturing precursor materials and carbon fibre [2].
Fig 3: Annual CF production capacity by country/region in 1,000 tonnes. [1]
USA; 31.1; 30%
Japan; 20.7; 20%Taiwan; 8.8; 8%
Mexico; 7.6; 7%
Hungary; 6.4; 6%
Germany; 5.8;
5%
France; 5.2; 5%
UK; 4.0; 4%
Spain; 0.6; 1%Rest of the
world; 14.4; 14%Total: 104,600 t
6 October 2014 Page 25/44 Thomas Kraus & Michael Kühnel
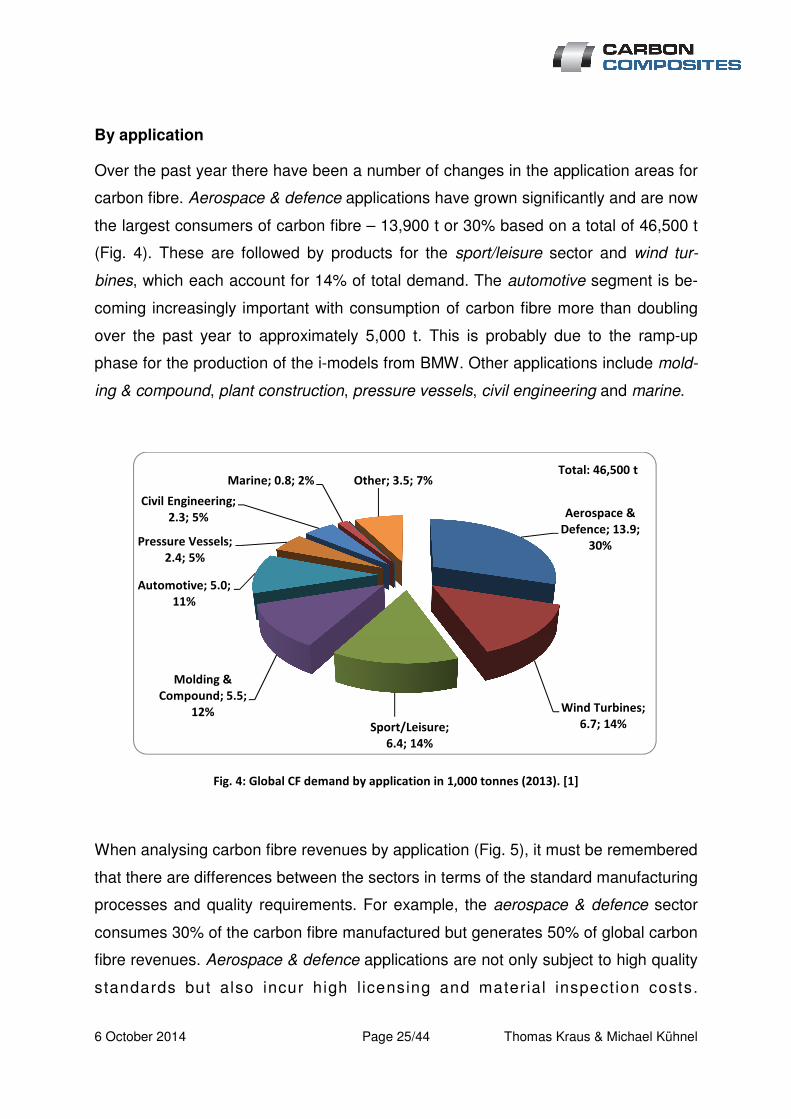
By application
Over the past year there have been a number of changes in the application areas for
carbon fibre. Aerospace & defence applications have grown significantly and are now
the largest consumers of carbon fibre – 13,900 t or 30% based on a total of 46,500 t
(Fig. 4). These are followed by products for the sport/leisure sector and wind tur-
bines, which each account for 14% of total demand. The automotive segment is be-
coming increasingly important with consumption of carbon fibre more than doubling
over the past year to approximately 5,000 t. This is probably due to the ramp-up
phase for the production of the i-models from BMW. Other applications include mold-
ing & compound, plant construction, pressure vessels, civil engineering and marine.
Fig. 4: Global CF demand by application in 1,000 tonnes (2013). [1]
When analysing carbon fibre revenues by application (Fig. 5), it must be remembered
that there are differences between the sectors in terms of the standard manufacturing
processes and quality requirements. For example, the aerospace & defence sector
consumes 30% of the carbon fibre manufactured but generates 50% of global carbon
fibre revenues. Aerospace & defence applications are not only subject to high quality
standards but also incur high l icensing and material inspection costs.
Aerospace &
Defence; 13.9;
30%
Wind Turbines;
6.7; 14%Sport/Leisure;
6.4; 14%
Molding &
Compound; 5.5;
12%
Automotive; 5.0;
11%
Pressure Vessels;
2.4; 5%
Civil Engineering;
2.3; 5%
Marine; 0.8; 2% Other; 3.5; 7%Total: 46,500 t

6 October 2014 Page 26/44 Thomas Kraus & Michael Kühnel
In all other application areas, the percentage is lower in relation to the quantity of ma-
terial manufactured. However, the order is the same as that shown in Fig. 4. There
has been a significant increase in carbon fibre consumption and revenues generated,
particularly in the aerospace & defence, civil engineering and automotive sectors,
compared to 2012. In percentage terms, these gains have been at the expense of the
wind turbine segment.
Fig. 5: Global CF revenues in US$ million by application (2013). [1]
The global carbon composites market
Virtually all carbon fibre manufactured worldwide is used in combination with a bind-
ing matrix to produce carbon composites. As a result, the growth trends observed in
the carbon fibre and carbon composite markets are very similar. The significantly
higher tonnages stated in this section are due to the addition of the matrix compo-
nent.
Fig. 6 shows the development of global CRP demand in tonnes. In 2013, demand for
CRP was around 72,000 t, an increase of 9.1% compared to the previous year.
Growth in CRP consumption is forecast to continue at 10.6% until 2020, essentially
matching that of carbon fibre.
Aerospace &
Defence; 860.00;
50%
Sport/Leisure;
189.00; 11%
Wind Turbines;
155.70; 9%
Molding &
Compound;
132.00; 8%
Automotive;
129.20; 7%
Pressure Vessels;
72.70; 4%
Civil Engineering;
68.50; 4%
Marine; 18.10;
1%
Other; 107.80;
6%Total: US$ 1.7 billion

6 October 2014 Page 27/44 Thomas Kraus & Michael Kühnel
Fig. 6: Global CRP demand in 1,000 tonnes 2008–2020 (*estimated).
By matrix
Carbon fibre reinforced composites are manufactured using a variety of matrices.
Although carbon, ceramic and metal matrix materials are used in special applica-
tions, the focus of the following section will be primarily on carbon fibre reinforced
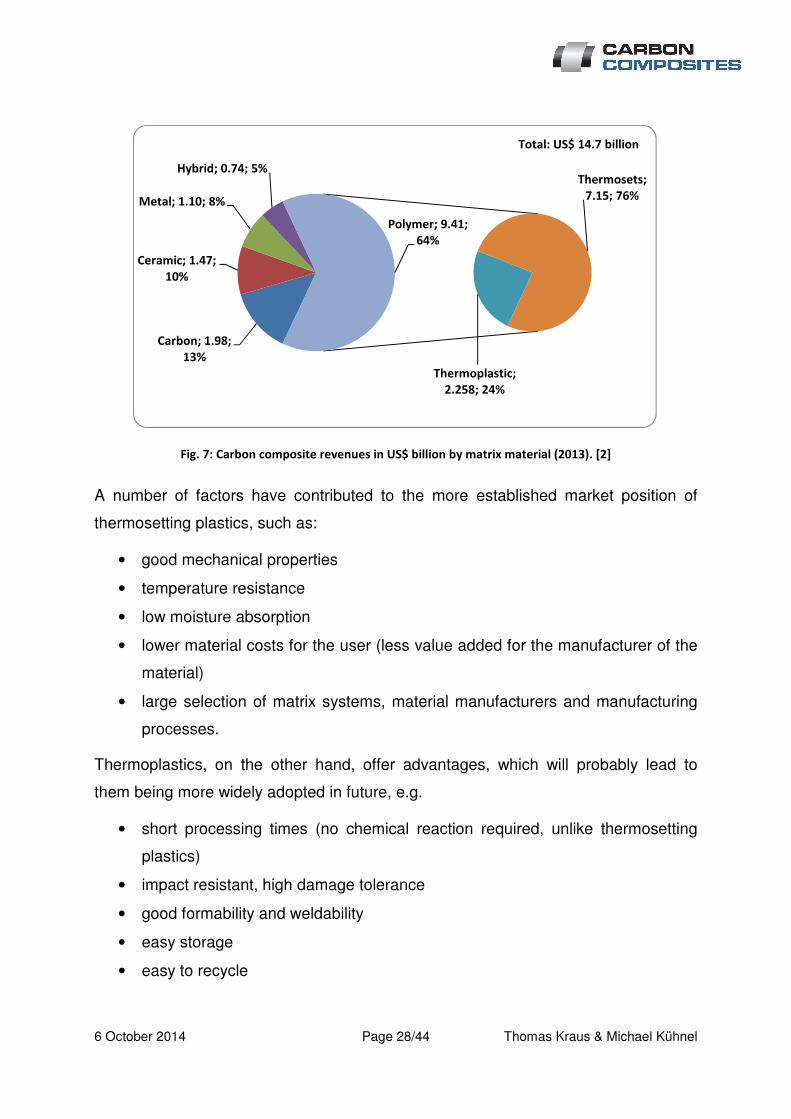
plastics (CRP). In 2013, carbon composites generated total revenues of approx.
US$14.7 billion, of which CRP accounted for US$9.4 billion (Fig. 7). Composites
based on a polymer matrix were therefore responsible for 64% of revenues. [2]
The matrix polymers used in CRP production can be further divided into thermoplas-
tics and thermosetting plastics (see right pie chart in Fig. 7). Thermosetting plastics
continue to be the polymer matrix used most commonly with carbon fibre. This is also
reflected in the revenue shares of these two polymer types in the total revenues for
CRP.
6 October 2014 Page 28/44 Thomas Kraus & Michael Kühnel
Fig. 7: Carbon composite revenues in US$ billion by matrix material (2013). [2]
A number of factors have contributed to the more established market position of
thermosetting plastics, such as:
• good mechanical properties
• temperature resistance
• low moisture absorption
• lower material costs for the user (less value added for the manufacturer of the
material)
• large selection of matrix systems, material manufacturers and manufacturing
processes.
Thermoplastics, on the other hand, offer advantages, which will probably lead to
them being more widely adopted in future, e.g.
• short processing times (no chemical reaction required, unlike thermosetting
plastics)
• impact resistant, high damage tolerance
• good formability and weldability
• easy storage
• easy to recycle
Carbon; 1.98;
13%
Ceramic; 1.47;
10%
Metal; 1.10; 8%
Hybrid; 0.74; 5%
Thermoplastic;
2.258; 24%
Thermosets;
7.15; 76%
Polymer; 9.41;
64%
Total: US$ 14.7 billion

6 October 2014 Page 29/44 Thomas Kraus & Michael Kühnel
So far, elastomer matrices are not widely used although this may change in the fu-
ture, e.g. for elastic, hingeless shaft connections in mechanical engineering applica-
tions.
By manufacturing process
A variety of different production processes are used in the manufacture of CRP mate-
rials/components (see Fig. 8). In this year's report, the processes have been classi-
fied in a slightly different way from last year. Layup processes using prepregs (37%)
continue to account for a major proportion of processes employed. However, pultru-
sion and winding are gaining importance and now represent a combined total of 40%
of the market as they capture market share from prepregs. As well as easy-to-
automate pressing and injection processes (e.g. RTM), the manual processes of wet
lamination and vacuum infusion/infiltration are also frequently used.
Fig. 8: CRP market share in US$ million by manufacturing process (2013). [2]
Pultrusion and
winding; 3810;
40%
Prepreg layup
process
with/without
autoclave; 3434;
37%
wet lamination &
infusion
processes; 1176;
12%
Pressing &
injection
processes; 612;
7%
Others; 376; 4%Total: US$ 9.408 billion

6 October 2014 Page 30/44 Thomas Kraus & Michael Kühnel
By region
Fig. 9 shows carbon composites revenues by region. North America and the USA, in
particular, as an important manufacturer of aircraft and military equipment, account
for approx. US$5 billion of global revenues – over one-third of the total. According to
this breakdown of the market, Western Europe is the second largest region in the
carbon composites economy generating around US$4.7 billion in revenues. Howev-
er, if Europe were considered as a whole, including Hungary (Zoltek), it would in fact
push North America down to the No. 2 spot. As well as having an aviation industry to
rival that of North America, Europe is also home to many manufacturers in the wind
turbine, automotive and mechanical engineering sectors, which also create strong
demand for carbon composites. Japan, due to its many fibre manufacturers, is the
third largest carbon composites market earning US$2.2 billion in revenues. In Asia
(including the Pacific but excluding Japan), China's ambitions in the wind energy sec-
tor, in particular, helped to generate revenues of US$1.9 billion.
Fig. 9: Carbon composite revenues in US$ billion by region (2013). [2]
Western Europe;
4.7; 32%
North America;
5.07; 34%
Japan; 2.21; 15%
Asia & Pacific;
1.91; 13%
Rest of the
world; 0.81; 6%
Total: US$ 14.7 billion
6 October 2014 Page 31/44 Thomas Kraus & Michael Kühnel
By application
The following sections provide a breakdown of the carbon composite revenues for
the four most important market segments and their subsegments.
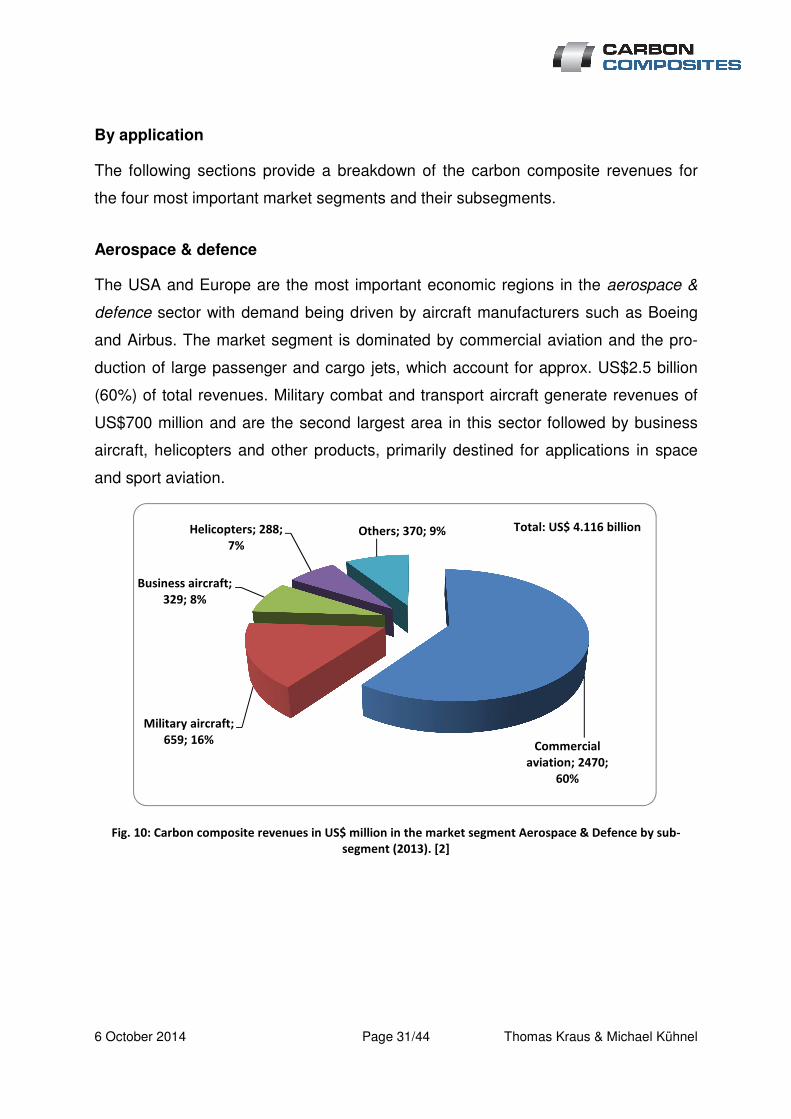
Aerospace & defence
The USA and Europe are the most important economic regions in the aerospace &
defence sector with demand being driven by aircraft manufacturers such as Boeing
and Airbus. The market segment is dominated by commercial aviation and the pro-
duction of large passenger and cargo jets, which account for approx. US$2.5 billion
(60%) of total revenues. Military combat and transport aircraft generate revenues of
US$700 million and are the second largest area in this sector followed by business
aircraft, helicopters and other products, primarily destined for applications in space
and sport aviation.
Fig. 10: Carbon composite revenues in US$ million in the market segment Aerospace & Defence by sub-
segment (2013). [2]
Commercial
aviation; 2470;
60%
Military aircraft;
659; 16%
Business aircraft;
329; 8%
Helicopters; 288;
7%Others; 370; 9% Total: US$ 4.116 billion

6 October 2014 Page 32/44 Thomas Kraus & Michael Kühnel
Wind turbines
The wind turbine market is the second largest segment in terms of carbon fibre con-
sumption. Global wind energy capacity has been expanding continuously since 2005
(Fig. 11) and reached a total of approx. 318 GW in 2013. The electrical output of
each wind turbine is a quadratic function of its rotor diameter so manufacturers are
under pressure to develop ever longer and lighter rotor blades. In 1985, the average
rotor diameter was just 15 m with an average output of less than 1 MW. In 2013,
wind turbines had an average rotor diameter of 100 m and an average output of 2.5
MW [5]. These multi-megawatt wind turbines are increasing the demand for carbon
fibre because it is the only material suitable for the construction of rotor blades with a
length of 40 to 50 m.
In 2013, the wind energy market consumed approx. 6,700 t of carbon fibre and gen-
erated carbon composite revenues totalling approx. US$1.8 billion. However, de-
mand for carbon fibre in the sector was lower than in 2012 (10,000 t). The reasons
for this were the continuing, low level of automation and delays to the construction of
offshore wind parks due to financial and technical difficulties. For example, only 35
GW of new wind energy generating capacity was installed worldwide in 2013 (Fig.
11).
Fig. 11: Global installed wind turbine generation in GW. [6]
59
.1 73
.9 93
.9
12
0.6
15
9.0
19
8.0
23
8.1
28
3.2 3
18
.1
11
.5 14
.70 20
.29 2
6.8
7
38
.47
39
.06
40
.64
45
.17
35
.29
0
10
20
30
40
50
60
70
0
50
100
150
200
250
300
350
400
2005 2006 2007 2008 2009 2010 2011 2012 2013
Ne
w i
nst
all
ed
win
d t
urb
ine
ca
pa
city
(gre
en
)
Glo
ba
l in
sta
lle
d w
ind
tu
rbin
e g
en
era
tio
n
cap
aci
ty (
red
)

6 October 2014 Page 33/44 Thomas Kraus & Michael Kühnel
This sector is dominated by three major national economies: the People's Republic of
China has significantly expanded its capacity over recent years and increased its to-
tal to 91 GW in 2013 – almost 30% of global wind energy capacity. This is followed
by the USA with 62 GW and Germany with 34 GW of capacity (Fig. 12). [6]
Fig. 12: Installed wind turbine capacity by country in GW (Dec 2013). [6]
China; 91.412;
29%
USA; 61.091;
19%Germany; 34.25;
11%
Spain; 22.959;
7%
India; 20.15; 6%
UK; 10.531; 3%
Italy; 8.552; 3%
France; 8.254;
3%
Canada; 7.803;
2%
Denmark; 4.772;
2%
Rest of the
world; 48.332;
15%
Total: 318.1 GW
6 October 2014 Page 34/44 Thomas Kraus & Michael Kühnel
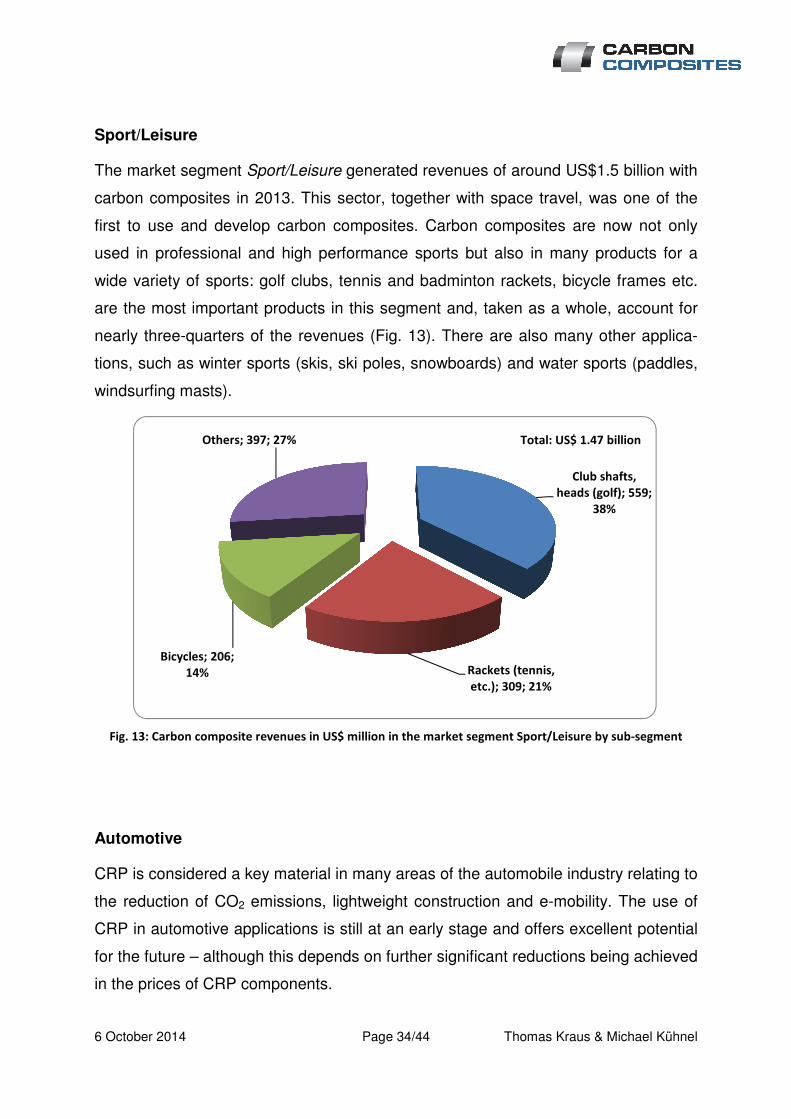
Sport/Leisure
The market segment Sport/Leisure generated revenues of around US$1.5 billion with
carbon composites in 2013. This sector, together with space travel, was one of the
first to use and develop carbon composites. Carbon composites are now not only
used in professional and high performance sports but also in many products for a
wide variety of sports: golf clubs, tennis and badminton rackets, bicycle frames etc.
are the most important products in this segment and, taken as a whole, account for
nearly three-quarters of the revenues (Fig. 13). There are also many other applica-
tions, such as winter sports (skis, ski poles, snowboards) and water sports (paddles,
windsurfing masts).
Fig. 13: Carbon composite revenues in US$ million in the market segment Sport/Leisure by sub-segment
Automotive
CRP is considered a key material in many areas of the automobile industry relating to
the reduction of CO2 emissions, lightweight construction and e-mobility. The use of
CRP in automotive applications is still at an early stage and offers excellent potential
for the future – although this depends on further significant reductions being achieved
in the prices of CRP components.
Club shafts,
heads (golf); 559;
38%
Rackets (tennis,
etc.); 309; 21%
Bicycles; 206;
14%
Others; 397; 27% Total: US$ 1.47 billion

6 October 2014 Page 35/44 Thomas Kraus & Michael Kühnel
In the 1980s, the first carbon fibre applications, such as drive shafts, began to be
adopted outside the motorsport sector and establish themselves in small series pro-
duction vehicles. Carbon composites are now used in an extensive range of structur-
al and outer skin applications in cars – from ceramic brakes reinforced with carbon
fibre to crash elements and monocoques, passenger compartments and semitrailers.
Carbon composites are also assuming a greater role in applications for the railway
industry, e.g. from small components such as windscreen wipers to complete front
ends and underfloor structures.
With approximately US$2.2 billion in revenues, the automotive segment is increas-
ingly important to the carbon composites market. Cars are the most important area
generating 46% percent of the sector's revenues. The continuing high cost of carbon
composite components has until now restricted their use primarily to luxury cars. The
sub-segments trucks (18%), motorsport (15%) and passenger trains (13%) also
make noteworthy contributions to the total revenues generated by the automotive
sector.
Fig. 14: Carbon composites revenues in US$ million in the automotive sector according to sub-segment
(2013). [2]
Cars; 1014; 46%
Trucks; 397; 18%
Motorsport; 331;
15%
Passenger trains;
287; 13%
Others; 176; 8%
Total: US$ 2205 billion
6 October 2014 Page 36/44 Thomas Kraus & Michael Kühnel
Trends and outlook
For the next five years, analysts predict an annual growth rate of nearly 9% for the
carbon fibre market. This will then rise further to around 10% (Fig. 1). Based on this
estimate, global demand for carbon fibre can therefore be expected to reach 89,000 t
by 2020 and generate revenues of over US$3.3 billion. Despite the availability of ex-
isting excess capacity, a number of fibre manufacturers have announced that they
intend to invest in further facilities:
• SGL and BMW will invest a further US$100 million in their Moses Lake facility
(bringing the total to US$300 million) in order to expand the production capaci-
ty from the 6000 t stated in Section 0 to a medium-term target of 9000 t per
year. [4]
• Mitsubishi Rayon will expand production capacity by 2000 t at its carbon fibre
factory in Sacramento, USA, by mid-2016 – doubling its total capacity. [7]
The carbon composites market, valued at a total of US$14.7 billion in 2013, is ex-
pected to grow at approximately the same rate. CRP is the most important area here
generating US$9.4 billion of the total. [2]. The CRP market continues to promise sta-
ble and outstanding growth potential. As well as the aviation and wind energy sec-
tors, the growing use of CRP in automotive construction and industry are key factors
driving the market. Market studies predict average annual revenue growth of be-
tween 6 and 11% over the next five years and then a sustained rate of over 10%. For
example, in 2020, the industry is anticipating demand for 146,000 t of CRP and reve-
nues of over US$16 billion. For 2020, revenues for the entire carbon composites
market, including other matrices, are forecast to total around US$25 billion. [2]
Aerospace & defence
The aerospace & defence sector will continue to play a critical role in the growth of
the carbon composites market. Both Airbus, with the A380, and Boeing, with the
Dreamliner 787, have started the production and delivery of their latest wide-bodied
passenger aircraft. Both models use a significant proportion of carbon composites in
their structures and provide an enduring, growing source of demand.

6 October 2014 Page 37/44 Thomas Kraus & Michael Kühnel
At the time of this market study, Airbus is building 25 to 30 of these aircraft per year
and has received orders for a further 180 [8]. Boeing has also currently received or-
ders for a total of 887 Dreamliners that have yet to be delivered [9]. Future projects,
such as the A350XWM, 53% of which will be made from composites [10], or the Boe-
ing 777X with carbon composite wings [11], show that demand for carbon compo-
sites from aircraft manufacturers will continue to expand well beyond the lifespan of
the A380 or the 787. Industry analysts expect growth of between 8 and 13% over the
coming years. Carbon composites revenues of around US$6 billion have been fore-
cast for the passenger aircraft sector alone in 2022.
Carbon composite structures are already relatively well-established in the defence
segment. All modern defence projects, such as the A400M, F-22, F-35, Eurofighter or
Eurocopter Tiger, are increasingly based on composite materials. However, budget
cuts in defence departments and export restrictions imposed by industrial nations will
constrain growth. Despite these factors, strong annual growth of between 6 and 12%
is also expected in this segment. By 2022, it is expected to generate revenues of
US$1.4 billion. [2]
Fig. 15: Development of carbon composite revenues in US$ million in the market segment Aerospace & De-
fence. [2]
6 October 2014 Page 38/44 Thomas Kraus & Michael Kühnel
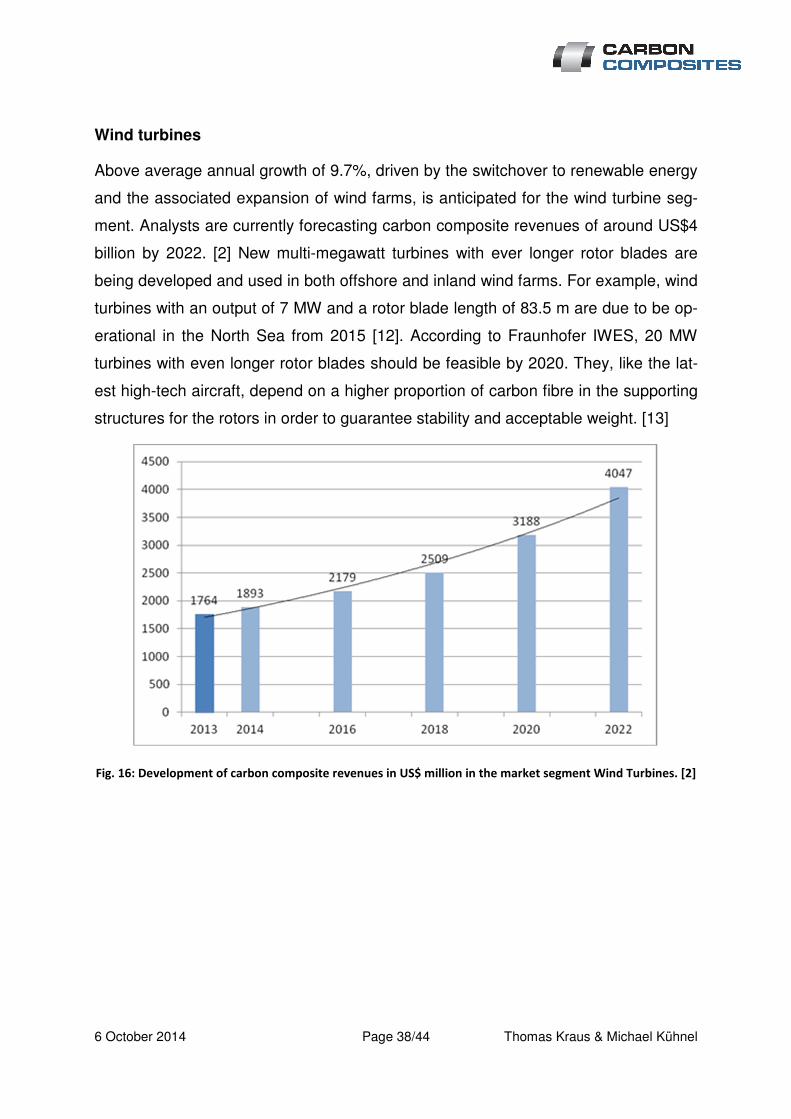
Wind turbines
Above average annual growth of 9.7%, driven by the switchover to renewable energy
and the associated expansion of wind farms, is anticipated for the wind turbine seg-
ment. Analysts are currently forecasting carbon composite revenues of around US$4
billion by 2022. [2] New multi-megawatt turbines with ever longer rotor blades are
being developed and used in both offshore and inland wind farms. For example, wind
turbines with an output of 7 MW and a rotor blade length of 83.5 m are due to be op-
erational in the North Sea from 2015 [12]. According to Fraunhofer IWES, 20 MW
turbines with even longer rotor blades should be feasible by 2020. They, like the lat-
est high-tech aircraft, depend on a higher proportion of carbon fibre in the supporting
structures for the rotors in order to guarantee stability and acceptable weight. [13]
Fig. 16: Development of carbon composite revenues in US$ million in the market segment Wind Turbines. [2]

6 October 2014 Page 39/44 Thomas Kraus & Michael Kühnel
Automotive
With the large scale production of its new i-series, BMW has taken a pioneering step.
Production began in September and was ramped up to around 100 i3 models a day
in 2014 [14]. The BMW Group also plans to expand the use of CRP in its other rang-
es. To do this, BMW is not only extending its carbon fibre manufacturing partnership
with SGL [4] but also increasing its own CRP production and processing capacity.
Recently, the company invested €20 million in a CRP stacking plant in Wackersdorf
[15]. Other manufacturers are also using CRP more widely but are more cautious
due to the continuing high cost of carbon composite components.
Revenues are expected to grow by 7% annually until 2018 before accelerating to ap-
prox. 12%. By 2022, annual global carbon composite revenues are forecast to reach
US$4.9 billion [2] corresponding to 20,000 t of carbon fibre. Automotive applications
would therefore rise into second place ahead of wind turbines in the league table of
market segments.
Fig. 17: Development of carbon composite revenues in US$ million in the market segment Automotive. [2]
6 October 2014 Page 40/44 Thomas Kraus & Michael Kühnel
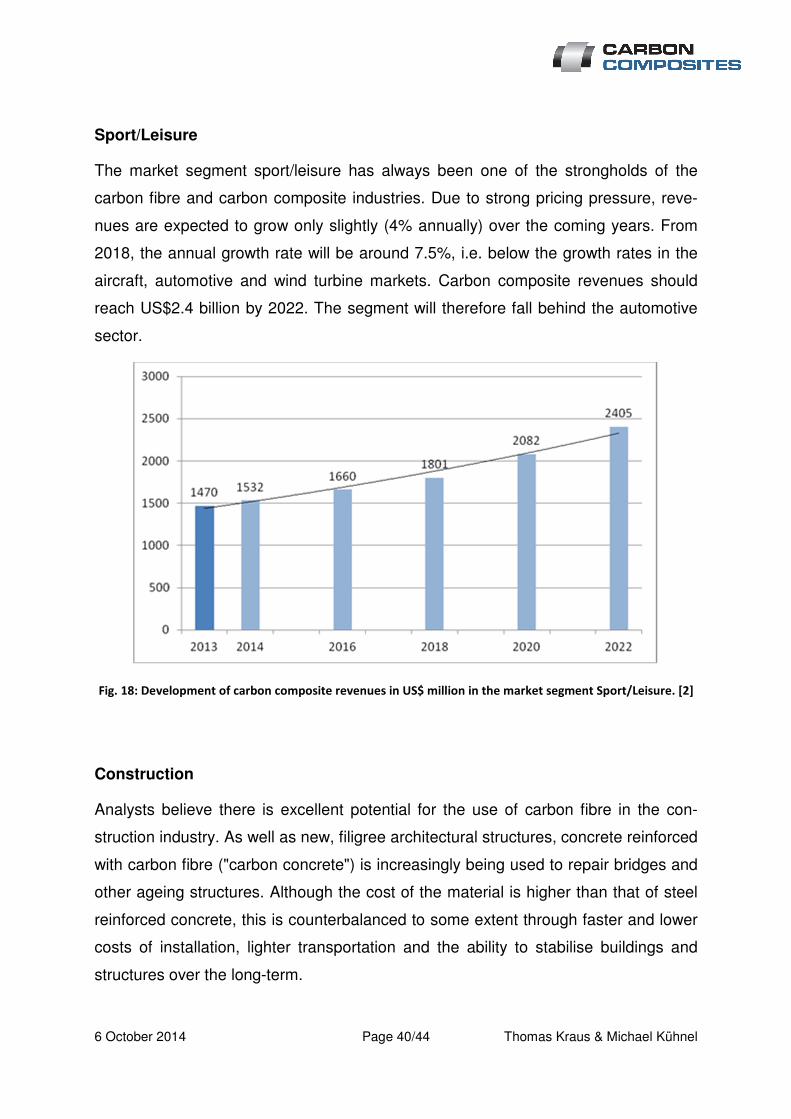
Sport/Leisure
The market segment sport/leisure has always been one of the strongholds of the
carbon fibre and carbon composite industries. Due to strong pricing pressure, reve-
nues are expected to grow only slightly (4% annually) over the coming years. From
2018, the annual growth rate will be around 7.5%, i.e. below the growth rates in the
aircraft, automotive and wind turbine markets. Carbon composite revenues should
reach US$2.4 billion by 2022. The segment will therefore fall behind the automotive
sector.
Fig. 18: Development of carbon composite revenues in US$ million in the market segment Sport/Leisure. [2]
Construction
Analysts believe there is excellent potential for the use of carbon fibre in the con-
struction industry. As well as new, filigree architectural structures, concrete reinforced
with carbon fibre ("carbon concrete") is increasingly being used to repair bridges and
other ageing structures. Although the cost of the material is higher than that of steel
reinforced concrete, this is counterbalanced to some extent through faster and lower
costs of installation, lighter transportation and the ability to stabilise buildings and
structures over the long-term.
6 October 2014 Page 41/44 Thomas Kraus & Michael Kühnel
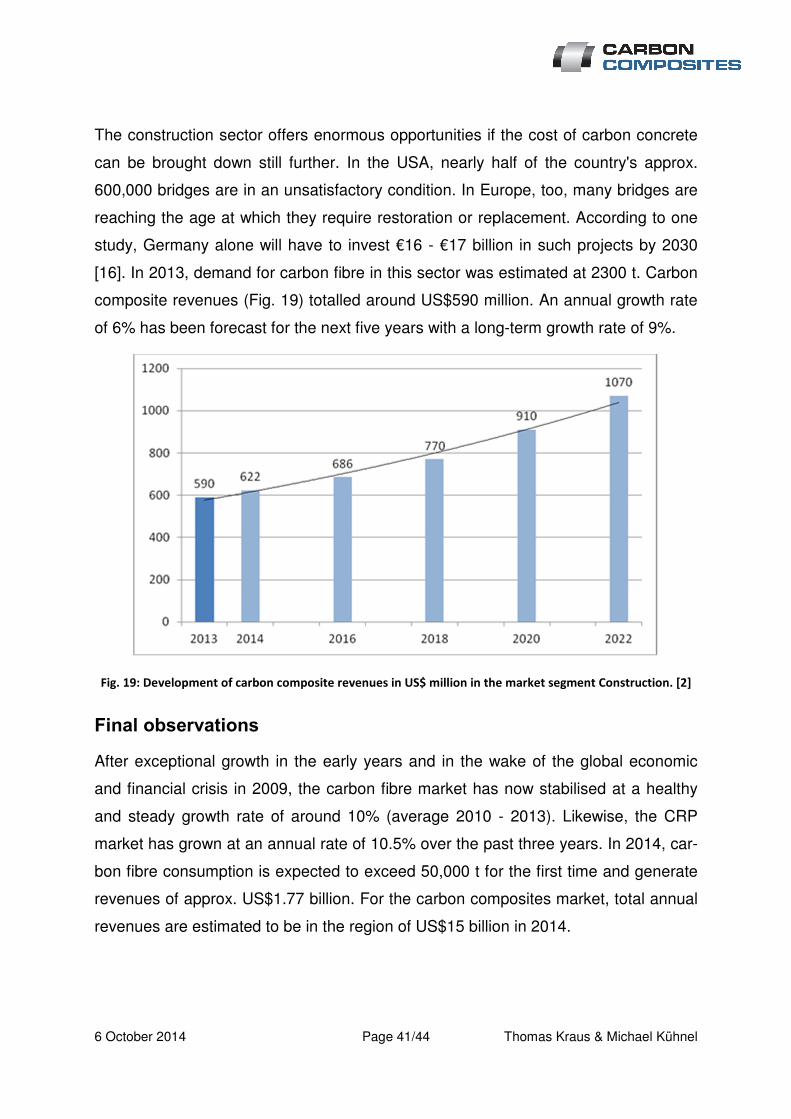
The construction sector offers enormous opportunities if the cost of carbon concrete
can be brought down still further. In the USA, nearly half of the country's approx.
600,000 bridges are in an unsatisfactory condition. In Europe, too, many bridges are
reaching the age at which they require restoration or replacement. According to one
study, Germany alone will have to invest €16 - €17 billion in such projects by 2030
[16]. In 2013, demand for carbon fibre in this sector was estimated at 2300 t. Carbon
composite revenues (Fig. 19) totalled around US$590 million. An annual growth rate
of 6% has been forecast for the next five years with a long-term growth rate of 9%.
Fig. 19: Development of carbon composite revenues in US$ million in the market segment Construction. [2]
Final observations
After exceptional growth in the early years and in the wake of the global economic
and financial crisis in 2009, the carbon fibre market has now stabilised at a healthy
and steady growth rate of around 10% (average 2010 - 2013). Likewise, the CRP
market has grown at an annual rate of 10.5% over the past three years. In 2014, car-
bon fibre consumption is expected to exceed 50,000 t for the first time and generate
revenues of approx. US$1.77 billion. For the carbon composites market, total annual
revenues are estimated to be in the region of US$15 billion in 2014.
6 October 2014 Page 42/44 Thomas Kraus & Michael Kühnel
Continuous growth of around 10% is forecast for the coming years with stability
guaranteed by the sectors aerospace & defence, wind turbines and sport/leisure.
There is also exceptional, but less certain, growth potential in the automotive and
construction market segments. In both these sectors, the large scale use of carbon
fibre and carbon composites depends heavily on the industry's ability to reduce the
prices of these materials. This uncertainty is reflected in the revenue forecasts for the
overall carbon fibre and carbon composite markets.
The generally positive outlook is also reflected in recent results of the Composites
Germany market survey, which is conducted twice annually among the business as-
sociation's members. Composites Germany was founded in 2013 by the four major
organisations representing the composites industry in Germany – AVK, CCeV, CFK
Valley Stade and VDMA Forum Composite Technology. Overwhelmingly, the associ-
ation's members described the growth of their companies as positive or very positive.
Even conservative estimates predict an extremely vibrant future market. However,
the industry must also overcome a number of hurdles, for example in automation,
cost-cutting and the development of manufacturing processes suitable for mass pro-
duction. The price-performance ratio will decide which materials or combinations of
materials will be adopted in which application areas. Ecological aspects – if these are
demanded by lawmakers or not economically disadvantageous – are likely to as-
sume greater relative importance than pure business considerations.
6 October 2014 Page 43/44 Thomas Kraus & Michael Kühnel
Literature
[1] Lucintel LLC, Growth Opportunities in the Global Carbon Fibre Market: 2014-2019, Irving, USA, 2014.
[2] Acmite Market Intelligence e.K., Market Report: Global Carbon Fiber Composite Market, Ratingen, 2014.
[3] Toray Industries, Inc., "http://www.toray.com," 03 2014. [Online]. Available: http://www.toray.com/news/manage/nr140303.html. [Zugriff am 09 09 2014].
[4] BMW Group, "BMW Group PresseClub Deutschland," 09 05 2014. [Online]. Available: https://www.press.bmwgroup.com/deutschland/pressDetail.html?title=bmw-group-und-sgl-group-verdreifachen-produktionskapazit%C3%A4t-im-karbonfaserwerk-moses-lake&outputChannelId=7&id=T0179312DE&left_menu_item=node__4088. [Zugriff am 07 07 2014].
[5] EWEA - The European Wind Turbines Association, [Online]. Available: http://www.ewea.org/uploads/pics/EWEA_Wind_energy_factsheet.png. [Zugriff am 02 09 2014].
[6] "Global Wind turbines Council - GWEC," [Online]. Available: http://www.gwec.net/global-figures/. [Zugriff am 27 08 2014].
[7] Mitsubishi Rayon Co., Ltd., "https://www.mrc.co.jp," 30 06 2014. [Online]. Available: https://www.mrc.co.jp/english/pressroom/detail/pdf/20140630192937.pdf. [Zugriff am 08 08 2014].
[8] Airbus, "AIRBUS Orders & deliveries," 31 07 2014. [Online]. Available: http://www.airbus.com/no_cache/company/market/orders-deliveries/. [Zugriff am 19 08 2014].
[9] Boeing, "Boeing 787 Model Summary," 31 07 2014. [Online]. Available: http://active.boeing.com/commercial/orders/displaystandardreport.cfm?cboCurrentModel=787&optReportType=AllModels&cboAllModel=787&ViewReportF=View+Report. [Zugriff am 19 08 2014].
[10] Airbus, "Airbus A350 XWB Familiy," 19 08 2014. [Online]. Available: http://www.airbus.com/aircraftfamilies/passengeraircraft/a350xwbfamily/. [Zugriff am 19 08 2014].
[11] Boeing, "Boeing Introducion the 777X," 19 08 2014. [Online]. Available: http://www.boeing.com/boeing/commercial/777X/index.page. [Zugriff am 19 08 2014].
[12] S. Rentzing, "ee-news.ch," 07 02 2014. [Online]. Available: http://www.ee-news.ch/de/wind/article/28102/rotor-laengere-fluegel-fuer-mehr-leistung. [Zugriff am 28 08 2014].
[13] D. Dürand, "Wirtschafts Woche," 29 11 2012. [Online]. Available: http://www.wiwo.de/technologie/umwelt/windenergie-wer-dreht-das-groesste-windrad/7457982.html. [Zugriff am 28 08 2014].
[14] W. Eckl-Dorna, "manager magazin online," manager magazin new media GmbH, 15 04 2014. [Online]. Available: http://www.manager-magazin.de/unternehmen/autoindustrie/elektroauto-herstellung-bmw-faehrt-i3-produktion-um-40-prozent-hoch-a-964633.html. [Zugriff am 31 08 2014].
6 October 2014 Page 44/44 Thomas Kraus & Michael Kühnel
[15] BMW Group, "BMW Group PressClub," 01 08 2014. [Online]. Available: https://www.press.bmwgroup.com/deutschland/pressDetail.html?title=weltweit-einmalige-cfk-stackanlage-geht-nach-rekordbauzeit-in-betrieb&outputChannelId=7&id=T0190324DE&left_menu_item=node__4088. [Zugriff am 31 08 2014].
[16] Deutsches Institut für Urbanistik, "Deutsches Institut für Urbanistik: Infrastruktur," 30 09 2013. [Online]. Available: http://www.difu.de/presse/2013-09-30/infrastruktur-viele-kommunale-strassenbruecken-muessen-bis.html. [Zugriff am 20 08 2014].
[17] "SGL Group," 09 05 2014. [Online]. Available: http://www.sglnewsroom.com/de/meldungen/bmw-group-sgl-group-verdreifachen-produktionskapazitaet-karbonfaserwerk-moses-lake.12352.php. [Zugriff am 08 08 2014].
[18] AVK, CCeV, CFK Valley Stade, VDMA Forum Composite Technologie , "Composites Markterhebung - 1. Halbjahr 2014," Composites Germany, Berlin, 2014.
[19] T. Roberts, "The Carbon Fiber Industry worldwide 2011-2020," Materials Technology Publications, Watford, 2011.