
Market power relationships among life insurance intermediaries541889/FULLTEXT01.pdf · Market power...
54
Degree thesis 30 hp Spring 2011 Supervisor: Lars Nordén Swedish title: Marknadskraftrelationer bland livförsäkringsförmedlare – jättarnas makt Market power relationships among life insurance intermediaries -The power of giants Abstract: The imposed commission ban to Finnish insurance intermediaries has generated some controversy and the intermediary market has experienced consolidation in the few last years. The thesis examines the relationship between market structure and profitability among Finnish life insurance intermediaries and tests for the applicability of two market power hypotheses. The panel data analysis shows that there is support for the Relative Market Power hypothesis while the Structure- Conduct-Performance hypothesis is not applicable for Finnish life insurance intermediaries. The implication of this research is that competition authorities should be concerned with market structure effects when discussing changes to the regulatory environment which surrounds life insurance intermediaries. Keywords: Market structure, profitability, SCP, RMP, intermediaries. Andreas Friberg Magnus Listermar
Transcript of Market power relationships among life insurance intermediaries541889/FULLTEXT01.pdf · Market power...
Degree thesis 30 hp
Spring 2011
Supervisor: Lars Nordén
Swedish title: Marknadskraftrelationer bland livförsäkringsförmedlare – jättarnas makt
Market power relationships
among life insurance
intermediaries
-The power of giants
Abstract:
The imposed commission ban to Finnish insurance intermediaries has generated some controversy
and the intermediary market has experienced consolidation in the few last years. The thesis
examines the relationship between market structure and profitability among Finnish life insurance
intermediaries and tests for the applicability of two market power hypotheses. The panel data
analysis shows that there is support for the Relative Market Power hypothesis while the Structure-
Conduct-Performance hypothesis is not applicable for Finnish life insurance intermediaries. The
implication of this research is that competition authorities should be concerned with market
structure effects when discussing changes to the regulatory environment which surrounds life
insurance intermediaries.
Keywords: Market structure, profitability, SCP, RMP, intermediaries.
Andreas Friberg
Magnus Listermar

List of contents
1. Introduction ....................................................................................................................................... 1
1.1 Background ...................................................................................................................................................................... 2 1.1.1 The role of insurance intermediaries ......................................................................................................... 2 1.1.2 Remuneration ........................................................................................................................................................ 3 1.1.3 Main arguments of the current debate ....................................................................................................... 3 1.1.4 Regulatory changes in Scandinavia ............................................................................................................. 4 1.1.5 Market observations in Sweden, Denmark and Finland .................................................................... 4
1.2 Problem discussion....................................................................................................................................................... 5 1.3. Research question ........................................................................................................................................................ 6 1.4 Hypotheses ....................................................................................................................................................................... 7 1.5 Aim ....................................................................................................................................................................................... 7 1.6 Limitations........................................................................................................................................................................ 7
2. Literature review.............................................................................................................................. 8 2.1 Introduction ..................................................................................................................................................................... 8 2.2 Previous literature ........................................................................................................................................................ 9
2.2.1 The role of insurance intermediaries ......................................................................................................... 9 2.2.2 Commission vs. fee-based remuneration model .................................................................................... 9 2.2.3 In-house sales force and independent agents ......................................................................................... 9 2.2.4 Agency theory ..................................................................................................................................................... 10 2.2.5 No evidence of economies of scale on the insurance intermediary market ........................... 11 2.2.6 Market regulation and liberalization ....................................................................................................... 11 2.2.7 Structure-Conduct-Performance and Relative Market Power Hypothesis ............................. 11
2.3 Theoretical framework ............................................................................................................................................ 12 2.3.1 Empirical evidence of SCP and RMP ......................................................................................................... 12 2.3.2 Herfindahl-Hirschman Index ....................................................................................................................... 15 2.3.3 HHI - A Concentration Measure Taking the Consumer’s Point of View .................................... 15 2.3.4 The relationship between HHI and Price cost margins ................................................................... 16
2.4 Conclusion Literature review................................................................................................................................ 16
3. Method ............................................................................................................................................... 18
3.1 Methodology ................................................................................................................................................................. 18 3.1.1 Ontology ................................................................................................................................................................ 18 3.1.2 Quantitative research approach ................................................................................................................. 18 3.1.3 Induction & deduction .................................................................................................................................... 19
3.2 Data collecting methods .......................................................................................................................................... 19 3.2.1 Data transformation ........................................................................................................................................ 20 3.2.2 Quality of data .................................................................................................................................................... 20
3.3 Data processing methods ........................................................................................................................................ 20 3.3.1 Regression analysis and hypothesis testing ......................................................................................... 20 3.3.2 The estimation model ..................................................................................................................................... 21 3.3.3 Issues that may bias the regression results .......................................................................................... 24
3.4 Reliability and validity ............................................................................................................................................. 26 3.4.1 Reliability ............................................................................................................................................................. 26 3.4.2 Internal validity ................................................................................................................................................. 27 3.4.3 External validity ................................................................................................................................................ 28 3.4.4 Ethical aspects .................................................................................................................................................... 29

3.5 Method criticism ......................................................................................................................................................... 29
4. Results ............................................................................................................................................... 30 4.1 Empirical results ......................................................................................................................................................... 30 4.2 Quality check ................................................................................................................................................................ 31
5. Analysis ............................................................................................................................................. 33
6. Conclusions ...................................................................................................................................... 36
7. References ........................................................................................................................................ 38
8. Appendix ........................................................................................................................................... 42 8.1 Received commissions total market Finland ................................................................................................. 42 8.2 Mediated premiums by intermediaries in Finland ...................................................................................... 42 8.3 Revenue per mediated premium 2004-2009 ................................................................................................ 43 8.4 Market concentration measured as HHI for Sweden and Finland ........................................................ 43 8.5 Market concentration measured as CR for Finland ..................................................................................... 44 8.6 Market concentration measured as CR for Sweden .................................................................................... 44 8.7 Market Concentration Trends 2004-2009 ...................................................................................................... 45 8.8 Summary statistics market concentration trends ....................................................................................... 45 8.9 Data sample firms....................................................................................................................................................... 46 8.10 Regression results with the market growth control variable excluded .......................................... 46 8.11 Scatter plot showing operating margins for the sample firms ............................................................ 47 8.12 Market size Life insurance Sweden ................................................................................................................. 47 8.13 Insurance market size Life insurance and statutory Pensions ............................................................ 48 8.14 Number of active intermediaries in Finland ................................................................................................ 48 8.15 Total received commissions in relation to amount of mediated premiums in Finland ........... 49 8.16 Numerical example of HHI ................................................................................................................................... 49 8.17 Descriptive statistics .............................................................................................................................................. 50 8.18 Qualitative research approach ........................................................................................................................... 50 8.19 Definitions ................................................................................................................................................................... 50
1
1. Introduction
The thesis covers Scandinavian life insurance intermediaries, market structure and market regulation.
The study is motivated by the ongoing debate regarding the insurance intermediaries’ role and
remuneration customs. Recently, Danish and Finnish authorities restricted life insurance
intermediaries from receiving commissions on mediated insurance products. In each case, the
motivation behind the commission ban explicitly expressed is to protect the consumer from
improper advice and to clarify the role of independent intermediaries. Current legislation in Sweden
allows insurance intermediaries to receive commissions for mediated products from insurance
providers. However, whether to allow or ban commissions in Sweden is currently a widely discussed
topic. The debate is not restricted to Sweden, but is found internationally as well. In January 2011,
The Swedish Financial Supervisory Authority stated that the remuneration model surrounding
insurance intermediaries creates a conflict of interest and therefore expresses its interest in a
commission ban to the Swedish market (FI 2011). The European Commission has indicated that
current legislation is being revised and that changes to the insurance mediation directive (IMD) are to
expect (European commission 2010). On the other hand, Karel van Hulle at the European commission
states that a ban of commissions will result in “nirvana for the insurance companies” since they alone
would control most of the insurance product sales, which would not be an improvement for the
consumer as is the intention with a commission ban (Pensionsnyheterna 2011).
The background chapter initiates by attending to some of the key dimensions to the current debate
regarding life insurance intermediaries in general. Identified effects post the new regulation are then
laid out, where clear market trends are identified. One key finding is that both the Danish and Finnish
intermediary markets seem to consolidate post the new legislation. Empirical evidence on the
relevance to consider market structure on insurance intermediary markets is lacking and market
structure and market power relationships follow as a natural research topic. The conviction is that
intermediaries play an important role in the life insurance market and that one of the key aspects to
consider in the current debate is market structure and competition. Thus, an analysis of market
power relationships among life insurance intermediaries is the main focus throughout the paper.
Market power relationships are especially interesting to study since market structure affects all the
markets stakeholders as well as social performance. This study is an attempt to provide empirical
evidence with theoretical support and practical relevance to one of the key aspects of the current
debate.
2
1.1 Background
1.1.1 The role of insurance intermediaries
According to Yavas (1994, p. 407) there are two types of intermediaries that facilitate market
transactions; market makers and matchmakers. Market makers act on its own account by buying at
bid price and reselling at ask price. Matchmakers however, match sellers and buyers without
engaging in any trading themselves. Intermediaries in the life insurance market, which this study
centers around, are matchmakers in the sense that they mediate insurance products between
insurance companies and consumers.
In insurance markets, independent intermediaries act mainly as matchmakers and provide
supplementary services for both policyholders and insurance companies. Brokers in the life insurance
market are mainly concerned with writing new business and matching consumers with appropriate
insurance products. (Focht, Richter & Schiller 2009, p. 2)
According to Biglaiser (1993, p. 223), an intermediary is usually a specialist who is better than others
in the market to differentiate the quality of products. Hence, intermediaries may provide efficiency
to the market by providing consultancy services to market participants (Focht, Richter & Schiller
2009, p. 2). Similarly, Regan and Tennyson (1997) show that independent agents are better than
exclusive sales agents at assessing risk and servicing consumers in uncertain markets or markets with
complex product lines, this argues for the importance of intermediaries. Focht, Richter and Schiller
(2009, p. 1) argue that intermediaries play an important role in markets that suffers from significant
imperfections. The life insurance and pension market represents a high degree of complexity
regarding its products, which leads to high search costs for the consumer (Eckardt 2002, pp. 5-6).
Therefore, the average consumer lacks the proper knowledge and is unable to take in all the
disclosed information necessary to make correct decisions. This also makes it difficult for direct
matching between buyers and sellers in the market. Thus, we can relate the Scandinavian pensions
market as being imperfect to some extent. Salesmen of a particular insurance company do not have
as broad knowledge of other companies products as an independent party. This can mean that
insurance intermediaries increase transparency on the pensions market by acting as information
providers, which clearly is beneficial to the market (Eckardt 2002, pp. 5-6). Moreover, it is possible
for an intermediary to apply price pressure on various insurance products, in case the insurance
intermediary has a large customer base, which is attractive to insurance companies.
3
1.1.2 Remuneration
A rather well discussed topic within previous research on financial intermediaries is regarding
remuneration customs. A common discussion is whether the remuneration model affects the quality
of advice given by intermediaries. There are two common remuneration systems for intermediaries;
a fee-based system and a commission-based system. Commissions are still the major source of
underwriting-related income for independent intermediaries. Most commission payments are
related to signing of the contract and conditions mostly on the insurance premium (i.e. premium
based commissions). In addition to premium based commissions intermediaries may also receive
contingent commissions based on performance criteria, such as profitability of the business placed or
the volume of business with that specific insurer. (Focht, Richter & Schiller 2009, p. 2)
1.1.3 Main arguments of the current debate
There are several aspects to the debate regarding the commission reward system to life insurance
intermediaries. In many cases, the main arguments tend to center on a balancing act between what
is most important; to prevent the consumer from ending up in a relationship with insurance
companies where the consumer is exposed, or to maintain the mobility of pension capital and
stimulate competition in the market (Pensionsnyheterna 2009). In the case where commissions are
used as compensation for acquisition of customers, there may be a conflict of interest between
consumers and intermediaries, where the advisor is able to exercise his position of trust in favor for
personal gain (Cummins & Doherty 2006, p. 383). The Swedish FSA has expressed its interest in a
commission ban. According to the FSA, the current remuneration system is not transparent to
consumers and there is no clear relationship between the policyholders’ fees and the services
provided by the insurance intermediaries. The current commission model does not reflect the cost
for the service provided but more closely reflects the premium size and the premium payment
period. Due to these circumstances it becomes more interesting for insurance intermediaries to
target high income individuals than low income individuals. A conflict of interest may also occur as a
direct cause of the current commission system when a change of insurer is not motivated by the
policyholder’s needs but by the intermediary’s economical interest. (FI 2005:2) The Swedish
insurance intermediary association (SFM) does not agree and argues that the current commission
system is crucial to maintain mobility of pension capital on the Swedish market and that the current
system is cheaper to the consumer than a fee-based system over time. Since the insurance
intermediaries are heavily exposed to competition and have to disclose their remuneration, the SFM
does not see any problems with product-funded remuneration as opposed to the FSA. SFM argues
4
that the current commission model is beneficial to the consumer who only has to pay for advice he
or she finds useful. A further argument laid out by SFM is that the current remuneration model
favors a market that does not allow market manipulation through vertical integration. According to
SFM, a commission ban will cause many intermediaries to switch from being independent
intermediaries to becoming tied agents and cause a barrier for new actors to enter the market, which
will lead to market dominance among a few inter-nordic actors. (SFM 2011) SFM’s CEO, Per Andelius
states that a commission ban is negative for the markets dynamics. Without product-funded
remuneration the independent intermediaries will not be able to reach the consumers and the
providers of the insurance products will instead serve the market for small savers. Without variable
sales costs, smaller insurance companies will not be able to enter the Swedish market since it’s
expensive to establish in-house sales forces. This has direct consequences on competition, product
ranges and pricing within the industry. (Pensionsnyheterna 2008)
1.1.4 Regulatory changes in Scandinavia
Recent events involving major insurance companies and insurance brokerage firms have directed
attention towards the remuneration systems of independent agents and brokers. Ruquet and Hays
(2004), exemplifies one event where collusion between a big American insurance broker, Marsh and
McLennan, and several insurance companies took place. According to the complaint against Marsh,
the broker took payoffs, which were called placement service agreements and market service
agreements, to steer business to insurers and shield them from competition. Partly in response to
the above-mentioned incident, regulatory changes have been introduced around the world (Focht,
Richter & Schiller 2009, p. 3). Commissions were prohibited on July 1st 2006 on the Danish pensions
market with a five-year transitional period (No. 401, 25 April 2007) and on September 1st 2005 on the
Finnish market with a three-year transitional period, reaching full force in September 2008 (The
Insurance Mediation Act 570/2005 (IMA)).
1.1.5 Market observations in Sweden, Denmark and Finland
When analyzing market trends in Finland, Denmark and Sweden, changes to the market become
evident. In Finland, the amount of commissions received for insurance intermediaries decreased
rapidly from 2007, suggesting that the commission ban had significant effect even during IMA’s
transitional period (Appendix 8.1). The total amount of life insurance premiums mediated in Finland
have decreased significantly since the introduction of the commission ban, when excluding the
statutory share, about one third of the amount mediated 2008 was mediated in 2009 (Appendix 8.2).
Clear evidence is found that the market for insurance intermediaries have been shrinking since the
5
new regulation. Also the revenue per mediated premium has increased during 2004 to 2009
(Appendix 8.3), suggesting that the brokerage services are becoming more expensive. The finding
that perhaps is most interesting is that the Finnish and Danish markets seem to consolidate while the
Swedish market has become less consolidated. (Appendix 8.4: 8.8) The largest company in Denmark
has increased its market share with 17.8 % from 2004 to 2009. The three and five largest companies
in Finland have increased their cumulative market share with almost 13 % during the same time
period. The Swedish market has experienced an opposite trend, where the largest firms’ market
shares have decreased. The five largest firms have gone from representing one half of the market to
cover about one third of the market. Similar trends can be observed for the largest and the three
largest companies, who have lost more than 30 % of their market shares during 2004 to 2009. These
trends in Finland along with a shrinking intermediary market in Finland may be a concern. To
determine if market consolidation may be hazardous, it is important to determine if market power
relationships are present.
1.2 Problem discussion
Certain trends regarding the Finnish market’s size, pricing and structure can easily be observed.
Market structure is a key determinant to the industry’s characteristics. Several previous studies have
proven that market concentration is positively related to profitability (Choi & Weiss 2005, pp. 638-
639). The Structure-Conduct-Performance hypothesis (SCP) argues that market structure affects the
companies’ conduct, which in turn influences their performance. A high market concentration would
in this case imply high profitability. Similarly, the Relative Market Power hypothesis (RMP) argues
that consumers differentiate the products of large firms from smaller firms (real or perceived
differentiation), this may be due to herd effects or consumers may rely on the market leader’s
position as an indication of quality and save search costs (Choi & Weiss 2005, p. 638). The consensus
of both SCP and RMP is that market consolidation will benefit the largest actors in the market.
Competition is good for any industry and as laid out by Stigler (1964), there is a risk of collusion in
consolidated industries. A consolidated industry will most certainly affect the consumers adversely in
terms of biased power relationships and pricing. Cummins and Doherty (2006) show that consumers
end up paying for insurance intermediaries commissions indirectly. Hence, a higher degree of
profitability in the insurance intermediation industry should mean a more expensive product for the
consumer.

6
A clear trend towards market consolidation is observed on the Finnish insurance intermediary
market (Appendix 8.8). Market structure is critical to study as it provides information about both
pricing and quality of advice, in terms of risk of collusion (Stigler 1964). Further, market consolidation
may impair competition on a market where firms are able to exercise market power towards
consumers and competitors. A commission ban is often argued of as a consumer protective
regulation. This paper analyzes if it may have an adverse impact through its effect on market
structure. It may be contributing to inferior terms for the consumer by reducing competition in the
industry. Tests of the applicability of SCP and RMP have been carried out on the banking sector and
insurance industry (Bajtelsmit & Bouzouita 1998; Choi & Weiss 2005; Heffernan & Fu 2007; Tregenna
2009). However to our knowledge no evidence exists to the insurance intermediary industry. It
follows that an appropriate research problem is to validate the SCP and RMP hypothesis on the life
insurance intermediation industry by testing if market structure and market share is a determinant to
profitability in the life insurance intermediation industry. The obtained results provide empirical
support for continued debate regarding the relevance of market structure within the insurance
intermediary industry. As exemplified by Tregenna (2009, p. 627), market structure affects all
stakeholders to the market. A consolidated banking industry with collusive behavior can lead to
higher interest rates charged, which in turn can have significant effects on the real economy. In this
case, one can expect depressed investments and depressed growth as a direct cause of collusive
behavior. If higher profitability within the banking industry is mainly deriving from high levels of
market concentration, the profits can be seen as a drain on the real economy. A similar reasoning can
be applied to the life insurance intermediary market where market consolidation may foster
collusion, and where the consumers and small market players ultimately will have to pay the price in
terms of higher prices, search costs and poorer quality of advice given.
1.3. Research question
This study is an attempt to provide empirical evidence with theoretical support and practical
relevance to one of the key aspects of the current debate. To determine whether it is relevant to
consider effects to market structure when discussing changes to the regulatory environment
surrounding Finnish life insurance intermediaries, this study intends to examine the relationship
between market structure and profitability. With market power relationships present, firms can
exercise market power towards consumers and competitors, which clearly is not beneficial to any
industry. A panel data analysis is conducted in order to answer the study’s research question; are
market power relationships present on the Finnish life insurance intermediary market? With the
7
panel data analysis including cross-sectional and time-series data, this study concludes if there is any
significant support for the SCP and RMP hypotheses on the Finnish insurance intermediary market.
Obtained results from the study can later be used as a foundation for a continued discussion about
the future of the regulatory environment surrounding insurance intermediaries.
1.4 Hypotheses
Hypothesis testing is carried out to be able to conclude statistical significance of the obtained results
from the panel data analysis.
H01: There is no significant support for SCP on the Finnish insurance intermediation market.
H11: There is significant support for SCP on the Finnish insurance intermediation market.
H02: There is no significant support for RMP on the Finnish insurance intermediation market.
H12: There is significant support for RMP on the Finnish insurance intermediation market.
1.5 Aim
The issues surrounding a commission ban to life insurance intermediaries are rather complex. There
are many dimensions in the debate that need to be taken into consideration. This study focuses on
the relevance of considering market structure and provides empirical evidence to support arguments
laid out. Currently, to our knowledge no previous studies on market power relationships among
Finnish life insurance intermediaries exist. Therefore, this study examines if there is any support for
the SCP and RMP hypotheses on the Finnish life insurance industry. The study aims to provide
empirical evidence to the relationship between market structure and profitability within the Finnish
insurance intermediation industry. Furthermore, the study will stake out whether it is relevant in a
political context, to consider effects on market structure and competition. The results show whether
firms are able to exercise market power towards consumers and whether there is any indication of
collusive behavior within the industry. The findings are important to consumers, insurance
intermediaries, insurance companies and regulators.
1.6 Limitations
The study focuses on Finnish intermediaries that mediate pension and life insurance solutions and do
not include firms that mainly mediate non-life insurance products. Any conclusions that can be
drawn from this study are limited to apply for life insurance intermediaries rather than insurance
intermediaries in general.
8
Efficiency measures are not included in the regression due to the complexity of efficiency models and
to the lack of detailed financial reporting on the sample firms. It is not possible to conclude whether
any relationships between firms’ market shares and profitability can be explained by economies of
scale and efficiency or collusive behavior among firms. The study is therefore limited to solely
determine whether there exist any relationship between market share and profitability.
2. Literature review
2.1 Introduction
The current ongoing discussion regarding insurance intermediaries has generated some controversy.
In Finland, changes to the regulatory environment seem to have caused market consolidation and it
appears interesting to study if competition may be threatened within the industry during these
circumstances. The thesis examines market power relationships among Finnish life insurance
intermediaries and tests for the applicability of two market power hypotheses. The aim is to
conclude whether any market power relationships exist among Finnish life insurance intermediaries
and determine whether it is necessary to consider effects on market structure and competition when
discussing regulatory changes among life insurance intermediaries.
Relevant previous literature on the insurance industry covers insurance intermediaries, competition,
market regulation, agency theory and theories of market structure and profitability. A review of the
most central themes, ideas and arguments follow in this section. The literature review is divided into
three subsections; previous literature, theoretical framework and conclusion literature review.
Previous literature covers some of the previous research within the field of interest regarding this
study, with the purpose of identifying a knowledge gap and a possible research subject. The
theoretical framework section presents literature that provides a theoretical framework that can be
applied to analyze the study’s empirics. Finally, the conclusion section summarizes previous research
and identifies a knowledge gap within previous research that creates a foundation for the study’s
research problem. The conclusion section develops into what theoretical and practical contribution
the study aims to produce.

9
2.2 Previous literature
2.2.1 The role of insurance intermediaries
Cummins and Doherty (2006) describe the role of insurance intermediaries in the property causality
insurance market, their impact, the role of commissions and its meaning to the market and to
consumers. An insurance intermediary’s main task is to break down the complexity among different
insurance arrangements and to communicate the information to consumers, who should have the
product that suit them best, based on what products are available. Within this part of the insurance
market it is relatively easy for new entrants to enter the market as a small player, but to establish
themselves as one of the major players is much more difficult. This is due to the fact that large actors
are often active in several geographical areas. The way in which players compete with each other is
primarily by offering high quality advice rather than to reduce the royalties demanded from the
insurance companies. The authors believe that a higher concentration of actors in the local market
does not necessarily mean less competition, as the big players simultaneously compete in the global
market place. Results from the study show that costs to insurance companies from commissions paid
out to intermediaries end up with the consumer in the form of higher fees. However, the author
stresses that this need not be negative for the consumer who may ultimately receive a well fitted
insurance product.
2.2.2 Commission vs. fee-based remuneration model
Gravelle (1994) compares the commission-based remuneration system to the fee-based system and
calculates which system leads to the best outcome for the customer with the help of a theoretical
framework. Some of the conclusions are that even if a fee system removes the incentive for brokers
to recommend the products yielding the highest commission, the fee system does not provide
incentives to present good advice to the customer. Furthermore, even if the commission model does
create broker services of lower quality compared to a fee-based system, it does not confirm the fee
system as more preferable.
2.2.3 In-house sales force and independent agents
There are different distribution channels available for insurance companies; most common are in-
house salesmen or independent agents, who act as intermediaries. Barrese, Doerpinghaus and
Nelson (1995), examine the issue of higher cost ratios for independent agents compared to exclusive
agents. The authors’ present two possibilities for this phenomenon, either the independent agents
produce more information and provide higher quality of service to their customers compared to
10
exclusive agents, or independent agents search for different solutions from which will render them
the highest commissions. The study concludes that independent agents actually produce better
service, but the differences among them decrease when compared to the largest insurance
companies, suggesting that the largest firms spend more money on their own salesmen, resulting in
better service.
Kim, Mayers and Smith (1996) show that the cost associated with an exclusive sales force is quite
extensive which gives larger insurance companies a comparative advantage; also larger firms are
more likely to gain from having their own sales force. The authors also state that exclusive sales
forces result in higher profits in markets with high concentration among intermediaries.
2.2.4 Agency theory
Incentive problems in the relationship between insurers, intermediaries and consumers can be
analyzed by applying the principal-agent theory framework. An agency relationship exists when one
party (principal) hires a second party (agent) to fulfill a particular action. In this case, decision-making
power is delegated down from the principal to the agent. Due to the principal’s lack of knowledge
and/or time constraints, there are often difficulties in ensuring that the agent acts in the best interest
of the principal (Cummins & Doherty 2006, p. 383). The agent is thus allowed to act in his own self-
interest. This phenomenon is called the principal-agent problem and is a type of moral hazard.
Applying this framework to incentive problems within the insurance intermediary industry
complicates the relationship somewhat. Intermediaries can be seen as an agent for consumers but
also for insurance companies. It is in the insurance companies’ interest that insurance intermediaries
recommend and convey their products to consumers, while it is in the policyholder's interest that the
insurance intermediaries mediate the products most suitable for him/her. Principal-agent theory
deals with the introduction of economic incentive programs to align the principals and the agent's
interests, these incentive programs are directly applicable to the relationship between insurance
intermediaries and insurance companies. A commission-based remuneration system seems to be
enough to align the insurance companies and the intermediaries’ interests according to economic
theory. However, it is also in the insurance intermediary's interest to create value to the customer in
order to be able to build a long-term relationship with the customer. The present value of a loyal
customer is much higher than that of a disloyal customer (Bowen & Chen 2001, p. 215). This
argument indicates that there are incentives for intermediaries to act in the consumer’s interests.
There is also empirical evidence that the size of premium-based commissions from insurers in the

11
property insurance industry is positively related to the insurance company’s financial strength. In the
case of pensions, an entity that remunerates intermediaries with high commissions may not only be
of interest to the intermediary, but also to the consumer since the insurer's ability to pay out
pensions in the future is based on its financial strength (Cummins & Doherty 2006, p. 384).
2.2.5 No evidence of economies of scale on the insurance intermediary market
If mergers and acquisition activities are present among intermediaries, it will lead to less choice for
the customer and less possibilities for small and medium sized insurance firms to compete in the
market. This results in a decrease in competition on the insurance market (Cummins 1977, p. 541).
Cummins shows that there are no significant effects from economies of scale on the insurance
intermediary market which means that mergers don’t lead to a more cost efficient firm. Therefore,
he advises regulators to prevent mergers and acquisitions and force the intermediaries to adapt to a
more cost efficient model. Otherwise there is a risk that insurers’ in-house sales forces will prevail
and lead to a less competitive insurance market.
An earlier study by Cummins (1972) shows that concentration and competition are inversely related,
Cummins also concludes that markets with high concentration have higher price levels than markets
with low concentration. Thus, high market concentration can have large implications for the
competitiveness, efficiency and adaptability of an industry.
2.2.6 Market regulation and liberalization
The motives behind regulation of industries differ, regarding the intermediary market there are two
main reasons to regulation. First, regulation preserves fairness in the industry; regulation will prevent
information asymmetries from creating disadvantages for the consumer. The other aspect regards
the stability of the market, large changes in price levels can lead to customer groups who create
turmoil which can have negative consequences for the industry (Meier 1991, p. 702).
Market liberalization opens up opportunities for innovation and allows for greater choice to
consumers. In liberalized markets, agents are given an increased function as they act as information
providers. Liberalization may mean increased competition among intermediaries and increased
pressure to provide good advice. (Drabbe 1994)
2.2.7 Structure-Conduct-Performance and Relative Market Power Hypothesis
The Structure-Conduct-Performance hypothesis (SCP) was developed out of neoclassical economics
by Joe Bain in industrial organization (1968), although many researchers have added to its basic
12
outline since then (Weiss 1979). The SCP hypothesis addresses the relationship between market
structure and performance. The market structure affects the conduct of organizations, which in turn
affects performance (Choi & Weiss 2005, p. 636). The SCP paradigm predicts a positive relationship
between profitability and market concentration level (Chortareas, Garza-Garcia & Girardone 2009, p.
5). Stigler (1964) makes an important contribution to the SCP literature by suggesting that effective
collusion of firms increases with market concentration, and collusion then determines the firms’
performance (Choi & Weiss 2005, p. 637). A closely related theory to SCP is the Relative Market
Power hypothesis (RMP), which argues that only firms with large market shares and well-
differentiated products are able to exercise market power and earn supernormal profits (Berger
1995, p. 404). According to RMP only large companies can influence prices and increase profits as
opposed to under SCP where higher generic profits would arise from higher market concentration
(Tregenna 2009, p. 615).
There are a vast number of previous studies that test for the applicability of SCP and RMP within the
banking industry on different geographical markets, the amount of studies covering the insurance
industry seem to be fewer. Previous literature, within the insurance industry, has studied the insurers
rather than the insurance intermediaries and no evidence of the two market power hypotheses
among life insurance intermediaries has been presented.
2.3 Theoretical framework
2.3.1 Empirical evidence of SCP and RMP
Berger (1995) performs 60 different cross-section regression analyses covering different banking
sectors in the US. Berger includes tests for the SCP and the RMP hypotheses and two tests for
efficiency. To assure homogeneity, the data sample only includes firms that have existed throughout
the entire time period. Profitability is measured by return on assets and return on equity; market
shares and market concentration are measured on the basis of the banks’ deposits. Since the
concentration ratios and the Herfindahl-Hirschman index yielded similar results, the latter is chosen
as a measure of concentration. Berger also includes three control variables, one for market growth
and two dummy variables for the bank’s state and metropolitan area. In most regressions, the
results show a positive statistically significant market share coefficient and a statistically insignificant
concentration coefficient. Out of the 60 regressions, the market share coefficient is positive and
significant in 29 cases at the 10 percent significance level and significantly negative in three. The
market concentration coefficient is negative and significant in 20 of the regressions. Overall, Berger
13
concludes that there is support for the RMP hypothesis while there is no support for the SCP
hypothesis. Berger also concludes that it is with the inclusion of the market share variable that a
positive coefficient for concentration is removed. The results suggest that it is only the largest firms
within the banking industry that can exercise market power. However, the results from this study
should be analyzed with care. By analyzing the data as a pooled sample of cross sectional elements,
Berger assumes the relationships to be identical for all firms and over time. Without providing any
information about tests that examine if this assumption is realistic, the results may be biased and the
study’s validity is lowered.
Bajtelsmit and Bouzouita (1998) study the private passenger automobile insurance industry in the
United States with panel data analysis, a significant positive impact of concentration on profitability
is found for the studied period. The authors analyze performance at state level to account for local
competition and data is obtained from the annual reports of the companies included in the sample.
The independent variables include state specific and market specific factors and the Herfindahl
concentration index is included as a test for the SCP paradigm. Bajtelsmit and Bouzouita make the
assumption that the error term in the equation computed from the pooled cross-section and time-
series data set is an independent random and identically distributed variable with mean zero and
constant variance. When assuming no correlation between the error term and the variables, a
random effects model (error components model) can be applied. White’s test is conducted to
account for a possible heteroskedasticity problem and Durbin Watson statistics is applied to account
for autocorrelation, the results do not warrant for the use of an alternative empirical technique. The
results from the analysis show that there is support for the SCP paradigm in the context of private
passenger automobile insurance.
Choi and Weiss (2005) examine the relationship between market structure and profitability in the
property-liability insurance market using hypotheses testing for three market power approaches;
SCP, RMP and Efficient Structure (ES). The SCP relationships are hypothesized to be simultaneous
cause and effect relationships between market structure, firm conduct and firm performance.
Therefore a simultaneous equation bias may exist and augmented Durbin-Wu-Hausman tests are
conducted to determine whether endogeneity exists with respect to market share and concentration
variables in the equation. For all equations containing no endogenous variables, generalized method
of moments (GMM) is used to estimate heteroskedastic equations. For those with at least one
endogenous variable, heteroskedastic two-stage least square is used. In line with Bajtelsmit and
Bouzouita (1998), Choi and Weiss (2005) use HHI as a measure of concentration on the basis of
14
Stigler’s (1964) arguments for its superiority over concentration ratios. Profit margin is used to gauge
the insurer’s profitability. Control variables in the study include market growth, advertising-intensity,
reinsurance utilization, mix of business, distribution system, regulatory system, stock ownership form
and group status. Efficiency is estimated econometrically using stochastic frontier analysis, which is
an extension of regression analysis that allows estimates of efficiency to be derived explicitly. The
data sample population consists of all insurers that report annual statements to the National
Association of Insurance Commissioners (NAIC). From this sample any insurer with a negative
surplus, assets or premiums, were deleted. Also for the efficiency analysis, all insurers with negative
input or output were deleted. Since firms with a minimum market share are not likely to have
significant impact on price and supply on the market the authors discarded insurers with a market
share less than 0.1% of total premiums. The final sample constitutes of 68% of total premiums
written during the period. Cross-sectional and time-series data are pooled in the models, however it
is not panel data since they allow insurers to enter and exit different states (markets) over the
sample period. ES argues that firms can offer lower prices by being efficient, which enables them to
capture larger market shares, leading to increased market concentration. Support is found for ES
hypothesis as well as a positive relationship between market concentration and profitability. No
support is found for RMP and the authors’ stresses the importance of examining the efficiency of
firms when examining market structure.
Heffernan and Fu (2007) study the relationship between performance and market structure in the UK
retail-banking sector by using panel data analysis. In this case, little support is found for the efficient
structure hypothesis whereas SCP is prevalent among credit products while RMP is dominant among
deposit products.
Tregenna (2009) analyses the effects of structure on profitability in the US banking sector during the
pre-crisis period. Bank level data is used to conduct panel regressions to test the effects of
concentration, market power, bank size and operational efficiency on profitability. Firms with a
negative mean profitability and firms without a minimum of six nonconsecutive quarters of full data
is excluded from the sample. Since the direction of the causal relationship is a critical question in the
study, Tregenna argues for the importance of conducting formal econometric tests. GMM is used to
account for possible endogeneity due to the nature of the variables and the issues of causal
relationships between concentration and profitability. The equations in the study are estimated using
four econometric techniques. Tregenna first uses the ordinary least squares model (OLS) with two-
way fixed effects to check for both time and firm specific changes. Operational efficiency is found not
15
to be a strong determinant of profitability, however robust evidence is found that concentration
increases bank profitability. The results prove to hold even when the largest banks are removed from
the sample and the author argues that higher profits arising from higher concentration are at the
expense of the rest of the economy. The results support the SCP hypothesis of a causal relationship
between overall concentration and profitability.
Gonzalez (2009) analyzes how efficiency and political economy variables influence the structure of
the bank market in 69 countries. In order to explain the underlying reasons for the existence of a
positive relationship between concentration and profitability, Gonzalez (2009) conducts a panel data
analysis. He uses a two stage least square random effect model and argues that the fixed effect
model is not an option because it is not feasible under the assumption that regulatory and
supervision variables are time invariant. The study shows that the explanatory power of efficiency
varies with countries different political economy variables. Gonzalez further concludes that antitrust
enforcements have different beneficial effects for different countries, depending on the countries
level of regulation and supervision.
2.3.2 Herfindahl-Hirschman Index
The Herfindahl-Hirschman Index (HHI) measures the concentration of companies in the market. It has
been used since 1982 by the US Department of Justice for analysis of market structure effects from
mergers and acquisitions. HHI is calculated by summing the square of each actor’s relative market
share to the total market. In HHI, each actor’s market share can both be expressed as a percentage
and in decimal form. In the case where it is expressed in decimal form HHI varies from 0 to 1 and in
the event where it is expressed as a percentage, the index varies from 0 to 10 000. By squaring the
individual weights, HHI adds significant amount of weight to large players compared to smaller
actors. According to economic theory, the risk of collusion increases when the market share of
leading companies and inequality in market shares increases. HHI is thus a useful measure of market
concentration in the case where applied economic theory holds. (Laine 1995, pp. 425-426) A
numerical example of HHI in comparison to concentration ratios is provided in appendix (8.16).
2.3.3 HHI - A Concentration Measure Taking the Consumer’s Point of View
Laine (1995) makes the assumption that a company's market share and the number of customers are
proportionate, which means that the HHI reflects the average market share consumers face and that
the HHI is taking the consumers perspective when measuring market concentration. If the HHI is
calculated based on market shares expressed in percentage, an index value of 3 000 reflects an

16
average market share of 3000/100 = 30%. Laine further argues that, as the HHI takes the consumers
perspective, HHI is very much an appropriate measure when analyzing mergers between companies
in order to ensure consumer protection (Laine 1995, pp. 427-428). The assumption that the number
of customers is directly related to a company's market share is worth questioning. As a company's
market share is a function of several parameters, the validity of Laine’s conclusion that HHI takes the
consumers perspective, may be limited.
2.3.4 The relationship between HHI and Price cost margins
Cowling and Waterson (1976) show that the price cost margins are directly related to HHI, where a
high index value indicates higher margins (Clarke & Davies 1982). Cowling and Waterson’s (1976)
findings are in line with Stigler’s (1964) theory of collusion, where Stigler highlights HHI's relevance as
an explanatory measure of market structure. Cowling and Waterson model the relationship between
HHI and price cost margins as a function of price elasticity and number of players within the industry.
The model is a simplification of reality and is based on several assumptions, including constant
incremental cost for the companies in the industry. The study's reliability is relatively weak in the
sense of the model's practical applicability, in large part because of the difficulty of isolating the
effects from several parameters that can affect pricing in the industry. There were also difficulties in
obtaining good reliable data for price elasticities. Variables that according to Porter can affect pricing,
such as entry barriers and the bargaining power of suppliers can deepen the analysis. Unfortunately,
the study lacks measurable data on these variables, which further restricts the explanatory power of
the variables obtained in the model. We should therefore interpret the results with caution, although
they can give us an indication of the relationship between competition and power relationships
between consumers and businesses.
2.4 Conclusion Literature review
Relevant previous literature on the insurance industry covers theories of market structure,
profitability, competition, market regulation and agency theory. Most published previous literature
within the insurance intermediary sector seems to cover markets outside Scandinavia. Previous
literature show that intermediaries play an important role on insurance markets and that market
structure does affect the markets stakeholders. Cowling and Waterson (1976) show that the price
cost margins are directly related to HHI and Cummins (1972) shows that concentration and
competition are inversely related and concludes that markets with high concentration have higher
price levels than markets with low concentration. Cummins and Doherty (2006) deal with

17
intermediaries’ role within the property causality insurance industry and the relationship between
consumers, intermediaries and insurance companies. Results from the study show that costs to
insurance companies from commissions paid out to intermediaries end up with the consumer in the
form of higher fees. In line with financial pricing theory, Cummins and Doherty (2006) conclude that
the pass-through rate on consumers for all types of commissions paid out to insurance
intermediaries would be 100 %. The majority of research on the market power relationships and the
relationship between market structure and profitability seem to be on retail banks and insurance
companies. Bajtelsmit and Bouzouita (1998) find support for the SCP paradigm in the context of
private passenger automobile insurance. Choi and Weiss (2005) study the property-liability insurance
market and find Support for SCP whereas no support is found for RMP. Heffernan and Fu (2007)
examine the retail-banking sector in the United Kingdom and conclude that SCP is prevalent among
credit products while RMP is dominant among deposit products. Tregenna (2009) studies the US
banking sector and the results support the SCP hypothesis of a causal relationship between overall
concentration and profitability. The results are mixed for the RMP hypothesis, however in most cases
the researchers seem to be able to validate the applicability of the SCP hypothesis within the banking
industry and the insurance industry. To our knowledge there are no previous studies of market
power relationships within the life insurance intermediation industry, especially not on the
Scandinavian markets. As predicted by the SCP hypothesis, market structure affects the conduct of
firms, however Cummins and Doherty’s (2006) conclusions show that market structure also affects
consumers. Thus, it seems important to analyze the relationship between market structure, market
shares and profitability within the life insurance industry. This study intends to contribute with the
empirical evidence to the SCP and RMP hypotheses that is lacking within previous literature.
In order to make the study feasible, previously developed theoretical frameworks, mathematical
measures and statistical methods are applied. As Tregenna (2009) points out, most analyses of the
relationship between concentration and profitability seem to use either cross-sectional or time-series
methods. There are little analyses using panel data, despite the advantages of these models. In line
with Tregenna (2009), an OLS panel data regression analysis is conducted. The OLS regression
includes White’s covariance estimator, which reduces overestimated standard errors due to
heteroskedasticity. Tregenna (2009) applies a two way fixed effect model, this study uses a firm fixed
effect model instead, since there are no time effects within each cross-section that needs to be
filtered and the use of time fixed effects causes collinearity issues. In addition to the exogenous
variables included in the regression to test for the applicability of the specific hypotheses, other
18
factors may influence profitability within the industry. In the same manner as previous studies
(Bajtelsmit & Bouzouita 1998; Berger 1995; Choi & Weiss 2005), this study includes market growth as
a control variable to account for possible external effects on profitability that can be explained by
market growth.
3. Method
3.1 Methodology
In Finland the largest insurance intermediaries have gained market shares recently, causing the
market to consolidate. With this in mind this study aims to analyze the relationships between market
structure and profitability by testing for evidence of the SCP and RMP hypotheses on the Finnish
insurance intermediary market. Through panel data analysis based on secondary data compiled from
the annual reports of the companies constituting our sample, conclusions can be drawn about the
relationship between profitability, market share and market concentration among Finland’s
insurance intermediaries.
3.1.1 Ontology
The primary objective is to determine the nature of the phenomenon’s reality (ontology), which
affects how knowledge can be acquired (epistemology) and this affects the research process
(methodology). This study adopts the view of reality as a contextual field of information (contextual
relativism), which acknowledges that human beings are continually processing information, learning
and adapting to their environment. (Ryan, Scapens & Theobald 2002, p. 37) This connects to the idea
that RMP can be explained by higher perceived professionalism or quality with larger firms or herd
behavior among consumers and to SCP through Stigler’s theory of collusion. The study results are
interpreted in the context of the Finnish market and market specific factors such as the regulatory
environment surrounding the sample firms may affect the results. Contextual relativism is
appropriate as it allows for changing relationships among variables and context dependent
interpretation. (Ryan, Scapens & Theobald 2002)
3.1.2 Quantitative research approach
The adopted ontological view allows the use of statistical methods to provide explanations regarding
phenomena’s in the world. (Ryan, Scapens & Theobald 2002, p. 37) The included variables are based
on quantitative observations. It follows, that the most appropriate results are obtained by pursuing
19
quantitative research, since the purpose of this paper is to provide empirical evidence to possible
market power relationships. A brief description of the basis for qualitative research is provided in
Appendix (8.18).
3.1.3 Induction & deduction
With a deductive approach the researcher uses existing literature within the area of research as
common knowledge. The theories applicability to the market of interest is then tested for by the
author to investigate if existing theories are valid (Jacobsen 2002, pp. 34-35, 45). This is opposite to
the inductive method where the starting point is the analysis of observations and the results form
the base for new theories. Deduction is also called the bottom-up method, where the study’s starting
point is in theory and then proceeds to examine how theory fits practice. This study uses a deductive
approach and its starting point is in previous literature about the SCP and RMP hypotheses. The
hypotheses applicability is then tested for to the Finnish life insurance intermediary market.
3.2 Data collecting methods
The data sample is collected from the Finnish FSA (available April 8th 2011) and the online database
Finder (available April 8th 2011). Data concerning mediated premiums is collected from the Finnish
FSA, while financial data concerning revenue and EBIT are collected from Finder. The financial
information available at the Finder database is collected by Finder from the annual reports of the
firms included in the database. To ensure that the data obtained from Finder has not been altered in
any way, a random set of data points are picked out and compared to their original data source. Data
is collected for the time period 2004-2009, the time period is motivated by the experienced
consolidating trend seen on the Finnish intermediary market during this period and is restricted by
the availability of adequate earlier data concerning mediated premiums and EBIT. Some data points
concerning revenue and EBIT are missing in Finder’s database and to create a complete set of data
the missing data points are obtained from the firms’ annual reports. Starting point for the selection
criteria of the chosen firms is the Finnish Financial Supervisory Authority’s register of authorized
insurance intermediaries. Insurance intermediaries that have permission to mediate life insurance
are chosen to be included in the population. The study takes intermediaries that have disappeared
from and entered the market during the selected time period of the analysis into account when
calculating market shares and HHI. The measures are based on firms that have been active during the
respective year. The companies are chosen on the basis of their relative size in order to capture a
large share of the entire market. Their relative size is determined by relating the amount of
20
premiums mediated by the specific firm to the total amount of premiums mediated by life insurance
intermediates during 2009. The 18 largest firms constitute our sample and their cumulative mediated
premiums represent over 90 percent of the total market for life insurance intermediaries.
3.2.1 Data transformation
The sample firms use different fiscal years; therefore a transformation is necessary to add revenue
and profit to comparable calendar years. This is done by dividing the revenue and profit with twelve
months and adding the number of months that have elapsed since the new calendar year to previous
year’s data. Since two firms have entered the market during the measured time period, data on
previous years are missing for those firms, causing an unbalanced data panel. The applied
econometrical model takes the unbalanced data sample into account automatically when performing
the estimation.
3.2.2 Quality of data
The collected data originates from the firms’ annual reports and any financial information published
by the sample firms has been audited by external parties. The accuracy of the data is high since it’s
collected from a generally accepted financial database and in some cases directly from the firms’
annual reports. Since data from firms with broken fiscal years are adjusted to fit the calendar year,
some market characteristics may not be identified in the regression. However, the transformation is
less serious if a non-seasonal earnings pattern is assumed for all sample firms over each year. The
sample constitutes of the 18 largest firms in the market but covers both large and small actors. The
relative size of the smallest firms included in the data sample do not differ significantly from the
smallest firms within the population, therefore a fair view of the market is represented by the data
sample.
3.3 Data processing methods
3.3.1 Regression analysis and hypothesis testing
The relationships between market structure and profitability are determined econometrically by
conducting a regression analysis. The analysis examines the explanatory power of market
concentration and firm specific market shares to operating margins (EBIT margins) among the firms
in the sample space. The individual market shares are calculated as the individual firm’s total amount
of mediated insurance premiums divided by the total amount of mediated insurance premiums for
the market. The market shares are reflected by mediated premiums rather than net sales to ensure a
21
fair measure of the firms’ mediating business. Market concentration is measured yearly with the
Herfindahl-Hirschman index by adding together the squared individual market shares for the sample
firms. Market growth is important to account for because it may have a direct effect on the firms’
profitability. Rapid market growth may attract other intermediaries to enter the market, possibly
depressing profitability. On the other hand, if significant barriers to entry exist, then growth on the
market may lead to increased profitability among the firms. (Choi & Weiss 2005, p. 645) In addition,
high growth allows firms to expand with less intense price competition than in a slow growth market.
As explained, macroeconomic changes do play an important role for firms’ profitability (Tregenna
2009, p. 620) and the issue of impact from macroeconomic factors will be dealt with, through the
inclusion of a control variable for market growth in the estimation model in a similar manner with
Berger (1995) and Choi and Weiss (2005). Once the relationships are determined, the set hypotheses
are tested for statistically with a student’s t-test. The hypotheses are tested at different significance
levels to ensure statistical significance of the found relationships. However, even when statistical
relevance can be concluded, there is always a risk of obtaining unfair results. Type I errors occur
when the null hypothesis is rejected despite that the hypothesis is true. Type II errors occur when the
null hypothesis is not rejected even though it is false (Ryan, Scapens & Theobald 2002, p. 130)
3.3.2 The estimation model
The collected data creates a panel of data, which comprise of both time series and cross-sectional
elements, where the cross-sectional elements are the same for the observed time period. (Brooks
2008) The most straightforward way to handle combined time series and cross-sectional data is to
perform an ordinary least square (OLS) pooled regression. However, this process has severe
limitations, such as the assumption that the relationships are identical for all firms and identical over
time. The alternative approach is to estimate separate time series and separate cross-section
regressions but this approach may also fail to identify important relationships. Therefore, if the data
can be organized as panel data, a panel data analysis should be conducted. By combining cross-
sectional and time series data, one can increase the number of degrees of freedom, and increase the
power of the test by employing information on the dynamic behavior of a firm sample at the same
time. These studies lead to a rich body of data given the wide variability between individuals, coupled
with much less variability for a given individual over time (Hausman 1978). Furthermore, the uses of
panel data can help to mitigate multicollinearity problems that otherwise are quite common when
analyzing individual time series. Panel data is usually divided into two types of estimator approaches,
the fixed effect and the random effect approach.

22
3.3.2.1 The fixed effect model
The fixed effect model is sometimes referred to as the Least square dummy variable model (LSDV).
By decomposing uit into uit = μi + vit where μ is a firm specific term and v which varies over time and
firm, the model captures what is left unexplained about Yit. (Brooks 2008) μi symbolizes all of the
variables that affect yit cross-sectional but do not vary over time. It is possible to use a time fixed
effect model if we assume that the average y varies over time, but not cross-sectionally. An example
is where the regulatory environment changes part way through a sample period. This change may
affect y, but in the same way for all the firms in the sample. It is also possible to use a firm- and time-
fixed effect model, called a two-way model, however with increased complexity.
3.3.2.2 The random effect model
In the same way as the fixed effect, the random effect model assumes different intercepts for each
firm that are constant over time. The difference between the models arises in the assumption about
how the intercept for each cross-sectional unit is calculated. The random effect model assumes the
intercept to come from a common intercept α, which is constant for all firms and time and a random
variable εi that is constant over time but varies cross-sectionally. To be able to use the random effect
model, two preconditions do generally have to be fulfilled. First, the error-terms need to display the
following characteristics; εi must have zero mean, constant variance σ2 and be independent of the
explanatory variables Xit (Brooks 2008, pp. 498-500). Second, the data sample must be drawn
randomly from the sample population (Judge, et al. 1982, p. 497).
To ensure that the appropriate estimation model is applied a redundancy test is first conducted to
conclude whether the data can be pooled or not. The choice between the fixed effect and random
effect estimation models is then established on the basis of how the data sample is chosen and the
characteristics of the data sample. Also, a Hausman test is conducted to indicate what model is the
most efficient.
3.3.2.3 Redundancy test
To decide if the data can be pooled or not the redundant fixed effect – likelihood test is carried out
to check for redundant fixed effects. The null hypothesis, that the cross-section fixed effects are zero,
is rejected at great significance, therefore pooling of the data is not appropriate.
Table 1 - Redundancy test

23
Effects Test Statistic Degrees of freedom p-value
Cross-section F 10.303738 (17,81) 0.0000
Cross-section Chi-square 117.439425 17 0.0000
A pooled regression assumes that all intercepts are the same for each firm and each time period. This
assumption is proven to be inappropriate and therefore, a fixed effect or random effect model has to
be applied.
3.3.2.4 The choice between fixed effect and random effect estimation model
The general view is that the random effect model gives the most efficient coefficient estimates
(Brooks 2008). However, for the random effect model to be the appropriate choice, the two
preconditions must be satisfied. The characteristics of the error-terms are tested with the Hausman
test. The results from the Hausman test gives a probability of 0.9485 that the null hypothesis cannot
be rejected, which means that a random effect model is valid, however a fixed effect model is still
valid but less efficient.
Table 2 - Hausman test
Test Summary Chi-Sq. Statistic Chi-Sq. d.f. p-value
Cross-section random 0.359486 3 0.9485
However, the second precondition is violated in this study since a random selection criterion is not
used. Therefore, a random effect model cannot be applied and the appropriate choice is to use the
fixed effect model. Clarke, et al. (2010) also argue that the fixed effect model is more appropriate if
the data set is limited in range and characteristics, which further suggests the use of a fixed effect
model. Based on the results from the Hausman test and characteristics of the data sample, the
appropriate choice is to use the fixed effect model with cross-sectional fixed effects.
Equation 1 – Regression equation
Yit= αi + βMSit + βCONCit + βGrowthit + εit
24
Equation 1 shows the fundamental equation used in the fixed effect estimation model. Yit denotes
the dependent variable operating margin of the ith individual and the tth time period and the
explanatory variables are; market share (MSit) measured as the specific firms share of total mediated
premiums for the ith individual and the tth time period, market concentration (CONCit) measured as
Herfindahl-Hirschman index based on (MSit), and market growth (Growthit). εit is the error term for
the ith individual and the tth time period and is assumed to have zero mean and constant variance and
to be independently distributed over individual and time. α is the intercept term for each firm, which
is assumed to be constant over time but different for each firm. (Judge, et al. 1982, p. 477)
3.3.2.5 Hypotheses rejection criteria
The study aims to conclude whether there is any support for two market power hypotheses and as
shown in the introduction section the set hypotheses are:
H01: There is no significant support for SCP on the Finnish insurance intermediation market.
H11: There is significant support for SCP on the Finnish insurance intermediation market.
H02: There is no significant support for RMP on the Finnish insurance intermediation market.
H12: There is significant support for RMP on the Finnish insurance intermediation market.
To be able to conclude support for the SCP and RMP hypotheses, a mathematical expression of the
set hypotheses is required. The SCP hypothesis predicts a positive relationship between market
concentration (HHI) and profitability (EBIT margin) among the sample firms whereas the RMP
hypothesis predicts a positive relationship between market share and profitability among the sample
firms. Thus, if a significant positive coefficient is found for HHI, H01 can be rejected since significant
support for SCP is found. If a significant positive coefficient is found for market share, H02 can be
rejected since significant support for RMP is found.
Reject H01 if: βMS > 0 and p-value ≤ 0.1
Reject H02 if: βCONC > 0 and p-value ≤ 0.1
3.3.3 Issues that may bias the regression results
3.3.3.1 Multicollinearity
Multicollinearity can occur when the independent variables in the regression have high correlation
with each other. Compared to modeling individual time-series, some of the problems with
multicollinearity are mitigated by conducting a panel data analysis. (Brooks 2008, p. 498) However,

25
multicollinearity leads to larger standard errors and lower precision of the regression analysis;
therefore a correlation matrix is compiled and represented in the results section. If the correlation is
higher than 0.7 or lower than negative 0.7, multicollinearity is a risk.
3.3.3.2 Autocorrelation
When performing a regression analysis it is important that the error terms, or residuals, show a
random distribution. If the error term is related to the previous observation the regression estimates
of variance and standard deviation will be biased. Autocorrelation can pose a problem to the
regression analysis; however, the issue is most critical when analyzing time-series data. By
conducting a Durbin-Watson test, the regression error residuals are tested for autocorrelation.
(Judge, et al. 1982, p. 289)
3.3.3.3 Heteroskedasticity
A possible heteroskedasticity issue exists when the variables in the regression do not have constant
variances. If the value of the explanatory variable increases with the standard error (εi) the
regression has got a heteroskedasticity bias. If the regression does display heteroskedasticity, the
results include a biased variance estimator and ultimately biased standard errors. (Judge, et al. 1982,
p. 420) Biased standard errors yield biased probability values and inferences made with
heteroskedasticity present in the regression can be misleading (Brooks 2008, p. 135).
It is possible to use graphical methods to conclude the existence of heteroskedasticity, unfortunately
the form or the cause of heteroskedasticity is usually unknown and a plot is likely to reveal nothing.
(Brooks 2008, pp. 136-137) Therefore, this study uses White’s heteroskedasticity test to conclude
whether the data sample exhibits heteroskedasticity. If heteroskedasticity does exist within the data
sample, the use of the White covariance estimator leads to more accurate standard errors and
increased significance of the results.
3.3.3.4 Endogeneity
Endogeneity refers to when the regression residuals correlate with the explaining variables. In other
words, when an independent variable is not exogenous but also depends on the dependent variable.
If endogeneity is ignored the variable coefficients may become over– or underestimated, which can
lead to biased regression results and ultimately wrong conclusions being drawn. With an instrument
variable model (IV model), such as Generalized method of moments (GMM) or Two stage least
square (TSLS), the variables can be tested for endogeneity. IV models include instruments, which are
exogenous variables with high correlation with the explanatory variable and that are uncorrelated

26
with the residuals. The main difficulty with IV models is to find instruments that have the right
characteristics. One needs to be sure that the instruments are uncorrelated with the residuals
otherwise they become “weak instruments”. If weak instruments are included in the model, the
results cannot be used to draw any valid conclusions since a small bias from OLS can become large
when including weak instruments. Furthermore, an IV model is always less efficient than an OLS
model. Also, the Durbin-Wu-Hausman test for endogeneity may not be entirely conclusive,
particularly as it is sensitive to choice of instrumental variables (Tregenna 2009, p. 617). The inclusion
of weak instruments is potentially worse than ignoring a possible endogeneity problem (Stock,
Wright & Yogo 2002; Hahn & Hausman 2003). Tregenna (2009) uses instruments to conclude that
there are no endogenous variables in her study. As Tregenna (2009) argues, the use of Durbin-Wu-
Hausman test can be inconclusive and previous researchers have pointed out that there is a risk that
the results become even more biased than with the use of OLS. The risk of including weak
instruments is high in this study since the characteristics of any possible instrument are not known.
Therefore, endogeneity is chosen not to be tested for and there is a risk of a small endogeneity bias
in this study. The alternate choice is to follow a similar approach as Tregenna (2009). Though, this is
difficult since the validity of the instruments cannot be determined.
3.4 Reliability and validity
The study’s reliability depends on its replicability and its degree of objectiveness in the sense that the
results have not been shaped in any way by the author. Validity measures how the results
correspond with reality; if the empirical results are true the study’s validity is high. (Ryan, Scapens &
Theobald 2002, p. 155)
3.4.1 Reliability
The study is based on public available financial data and the study formulates in detail how the data
has been collected. Further, the methodological framework, assumptions and choices are laid out
clearly to ensure a high degree of replicability. The purpose is to ensure that the same results can be
obtained independently of the researcher and to show that the results have not been shaped by the
researchers in this study. Since the data is taken from the firms’ annual reports the view is that the
accuracy of the data is high. Due to the fact that companies use different fiscal years the data has
been adjusted to reflect the calendar year to allow for comparison. Since this is mentioned in the
data processing chapter the study’s reliability is not affected, even if it does affect the study’s validity
to some extent.
27
3.4.2 Internal validity
The internal validity of the study is affected by how well the explanatory variables included in the
regression explain the examined variable. A study with high internal validity ensures that the changes
in the dependent variable are explained by the independent variable changes and not by other
confounding factors. The internal validity determines whether valid conclusions can be drawn from a
study. By building in sufficient controls to the research design, the likelihood of drawing valid
conclusions is enhanced. (Ryan, Scapens & Theobald 2002, pp. 122-123) This study maximizes the
internal validity by applying an appropriate research design that avoids measurement errors and
controls for any biases within the data sample. The data is collected from the Finder database and
the sample firms’ annual reports. The correctness of the data provided by the Finder database is
validated by comparing the provided data to its original data source and this contributes to an
increase of the study’s internal validity. Two firms have entered the market during the measured
time period (Appendix 8.9). Thus, data points for these firms are missing for prior years resulting in
an unbalanced data panel. The statistical program takes unbalanced data into account when
performing the regression, despite this; the effects from the missing data points may affect the
results. Since the missing data points are accounted for and there are only five missing data points
out of 108, the possible bias is small. The HHI is computed on a yearly basis for the entire market and
to enable homogenous comparison, the transformation of the firms’ fiscal years into calendar years
is necessary, even if it affects the study’s validity adversely. Large differences in relative size among
the sample firms may lead to large differences in standard errors. This is because large firms appear
to have more constant EBIT margins compared to smaller firms. One possible explanation is that the
larger firms are more stabile and that the absolute smallest firms may only have a single or a few
employees, which makes their EBIT margins subject to manipulation through the amount of salary
the business owner, chooses to take out. In this case the smallest firms will have margins that differ
significantly from year to year due to changes that may be different from effects from the
explanatory variables. This results in higher volatility of the explanatory variables and is a sort of
heteroskedasticity problem within the data sample. This issue is treated with the use of the White
covariance estimator and the smallest firms in the population are not included in the data sample to
avoid obtaining misleading results.
In relation to previous studies (Berger 1995; Choi & Weiss 2005; Tregenna 2009), the collected data
sample is small and the regression estimates may be sensitive to outliers. The regression estimates
may also be sensitive to the choice of estimation model due to the size and characteristics of the

28
data sample. Therefore, the importance of applying the correct model is critical to avoid biased
results. The study follows Judge, et al. (1982) and Brooks’ (2008) selection criteria for the choice
between the random effect model and the fixed effect model. The selection criteria show that the
fixed effect model is the appropriate estimation model to use in this study. Thus, the study’s internal
validity relies on and the analysis is restricted by the assumptions that need to be made within
regression analysis and the fixed effects estimation model.
3.4.3 External validity
External validity relates to the extent to which the results of a study may be generalized to other
settings and samples. (Ryan, Scapens & Theobald 2002, p. 123) This study aims to provide empirical
evidence to market power relationships among Finnish insurance intermediaries and the study’s
external validity does not come as a first priority when the appropriate research design is chosen.
However, it is interesting to discuss the results in the context of the Swedish market as a similar
regulatory environment to the Finnish may be to expect in Sweden. Previous studies have been on
different industries and whether it’s possible to apply the results of this study to other markets or
countries is difficult to predict. It seems that similar results have been obtained within the respective
industry despite that the studied markets have differed (See Bajtelsmit & Bouzouita 1998 and Choi &
Weiss 2005 on the insurance sector and Haffernan & Fu 2007 and Tregenna 2009 on the banking
sector). The explanation to this can very well be that the firms have similar conducts and similar roles
irrespective of what market they’re present on. If this reasoning is valid, the results do have some
external validity as long as the results are applied to the same industry. The Finnish and Swedish
markets have many similarities and in fact many actors in these markets are present on both
markets. Both the Finnish and Swedish intermediary markets are exposed to competition and are
supervised by the FSA of the respective country. Also both the Swedish and Finnish insurance
markets are to some degree government controlled even though they are exposed to competition.
The role of insurance intermediaries seems to be the same on both markets and previous to the IMA;
intermediaries had the same remuneration model in Finland and Sweden. The two markets do differ
in terms of size and the Swedish market is the largest market in Scandinavia. Market concentration
levels also differ and the concentration level is a critical determinant to the choice of research design,
this makes it more difficult to determine the extent to which the results can be generalized to apply
for other markets. Any conclusions drawn from the analysis in this study are applicable to Finnish life
insurance intermediaries and one should be careful when generalizing the obtained results.
29
3.4.4 Ethical aspects
The study is based on publicly available financial data that has been disclosed by the sample firms in
the study. Furthermore, the data has not been altered to produce any misleading results and the
choice of research model has been carried out with care to ensure no misapplication of statistical
methods. Therefore, there should be no ethical aspects that need to be considered as in the case
where sensitive or harmful information have been disclosed without consent by the examined firms.
3.5 Method criticism
The analysis allows us to identify any linear relationships among the variables included in the
regression and fails to identify any other dependencies among the variables. The applied method is
appropriate if we assume that the dependencies among the variables can be explained to some
extent by a linear relationship, since the aim is to identify whether any market power relationships
exists among the Finnish life insurance intermediaries. Regression analyses are quite sensitive to
extreme data points, especially when the dataset is relatively small. To ensure robustness of the
regression analysis it’s preferable to have a larger dataset than that available to this study. However,
the degrees of freedom and the power of this test are increased by combining cross-sectional and
time series data into panel data. Panel data leads to a rich body of data given the wide variability
between individuals, coupled with much less variability for a given individual over time (Hausman
1978). Using panel data rather than individual time series can also help to mitigate multicollinearity
problems that otherwise are quite common among time series. A regression with panel data can also
help to remove the impact from omitted variables, that otherwise would generate biased results
(Brooks 2008, p. 489).
The purpose of the econometrical model is to explain a process or phenomenon and therefore it is of
high priority that the correct explaining variables are included. Since the aim is to determine the
relationship between market structure and profitability within the industry, widely accepted
measures of market structure and profitability are included in the regression. In line with Bajtelsmit
and Bouzouita (1998), Berger (1995) and Choi and Weiss (2005) the study includes HHI as a measure
of concentration on the basis of Stigler’s (1964) arguments for its superiority over concentration
ratios. By squaring the individual market shares in the calculation of HHI, significant weight is added
to the largest actors within the industry. According to previous literature, market power is most likely
to be exercised by the market leader. This makes HHI a highly relevant measure of market
concentration when analyzing market power relationships. The firms’ relative market shares are

30
included as well, to be able to measure the impact from increased or decreased market shares on
profitability. The relative market shares are calculated as the firm’s relative share of the total amount
of mediated premiums. Mediated premiums are a good measure of market share compared to using
net sales, which could be misleading since it includes revenue from other sources than mediation.
Profitability is measured in a similar manner with Choi and Weiss (2005) who use profit margin to
gauge insurers’ profitability, this study includes EBIT margin as a measure of profitability to exclude
any deceptive effects and to ensure that the profitability of the main business is measured. To
account for external factors, a growth control variable is included in the analysis in the same manner
with Berger (1995) and Choi and Weiss (2005). Since changes to the size of the market affects firms,
it is necessary to include a control variable that removes the effects that come from these changes.
By conducting a series of tests on the data sample, the study identifies and removes any obstacles
that interfere with the results. These tests check for any problems arising from heteroskedasticity,
multicollinearity and autocorrelation. If these issues are ignored it can result in biased regression
estimates. However, these tests are not always flawless and one still needs to analyze the results
critically before drawing any conclusions to ensure the study’s validity.
Later studies include efficiency measures when analyzing market power relationships, Choi and
Weiss (2005) include both revenue and cost efficiency measures in their analysis of the efficient
structure hypothesis. The efficient structure hypothesis suggests that the structure of the market in
which firms operate is also determined by efficiency, higher profits are earned by relatively more
efficient firms and since concentration is a by-product of efficiency, these profit gains are viewed
upon as economic rents rather than monopoly rents. Researchers that support the efficient structure
hypothesis criticizes the traditional market power paradigm since efficiency are not taken into
consideration. (Choi & Weiss 2005, p. 639) One of the drawbacks of the applied research method in
this study’s is the lack of inclusion of the efficiency hypothesis as the validity of the results may be
lower.
4. Results
4.1 Empirical results
Table 3 – Regression Analysis SCP and RMP hypotheses
Panel Least Squares Cross-section fixed (dummy variables) with White cross-section covariance
estimator
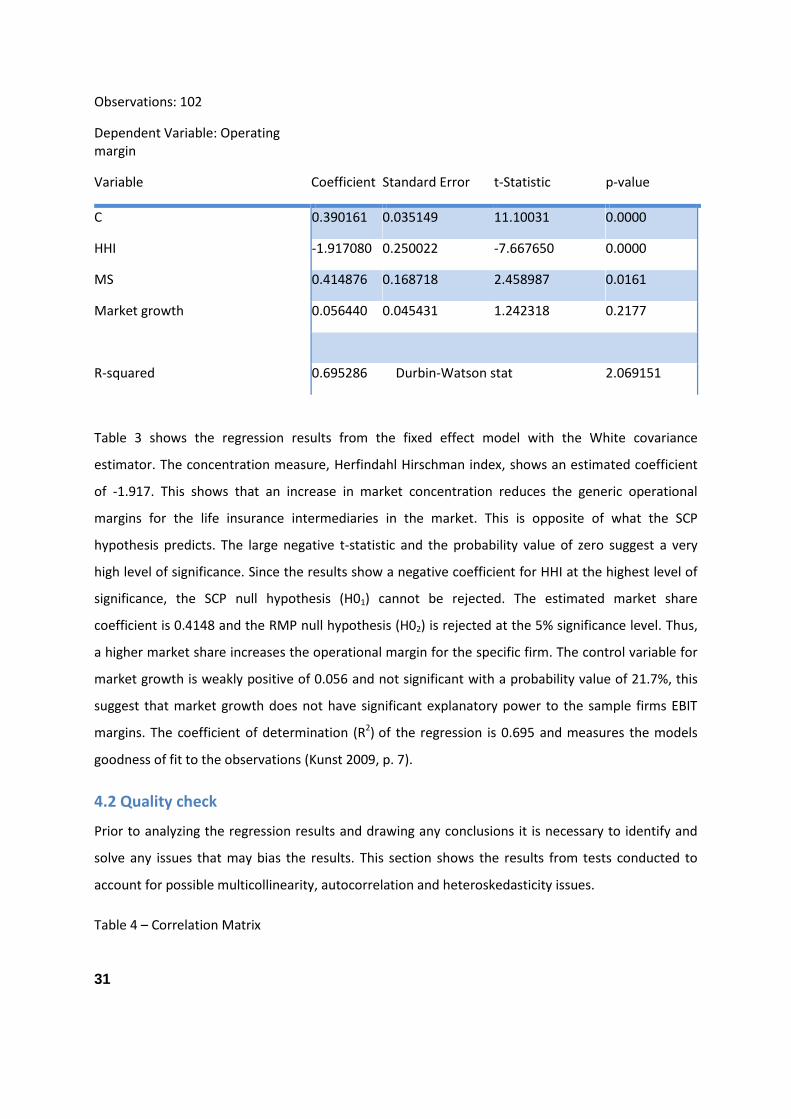
31
Observations: 102
Dependent Variable: Operating margin
Variable Coefficient Standard Error t-Statistic p-value
C 0.390161 0.035149 11.10031 0.0000
HHI -1.917080 0.250022 -7.667650 0.0000
MS 0.414876 0.168718 2.458987 0.0161
Market growth 0.056440 0.045431 1.242318 0.2177
R-squared 0.695286 Durbin-Watson stat 2.069151
Table 3 shows the regression results from the fixed effect model with the White covariance
estimator. The concentration measure, Herfindahl Hirschman index, shows an estimated coefficient
of -1.917. This shows that an increase in market concentration reduces the generic operational
margins for the life insurance intermediaries in the market. This is opposite of what the SCP
hypothesis predicts. The large negative t-statistic and the probability value of zero suggest a very
high level of significance. Since the results show a negative coefficient for HHI at the highest level of
significance, the SCP null hypothesis (H01) cannot be rejected. The estimated market share
coefficient is 0.4148 and the RMP null hypothesis (H02) is rejected at the 5% significance level. Thus,
a higher market share increases the operational margin for the specific firm. The control variable for
market growth is weakly positive of 0.056 and not significant with a probability value of 21.7%, this
suggest that market growth does not have significant explanatory power to the sample firms EBIT
margins. The coefficient of determination (R2) of the regression is 0.695 and measures the models
goodness of fit to the observations (Kunst 2009, p. 7).
4.2 Quality check
Prior to analyzing the regression results and drawing any conclusions it is necessary to identify and
solve any issues that may bias the results. This section shows the results from tests conducted to
account for possible multicollinearity, autocorrelation and heteroskedasticity issues.
Table 4 – Correlation Matrix

32
Correlations matrix HHI MS Market growth
HHI 1 0.053 -0.567
MS 0.053 1 -0.045
Market growth -0.567 -0.045 1
Table 4 shows that the correlation is low between the variables in the regression except between
market growth and HHI. Correlation between market growth and HHI indicates that there is a risk of
multicollinearity issues and the market growth variable is removed from the regression analysis to
test for possible multicollinearity issues. The output with market growth excluded from the analysis
is shown in Appendix 8.10 and the results show that the effects to the market share and HHI
coefficients are minor. The main difference is a slightly lower significance of the market share
coefficient, which is still significant at the 5% level. The coefficient of determination is slightly lower
at 0.6949 compared to 0.6952 with the market growth variable included. Since there are no
significant differences to the regression results when the market growth variable is excluded,
multicollinearity poses no issues to the regression estimates.
The output from the Durbin-Watson test shows a DW statistic of 2.069 (Table 3). A Durbin-Watson
statistic close to two indicates zero autocorrelation, whereas a DW statistic less than two indicates
positive autocorrelation and a statistic above two indicates negative autocorrelation. Since the
regression does not show any signs of autocorrelation there is almost no risk of biased results due to
autocorrelation.
White’s heteroskedasticity test tests the null hypothesis that no significant heteroskedasticity exists
within the data sample. The output from White’s test shows that the null hypothesis cannot be
rejected up to the 36.58% significance level. Since the null hypothesis cannot be rejected, the
regression should not exhibit heteroskedasticity to an extensive degree. However, since the
probability value is relatively low there is a risk that the regression may exhibit heteroskedasticity to
some degree. Any bias resulting from heteroskedasticity is to a large extent removed with the
inclusion of the White covariance estimator in the model.
Table 5 – White’s Heteroskedasticity Test
Method: Least Squares
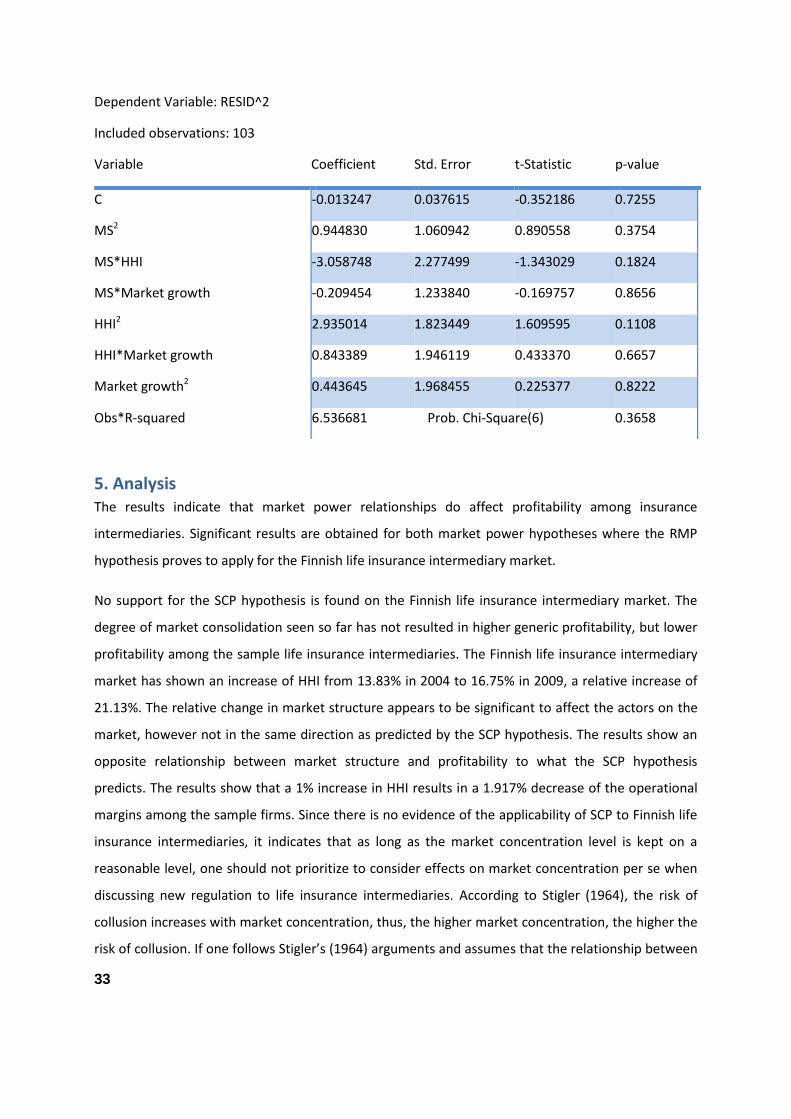
33
5. Analysis The results indicate that market power relationships do affect profitability among insurance
intermediaries. Significant results are obtained for both market power hypotheses where the RMP
hypothesis proves to apply for the Finnish life insurance intermediary market.
No support for the SCP hypothesis is found on the Finnish life insurance intermediary market. The
degree of market consolidation seen so far has not resulted in higher generic profitability, but lower
profitability among the sample life insurance intermediaries. The Finnish life insurance intermediary
market has shown an increase of HHI from 13.83% in 2004 to 16.75% in 2009, a relative increase of
21.13%. The relative change in market structure appears to be significant to affect the actors on the
market, however not in the same direction as predicted by the SCP hypothesis. The results show an
opposite relationship between market structure and profitability to what the SCP hypothesis
predicts. The results show that a 1% increase in HHI results in a 1.917% decrease of the operational
margins among the sample firms. Since there is no evidence of the applicability of SCP to Finnish life
insurance intermediaries, it indicates that as long as the market concentration level is kept on a
reasonable level, one should not prioritize to consider effects on market concentration per se when
discussing new regulation to life insurance intermediaries. According to Stigler (1964), the risk of
collusion increases with market concentration, thus, the higher market concentration, the higher the
risk of collusion. If one follows Stigler’s (1964) arguments and assumes that the relationship between
Dependent Variable: RESID^2
Included observations: 103
Variable Coefficient Std. Error t-Statistic p-value
C -0.013247 0.037615 -0.352186 0.7255
MS2 0.944830 1.060942 0.890558 0.3754
MS*HHI -3.058748 2.277499 -1.343029 0.1824
MS*Market growth -0.209454 1.233840 -0.169757 0.8656
HHI2 2.935014 1.823449 1.609595 0.1108
HHI*Market growth 0.843389 1.946119 0.433370 0.6657
Market growth2 0.443645 1.968455 0.225377 0.8222
Obs*R-squared 6.536681 Prob. Chi-Square(6) 0.3658

34
market structure and risk of collusion is not linear but exponential then the relationship between
market concentration and profitability becomes dynamic. Following this reasoning, it is not possible
to predict the relationship between market structure and profitability in the case of much larger
changes to HHI than those observed in this study. Very high concentration levels could lead to
collusion among firms and ultimately to support for SCP. This also questions whether the chosen
research design used to test the SCP hypothesis is appropriate. However, the changes to
concentration levels experienced among Finnish life insurance so far is not yet large enough for the
industry to be considered highly concentrated, but rather slightly fragmented. Accordingly, the
observed changes to concentration does not warrant for any other research design than the linear
regression estimation models applied in this case. But one should bear in mind that the applied
design may be limited when applied to highly concentrated markets with significant concentration
level increases.
The regression estimates show that there is support for the RMP hypothesis on the Finnish life
insurance intermediary market. Relative market share is a significant explanatory variable to
profitability among the life insurance intermediaries. Cummins (1977) concludes that there is no
evidence of economies of scale within the insurance intermediary industry, assuming that Cummins
conclusions are generalizable to apply for Finnish life insurance intermediaries, the link between
increased market share and increased profitability cannot be explained from economies of scale. To
conclude whether the determined relationship between market share and profitability can be
explained by collusive behavior, efficiency or any other explanatory phenomenon, a deeper analysis
of the individual companies included in the sample is called for. Such analysis is beyond the scope of
this paper since the aim is solely to conclude whether market power relationships exists and if they
may pose a risk on the Finnish life insurance intermediary market. The applicability of the RMP
hypothesis for Finnish life insurance intermediaries shows that the largest companies are able to
exercise market power towards consumers. If economies of scale are not present among insurance
intermediaries there is no incentive to allow for companies to gain unjustified large market shares.
Long-run effects from significant increased market shares among the largest firms can be that
smaller actors may struggle to compete in the market. The study can conclude that it is important to
analyze mergers and acquisitions as well as any event or regulatory change that can result in unfair
market shares among certain entities.
The results are consistent with what Berger (1995) concludes on the US banking sector but contradict
Tregenna’s (2009) conclusions on the UK banking sector. Results from previous studies within the

35
insurance industry (Bajtelsmit & Bouzouita 1998; Choi & Weiss 2005) support the SCP hypothesis
rather than the RMP hypothesis and are contradictionary to the results obtained here. The fact that
the results contradict to many previous studies does not question the study’s validity since the
banking and insurance industries differ from the insurance intermediary industry. Among many
differences between the industries, some of them are; the firms main business and conduct, market
structure, competition and regulation. Any results from previous tests of the hypotheses are not
generalizable to apply for insurance intermediaries and the results obtained provide an important
contribution of the applicability of the SCP and RMP hypotheses. Even if conclusive results with
previous literature increase the external validity of the hypotheses as phenomena, previous
literature are in this case mainly helpful by providing well developed theoretical frameworks.
Following the same reasoning as laid out above, the extent to which this study’s results are
generalizable is limited and inferences made are limited to apply for the Finnish life insurance
intermediaries. One should be careful when generalizing the conclusions drawn in this study to apply
for life insurance intermediaries on other markets as external factors may affect the dependencies
among the firms. The study’s transparent approach regarding data collecting, data processing and
method allows the study’s reliability to be considered as high.
Regression analyses are sensitive to outliers and the operating margins are depicted graphically to
ensure that outliers don’t interfere with the results. The scatter plot (Appendix 8.11) shows that
there are no extreme data points. However, three data points with large negative values do stick out
from the cluster. If one were to exclude these data points without scaling down the data sample in
both ends, the results are highly likely to become biased. Such down scaling of the data sample
includes the exclusion of twelve data points, which constitute about 11% of the data sample. Thus,
down scaling of the data sample is not appropriate since a reduction of the rather small data sample
is likely to yield unfair regression results and decrease the robustness of the results. Therefore, the
outlier analysis does not warrant for the exclusion of any data points and it is safe to conclude that
the internal validity is not threatened to a significant extent by any extreme data points. A few data
points are missing in the data panel and some data points have been adjusted to fit the calendar
years. The assumption that the sample firms do not display any seasonal earnings patterns needs to
be made and despite that the transformation is not serious and that some data points simply have
been lagged approximately three months, the study’s internal validity may be affected adversely. The
applied research design is useful to identify the examined relationships and is appropriate for the
36
study’s aim, but it is limited when it comes to its explanatory capabilities to causal relationships and
underlying phenomena.
When reflecting upon the chosen methodology and the ontological assumption made, the view of
reality as a concrete process, seems to fit the purpose of this study as well. In transcendental realism,
reality subsists within the universal laws that explain how things evolve over time (Ryan, Scapens &
Theobald 2002, p. 37) This ontological assumption is often illustrated by the notions of evolution and
“survival of the fittest” in biology (Ryan, Scapens & Theobald 2002, p. 37) and relates to the Relative
Market Power hypothesis which suggests that the largest actors in the market are able to exercise
market power due to their relative size advantage. Transcendental realism (reality as a concrete
process) also allows the researcher to use scientific methods. However, this ontological assumption
comes with the assumption of general laws to describe how things change and it does not allow for
context dependent interpretations such as market specific factors. Thus, this assumption restricts the
applicability of the market power hypotheses to be universal and apply for all markets. Empirical
evidence to the market power hypotheses contradicts to this reasoning as results differ between
industries and markets. Transcendental realism becomes inapplicable to this study since any
conclusions drawn, in previous studies and in this one, cannot be viewed upon as universal laws
applicable to any industry or market. Therefore, the applied contextual relativism and epistemology
along with the carefully chosen statistical method prove to be a well fitted methodology to answer
the study’s research question.
6. Conclusions The imposed commission ban to Finnish insurance intermediaries has generated some controversy
and the Finnish intermediary market has experienced consolidation in the last few years. The study
tests for the applicability of two market power hypotheses and investigates whether there is a
possibility for firms to increase their operating margins due to changes in market concentration
levels and individual market shares. As no previous studies of market power relationships have been
carried out on insurance intermediaries, the study provides an important contribution to existing
literature on the applicability of market power hypothesis within the services sector. The study
shows that there is support for RMP among Finnish life insurance intermediaries while it disproves
the applicability of SCP. The applicability of the RMP hypothesis shows that the individual firms’
market shares play an important role in determining the profitability of the mediation services. One
could expect that the relative sizes and individual brands become more important when the basis for

37
competition is altered through a new regulatory environment. The results are conclusive with
previous discussions about dominance of large inter-nordic players on markets where the
commission based remuneration model has been abolished (SFM 2011). The main practical
applicability of the obtained research results is that regulators should be concerned with effects on
market structure when considering changes to the markets regulatory environment. The role of
insurance intermediaries in the insurance market is important and the current consolidation trend in
Finland should not be neglected when deciding the future of the ban towards the commission
remuneration model. Such changes to markets regulatory environment may be hazardous with
market power relationships present. The applicability of RMP to Finnish life insurance intermediaries
shows that regulators should make sure that market competition is not altered by allowing a single
or a few firms to obtain unfair market shares. The fact that SCP is not prevalent among the
intermediaries shows that regulators should not be concerned with the market concentration level
per se when it is kept at a reasonable level.
Suggestions for future research are to follow the same methods and conduct the study at a later time
with an increased amount of available data points to increase the study’s robustness. Further
analysis could also be conducted on other geographical markets to be able to determine whether the
results can be generalized to apply for insurance intermediaries in general. As mentioned in the
analysis section, a deeper analysis of the explanation to the found RMP relationship is beyond the
scope of this paper. This could very well be the subject for future research by employing a different
research design, perhaps with the inclusion of a test for the applicability of the efficiency hypothesis
conducted by Berger (1995), Choi and Weiss (2005) and Tregenna (2009).

38
7. References
Bajtelsmit, V. L. and Bouzouita, R. (1998). Market Structure and Performance in Private Passenger
Automobile Insurance. The Journal of Risk and Insurance, Vol. 65, No. 3, pp. 503-514
Barrese, J., Doerpinghaus, H. I. and Nelson, J. M. (1995). Do Independent Agent Insurers Provide
Superior Service? The Insurance Marketing Puzzle. The Journal of Risk and Insurance, Vol. 62, No. 2,
pp. 297-308
Berger, A. N. (1995). The Profit-Structure Relationship in Banking—Tests of Market-Power and
Efficient-Structure Hypotheses. Journal of Money, Credit and Banking, Vol. 27, No. 2, pp. 404-431
Biglaiser, G. (1993). Middlemen as Experts. RAND Journal of Economics 24, pp. 212-223
Bowen, J. T. and Chen, S., (2001). The relationship between customer loyalty and customer
satisfaction. International Journal of Contemporary Hospitality Management, Vol. 13, Issue 5, pp.
213, 4p.
Brooks, C. (2008). Introductory Econometrics for Finance. Second ed. Cambridge University press
United Kingdom
Choi, B. P. and Weiss, M. A. (2005). An Empirical Investigation of Market Structure, Efficiency, and
Performance in Property- Liability Insurance. The Journal of Risk and Insurance, Vol. 72, No. 4, pp.
635-673
Chortareas, G. E., Garza-Garcia, J. G. and Girardone, C. (2009). Market Structure, Profits and Spreads
in the Mexican Banking Industry. Centre for Global Finance Working Paper Series (ISSN 2041-1596)
Paper Number: 09/09
Clarke, P., Crawford, C., Steele, F. and Vignoles, A. (2010). The Choice Between Fixed and Random
Effects Models: Some Considerations for Educational Research. Discussion Paper No. 5287 IZA DP No.
5287
Clarke, R. and Davies, S. W. (1982). Market Structure and Price-Cost Margins. Economica, New Series,
Vol. 49, No. 195, pp. 277-287
Cowling, K. and Waterson, M. (1976). Price-Cost Margins and Market Structure. Economica, New
Series, Vol. 43, No. 171, pp. 267-274

39
Cummins, J. and Doherty, N. (2006). The Economics of Insurance Intermediaries. Journal of Risk and
Insurance, 73, 3, pp. 359-396
Cummins, J. D. (1977). Economies of Scale in Independent Insurance Agencies. The Journal of Risk
and Insurance, Vol. 44, No. 4, pp. 539-553
Cummins, J. D., Denenberg, S. H. and Scheel, C. W. (1972). Concentration in the U.S. life insurance
industry. The Journal of Risk and Insurance, Vol. 39, No. 2, pp. 177-199
Drabbe, H. (1994). The Internal Market for Insurance: A Reality? The Geneva Papers on Risk and
Insurance, Vol. 19, No. 71, pp. 135-143
Eckardt, M. (2002). Agent and Broker Intermediaries in Insurance Markets - An Empirical Analysis of
Market Outcomes. Thunen-Series of Applied Economic Theory Working Paper No. 34
European commission regarding IMD 2 (Online) Available at:
http://ec.europa.eu/internal_market/insurance/docs/mediation/advice-ceiops-imd2_en.pdf
[Accessed 20110510]
”FI ser över rådgivningsmarknaden – först ut är försäkringsförmedlarna: ” (Online) Available at:
http://www.fi.se/Utredningar/Skrivelser/Listan/FI-ser-over-regler-for-forsakringsformedling/
[Accessed 20110510]
Finansinspektionens Rapport 2005:2 Marsh 1 2005 ”Livbolagens provisioner till försäkringsmäklare”
Focht, U., Richter, A. and Schiller, J. (2010). Intermediation and Matching in Insurance Markets.
Working paper
González, F. (2009). Determinants of Bank-Market Structure: Efficiency and Political Economy
Variables. Journal of Money, Credit and Banking Volume 41, Issue 4, pp. 735–754
Gravelle, H. (1994). Remunerating Information Providers: Commissions versus Fees in Life Insurance.
The Journal of Risk and Insurance, Vol. 61, No. 3, pp. 425-457
Hahn, J., Hausman, J. (2003). Weak instruments: Diagnosis and Cures in Empirical Econometrics. The
American Economic Review vol. 93 No. 2, pp. 118-125
Hausman, J. A. (1978). Tests in Econometrics. Econometrica, Vol. 46, No. 6, pp. 1251-1271
40
Heffernan, L. S. and Fu, X. M. (2007). UK Structure and Performance Using Bank-Specific Rates.
Working Paper Series, Cass Business School, City University, UK
Kim, W.-J., Mayers, D. and Smith, C. W. Jr. (1996). On the Choice of Insurance Distribution Systems.
The Journal of Risk and Insurance, Vol. 63, No. 2, pp. 207-227
Jacobsen, D.-I. (2002). Vad, hur och varför? - Om metodval i företagsekonomi och andra
samhällsvetenskapliga ämnen. Studentlitteratur Lund
Judge, G. G., Hill, R. C., Griffiths, W. E., Lütkerpohl, H. and Lee, T.-C. (1982). Introduction to the theory
and practice of econometrics. John Wilet & Sons Canada
Kunst, R. M. (2009). Econometric Methods for Panel Data — Part II. University of Vienna
Laine, C. R. (1995). The Herfindahl-Hirschman Index: A Concentration Measure Taking the
Consumer’s Point of View. No. 40 Antitrust Bull, pp. 423-432
Meier, K. J. (1991). The Politics of Insurance Regulation. The Journal of Risk and Insurance, Vol. 58,
No. 4, pp. 700-713
Pensionsnyheterna Analys nr 3 2008 (Online) Available at:
http://www.pensionsnyheterna.se/pub/viewArticle?articleId=3573 [Accessed 20110510]
Pensionsnyheterna Analys nr 10 2009 (Online) Available at:
http://www.pensionsnyheterna.se/pub/viewArticle?articleId=3565 [Accessed 20110510]
Pensionsnyheterna Analys nr 10 2009 (Online) Available at:
http://www.pensionsnyheterna.se/pub/viewArticle?articleId=8132 [Accessed 20110510]
Pensionsnyheterna 2011 (Online) Available at:
http://www.pensionsnyheterna.se/pub/viewArticle?articleId=12419 [Accessed 20110510]
Regan, L. (1997). Vertical Integration in the Property-Liability Insurance Industry: A Transaction Cost
Approach. Journal of Risk and Insurance 64, pp. 41-62

41
Ruquet, M. and Hays, D. (2004). Spitzer Sues Marsh For Payouts; 2 AIG Executives Plead Guilty.
National Underwriter / Property and Casualty Risk and Benefits 108, pp. 6-10
Ryan, B., Scapens, R. W., Theobald, M. (2002). Research Method & Methodology in Finance and
Accounting. South K-State Research and Extension -Western Cengage Learning, Hampshire
Schiller, J. (2009). Matching and Risk Classification in Insurance Markets with Intermediation.
Working paper Universität Hohenheim
SFM 2011 (Online) Available at:
http://www.sfm.se/index.php?option=com_content&view=article&id=149&Itemid=136
[Accessed 20110510]
Stigler, G. J. (1964). A theory of oligopoly. Journal of Political Economy, 72, pp. 44-61
Stock, H. J. Wright H. J. and Yogo, M., (2002). A Survey of Weak Instruments and Weak Identification
in Generalized Method of Moments. Journal of Business and Economic Statistics, pp. 518-529
Tregenna, F. (2009). The fat years: the structure and profitability of the US banking sector in the pre-
crisis period. Cambridge Journal of Economics, 33, pp. 609–632
Weiss, L. W. (1979). The Structure-Conduct-Performance Paradigm and Antitrust. The University of
Pennsylvania Law Review, pp. 1104-1140
Yavas, A. (1994). Middlemen in Bilateral Search Markets. Journal of Labor Economics 12, pp. 406-429
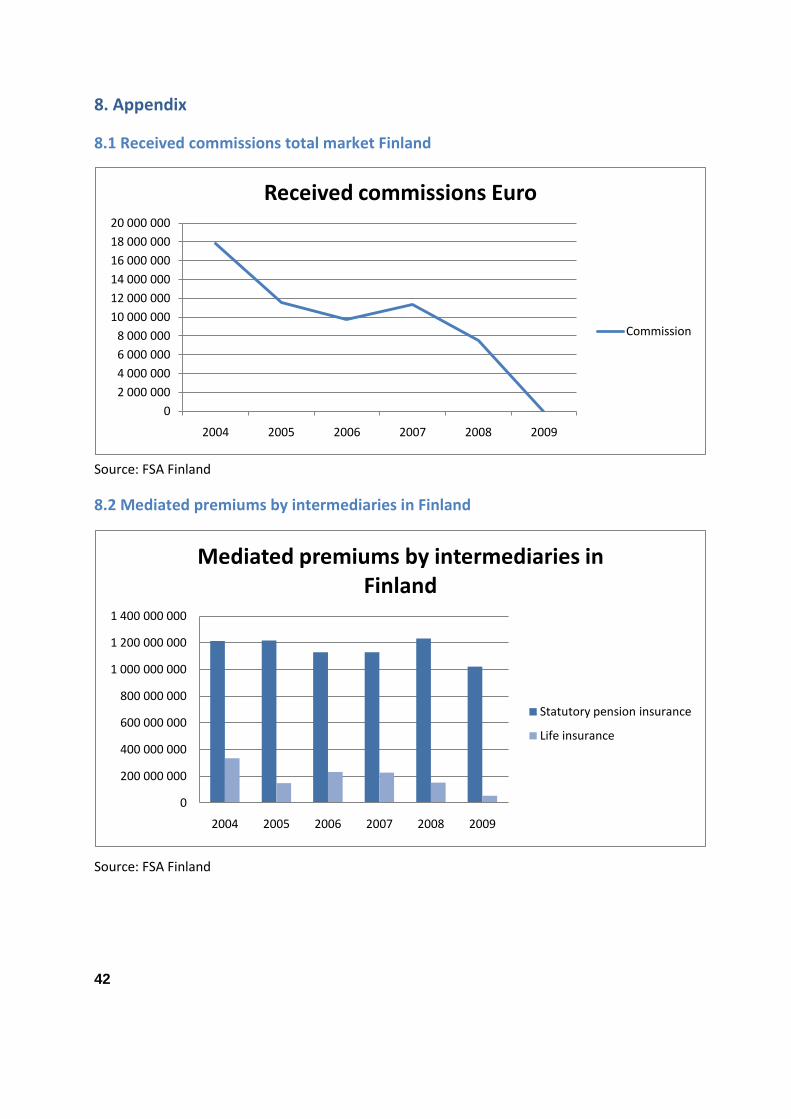
42
0
2 000 000
4 000 000
6 000 000
8 000 000
10 000 000
12 000 000
14 000 000
16 000 000
18 000 000
20 000 000
2004 2005 2006 2007 2008 2009
Received commissions Euro
Commission
0
200 000 000
400 000 000
600 000 000
800 000 000
1 000 000 000
1 200 000 000
1 400 000 000
2004 2005 2006 2007 2008 2009
Mediated premiums by intermediaries in Finland
Statutory pension insurance
Life insurance
8. Appendix
8.1 Received commissions total market Finland
Source: FSA Finland
8.2 Mediated premiums by intermediaries in Finland
Source: FSA Finland
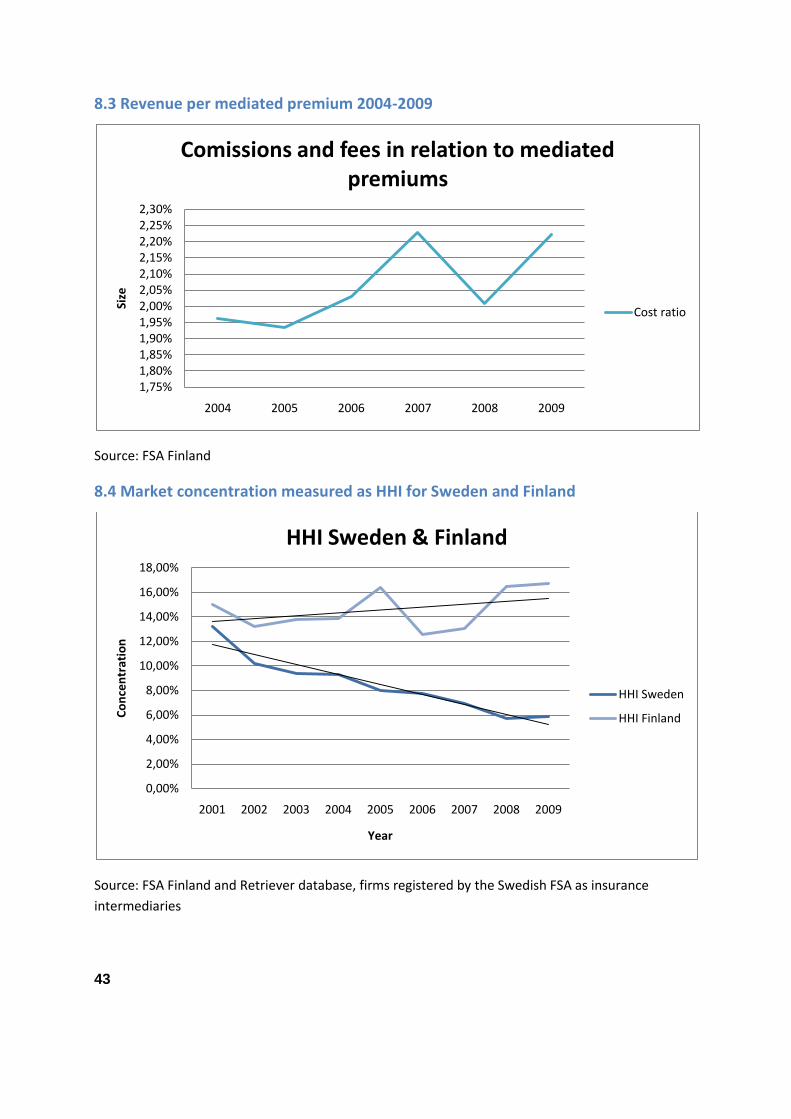
43
8.3 Revenue per mediated premium 2004-2009
Source: FSA Finland
8.4 Market concentration measured as HHI for Sweden and Finland
Source: FSA Finland and Retriever database, firms registered by the Swedish FSA as insurance
intermediaries
1,75%1,80%1,85%1,90%1,95%2,00%2,05%2,10%2,15%2,20%2,25%2,30%
2004 2005 2006 2007 2008 2009
Size
Comissions and fees in relation to mediated premiums
Cost ratio
0,00%
2,00%
4,00%
6,00%
8,00%
10,00%
12,00%
14,00%
16,00%
18,00%
2001 2002 2003 2004 2005 2006 2007 2008 2009
Co
nce
ntr
atio
n
Year
HHI Sweden & Finland
HHI Sweden
HHI Finland
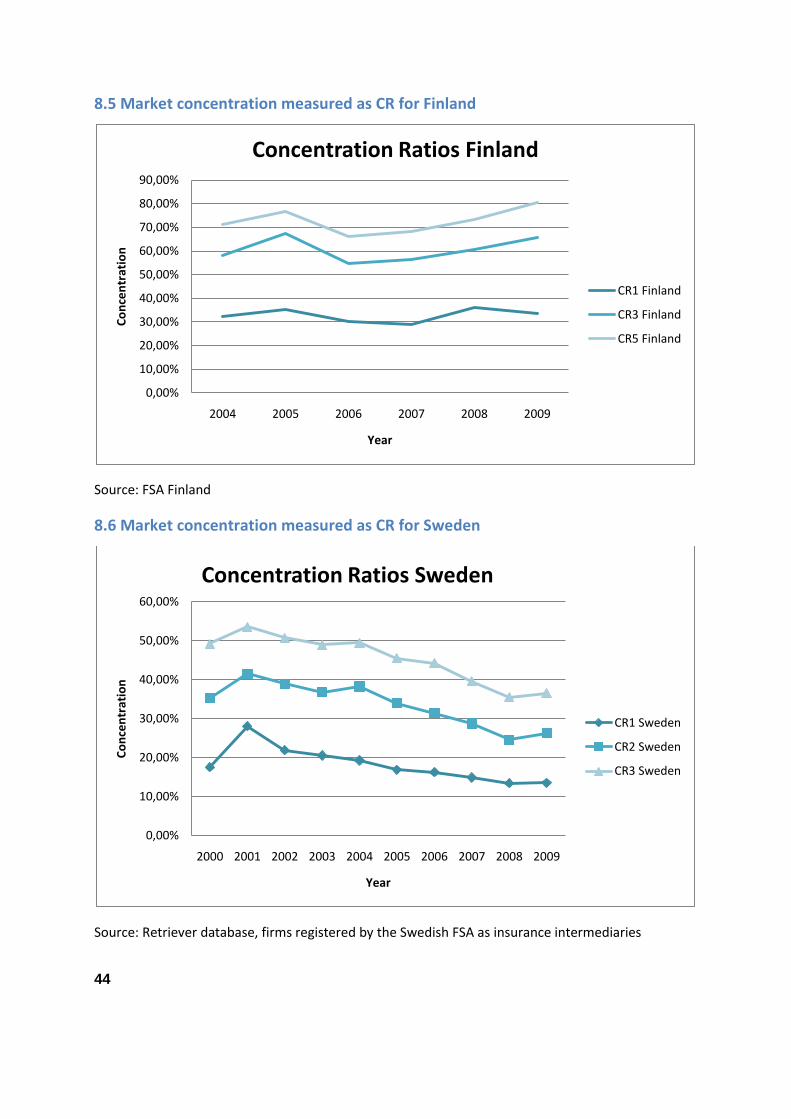
44
8.5 Market concentration measured as CR for Finland
Source: FSA Finland
8.6 Market concentration measured as CR for Sweden
Source: Retriever database, firms registered by the Swedish FSA as insurance intermediaries
0,00%
10,00%
20,00%
30,00%
40,00%
50,00%
60,00%
70,00%
80,00%
90,00%
2004 2005 2006 2007 2008 2009
Co
nce
ntr
atio
n
Year
Concentration Ratios Finland
CR1 Finland
CR3 Finland
CR5 Finland
0,00%
10,00%
20,00%
30,00%
40,00%
50,00%
60,00%
2000 2001 2002 2003 2004 2005 2006 2007 2008 2009
Co
nce
ntr
atio
n
Year
Concentration Ratios Sweden
CR1 Sweden
CR2 Sweden
CR3 Sweden
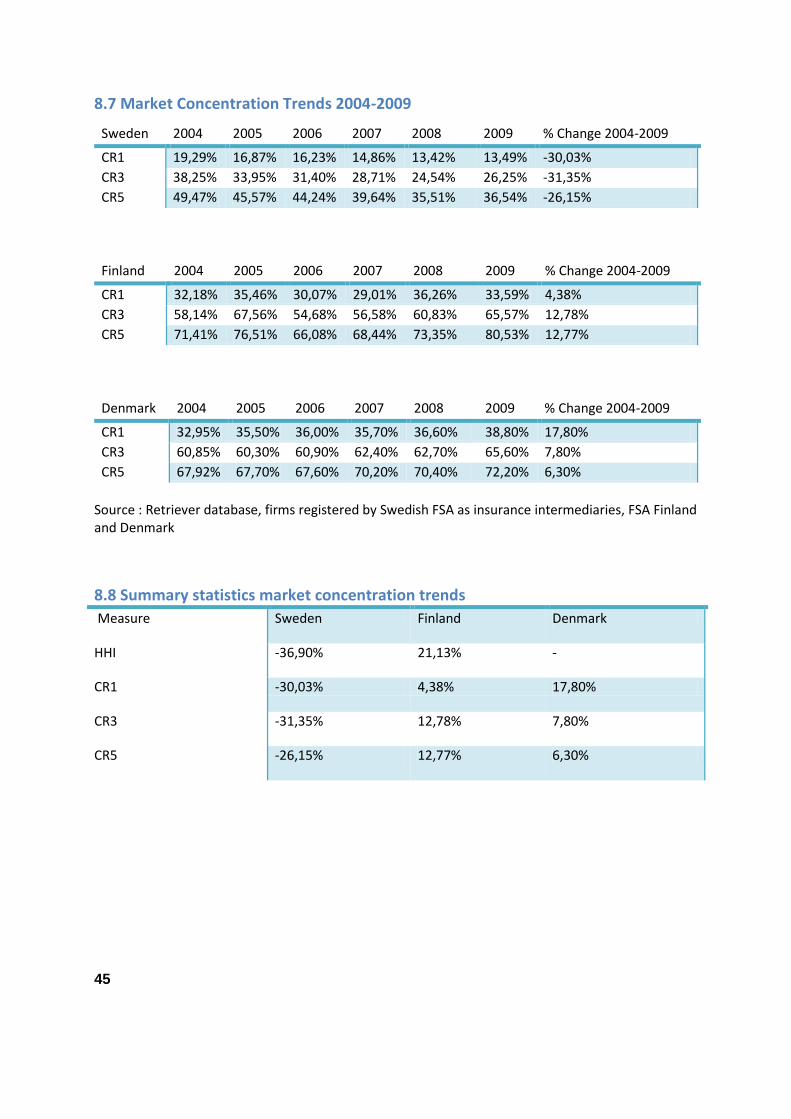
45
8.7 Market Concentration Trends 2004-2009
Sweden 2004 2005 2006 2007 2008 2009 % Change 2004-2009
CR1 19,29% 16,87% 16,23% 14,86% 13,42% 13,49% -30,03%
CR3 38,25% 33,95% 31,40% 28,71% 24,54% 26,25% -31,35%
CR5 49,47% 45,57% 44,24% 39,64% 35,51% 36,54% -26,15%
Finland 2004 2005 2006 2007 2008 2009 % Change 2004-2009
CR1 32,18% 35,46% 30,07% 29,01% 36,26% 33,59% 4,38%
CR3 58,14% 67,56% 54,68% 56,58% 60,83% 65,57% 12,78%
CR5 71,41% 76,51% 66,08% 68,44% 73,35% 80,53% 12,77%
Denmark 2004 2005 2006 2007 2008 2009 % Change 2004-2009
CR1 32,95% 35,50% 36,00% 35,70% 36,60% 38,80% 17,80%
CR3 60,85% 60,30% 60,90% 62,40% 62,70% 65,60% 7,80%
CR5 67,92% 67,70% 67,60% 70,20% 70,40% 72,20% 6,30%
Source : Retriever database, firms registered by Swedish FSA as insurance intermediaries, FSA Finland and Denmark
8.8 Summary statistics market concentration trends
Measure Sweden Finland Denmark
HHI -36,90% 21,13% -
CR1 -30,03% 4,38% 17,80%
CR3 -31,35% 12,78% 7,80%
CR5 -26,15% 12,77% 6,30%
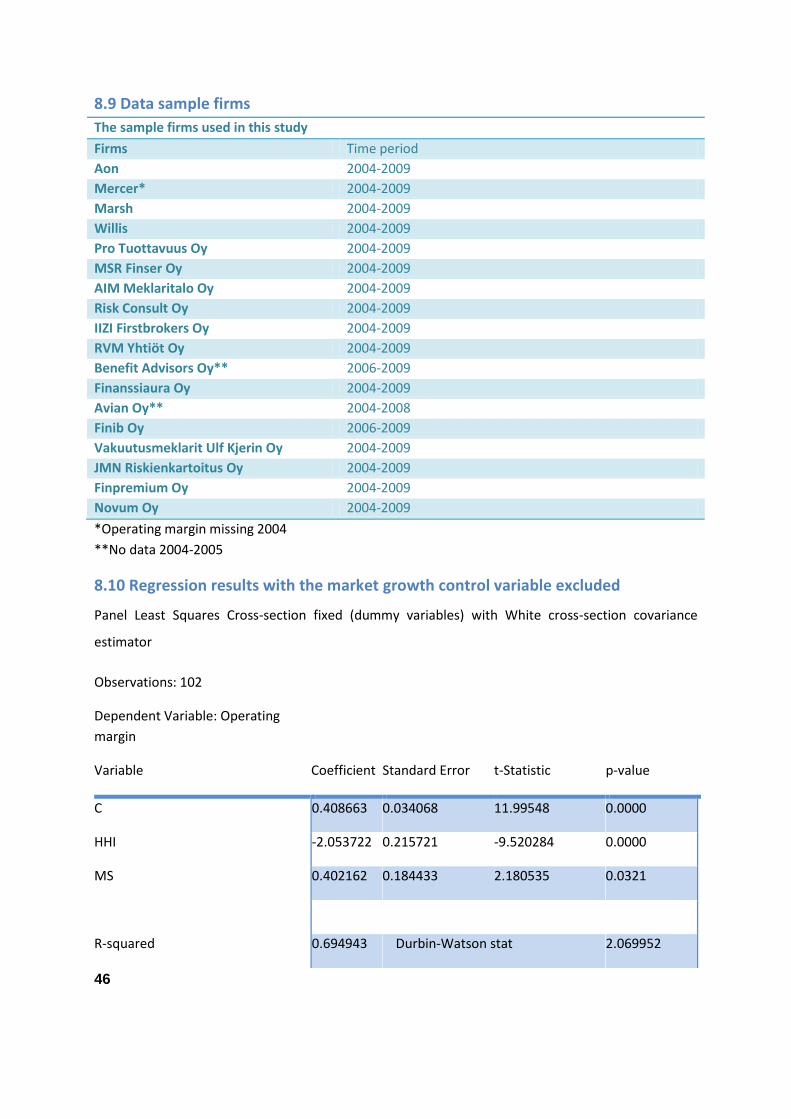
46
8.9 Data sample firms
The sample firms used in this study
Firms Time period
Aon 2004-2009
Mercer* 2004-2009
Marsh 2004-2009
Willis 2004-2009
Pro Tuottavuus Oy 2004-2009
MSR Finser Oy 2004-2009
AIM Meklaritalo Oy 2004-2009
Risk Consult Oy 2004-2009
IIZI Firstbrokers Oy 2004-2009
RVM Yhtiöt Oy 2004-2009
Benefit Advisors Oy** 2006-2009
Finanssiaura Oy 2004-2009
Avian Oy** 2004-2008
Finib Oy 2006-2009
Vakuutusmeklarit Ulf Kjerin Oy 2004-2009
JMN Riskienkartoitus Oy 2004-2009
Finpremium Oy 2004-2009
Novum Oy 2004-2009
*Operating margin missing 2004
**No data 2004-2005
8.10 Regression results with the market growth control variable excluded
Panel Least Squares Cross-section fixed (dummy variables) with White cross-section covariance
estimator
Observations: 102
Dependent Variable: Operating
margin
Variable Coefficient Standard Error t-Statistic p-value
C 0.408663 0.034068 11.99548 0.0000
HHI -2.053722 0.215721 -9.520284 0.0000
MS 0.402162 0.184433 2.180535 0.0321
R-squared 0.694943 Durbin-Watson stat 2.069952
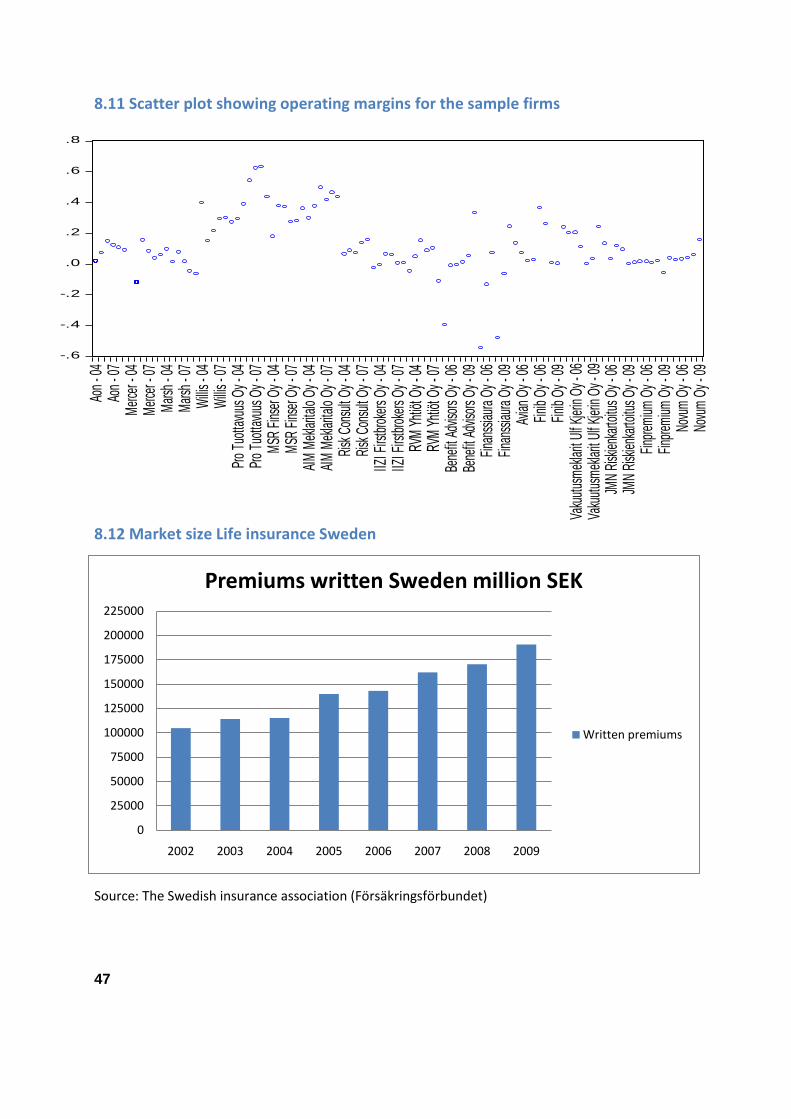
47
-.6
-.4
-.2
.0
.2
.4
.6
.8
Aon
- 04
Aon
- 07
Mer
cer -
04
Mer
cer -
07
Mar
sh -
04M
arsh
- 07
Willi
s - 0
4W
illis -
07
Pro
Tuot
tavu
us O
y - 0
4Pr
o Tu
otta
vuus
Oy -
07
MSR
Fins
er O
y - 0
4M
SR F
inser
Oy -
07
AIM
Mek
larita
lo Oy
- 04
AIM
Mek
larita
lo Oy
- 07
Risk
Con
sult
Oy -
04Ri
sk C
onsu
lt Oy
- 07
IIZI F
irstb
roke
rs Oy
- 04
IIZI F
irstb
roke
rs Oy
- 07
RVM
Yht
iöt O
y - 0
4RV
M Y
htiöt
Oy -
07
Bene
fit A
dviso
rs Oy
- 06
Bene
fit A
dviso
rs Oy
- 09
Fina
nssia
ura
Oy -
06Fi
nans
siaur
a Oy
- 09
Avian
Oy -
06
Finib
Oy -
06
Finib
Oy -
09
Vaku
utus
mek
larit
Ulf
Kjer
in O
y - 0
6Va
kuut
usm
ekla
rit U
lf Kj
erin
Oy -
09
JMN
Risk
ienka
rtoitu
s Oy -
06
JMN
Risk
ienka
rtoitu
s Oy -
09
Finp
rem
ium O
y - 0
6Fi
npre
mium
Oy -
09
Novu
m O
y - 0
6No
vum
Oy -
09
rörelsemarginal
0
25000
50000
75000
100000
125000
150000
175000
200000
225000
2002 2003 2004 2005 2006 2007 2008 2009
Premiums written Sweden million SEK
Written premiums
8.11 Scatter plot showing operating margins for the sample firms
8.12 Market size Life insurance Sweden
Source: The Swedish insurance association (Försäkringsförbundet)
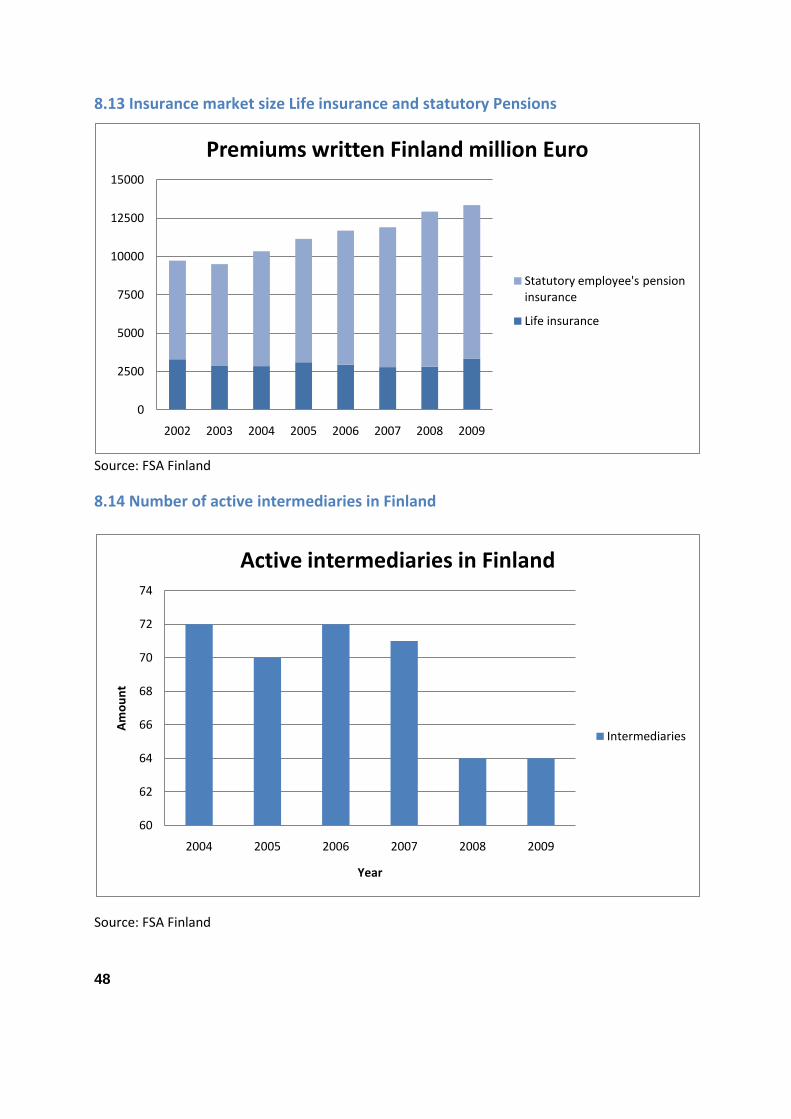
48
0
2500
5000
7500
10000
12500
15000
2002 2003 2004 2005 2006 2007 2008 2009
Premiums written Finland million Euro
Statutory employee's pension insurance
Life insurance
8.13 Insurance market size Life insurance and statutory Pensions
Source: FSA Finland
8.14 Number of active intermediaries in Finland
Source: FSA Finland
60
62
64
66
68
70
72
74
2004 2005 2006 2007 2008 2009
Am
ou
nt
Year
Active intermediaries in Finland
Intermediaries
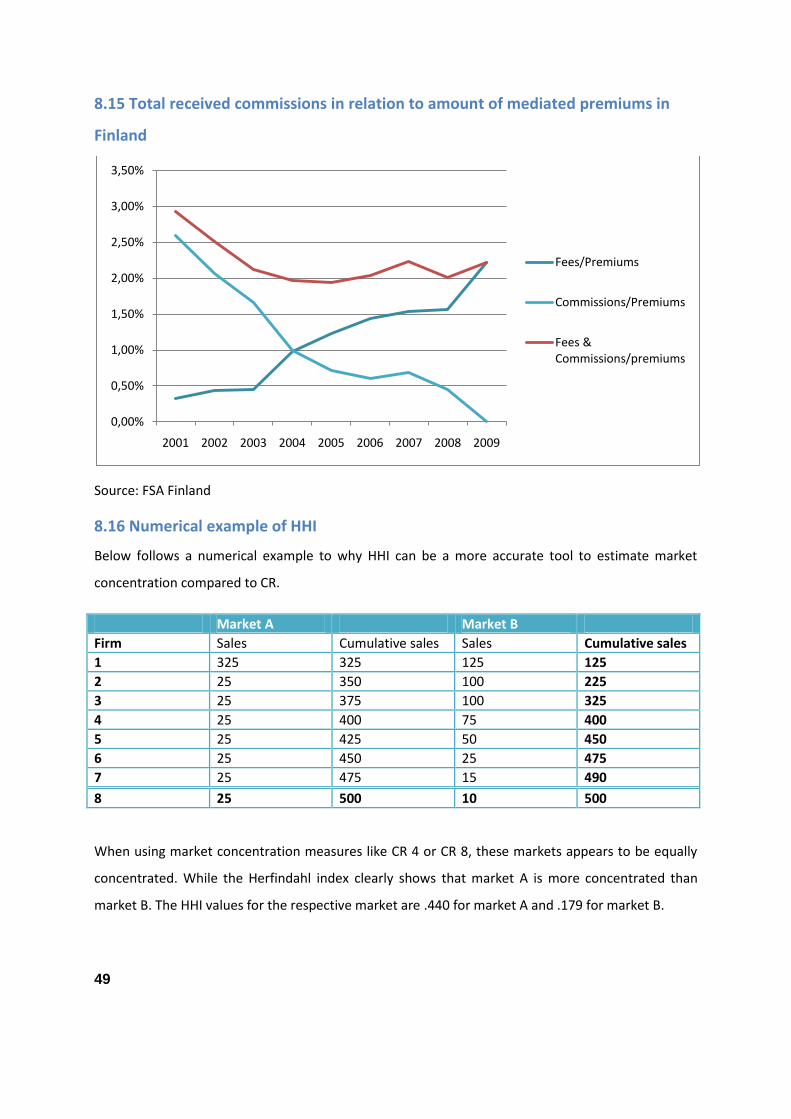
49
8.15 Total received commissions in relation to amount of mediated premiums in
Finland
Source: FSA Finland
8.16 Numerical example of HHI
Below follows a numerical example to why HHI can be a more accurate tool to estimate market
concentration compared to CR.
Market A Market B
Firm Sales Cumulative sales Sales Cumulative sales
1 325 325 125 125
2 25 350 100 225
3 25 375 100 325
4 25 400 75 400
5 25 425 50 450
6 25 450 25 475
7 25 475 15 490
8 25 500 10 500
When using market concentration measures like CR 4 or CR 8, these markets appears to be equally
concentrated. While the Herfindahl index clearly shows that market A is more concentrated than
market B. The HHI values for the respective market are .440 for market A and .179 for market B.
0,00%
0,50%
1,00%
1,50%
2,00%
2,50%
3,00%
3,50%
2001 2002 2003 2004 2005 2006 2007 2008 2009
Fees/Premiums
Commissions/Premiums
Fees & Commissions/premiums
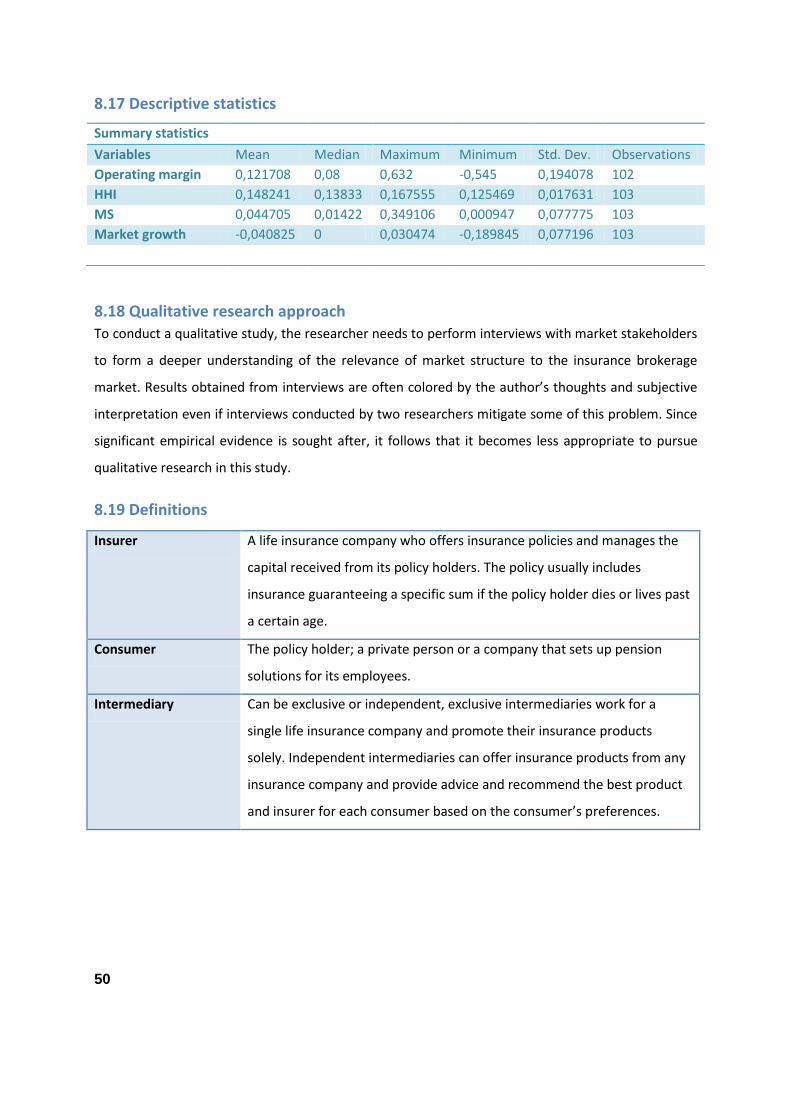
50
8.17 Descriptive statistics
8.18 Qualitative research approach
To conduct a qualitative study, the researcher needs to perform interviews with market stakeholders
to form a deeper understanding of the relevance of market structure to the insurance brokerage
market. Results obtained from interviews are often colored by the author’s thoughts and subjective
interpretation even if interviews conducted by two researchers mitigate some of this problem. Since
significant empirical evidence is sought after, it follows that it becomes less appropriate to pursue
qualitative research in this study.
8.19 Definitions
Insurer A life insurance company who offers insurance policies and manages the
capital received from its policy holders. The policy usually includes
insurance guaranteeing a specific sum if the policy holder dies or lives past
a certain age.
Consumer The policy holder; a private person or a company that sets up pension
solutions for its employees.
Intermediary Can be exclusive or independent, exclusive intermediaries work for a
single life insurance company and promote their insurance products
solely. Independent intermediaries can offer insurance products from any
insurance company and provide advice and recommend the best product
and insurer for each consumer based on the consumer’s preferences.
Summary statistics
Variables Mean Median Maximum Minimum Std. Dev. Observations
Operating margin 0,121708 0,08 0,632 -0,545 0,194078 102
HHI 0,148241 0,13833 0,167555 0,125469 0,017631 103
MS 0,044705 0,01422 0,349106 0,000947 0,077775 103
Market growth -0,040825 0 0,030474 -0,189845 0,077196 103

Stockholm University School of Business
106 91 Stockholm
Telephone: +46 (0)8 16 20 00
www.fek.su.se