Market Power Impact on Off-Invoice Trade Promotions in …aae.wisc.edu/fsrg/web/FSRG papers/12...
29
Market Power Impact on Off-Invoice Trade Promotions in US grocery retailing Laoura M. Maratou Graduate Researcher Department of Applied Economics & Management Cornell University, 146 Warren Hall, Ithaca, NY, 14853 Phone: (607) 592-8573, Fax: (607) 255-9984 E-mail: [email protected] Miguel I. Gómez Research Associate Department of Applied Economics and Management Cornell University, 149 Warren Hall, Ithaca, NY 14853 Phone: (607) 255-8472, Fax: (607) 255-9984 E-mail: [email protected] David R. Just Assistant Professor Department of Applied Economics and Management Cornell University, 254 Warren Hall, Ithaca, NY 14853 Phone: (607) 255-2086, Fax: (607) 255-9984 E-mail: [email protected] February, 2005
Transcript of Market Power Impact on Off-Invoice Trade Promotions in …aae.wisc.edu/fsrg/web/FSRG papers/12...
Market Power Impact on Off-Invoice Trade Promotions in US grocery retailing
Laoura M. MaratouGraduate Researcher
Department of Applied Economics & ManagementCornell University, 146 Warren Hall, Ithaca, NY, 14853
Phone: (607) 592-8573, Fax: (607) 255-9984E-mail: [email protected]
Miguel I. GómezResearch Associate
Department of Applied Economics and ManagementCornell University, 149 Warren Hall, Ithaca, NY 14853
Phone: (607) 255-8472, Fax: (607) 255-9984E-mail: [email protected]
David R. JustAssistant Professor
Department of Applied Economics and ManagementCornell University, 254 Warren Hall, Ithaca, NY 14853
Phone: (607) 255-2086, Fax: (607) 255-9984E-mail: [email protected]
February, 2005
Market Power Impact on Off-Invoice Trade Promotions in US grocery retailing
Abstract
While many have proposed theories to explain trade promotion behavior by
manufacturers, to date a lack of data has prevented any empirical assessment. This article
employs survey data to explore the effect of manufacturer and retailer market power on
trade promotion decisions in the US food sector. The survey respondents consist of
retailers and manufacturers controlling fully 40% of retail sales in US supermarkets.
Building on the results of others, we propose a simple economic theory to explain the
negotiations between retailers and manufacturers, and test the implications. Greater
retailer market power increases allocation of funds to off-invoice trade promotions.
Greater manufacturer market power decreases the allocation of funds to off-invoice trade
promotions, but to a lesser extent. We find clear evidence that the balance of power
currently favors food retailers.
Key Words: industrial organization, food retailing, promotions.
JEL Codes: M310, L140
2
1. INTRODUCTION
Trade promotions comprise a growing category of manufacturer incentives directed to
distribution channel members, such as wholesalers and retailers, rather than to
consumers. These promotions are generally designed to influence resellers’ sales and
prices by providing various, sometimes complex, inducements. In recent years,
manufacturers of consumer packaged goods (CPGs) have substantially increased the use
of trade promotions (TPs) to distributors. Two decades ago, manufacturers allocated
about 20% of their marketing budgets to TPs; today this share has reached 70%. From
1997-2003, trade spending as a percentage of CPG manufacturer gross sales grew from
13.5% to 17.4%, second only to spending on the goods themselves (Cannondale
Associates, 2003). Merli (1999) reports that total spending for trade promotions in the
grocery industry alone rose from $8 billion in 1990 to more than $75 billion by 1998,
nearly a tenfold increase in eight years. Despite the magnitude of these promotional
funds, virtually no empirical research has examined the structure of TPs or the factors
influencing this structure.
Central to this dearth of research is the difficulty in gaining access to data from
confidential supplier-retailer negotiations (Kasulis et al., 1999, Drèze and Bell, 2003).
We employ a unique sample of manufacturers and retailers (representing 40% of total US
supermarket sales) to examine the factors affecting TP negotiation and structure,
shedding new light on this important marketing device. We find evidence to support the
notion that retailers’ market power alters the type of TPs manufacturers are willing to
offer. In particular, we focus on the market power related factors that influence the share
3
of off-invoice allowances in the total promotional funds received by the retailer.
Manufacturer’s market power appears to play less of a role in the formation of TPs.
2. TRADE PROMOTIONS AND MARKET POWER
Starting from one-time up-front payments in the 1970s (later called slotting allowances)
and simple “cents-off” propositions in the early 1980s (Blattberg and Neslin, 1990,
Scheffman, 2002), TPs today have evolved into many complex contractual alternatives
that influence channel behavior and performance and thus have generated a rich
literature. Drèze and Bell (2003) summarize several of the most prominent reasons for the
growth of trade promotion expenditures. Manufacturers, desiring to counter the
popularity of lower-price store brands, may want to pass along a discount to a particularly
price sensitive segment of shopper (eg. via a frequent shopper program); manufacturers
may wish to enhance brand exposure with target consumers; or, manufacturers may
simply want to provide additional stimulus to move excess inventory. Retailers benefit
from TP spending since it builds store traffic, increases retail margins, and because,
generally, the majority of the costs (and risks) are borne by the brand manufacturer.
Despite the general research conclusion that retailers are the chief beneficiaries of TPs,
some research suggests that TPs can directly improve manufacturer performance as well.
Aliwadi, Farris and Shames (1999, p. 92) conclude that certain TP strategies that link
manufacturer and retailer objectives are an “effective way for a manufacturer to influence
the retailer’s selling activity and thereby coordinate the channel.”
Trade promotions have developed into many forms—off-invoices, bill –backs,
free goods, co-op advertising, extended payment terms, and more (Blattberg and Neslin,
4
1990). Despite the proliferation of ever more creative forms of trade deals over the past
10 years—e.g., accrual funds, frequent shopper programs--at least until the mid-1990s
more than 90% of trade promotions involved “off-invoice allowances,” straightforward
reductions in price below the manufacturer’s listed wholesale price (Blattberg and Neslin,
1990.) A number of classification schemes for trade promotions have been proposed
(Kasulis et al., 1999, Bell and Drèze, 2002). We divide TPs into two distinct groups:
performance-based contracts and discount-based contracts.
Performance-based contracts increase retail incentives to push the manufacturer’s
product and are tied to a measure of retailer performance (e.g., units sold, displayed or
price discounts in effect during a given period). Essentially, manufacturers agree to
reimburse the retailer a specified amount for each unit sold. On the other hand, discount-
based promotions, primarily off-invoice allowances, tend to enhance the ability of
retailers to make discretionary use of these funds, increasing the probability of
opportunistic behavior from retailers. The mechanism for off-invoice allowances is
simple: suppliers provide merchandise to retailers at a price discount, usually for a brief,
specified period—two-three weeks is standard. Because of the greater number of degrees
of freedom it affords them, retailers generally favor off-invoices over performance-based
promotions while the opposite is true of manufacturers (Drèze and Bell, 2003). Greater
market power should allow the manufacturer or retailer greater bargaining power in
pushing for the most favorable form of TP. Using standard economic models, we outline
this theory following a short literature review.
5
3. LITERATURE REVIEW
Three themes can be identified in prior trade promotion studies. First, researchers have
examined the rapid growth of trade promotions and have determined the return on
investment (e.g., Ailawadi, Farris and Shames, 1999, Tyagi, 1999, Drèze and Bell, 2003).
In general, these studies indicate that current trade promotional practices cannot be
shown to be efficient for the distribution channel, often suggesting improved TP designs.
A second stream of research has developed theoretical models describing the extent to
which retailers actually pass on trade promotions to consumers in the form of lower
prices rather than retain some portion of the promotional funds to contribute to other
retailer expenses or profits (Tyagi, 1999, Kumar, Rajiv and Jeuland, 2001, Besanko,
Dube and Gupta, 2004). These studies have identified the need for further efforts to
conduct empirical tests on pass through.
Third, a strain of research primarily from industrial organization economics,
examines the causes and consequences of trade promotions as a function of the relative
retail-supplier power balance in the distribution channel (see, for example, Cotterill,
2001, Patterson and Richards, 2000, Sullivan, 2002, Scheffman, 2002, Young and Hobbs,
2003, Hamilton, 2003). Whereas the first two themes examine the problem from the
perspective of a retail manager, the latter market power theme has focused more on issues
arising from industry structure, system performance, and public policy consequences.
Much of this literature finds demand distortions that result from TPs and non-optimal
allocation of resources leading to inefficiency. Kasulis et al. (1999) argue that different
trade promotions can produce dissimilar channel performance and consumer impacts as a

6
result of the market power of channel participants. Hamilton (2003), however, concludes
that certain promotion funds, particularly so-called slotting allowances, may actually be
motivated by suppliers, not retailers. He notes that these allowances may be employed by
suppliers to better coordinate channel activity, ending in greater supplier sales and
improvements in consumer welfare.
Studies on market power in trade promotions develop rigorous models based on
microeconomic theory, yet empirical studies on the subject are scarce (Kasulis et al.,
1999). In particular, extant literature does not model the influence of the balance of
market power between manufacturers and retailers on the allocation of dollars across
alternative TP activities. We follow Drèze and Bell (2003), Kasulis et al. (1999) and
Gerstner and Hess (1995) to develop a theory of managing TPs in the context of market
power. Kasulis et al. (1999) argue that horizontal market power of retailers (i.e., the
market power within the retail industry) should have a large impact on the effectiveness,
and therefore structure of TPs. A retailer with greater market power will exert greater
control over its sale promotions, and provide greater exposure for the promoted brands.
In this article, we test the arguments posited by Kasulis et al. (1999). We focus on off-
invoice TPs, which are more beneficial to the retailers, as they do not require attitudinal
commitment (i.e. increased sales to the end consumer). It is of great importance for
manufacturers to be able to monitor off-invoice TPs, and for retailers to determine the
appropriate amount of spending by manufacturer.
7
4. MODEL AND DATA
4.1 Theory
Greater market power of the retailer should result in higher share of off-invoice
promotions in the promotional mix. Conversely, a manufacturer with market power
would reduce the share of off invoice promotions in favor of pay for performance
promotions (e.g., scan-backs, bill-backs). The rationale underlying our theoretical
framework is that off invoice promotions allow retailers to forward buy (i.e., buy in
excess during the promotional period at lower wholesale prices) and that the retailer’s
ability to forward-buy is constrained by the cost of inventory holding.
Building on earlier work by Gerstner and Hess (1991) and by Drèze and Bell
(2003) we examine optimal pricing decisions based on microeconomic theory. We
consider off invoice promotions between a single manufacturer and a single retailer and
we assume that the retailer applies a markup rule to set retail prices. Our model considers
short run relationships (when both retail and wholesale prices are fixed outside of
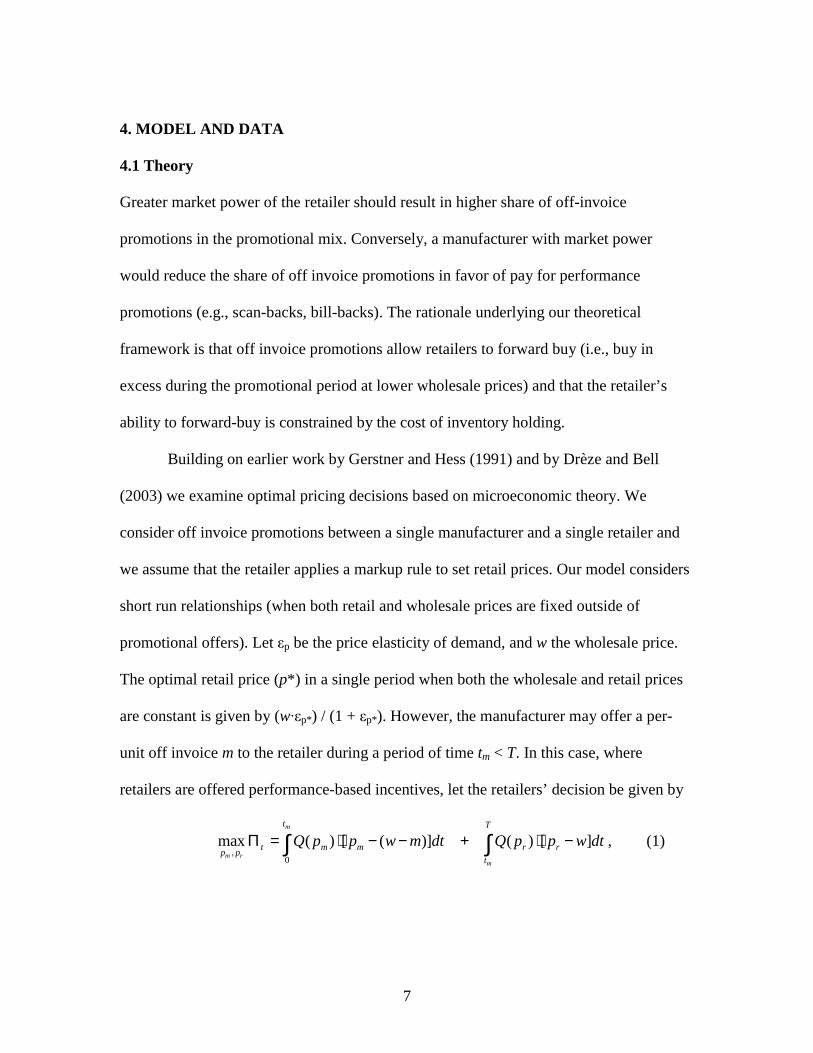
promotional offers). Let εp be the price elasticity of demand, and w the wholesale price.
The optimal retail price (p*) in a single period when both the wholesale and retail prices
are constant is given by (w·εp*) / (1 + εp*). However, the manufacturer may offer a per-
unit off invoice m to the retailer during a period of time tm < T. In this case, where
retailers are offered performance-based incentives, let the retailers’ decision be given by
,0
max ( ) [ ( )] ( ) [ ]m
m rm
t T
t m m r rp p
t
Q p p w m dt Q p p w dtΠ = ⋅ − − + ⋅ −∫ ∫ , (1)
8
where pr and pm represent regular and promotional retail prices, respectively, w is
wholesale price, ( )Q p is the demand curve, and [0, T] is the time period during which
the retailer must set a constant retail price. Drèze and Bell (2003) show that the optimal
regular and promotional retail prices are given by the expression (w εp*) / (1 + εp*) and
[(w-m) εp*] / (1 + εp*), respectively.
The solution to equation (1) assumes no forward buying on the part of the retailer.
However, off invoice promotions generate incentives for the retailer to forward-buy as
long as the cost savings of buying excess product during the trade promotion period do
not exceed the additional costs of handling excess inventory (Blattberg and Levin, 1987).
Define C(w, t) as the unitary cost of holding inventory purchased at price w for a period
of time t, with ∂C(·)/∂t > 0 (i.e., inventory cost increases as items are stored for more
time). The retailer will forward-buy for a period of time z such that C(w-m , z) < C(w,0) =
w, or up to the point in time when savings equal cost of holding excess inventory. As a
result, the forward-buy period is tf = tm + z and the retailer’s costs of goods sold become
time dependent. Moreover, in addition to the pricing decisions pm and pr, the retailer must
decide the length of time of the retail promotion tp. That is, the inventory costs are
sufficiently low so that forward buying allows the retailer to extend retail promotions
beyond the promotional period tm. Therefore, the retailer maximizes the following profit
function

9
,0
max ( ) [ ( )] ( ) [ ( , )]
( ) [ ( , )] ( ) [ ]
pm
m rm
f
p f
tt
t m m m m mp p
t
t T
r r m r r
t t
Q p p w m dt Q p p C w m t t dt
Q p p C w m t t dt Q p p w dt
Π = ⋅ − − + ⋅ − − −
+ ⋅ − − − + ⋅ −
∫ ∫
∫ ∫.
(2)
The solution to this maximization problem is pp = ( pw εp*) / (1 + εp*) and pr = rw εp* / (1
+ εp*), where pw and rw are average per-unit cost of goods sold at promotion and
regular prices, respectively (see proof in Appendix A.2 of Drèze and Bell, 2003). These
average per-unit costs are function of tp, C(·) and tm.
Equations (1) and (2) allow us to compare off invoices and performance-based
promotions. A retailer maximizing (1) does not forward buy, its solution corresponding to
TPs based on performance. In contrast, equation (2) describes the retailer response to off
invoice TPs. Drèze and Bell (2003) compare costs and profits between equations (1) and
(2) and their solutions to show that retailers prefer off invoice TPs and manufacturers
prefer performance-based TPs. While our objective in this study is not to develop a
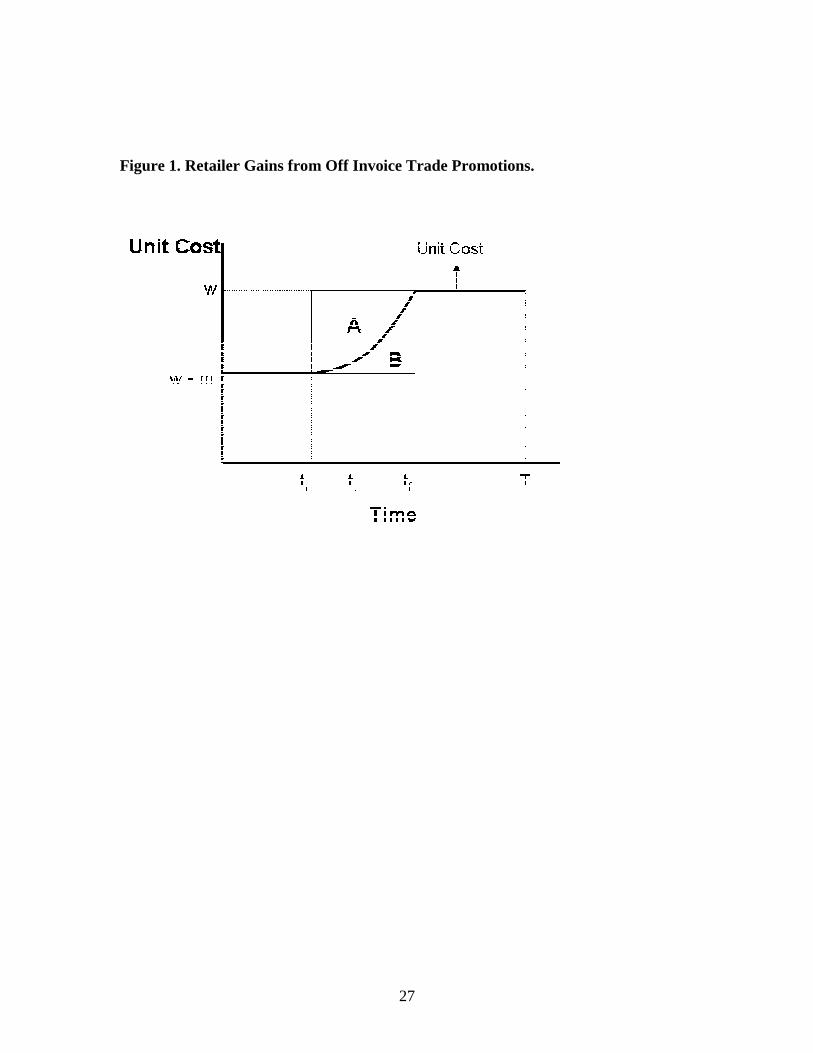
thorough mathematical proof, we illustrate this result in Figure 1. By forward buying, the
retailer can obtain additional unit-cost savings equivalent to area A + B. Nevertheless,
actual savings for the retailer are represented by area A, given that area B represents the
per-unit cost of holding excess inventory (a deadweight loss for the channel). Conversely,
a manufacturer prefers performance-based TPs because in such case it is not optimal for
the retailer to forward-buy and the manufacturer increases its profits by the area A + B.
This economic model informs our empirical analysis of the factors that influence the
10
allocation of trade promotion funds across competing alternatives in the context of
market power.
[Figure 1 About Here]
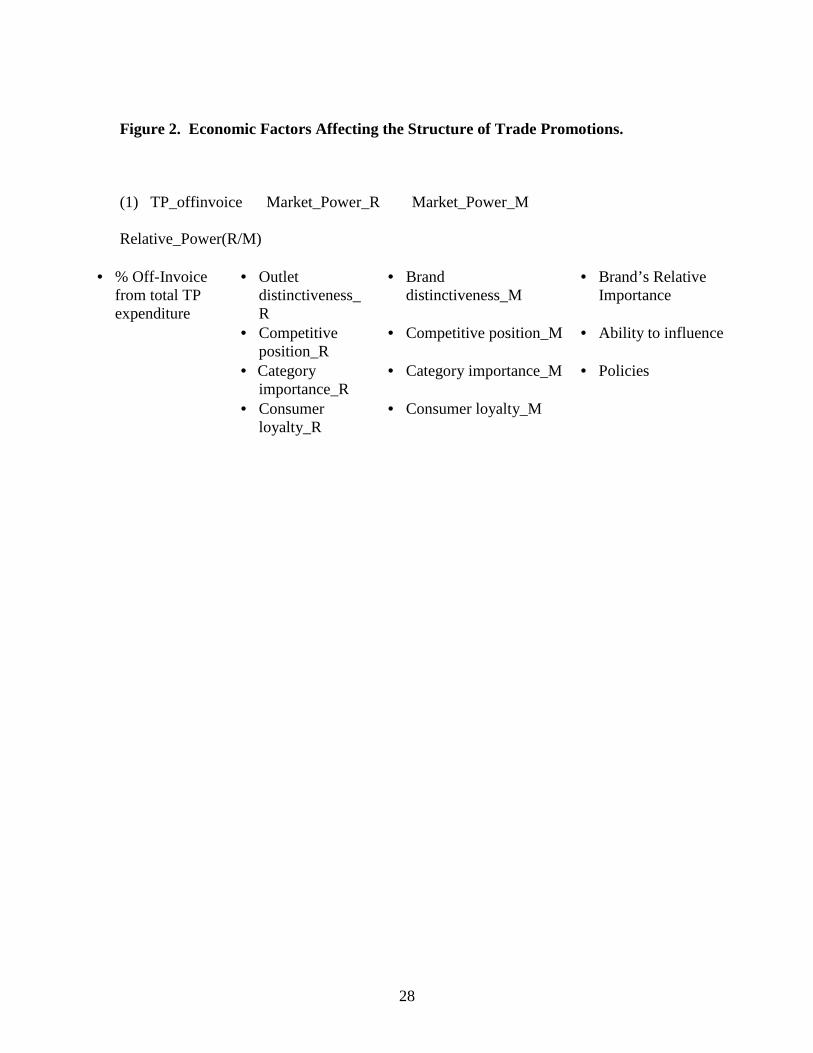
4.2 Empirical Model
We examine the percentage of trade promotions allocated to off-invoice allowances as a
function of (1) the horizontal (over all ‘peers’) market power of the retailer; (2) the
horizontal market power of the manufacturer; and (3) the relative power between the
specific negotiating dyad of manufacturer and retailer (i.e. dyad M-R). Following Kasulis
et al. (1999), we posit that the allocation of TP funds is a direct function of the market
power of the retailer and the manufacturer. We focus exclusively on off-invoice TPs,
estimating the reduced form equation
TP_offinvoice = f(Market_Power_R, Market_Power_M, Relative_Power(R / M))
(3)
where TP_offinvoice is the percentage of promotional funds allocated to off-invoices,
Market_Power_R is the horizontal market power of the retailer, Market_Power_M is the
horizontal market power of the manufacturer, and Relative_Power is a measure of the
specific balance of power in the dyad (Figure 2).
[Figure 2 About Here]
Market power of retailer is expected to be positively related to the percentage of
funds allocated to off-invoice TPs. Theory tells us as that when the retailer has increased
11
market power, it can increase profits by increasing the allocation of off-invoice TPs
(Kasulis et al., 1999; Drèze and Bell, 2003). Factors affecting retailer’s market power
include the outlet distinctiveness of the retailer (e.g. commercial type), its competitive
position, the product category importance, and the level of consumer loyalty. Competitive
position of retailer can be measured with constructs such as value-added capabilities (e.g.
advertising support, loyalty card, merchandising expertise, cost-saving programs, every
day low prices), financial data (e.g. market share, sales growth, etc.), share of private
labels that the retailer carries, and the product category.
Market power of the manufacturer should be negatively related to the share of off-
invoices in total TP expenditures. The manufacturer can increase profits by using
performance incentives instead of off-invoice TPs. This happens because off invoice TPs
allow forward buying by retailers (carrying excess inventory during discount period),
diverting (the retailer resells the discounted product to other retailers at a higher price)
and inventory management cost (resulting from the excess inventory carried by the
retailer) (Drèze and Bell, 2003). Factors affecting the manufacturer’s horizontal market
power include brand distinctiveness (e.g. price difference compared to other brands), life
cycle of manufacturer’s brand, product category importance and consumer loyalty. The
competitive position of manufacturer can be measured in terms of value-added
capabilities (e.g. advertising support, merchandising expertise, cost-saving programs) and
in financial data (e.g. market share, sales growth, etc.).
The relative power (R/M), gives the balance of power in the specific dyad of the
manufacturer and the retailer that is negotiating for a trade promotion contractual

12
arrangement. The relative power can be measured as the share of the manufacturer brand
on the retailer’s product category sales, the retailer’s perceived ability to choose the TP
from, and the formal policies of both parties for the negotiation of trade promotions.
4.3 Data
We employ a unique data set collected from 43 supermarket companies and 12 food
manufacturers operating in the US and representing about $250 billion of annual sales,
about 40% of the total US supermarket sales. These data were obtained by the Food
Industry Management Program (FIMP) at Cornell University in 2003, Trade Promotion
Study. Each company provided data for 2002 related to its trade promotions for the
leading brand, the second brand, and a growing brand (i.e. a brand that has gained
substantial market in recent years/months), for two product categories randomly selected
from a total of six (ready-to-eat cereal, frozen dinners/entrees, coffee, laundry detergent,
pet food, and chocolate bars).
Our data set contains information on the amount of trade promotion dollars
received from suppliers, the percent allocation of these funds across trade promotion
activities (off-invoices versus pay-for-performance contracts), the policies in place
regarding the negotiation of TPs, and the perceived impacts of each type of TP. The
managers responded on the actual allocation of TP spending and not on their willingness
to accept or change them. Additionally, we collected relevant variables from secondary
sources concerning manufacturers and supermarket companies in our sample. The survey
employs brand as the unit of observation.
13
The survey was not specifically designed for the current analysis, and there is the
possibility of selection bias in our data, as we have a sample of convenience. However, it
is the first and only time that trade promotion data have been collected from food retailers
and it is therefore the best available. Further, our data represent close to 40% of retail
sales in the supermarket sector, thus we expect these data to be representative of at least
the most important TP relationships. Table 1 contains a list of variables used in our
analysis and accompanying descriptions.
[Table 1 About Here]
We measure horizontal market power of retailers constructing measures of
customer loyalty, retailer’s competitive position and type of retailer. Data on customer
loyalty for the retailer are from published Consumer Reports (2003) that measure the
customer satisfaction of 25,000 individuals. Scores are on a scale of 0 to 100% and
indicate general satisfaction with the shopping experience. We measure competitive
position of the retailer using data on share of private label in product category sales, on
annual sales and on the average sales growth in the last 3 years. Retailer sales data were
obtained from publicly available financial reports of the firms and private label shares are
from the trade promotion survey. Our sample consists of two commercial types of
retailers, namely those that are only retailers (‘Pure’) and those that have integrated
wholesaling activities as well as retailing (‘Hybrids’). Thus we create a dummy variable
to identify type of retailer.
We capture horizontal market power of manufacturer (Market_Power_M)
employing share of brand in the national market (Grocery Headquarters, 2004), average
14
percent sales growth in the last three years and total sales in 2003. Sales data were
obtained from publicly available financial reports of the firms. These variables allow us
to measure competitive position of the manufacturer. We argue that brand share in the
product category’s national market serve also as a proxy for the consumer loyalty to the
manufacturer. While this is not a perfect measure of consumer loyalty, it should be
highly correlated with consumer attachment to a particular manufacturer or group of
brands. Additionally, we created a measure of brand distinctiveness as the price
difference between the manufacturer brand and the average price of rival brands.a
We measure relative power of the manufacturer/retailer dyad using manufacturer
brand’s position in the retailer’s product category, ability of retailer to influence the
negotiation of TP contracts, as well as the existence of formal policies for the
negotiations of trade promotions. These data were elicited from retailers in the trade
promotion survey. To capture the influence of brand position, we constructed dummy
variables for three brand types “leading brand,” “second brand” and “growing brand.”
Retailer ability to influence the TP form is estimated through the answers to the survey
and includes the percent of times the retailer initiates and/or selects the TP type.
Regarding TP policies, our data set includes dummy variables measuring whether the
manufacturer has TP policies favoring pay-for-performance promotions, whether the
retailer has TP policies favoring off-invoice contracts and whether the manufacturer-
retailer dyad has TP policies favoring co-marketing contracts. Including company policy
is a key contribution of our research, because policies can serve as a framework for
a Price differences of the brands are calculated as [(price of brand - average product category price)/average
15
measuring relative power. For instance, a manufacturer may define its TP policy on a
case by case basis, allowing for more flexibility in the negotiation with retailers that have
market power. Our sample consists of 185 observations from the survey.
Table 2 displays summary statistics for all relevant variables. We find that just
over 25% of trade promotions are off-invoice agreements, which is comparable to current
industry wide estimates (AC Nielson, 2003). Our sample reflects a share of private label
sales of 6.6% which is just slightly lower than the average found in the literature (CITE).
Consumer loyalty measures display similar properties for both imputed and non-imputed
values. This provides a convenient check that the imputed values do not create statistical
outliers. There is extreme variation in the size of retailers, ranging from $1 billion to over
$50 billion in annual sales. This heterogeneity reflects the fact that our sample contains
both regional and national companies, representing a wide range of manufacturing-retail
arrangements. On average, the retailer selects the TP type 60% of the time, suggesting a
great degree of power in the negotiating process. Lastly, we find that few companies have
policies governing TPs, about 12% and 11% for retailers and manufacturers respectively.
[Table 2 About Here]
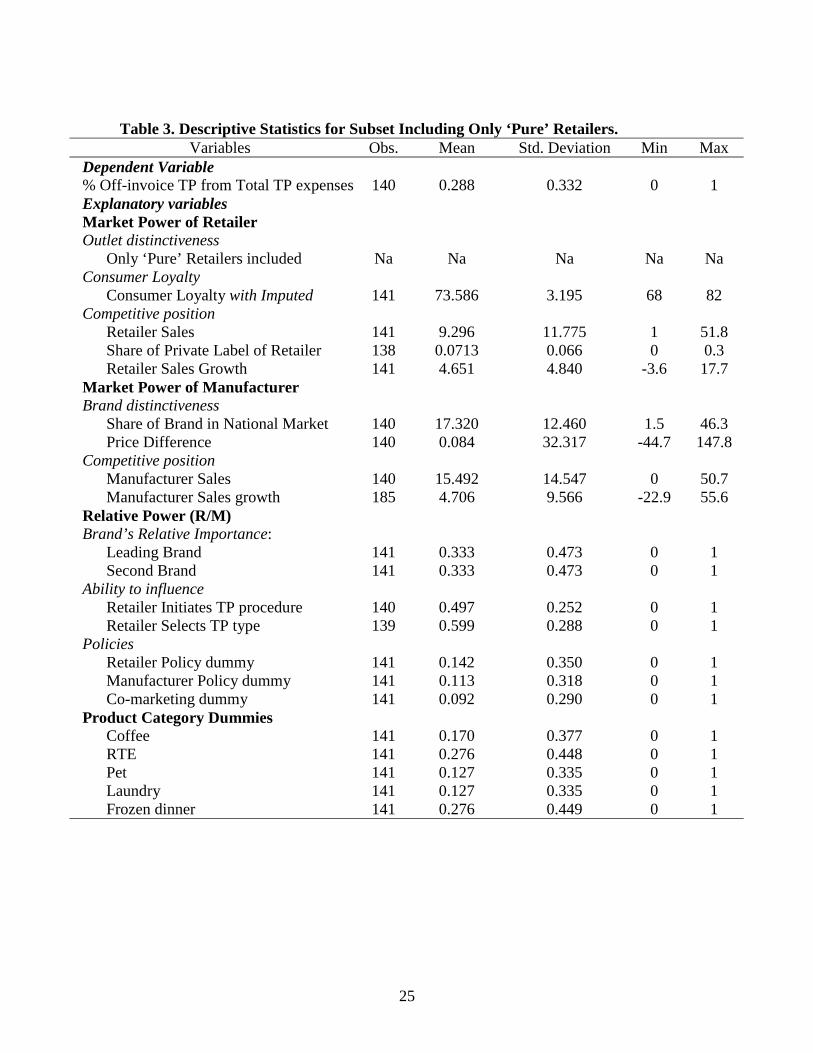
In addition, we analyze one subset of the data including only the ‘pure’ retailers,
as we hypothesize that wholesaling activities could influence TP behavior. Table 3 shows
the descriptive statistics for this sub-sample, which contains 136 observations.
[Table 3 About Here]
product category price]×100.
16
We estimate the relationships described in the previous section using a simple linear
representation of the function in (1). We have a censored sample as our dependent
variable, percent of off-invoice dollars from the total TP expenditure, is constrained to be
non-negative. Thus, we use maximum likelihood Tobit estimation (Tobin, 1958).
Slightly less than 30% of the retailer’s consumer loyalty responses were missing.
In order to reduce efficiency losses, we replaced missing observations with conditional
mean imputed values based on dependent and independent variables (see Little, 1992 for
a thorough discussion of this method). This method generates missing independent
variables employing a weighted least squares regression on all other variables, and
replacing the missing values with the predicted values from the regression. The original
and the imputed values of customer loyalty are shown in Table 2. Because this procedure
induces heteroscedastic errors, we obtain robust estimates of the Tobit model.
Most contractual arrangements result from the simultaneous interactions of both
parties and their corresponding preferences. Here we have modeled TPs as if they are
designed and offered by a manufacturer, and the retailer has the opportunity to reject the
TP. Our model assumes that TP allocation is determined primarily by market power of
the manufacturer and the retailer. We suppose that market dominance is determined prior
to the negotiation of TPs, and is therefore exogenous. Still, some variables present the
potential for endogeneity. In particular, consumer loyalty and retailer sales may affect
one another. Controlling for this possible endogeneity is impossible within the constraints
of our current article. Further, because of the lagged effect of investment on consumer
17
loyalty, it is likely that the endogeneity effect will be small relative to the bias introduced
by omitting these variables.
We estimate the following three Tobit models: (1) a model for the total sample
without the consumer loyalty variable; (2) a model for the total sample with imputed
consumer loyalty replacing missing values; and (3) a model for the subset including only
the ‘Pure’ retailers with consumer loyalty (same variables as in model 2).
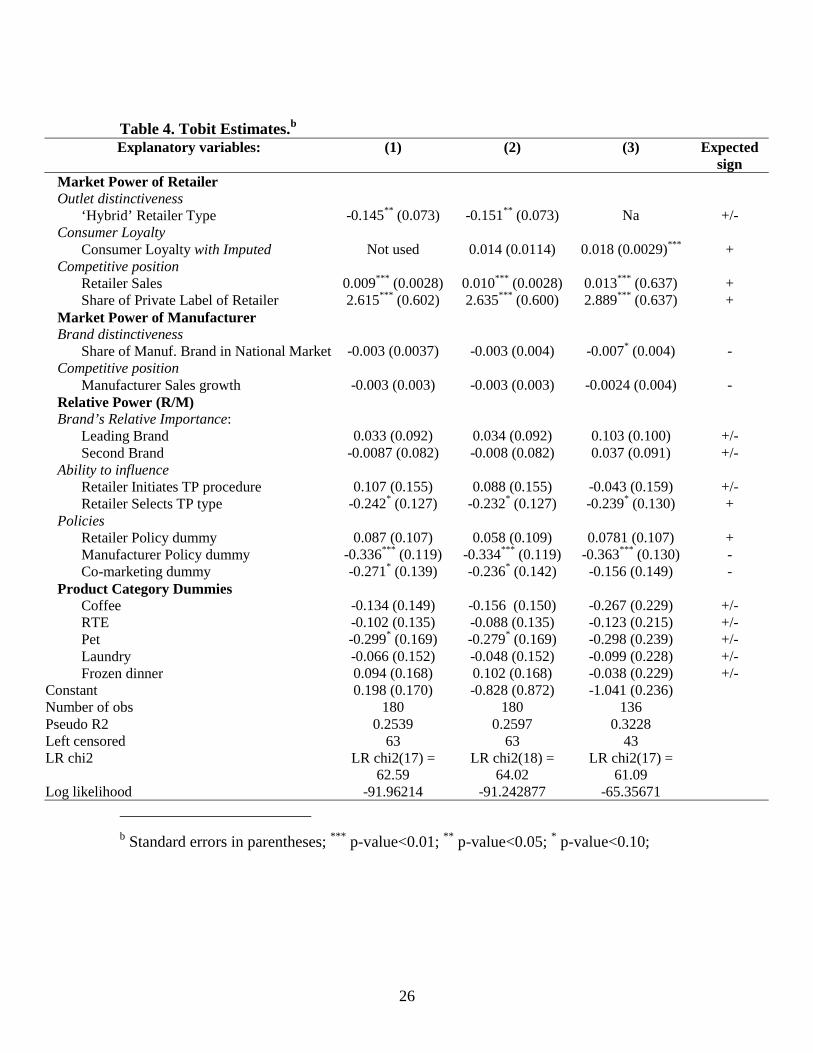
5. DISCUSSION OF RESULTS
We present our results in Table 4. All components of retailer’s market power are
significant across all three models and have the hypothesized signs, indicating that
greater retailer power results in significant increases of the allocation of funds to off-
invoice TPs. In addition the ability of the retailer to influence the TP decision (retailer
selects) is significant and large across all models. Price differentials, manufactures annual
sales and retailer’s average sales growth were dropped from the model because they
exhibit a high degree of collinearity with other explanatory variables, inflating the
standard error of the estimated parameters.
[Table 4 About Here]
In contrast, it is interesting that few variables describing market power of the
manufacturer are significant in TP negotiations. Specifically, only the share of the
manufacturer’s brand in the national market is significant across all models, confirming
the trend cited in the literature of shifting of the balance of power from manufacturers
toward retailers. Our results suggest that increases in the market power of manufacturers

18
have a modest effect on reducing the amount of funds allocated to off-invoice TPs (in
contrast to the significant power of the retailer).
Formal TP policies of manufacturers (increasing allocation to pay-for-
performance TPs) are significant across all models. Likewise co-marketing policy
variables are significant in model 1 and model 2. The magnitude of the coefficients on
manufacturer policies is large in comparison to the coefficients measuring the effect of
market power of the retailer. Our estimates show that manufacturers can use TP policies
to augment their negotiating power in favor of pay-for-performance promotions.
Consumer loyalty of retailer is significant in model 3, but not nearly so when
hybrid companies are included in the sample. A possible explanation is that the hybrid
companies have integrated wholesaling and retailing activities and may base their market
power more on their economies of scale and not on the end consumer. Product categories
are not significant, apart from pet food, which appears to suggest greater market power of
pet food manufacturers. Hybrid retailers are significantly more influential across all
models, reflecting the fact that cost structure and economies of scale are usually more
favorable to hybrid companies than to companies that engage in retail only. It is
surprising that the increased ability of a retailer to select the type of TP has a significant
negative effect on the amount of funds allocated to off-invoice TPs. These results might
be due to endogeneity, or may reflect deeper problems with the current economic models
of TP behavior.
In the previous section, we grouped variables by their influence on important
variables in our economic model (see Table 1). Using this grouping, we conduct joint
19
tests of the elements of each hypothesis using Wald tests (modified to allow a one tailed
test of hypotheses with inequalities as the null). The market power of the retailer should
increase the percentage of off-invoice TP. A joint test that retailer sales, share of private
label of retailer and consumer loyalty (for models 2 and 3) are negative rejects at the 1%
level for all three models, confirming our hypothesis.
Secondly, the market power of the manufacturer should decrease the percentage
of funds allocated to off-invoice TPs. A joint test that the share of manufacturer’s brand
in national market and manufacturer sales growth are positively related to off-invoice TPs
fails to reject. While all variables have the expected sign, the standard errors are
somewhat large. Insignificance may be primarily a result of a small data set or problems
with quality of the data. Still our results provide compelling evidence that the so-called
balance of power lies with supermarket companies, rather than manufacturers.
Third, formal policies for negotiation of TPs of the retailer should increase the
percentage of off-invoice TPs, whereas the policies of the manufacturer and the
cooperation through co-marketing should decrease the percentage of off-invoice TPs. A
joint test that the retailer policy dummy, manufacturer policy dummy and co-marketing
dummy have the anticipated signs rejects in favor of our hypothesized relationship across
all models, at the 1% level of confidence.
6. CONCLUSIONS
Our results provide industry executives and public policy makers a better understanding
of key factors driving trade promotion negotiations, and how these factors differ by
product category and company. Such understanding is essential for private firm
20
profitability, improved food distribution system coordination and performance. The
methodology that we employ illustrates the importance of retailer and manufacturer’s
market power as well as their relative position in the supply chain in the formulation and
structure of TPs. Our results suggest that market power of retailers positively affects the
amount of funds that manufacturers allocate to off-invoice TPs. In contrast, our findings
show that market power of manufacturers has a weaker influence on expenditures. This
result confirms the apparent trend of power shifting across the supply chain to retailers.
This lack of bargaining power by manufacturers can be overcome by constructing formal
policies governing the negotiation of trade promotions. Finally, there is a great need for
further improvement in the quality and quantity of data, allowing more robust estimation
procedures commonly used in estimating joint bargaining relationships. By illuminating
the process by which TPs are negotiated and the factors affecting power sharing, greater
efficiency within the supply chain can be achieved.
7. REFERENCES
Aliwadi, K., Farris, P. & Shames, E. (1999). Trade promotion: Essential to selling
through resellers. MIT Sloan Management Review, 41, 83 – 92.
Bell, D. R, & Drèze, X.. (2002). Changing the channel: A better way to do trade
promotions. MIT Sloan Management Review, 43, 42 – 49.
Besanko, D., Dube, J.-P., & Gupta, S. (2005). Own-brand and cross-brand retail pass-
through. Marketing Science, in press.
Blattberg, R. C., & Levin, A. (1987). Modeling the effectiveness and protability of trade
promotions. Marketing Science, 6, 124–146.
21
Blattberg, R.C., & Neslin, S. A. (1990). Sales Promotions; Concepts, Methods, and
Strategies. NJ: Prentice-Hall, pp. 313 – 343.
Cannondale Associates. (2003). Trade Promotion Spending & Merchandising Industry
Study. Industry Survey report. Wilton, CT: Cannondal Associates. Available
through www.cannondaleassoc.com.
Consumer Reports. (2003, September). Ratings and recommendations for supermarkets.
Available at www.consumerreports.org.
Cotterill, Ronald W. (2001), Neoclassical Explanations of Vertical Organization and
Performance of Food Industries. Agribusiness, 17, 33 - 57.
Drèze, X., & Bell, D.R. (2003). Creating win-win trade promotions: Theory and
empirical analysis of scan-back trade deals. Marketing Science, 22, 16 – 39.
Gerstner, E. & Hess, J. D. (1991). A theory of channel price promotions. American
Economic Review, 81, 872 – 886.
Grocery Headquarters. (2003). The 2003 State of the Industry Almanac. Grocery
Headquarters, 69, 14-50
Hamilton, S. F. (2003). Slotting allowances as a facilitating practice by food processors
in wholesale grocery markets: Profitability and welfare effects. American Journal of
Agricultural Economics, 85, 797 – 813.
Kasulis, J., Morgan, F., Griffith, D. & Kenderdine, J. (1999). Managing trade promotions
in the context of market power. Journal of the Academy of Marketing Science,
27, 320 – 332.
22
Kumar, N., Rajiv, S., & Jeuland, A. (2001). Effectiveness of trade promotions: Analyzing
the determinants of retail pass through. Marketing Science, 20, 382 – 404.
Little, R. J.A. (1992). Regression with missing X’s: A review. Journal of the American
Statistical Association, 87, 1227 – 1237.
Merli, R. (1999, September). Retailers and suppliers agree: Trade promo stinks. Frozen
Food Age, pp. 51 – 52.
Patterson, P. M., & Richards, T. J. (2000). Produce marketing and retail buying practices,
Review of Agricultural Economics, 22, 160 – 171.
Scheffman, D. T. (2002). Antitrust economics and marketing. Journal of Public Policy &
Marketing, 21, 243 – 246.
Sullivan, M. W. (2002). The role of marketing in antitrust. Journal of Public Policy &
Marketing, 21, 247 – 249.
Tobin, J. (1958). Liquidity preferences as behavior towards risk. Review of Economic
Studies, 25, 65 – 86.
Tyagi, R. K. (1999). A characterization of retailer response to manufacturer trade deals.”
Journal of Marketing Research, 36, 510 – 516.
Young L.M., & Hobbs J.E. (2002). Vertical linkages in agri-food supply chains: changing
roles for producers, commodity groups, and government policy, Review of
Agricultural Economics, 24, 428 – 441.
23
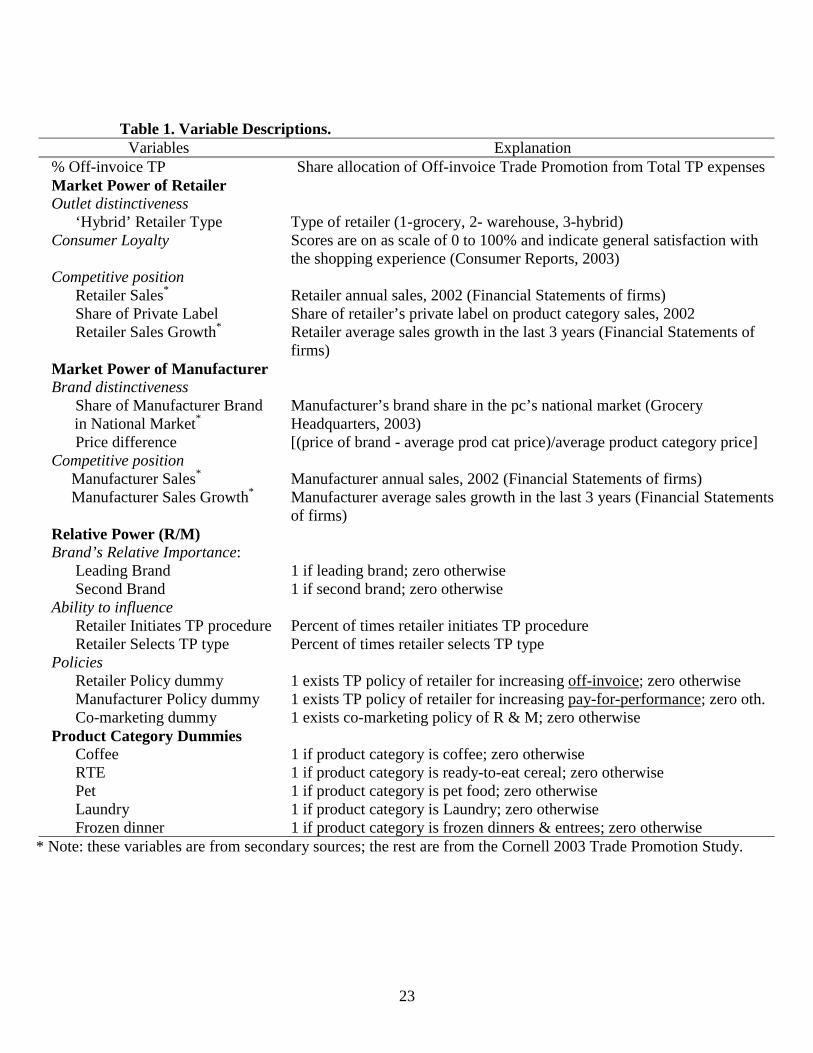
Table 1. Variable Descriptions.Variables Explanation
% Off-invoice TP Share allocation of Off-invoice Trade Promotion from Total TP expensesMarket Power of RetailerOutlet distinctiveness
‘Hybrid’ Retailer Type Type of retailer (1-grocery, 2- warehouse, 3-hybrid)Consumer Loyalty Scores are on as scale of 0 to 100% and indicate general satisfaction with
the shopping experience (Consumer Reports, 2003)Competitive position
Retailer Sales* Retailer annual sales, 2002 (Financial Statements of firms)Share of Private Label Share of retailer’s private label on product category sales, 2002
Retailer Sales Growth* Retailer average sales growth in the last 3 years (Financial Statements offirms)
Market Power of ManufacturerBrand distinctiveness
Share of Manufacturer Brandin National Market*
Manufacturer’s brand share in the pc’s national market (GroceryHeadquarters, 2003)
Price difference [(price of brand - average prod cat price)/average product category price]Competitive position Manufacturer Sales* Manufacturer annual sales, 2002 (Financial Statements of firms)
Manufacturer Sales Growth* Manufacturer average sales growth in the last 3 years (Financial Statementsof firms)
Relative Power (R/M)Brand’s Relative Importance:
Leading Brand 1 if leading brand; zero otherwiseSecond Brand 1 if second brand; zero otherwise
Ability to influenceRetailer Initiates TP procedure Percent of times retailer initiates TP procedureRetailer Selects TP type Percent of times retailer selects TP type
PoliciesRetailer Policy dummy 1 exists TP policy of retailer for increasing off-invoice; zero otherwiseManufacturer Policy dummy 1 exists TP policy of retailer for increasing pay-for-performance; zero oth.Co-marketing dummy 1 exists co-marketing policy of R & M; zero otherwise
Product Category DummiesCoffee 1 if product category is coffee; zero otherwiseRTE 1 if product category is ready-to-eat cereal; zero otherwisePet 1 if product category is pet food; zero otherwiseLaundry 1 if product category is Laundry; zero otherwiseFrozen dinner 1 if product category is frozen dinners & entrees; zero otherwise
* Note: these variables are from secondary sources; the rest are from the Cornell 2003 Trade Promotion Study.

24
Table 2. Descriptive Statistics for Sample with Both Retailer Types (‘Pure’ and ‘Hybrid’).Variables Obs. Mean Std. Deviation Min Max
Dependent Variable% Off-invoice TP from Total TP expenses 185 0.257 0.323 0 1Explanatory variablesMarket Power of RetailerOutlet distinctiveness
Type of Retailer categorical variable 186 1.484 0.858 1 3Consumer Loyalty R
Consumer Loyalty 144 73.666 3.162 68 82Consumer Loyalty Imputed* 186 73.773 2.843 68 82
Competitive positionRetailer Sales 186 9.508 10.679 1 51.8Share of Private Label of Retailer 183 0.066 0.061 0 0.3Retailer Sales Growth 186 2.430 6.114 8.4 17.7
Market Power of ManufacturerBrand distinctiveness
Share of Brand in National Market 185 17.974 13.169 1 46.3Price Difference 185 -1.315 31.633 -65 147.8
Competitive position Manufacturer Sales 185 15.025 14.305 .002 50.7
Manufacturer Sales Growth 185 4.706 9.566 -22.9 55.6Relative Power (R/M)Brand’s Relative Importance:
Leading Brand 186 0.333 0.473 0 1Second Brand 186 0.333 0.473 0 1
Ability to influenceRetailer Initiates TP procedure 185 0.498 0.238 0 1Retailer Selects TP type 183 0.589 0.269 0 1
PoliciesRetailer Policy dummy 186 0.123 0.330 0 1Manufacturer Policy dummy 186 0.107 0.310 0 1Co-marketing dummy 186 0.0860 0.281 0 1
Product Category DummiesCoffee 186 0.161 0.368 0 1RTE 186 0.258 0.438 0 1Pet 186 0.129 0.336 0 1Laundry 186 0.145 0.353 0 1Frozen dinner 186 0.242 0.429 0 1
* Includes imputed values based on dependent and independent variables (see Little,1992)
25
Table 3. Descriptive Statistics for Subset Including Only ‘Pure’ Retailers.Variables Obs. Mean Std. Deviation Min Max
Dependent Variable% Off-invoice TP from Total TP expenses 140 0.288 0.332 0 1Explanatory variablesMarket Power of RetailerOutlet distinctiveness
Only ‘Pure’ Retailers included Na Na Na Na NaConsumer Loyalty
Consumer Loyalty with Imputed 141 73.586 3.195 68 82Competitive position
Retailer Sales 141 9.296 11.775 1 51.8Share of Private Label of Retailer 138 0.0713 0.066 0 0.3Retailer Sales Growth 141 4.651 4.840 -3.6 17.7
Market Power of ManufacturerBrand distinctiveness
Share of Brand in National Market 140 17.320 12.460 1.5 46.3Price Difference 140 0.084 32.317 -44.7 147.8
Competitive position Manufacturer Sales 140 15.492 14.547 0 50.7
Manufacturer Sales growth 185 4.706 9.566 -22.9 55.6Relative Power (R/M)Brand’s Relative Importance:
Leading Brand 141 0.333 0.473 0 1Second Brand 141 0.333 0.473 0 1
Ability to influenceRetailer Initiates TP procedure 140 0.497 0.252 0 1Retailer Selects TP type 139 0.599 0.288 0 1
PoliciesRetailer Policy dummy 141 0.142 0.350 0 1Manufacturer Policy dummy 141 0.113 0.318 0 1Co-marketing dummy 141 0.092 0.290 0 1
Product Category DummiesCoffee 141 0.170 0.377 0 1RTE 141 0.276 0.448 0 1Pet 141 0.127 0.335 0 1Laundry 141 0.127 0.335 0 1Frozen dinner 141 0.276 0.449 0 1
26
Table 4. Tobit Estimates.b
Explanatory variables: (1) (2) (3) Expectedsign
Market Power of RetailerOutlet distinctiveness
‘Hybrid’ Retailer Type -0.145** (0.073) -0.151** (0.073) Na +/-Consumer Loyalty
Consumer Loyalty with Imputed Not used 0.014 (0.0114) 0.018 (0.0029)*** +Competitive position
Retailer Sales 0.009*** (0.0028) 0.010*** (0.0028) 0.013*** (0.637) +Share of Private Label of Retailer 2.615*** (0.602) 2.635*** (0.600) 2.889*** (0.637) +
Market Power of ManufacturerBrand distinctiveness
Share of Manuf. Brand in National Market -0.003 (0.0037) -0.003 (0.004) -0.007* (0.004) -Competitive position
Manufacturer Sales growth -0.003 (0.003) -0.003 (0.003) -0.0024 (0.004) -Relative Power (R/M)Brand’s Relative Importance:
Leading Brand 0.033 (0.092) 0.034 (0.092) 0.103 (0.100) +/-Second Brand -0.0087 (0.082) -0.008 (0.082) 0.037 (0.091) +/-
Ability to influenceRetailer Initiates TP procedure 0.107 (0.155) 0.088 (0.155) -0.043 (0.159) +/-Retailer Selects TP type -0.242* (0.127) -0.232* (0.127) -0.239* (0.130) +
PoliciesRetailer Policy dummy 0.087 (0.107) 0.058 (0.109) 0.0781 (0.107) +Manufacturer Policy dummy -0.336*** (0.119) -0.334*** (0.119) -0.363*** (0.130) -Co-marketing dummy -0.271* (0.139) -0.236* (0.142) -0.156 (0.149) -
Product Category DummiesCoffee -0.134 (0.149) -0.156 (0.150) -0.267 (0.229) +/-RTE -0.102 (0.135) -0.088 (0.135) -0.123 (0.215) +/-Pet -0.299* (0.169) -0.279* (0.169) -0.298 (0.239) +/-Laundry -0.066 (0.152) -0.048 (0.152) -0.099 (0.228) +/-Frozen dinner 0.094 (0.168) 0.102 (0.168) -0.038 (0.229) +/-
Constant 0.198 (0.170) -0.828 (0.872) -1.041 (0.236)Number of obs 180 180 136Pseudo R2 0.2539 0.2597 0.3228Left censored 63 63 43LR chi2 LR chi2(17) =
62.59LR chi2(18) =
64.02LR chi2(17) =
61.09Log likelihood -91.96214 -91.242877 -65.35671
b Standard errors in parentheses; *** p-value<0.01; ** p-value<0.05; * p-value<0.10;
27
Figure 1. Retailer Gains from Off Invoice Trade Promotions.
28
Figure 2. Economic Factors Affecting the Structure of Trade Promotions.
(1) TP_offinvoice Market_Power_R Market_Power_M
Relative_Power(R/M)
• % Off-Invoicefrom total TPexpenditure
• Outletdistinctiveness_R
• Branddistinctiveness_M
• Brand’s RelativeImportance
• Competitiveposition_R
• Competitive position_M • Ability to influence
• Categoryimportance_R
• Category importance_M • Policies
• Consumerloyalty_R
• Consumer loyalty_M