Market Outlook July 2019 - Tata Capital › content › dam › tata-capital › pdf ›...
16
Market Outlook July 2019
Transcript of Market Outlook July 2019 - Tata Capital › content › dam › tata-capital › pdf ›...

Market Outlook
July 2019

Equity Roundup - Movement in June
IndexClosing Value
1-Month Return (%)
1 Year Return (%)
U.S
S&P 500 2752 6.89 8.22
Nasdaq 8006 7.42 6.60
Dow Jones 24815 7.19 9.59
Europe
DAX 12399 5.73 0.75
FTSE 100 7426 3.69 -2.77
Asia/Pacific
Nikkei 21276 3.28 -4.61
KOSPI 2131 4.35 -8.40
Hang Seng 28543 6.10 -1.42
Domestic
Sensex 39395 -0.80 11.21
Nifty 11789 -1.12 10.03
BSE Mid cap TRI 17591 -1.79 -3.14
BSE Small cap TRI 16759 -4.18 -10.44
BSE 100 TRI 14186 -0.90 9.79
BSE 200 TRI 5863 -1.00 8.24
BSE 500 TRI 18163 -1.27 6.54
Data as on 30 June 2019TRI – Total Return Index
*S&P BSE Sectoral Indices movement between 31 May’19 to 30 June’19 in % terms
• Majority of BSE sectoral indices ended in red. Consumer Durablesoutpaced other sectoral indices under analysis by generating 5.8% inJune 2019. Power and Metals rose 4.2% and 3.3% respectively. Oil & Gasand Energy Sectors were hit by increase in Crude Oil prices and fell by5.9% and 5.2% respectively.
2
(5.9)
(5.2)
(4.2)
(3.1)
(2.9)
(1.8)
(1.4)
(0.8)
(0.8)
(0.8)
(0.4)
0.0
0.1
3.3
4.2
5.8
(9.0) (6.0) (3.0) 0.0 3.0 6.0 9.0 12.0
Oil & Gas
Energy
Small Cap TRI
Heath Care
Auto
Mid Cap TRI
FMCG
Bankex
IT
Sensex
Capital Goods
Realty
PSU
Metals
Power
Consumer Durables

3
Equity Market Roundup - Key Takeaways
• Factors which affected Indian Equity Markets: The key benchmark indices ended the month of June marginally in the red on theback of domestic and global factors such as trade woes, US Federal Reserve reintegrating stronger case for rate cut amideconomic crisis and uptick in gold and crude prices.
• Moreover, concerns over monsoon deficit following reports that monsoon has progressed slower than usual after hitting thesouthern state of Kerala nearly a week late deepened the losses. Also, weakening of rupee added to the woes.
• However, losses were capped by strong flows by domestic institutional investors (DIIs) and foreign institutional investors (FIIs).
• Domestic data points: CPI continued its upward trajectory for the fourth consecutive month to a seven month high of 3.05% inMay 19. This is still below the RBI medium term target of 4.0%.
• India’s Index of Industrial Production (IIP) growth rose 3.4% YoY in Apr 2019 as against revised growth of 0.4% (decline of 0.1%originally reported) in Mar 2019 and increase of 4.5% in Apr 2018. The current reading was highest in seven months.
• Performance: Nifty (-1.1%) and Sensex (-0.8%) ended the month on a weak note. Though BSE Mid cap index performed in linewith its larger peers ending the month with (-1.8%) return, the BSE Small Cap index fell further by 4.2%. However, majority of theglobal indices managed to close the month deep in the green.
• Other data points: The Union budget announced on the July 05th, 2019 announced a slew of reforms for the empowering theMSMEs and social enterprise, promoting startups, pushing usage of E-vehicles, giving a boost to the infrastructure sector –roads, rail, air, shipping and inland waterways, housing reforms and measures to resolve the NBFC crisis. However, theadditional taxation on ultra HNIs and 20% tax on buy back of shares played a spoil sport for the market.
• India’s current account deficit (CAD) narrowed to $4.6 billion (0.7% of GDP) in Q4FY19 narrowed from $13.0 billion (1.8% ofGDP) in Q4FY18 and $17.7 billion (2.7% of GDP) in the previous quarter.

4
Macro Indicators
signifies positive movement over Q-o-Q signifies negative movement over Q-o-Q
Current Quarter Ago Year Ago
Consumer Price Index (CPI) 3.05% (May-19) 2.57% (Feb-19) 4.87% (May-18)
Wholesale Price Index (WPI) 2.45% (May-19) 2.93% (Feb-19) 4.78% (May-18)
Industrial Production (IIP) 3.4% (Apr-19) 1.30% (Jan-19) 4.5% (Apr-18)
GDP 5.80% (Mar-19) 6.60% (Dec-18) 8.10% (Mar-18)
Trade Deficit ($ bn) 15.36 (May-19) 9.60 (Feb-19) 14.62 (May-18)
Commodity Market
Brent Crude ($/barrel) 64.23 67.95 77.77
Gold ($/oz) 1391.17 1288.15 1251.65
Silver ($/oz) 15.23 15.11 16.10
Currency Market
USD/INR 69.06 69.19 68.66
EURO/INR 78.33 77.65 80.00
GBP/INR 87.52 90.09 90.42
YEN/INR (per 100) 63.91 62.46 61.85
Equity Net Flows
Mutual Funds & DIIs (Rs. Cr) 6232 (June-19) -7396 (Mar-19) 6555 (June-18)
FIIs (Rs. Cr) 2595 (June-19) 33981 (Mar-19) -4831 (June-18)

5
Performance across Market Caps v/s Nifty - Small Caps outperforms in June
Data as on 30 June 2019; Source: ICRA MFI
-1.1
2.3
9.3
7.6 7.3
10.89.6
-2.8-2.1
1.7
-0.9
1.0
8.3
11.0
-1.4
1.0
7.3
5.5 6.0
10.8 10.5
-3.6 -3.2
0.6
-4.9
-1.6
7.3
11.3
-1.8
1.2
10.1 9.910.7
12.3
8.8
-10.0
-6.0
-2.0
2.0
6.0
10.0
14.0
1 Month 3 Months 6 Months 1 Year 2 Years 3 Years 5 Years
Large Cap Mid Cap Small Cap Multi Cap Nifty

6
Union Budget 2019-20 : Key Highlights
Vision to become $5
trillion economy driven by
‘virtuous cycle’ of investment
India becomes sixth largest
economy
Enhanced interest
deduction for affordable
housing loan
FDI in Aviation, Media and Insurance
sectors
Bharatmalaphase 2 to be
launched
Jal Marg Vikas project and Sagarmalainitiatives
Push to E-Vehicles
Aadhaar and PAN to be
interchangeable
Cut in corporate tax for
companies
7
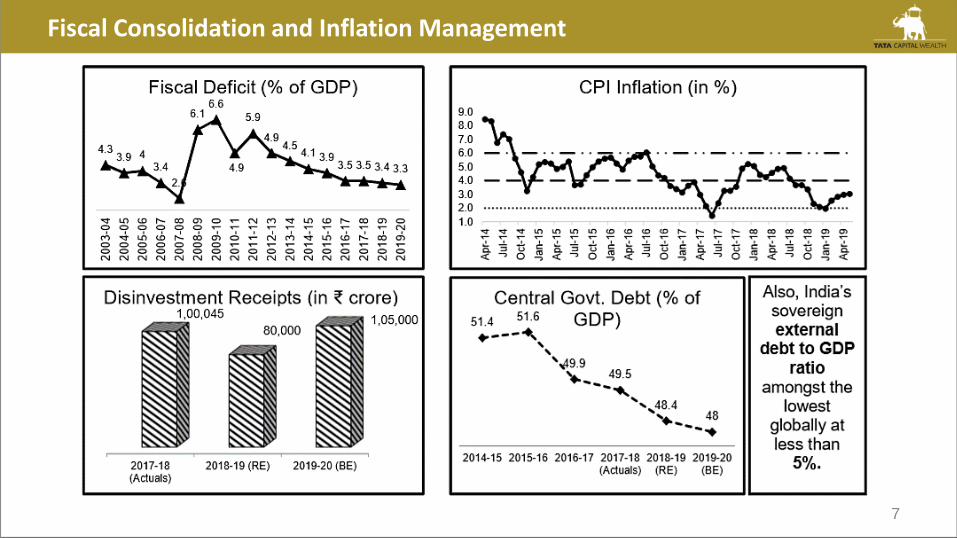
Fiscal Consolidation and Inflation Management

8
Tax Proposals
Giving a boost to the aim of "Housing for All", additional tax deduction of Rs. 1.5 lakh over the existing limit of Rs. 2 lakh has beenproposed interest paid on home loan taken up to March 31, 2020 for buying affordable house for up to Rs. 45 lakh. This will provide atotal benefit of Rs. 7 lakh over a loan period of 15 years.
TDS of 2% on cash withdrawal exceeding Rs. 1 crore in a year from a bank account to promote less cash economy.
In order to give a boost to sale of electric vehicles, FM proposed additional exemption of Rs. 1.5 lakh on interest paid on auto loan takenfor purchase of electric vehicles.
FM increased income tax surcharge for HNIs earnings more than Rs. 2 crore a year. Those earning between Rs. 2-5 crore will have toshell out 3% more and earning above Rs. 5 crore will have to shell out 7% more.
Benefit of section 80C for investments made in Central Public Sector Enterprise (CPSE) exchange-traded fund (ETF).
To make filing of Income Tax Returns (ITR) easy, FM announced that pre-filled ITRs would be made available by integrating informationcollected from Banks, Stock exchanges, mutual funds etc.
FM proposed to restrict Security Transaction Tax to the difference between settlement and strike price in case of exercise of options.
FM proposed to extend the buy back tax at 20% to listed companies.
PAN and Aadhaar made interchangeable, allowing those who do not have PAN to file return.
Cut in corporate tax for companies with annual turnover of up to Rs. 400 crore to 25% from 30% earlier.

9
Summary of Budget 2019-20
The first Budget of Modi 2.0 mainly focuses on development of agriculture and infrastructure, housing for all, ease of doing businessand incentives for start-ups.
FM lowered the fiscal deficit target to 3.3% for the current fiscal from the earlier estimate of 3.4% of the GDP; this shows the governmentis trying to reduce the fiscal deficit.
Enhanced interest deduction up to Rs. 3.5 lakh for purchase of an affordable house. This will benefit the middle-class first time homeowners and will also provide a boost to the housing sector.
Big boost given to infrastructure development in order to build national road corridors and railways.
The public holding is proposed to increase in equity from 25% to 35% which shall increase retail participation in equities.
To enhance liquidity access for NBFC sector, the government will provide one-time 6-month partial guarantee of Rs. 1 lakh crore to state-run banks for purchasing consolidated high-rated pooled assets of financially-sound NBFCs. FM also said that NBFCs fundamentally soundwill continue to get funding from mutual funds and banks; this might alleviate the ongoing crisis in NBFC.
Budget proposed to provide public sector banks with Rs. 70,000 crore of capital to boost credit. This might help the banks to lend more.
Measures to boost sectors such as Media and Aviation; government is planning to increase the FDI limit. Also, allowing 100% FDI ininsurance intermediaries may bring technology and innovations in the financial distribution space.
Overall, The first budget of NDA 2.0 is in-line with its long term thought process and putting in place structural building blocks to accelerate economic growth.

10
Debt Markets - Review

11
Debt Market Roundup - Key Takeaways
• Factors that affected the Bond Markets: The bond markets rallied during the month as the rupee strengthened against the dollar,inflation remained well within the RBI comfort zone, RBI policy stance becoming dovish signaling room for further rate cut andincreased expectation of RBI to transfer reserves to the government.
• To support liquidity, RBI conducted purchases under open market operations of Rs. 27,500 crore in June 2019, higher than plannedpurchases of Rs. 15,000 crore. Average liquidity turned positive due to higher central government spending, forex purchases by RBIand tepid growth in currency in circulation.
• Macro Economic Overview: The RBI in June policy meeting pegged the growth outlook for FY20 to 7.0% from the earlier 7.2% andat the same time it raised the inflation expectation for H1 to 3.0-3.1% and reduced that of H2 to 3.4-3.7%.
• During the budget, the government cut down the fiscal deficit target for the fiscal from 3.4% to 3.3%, aimed at India becoming the6th largest economy in FY20 and pegged current account deficit at 2.1% of GDP.
• As a step towards resolving the NBFC liquidity crisis, the government will provide a one-time 6 month partial guarantee of Rs. 1lakh crore to state run banks to purchase high rated pooled assets of financially sound NBFC and has done away with therequirement of creating a debenture redemption reserve (DRR).
• To boost credit, the FM provided more than expected package of Rs 70,000 crore for recapitalization of public sector banks. Thegovernment further announced a disinvestment target of Rs 1.05 lakh crore.
• Performance of 10-year G-Sec Yield: The 10-year benchmark G-Sec yield closed at 6.88% in June 2019, down by 18 bps from itsprevious close of 7.06% in May 2019.
• Outlook: Markets closely will track the evolving trade relationship between US and China, how the well the government implementsthe various steps to boost liquidity in the market and be able to meet the lowered fiscal slippage target.
For internal circulation only

12
Debt Roundup
30 June’19 31 May’19 30 June’18 M-o-M Change
Interest Rates Repo rate 5.75% 6.00% 6.25% -25 bps
SLR 19.00% 19.00% 19.50% 0 bpsCD Rates 3 month 6.35% 6.40% 6.90% -5 bps6 month 6.90% 6.80% 7.40% 10 bps1 Year 7.20% 7.15% 8.15% 5 bps
CP Rates 3 month 6.85% 6.85% 7.50% 0 bps6 month 7.75% 7.65% 8.05% 10 bps1 Year 7.85% 8.00% 8.40% -15 bps
T-Bill/G-sec 91 Days 5.98% 6.16% 6.50% -18 bps
364 Days 6.14% 6.30% 7.09% -16 bps7.26% GOI 2029 (10 Yr GOI) -New 6.88% 7.06% - -18 bps7.17% GOI 2028 (10 Yr GOI) - Old 7.01% 7.20% 7.90% -19 bps
Corporate Bonds (PSU) 3 Year 7.45% 7.50% 8.45% -5 bps5 Year 7.48% 7.35% 8.68% -13 bps
10 Year 7.90% 7.97% 8.62% -7 bpsInternational Markets
10 Year US Treasury Yield 2.01% 2.18% 2.85% -17 bps3 Months LIBOR 2.33% 2.52% 2.33% -19 bps
12 Months LIBOR 2.18% 2.57% 2.76% -19 bps

13
Yields Movement Across - India and US
• 10-year India Government Bond Yield: The 10-year benchmark G-Sec yield fell to its lowest since October 17, 2017 after the U.S.Federal Reserve indicated possible interest rate cuts later this year, while buying from state-run banks also aided. The 10-yearbenchmark G-Sec yield closed at 6.88% in June 2019, down by 18 bps from its previous close of 7.06% in May 2019.
• U.S. Treasury Yield: U.S. Treasury yields fell 8 bps to 2.01% on 30 June 2019 from 2.18% on 31 May 2019. US – China trade warsgained traction during the month as US imposed additional tariffs on a select few Chinese goods with China threatening toreciprocate the same; impacted the yields.
For internal circulation only
6.656.756.856.957.057.157.257.357.457.55
31
-Mar
-19
9-A
pr-
19
18
-Ap
r-1
9
27
-Ap
r-1
9
6-M
ay-1
9
15
-May
-19
24
-May
-19
2-J
un
-19
11
-Ju
n-1
9
20
-Ju
n-1
9
29
-Ju
n-1
9
India 10-Year Government Bond Yield (New) (%)
1.85
1.95
2.05
2.15
2.25
2.35
2.45
2.55
2.65
31
-Mar
-19
07
-Ap
r-1
9
14
-Ap
r-1
9
21
-Ap
r-1
9
28
-Ap
r-1
9
05
-May
-19
12
-May
-19
19
-May
-19
26
-May
-19
02
-Ju
n-1
9
09
-Ju
n-1
9
16
-Ju
n-1
9
23
-Ju
n-1
9
30
-Ju
n-1
9
10-Year US Bond Yield (%)
14
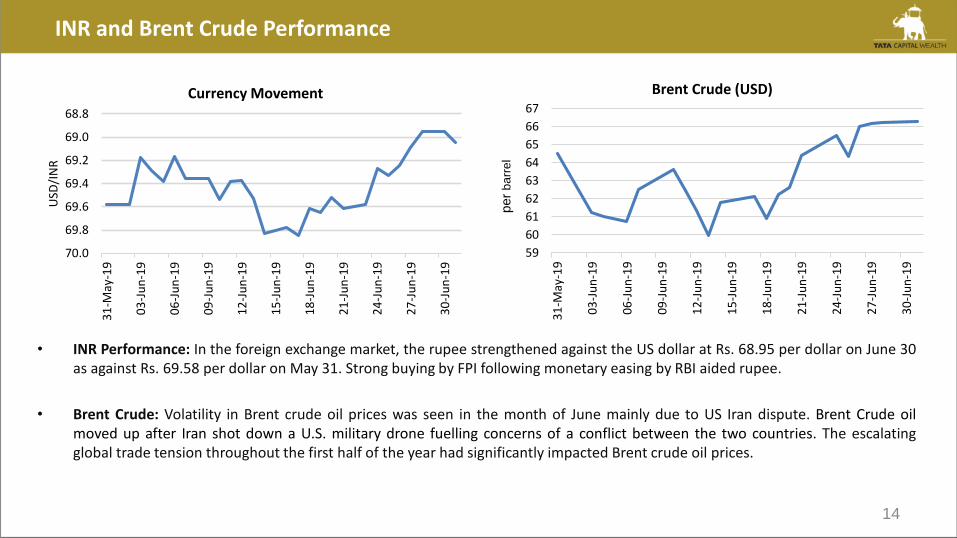
INR and Brent Crude Performance
• INR Performance: In the foreign exchange market, the rupee strengthened against the US dollar at Rs. 68.95 per dollar on June 30as against Rs. 69.58 per dollar on May 31. Strong buying by FPI following monetary easing by RBI aided rupee.
• Brent Crude: Volatility in Brent crude oil prices was seen in the month of June mainly due to US Iran dispute. Brent Crude oilmoved up after Iran shot down a U.S. military drone fuelling concerns of a conflict between the two countries. The escalatingglobal trade tension throughout the first half of the year had significantly impacted Brent crude oil prices.
For internal circulation only
68.8
69.0
69.2
69.4
69.6
69.8
70.0
31
-May
-19
03
-Ju
n-1
9
06
-Ju
n-1
9
09
-Ju
n-1
9
12
-Ju
n-1
9
15
-Ju
n-1
9
18
-Ju
n-1
9
21
-Ju
n-1
9
24
-Ju
n-1
9
27
-Ju
n-1
9
30
-Ju
n-1
9
USD
/IN
R
Currency Movement
59
60
61
62
63
64
65
66
67
31
-May
-19
03
-Ju
n-1
9
06
-Ju
n-1
9
09
-Ju
n-1
9
12
-Ju
n-1
9
15
-Ju
n-1
9
18
-Ju
n-1
9
21
-Ju
n-1
9
24
-Ju
n-1
9
27
-Ju
n-1
9
30
-Ju
n-1
9
Brent Crude (USD)
pe
r b
arr
el
per
ba
rre
l
15
Disclaimer
This report is for the personal information of the authorized recipient and does not construe to be any investment, legal or taxation advice to you. TATA Capital Financial Services Limited
(‘TCFSL’) is not soliciting any action based upon it. Nothing in this research report shall be construed as a solicitation to buy or sell any security or product, or to engage in or refrain from
engaging in any such transaction. It does not constitute a personal recommendation or take into account the particular investment objectives, financial situations, or needs of the reader.
This research report has been prepared for the general use of the clients of the TCFSL and must not be copied, either in whole or in part, or distributed or redistributed to any other person in
any form. If you are not the intended recipient you must not use or disclose the information in this research report in any way. Though disseminated to all the customers simultaneously, not all
customers may receive this report at the same time. TCFSL will not treat recipients as customers by virtue of their receiving this report. Neither this document nor any copy of it may be taken
or transmitted into the United States (to US Persons), Canada or Japan or distributed, directly or indirectly, in the United States or Canada or distributed, or redistributed in Japan to any
residents thereof. The distribution of this document in other jurisdictions may be restricted by the law applicable in the relevant jurisdictions and persons into whose possession this document
comes should inform themselves about, and observe any such restrictions.
It is confirmed that, the author of this report has not received any compensation from the companies mentioned in the report in the preceding 12 months. No part of the compensation of the
analyst(s) was, is, or will be directly or indirectly related to the inclusion of specific recommendations or views in this research. The analyst(s), principally responsible for the preparation of this
research report, receives compensation based on overall revenues of TCFSL and TCFSL has taken reasonable care to achieve and maintain independence and objectivity in making any
recommendations.
Neither TCFSL nor its directors, employees, agents, representatives shall be liable for any damages whether direct or indirect, incidental, special or consequential including lost revenue or lost
profits that may arise from or in connection with the use of the information contained in this report.
The report is based upon information obtained from sources believed to be reliable, but TCFSL does not make any representation or warranty that it is accurate, complete or up to date and it
should not be relied upon as such. It does not have any obligation to correct or update the information or opinions in it. TCFSL or any of its affiliates or employees shall not be in any way
responsible for any loss or damage that may arise to any person from any inadvertent error in the information contained in this report. TCFSL or any of its affiliates or employees do not
provide, at any time, any express or implied warranty of any kind, regarding any matter pertaining to this report, including without limitation the implied warranties of merchantability, fitness for
a particular purpose, and non-infringement. The recipients of this report should rely on their own investigations. This information is subject to change without any prior notice. TCFSL reserves
at its absolute discretion the right to make or refrain from making modifications and alterations to this statement from time to time. Nevertheless, TCFSL is committed to providing independent
and transparent recommendations to its clients, and would be happy to provide information in response to specific client queries.
Certain transactions -including those involving futures, options and other derivatives as well as non-investment grade securities - involve substantial risk and are not suitable for all investors.
Reports based on technical analysis centers on studying charts of a stock’s price movement and trading volume, as opposed to focusing on a company’s fundamentals and as such, may not
match with a report on a company’s fundamentals.
Before making an investment decision on the basis of this research, the reader needs to consider, with or without the assistance of an adviser, whether the advice is appropriate in light of
their particular investment needs, objectives and financial circumstances. There are risks involved in securities trading. The price of securities can and does fluctuate, and an individual
security may even become valueless. International investors are reminded of the additional risks inherent in international investments, such as currency fluctuations and international stock
market or economic conditions, which may adversely affect the value of the investment. Neither TCFSL nor the director or the employee of TCFSL accepts any liability whatsoever for any
direct, indirect, consequential or other loss arising from any use of this research report and/or further communication in relation to this research report.
We and our affiliates, officers, directors, and employees worldwide may: (a) from time to time, have long or short positions in, and buy or sell the securities thereof, of company (ies)
mentioned herein or (b) be engaged in any other transaction involving such securities and earn brokerage or other compensation or act as a market maker in the financial instruments of the
company (ies) discussed herein or act as advisor or lender / borrower to such company (ies) or have other potential conflict of interest with respect to any recommendation and related
information and opinions.
Investments in securities are subject to market risk; please read the SEBI prescribed Combined Risk Disclosure Document prior to investing. Derivatives are a sophisticated investment
device. The investor is requested to take into consideration all the risk factors before actually trading in derivative contracts. Our research should not be considered as an advertisement or
advice, professional or otherwise
For internal circulation only

16
Tata Capital Financial Services Limited (“TCFSL”) is registered with the Reserve Bank of India as a Non Deposit Accepting Systemically Important Non-Banking Finance Company (“NBFC-
ND-SI”).
TCFSL is also registered with The Securities and Exchange Board of India (“SEBI”) as an Investment Adviser bearing Registration no. INA000002215. As part of this offering, TCFSL
advises on various products and services to its clients based on independent objective criteria and sound principles of financial planning based on customer’s financial goals. TCFSL may
advise clients on debt securities but does not enter into principal to principal transactions with its advisory clients for such debt securities. No material disciplinary action has been taken on
TCFSL by any Regulatory Authority pertaining to Investment Advisory activities.
TCFSL is also registered with The Insurance Regulatory and Development Authority (“IRDA”) as a Corporate Agent (Composite) with Registration No: CA0076.
TCFSL is also engaged in Mutual Fund Distribution business and is registered with The Association of Mutual Funds in India (“AMFI”) bearing ARN No. 84894. Please note that all Mutual
Fund Investments are subject to market risks, read all scheme related documents carefully before investing for full understanding and details.
TCFSL distributes:
(a) Mutual Fund Schemes of TATA Mutual Fund
(b) Life Insurance Policies of Tata AIA Life Insurance Company Limited
(c) General Insurance Policies of TATA AIG General Insurance Company Limited
TCFSL receives commission ranging from 0.00% to 2.00% p.a. from the Asset Management Companies (“AMC”) towards investments in mutual funds made through TCFSL. TCFSL
receives commission ranging from 0.00% to 40.00% as First year commission and renewal commission ranging from 0.00% to 5.00% on Life Insurance Policies bought through TCFSL.
TCFSL receives commission ranging from 0.00% to 25.00% on General Insurance Policies bought through TCFSL. TCFSL receives commission ranging from 0.00% to 2.00% on Corporate
Fixed deposit made through TCFSL.
Please note that the above commission may change from time to time and are exclusive of statutory levies like GST, Security Transaction tax, Stamp Duty, Exchange transaction charges,
SEBI turnover fee etc. TCFSL does not recommend any transaction which is required to be dealt with on a Principal to Principal basis.
Please note that any communication given by TCFSL is purely in an advisory capacity and such an advice does not place any obligation/ compulsion on you to purchase or invest in the
products/ schemes mentioned in any financial plan, offer document/scheme information documents etc. circulated through TCFSL or its representatives/ personnel. You agree and confirm
that any investment made by you will be at your sole discretion and that you have undertaken the required due diligence/ research before investing in any of the products/ schemes and that
TCFSL and/or its affiliates/ parent company shall not be liable or responsible for the same. TCFSL is an authorized composite corporate agent and does not underwrite the risk or act as an
insurer. The contents herein above shall not be considered as an invitation or persuasion to invest. Insurance is the subject matter of the solicitation.
Wealth Management is a service offering of TCFSL and is offered at its sole discretion.
Registered office:
11th Floor, Tower A, Peninsula Business Park, Ganpatrao Kadam Marg, Lower Parel, Mumbai 400 013.
For internal circulation only
General Disclosure