Market Outlook - JB Nagarjbnagarca.org/wp-content/uploads/2012/07/Market-Outlook... · Birla Sun...
29
Copyright Aditya Birla Nuvo Limited 2013 Birla Sun Life Asset Management Company Limited Market Outlook Opportunities & Challenges
Transcript of Market Outlook - JB Nagarjbnagarca.org/wp-content/uploads/2012/07/Market-Outlook... · Birla Sun...

Copyright Aditya Birla Nuvo Limited 2013
Birla Sun Life Asset Management Company Limited
Market Outlook Opportunities & Challenges

Copyright Aditya Birla Nuvo Limited 2013
Birla Sun Life Asset Management Company Limited
2
• Indian Markets
• 2013: Where we got lost
• 2014-15 : Winds of change- The way ahead
• India Inc.: On the path to recovery
• Budget view
• Valuations and Expectations
• Market Outlook
Agenda

Copyright Aditya Birla Nuvo Limited 2013
Birla Sun Life Asset Management Company Limited
-10%
-5%
0%
5%
10%
15%
20%
Mar-07
Mar-08
Mar-09
Mar-10
Mar-11
Mar-12
Mar-13
Mar-14
YoY%
YoY% 3MMA
3
Source: Morgan Stanley Research
Industrial Production – flat for the last ~2.5 years now
8%
9%
10%
11%
12%
13%
14%
15%
16%
Ja
n-1
3
Feb
-13
Ma
r-1
3
Apr-
13
Ma
y-1
3
Ju
n-1
3
Ju
l-1
3
Au
g-1
3
Se
p-1
3
Oct-
13
No
v-1
3
De
c-1
3
Ja
n-1
4
Feb
-14
Ma
r-1
4
Ap
r-1
4
CPI Food Inflation
CPI
%yoy
9.7%
8.6%
3%
4%
5%
6%
7%
8%
9%
10%
11%
12%
Ap
r-0
2O
ct-
02
Ap
r-0
3O
ct-
03
Ap
r-0
4O
ct-
04
Ap
r-0
5O
ct-
05
Ap
r-0
6O
ct-
06
Ap
r-0
7O
ct-
07
Ap
r-0
8O
ct-
08
Ap
r-0
9O
ct-
09
Ap
r-1
0O
ct-
10
Ap
r-1
1O
ct-
11
Ap
r-1
2O
ct-
12
Apr-
13
Oct-
13
Ap
r-1
4
Reverse Repo Rate Repo Rate
91-Day T-Bill Yield
Policy inertia impacted investments & growth
3
4
5
6
7
8
9
10
11
12
Ma
r-07
Jun
-07
Se
p-0
7D
ec-0
7M
ar-
08
Jun
-08
Se
p-0
8D
ec-0
8M
ar-
09
Jun
-09
Se
p-0
9D
ec-0
9M
ar-
10
Jun
-10
Se
p-1
0D
ec-1
0M
ar-
11
Jun
-11
Se
p-1
1D
ec-1
1M
ar-
12
Jun
-12
Se
p-1
2D
ec-1
2M
ar-
13
Jun
-13
Se
p-1
3D
ec-1
3M
ar-
14
India Quarterly GDP Growth, %yoy
GDP Growth slowed down amid external and internal factors Persistent high inflation resulted in high rates, input costs
Increasing interest rates have hit margins, investments

Copyright Aditya Birla Nuvo Limited 2013
Birla Sun Life Asset Management Company Limited
4
India 2015 & beyond : The way ahead

Copyright Aditya Birla Nuvo Limited 2013
Birla Sun Life Asset Management Company Limited
Key drivers:
1. Politics – stable, strong Government, after 30 years
2. Investment cycle: policy push + cyclical upswing
3. Inflation and interest rates to cool down
4. Current Account and Currency have stabilized
5. Budget View
5
Pillar of future growth
Copyright Aditya Birla Nuvo Limited 2013
Birla Sun Life Asset Management Company Limited
0%
2%
4%
6%
8%
10%
12%
FY06 FY07 FY08 FY09 FY10 FY11 FY12 FY13 FY14 E
GDP Growth : Pvt. + Public Consumption, Net Exports and others
GDP Growth attributed to GFCF change
6
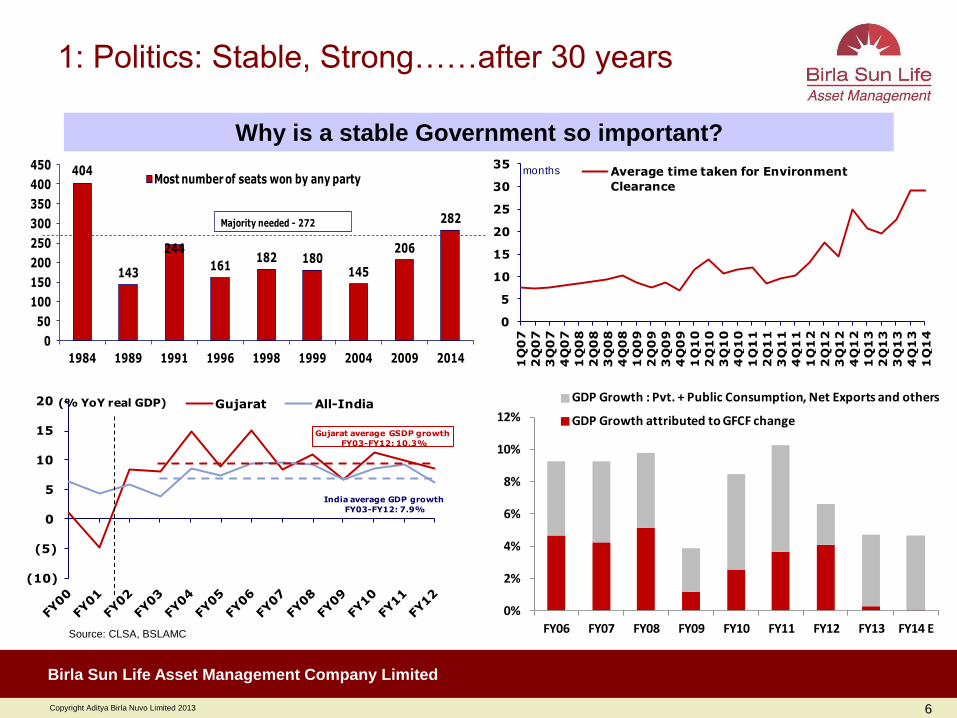
1: Politics: Stable, Strong……after 30 years
Why is a stable Government so important?
404
143
244
161182 180
145
206
282
0
50
100
150
200
250
300
350
400
450
1984 1989 1991 1996 1998 1999 2004 2009 2014
Most number of seats won by any party
Majority needed - 272
0
5
10
15
20
25
30
35
1Q
07
2Q
07
3Q
07
4Q
07
1Q
08
2Q
08
3Q
08
4Q
08
1Q
09
2Q
09
3Q
09
4Q
09
1Q
10
2Q
10
3Q
10
4Q
10
1Q
11
2Q
11
3Q
11
4Q
11
1Q
12
2Q
12
3Q
12
4Q
12
1Q
13
2Q
13
3Q
13
4Q
13
1Q
14
Average time taken for Environment
Clearance
months
(10)
(5)
0
5
10
15
20 Gujarat All-India(% YoY real GDP)
Gujarat average GSDP growth
FY03-FY12: 10.3%
India average GDP growth
FY03-FY12: 7.9%
Source: CLSA, BSLAMC
Copyright Aditya Birla Nuvo Limited 2013
Birla Sun Life Asset Management Company Limited
7
Politics: Stable, Strong……after 30 years
Priorities of the new regime
1. Reduce Inflation - Release food stock, Restructure APMC laws
2. Improve Governance, decision-making
3. Job creation by stimulating manufacturing investments - liberalize
FDI limits and law, create industrial clusters
4. Reforms in mining, power sectors and land acquisition
5. PSU reforms - Holding company structure
6. Accelerate infrastructure creation
• Dedicated Freight Corridor, 100 new cities, River-linking, Road and
Rail Diamond Quadrilateral, National Gas Grid, Strengthen Power
Grid, High Speed Rail, Alternate Energy

Copyright Aditya Birla Nuvo Limited 2013
Birla Sun Life Asset Management Company Limited
8
Investment cycle: Policy push + Cyclical upswing As bad as it gets: USD 130 billion projects stalled
0
1,000
2,000
3,000
4,000
5,000
6,000
7,000
8,000
9,000
Sep
-96
Mar-
97
Sep
-97
Mar-
98
Sep
-98
Mar-
99
Sep
-99
Mar-
00
Sep
-00
Mar-
01
Sep
-01
Mar-
02
Sep
-02
Mar-
03
Sep
-03
Mar-
04
Sep
-04
Mar-
05
Sep
-05
Mar-
06
Sep
-06
Mar-
07
Sep
-07
Mar-
08
Sep
-08
Mar-
09
Sep
-09
Mar-
10
Sep
-10
Mar-
11
Sep
-11
Mar-
12
Sep
-12
Mar-
13
Sep
-13
Mar-
14
(Rsbn)
Private Sector Government
-20%
-10%
0%
10%
20%
30%
40%
50%
60%
-
10,000
20,000
30,000
40,000
50,000
60,000
70,000
80,000
90,000
Mar
-96
Mar
-97
Mar
-98
Mar
-99
Mar
-00
Mar
-01
Mar
-02
Mar
-03
Mar
-04
Mar
-05
Mar
-06
Mar
-07
Mar
-08
Mar
-09
Mar
-10
Mar
-11
Mar
-12
Mar
-13
Mar
-14
Rs.
Bn
Projects UnderImplementation
Growth YoY %
-50%
0%
50%
100%
150%
200%
-
2,000
4,000
6,000
8,000
10,000
Mar
-96
Mar
-97
Mar
-98
Mar
-99
Mar
-00
Mar
-01
Mar
-02
Mar
-03
Mar
-04
Mar
-05
Mar
-06
Mar
-07
Mar
-08
Mar
-09
Mar
-10
Mar
-11
Mar
-12
Mar
-13
Mar
-14
Rs.
Bn
Projects StalledGrowth YoY %
Quarterly Investments added during the quarter
• Investment cycle suffered a virtual collapse.
Corporate sentiments were impaired due to
lack of clear road map, slowing GDP growth
and elevated cost of capital.
• Projects worth INR 8,000 bn got stalled – due
to Fuel linkages /EC/FC/Regulatory
Clearances, creating a large back log of capital
work in progress.
• Better policy framework and governance to
revive investments.

Copyright Aditya Birla Nuvo Limited 2013
Birla Sun Life Asset Management Company Limited
Source: Edelweiss
109,600
-
20,000
40,000
60,000
80,000
100,000
120,000 De
lhi
Mumb
ai
Bangal
ore
Chenna
i
Hydera
bad
Gurgo
an
Cochin
Jaipur
TotalRs. Crs
MRTS projects under development 2013-2017
9
661193 244
-133 -5 -54
742
-41
486
140
470 500
3,300
5,500
-1,000
0
1,000
2,000
3,000
4,000
5,000
6,000
7,000
8,000
9,000
10,000
2000
-01
2003
-04
2004
-05
2005
-06
2006
-07
2007
-08
2008
-09
2009
-10
2010
-11
2011
-12
2012
-13
2013
-14B
DFC
201
4-19
Railway Track addition in Kms.
Feeder routes
Trunk routes
Source: Barclays
The DFC impact
Source: NHAI
0
2000
4000
6000
8000
10000
12000
14000
16000
FY02 FY03 FY04 FY05 FY06 FY07 FY08 FY09 FY10 FY11 FY12 FY13
National Highway Projects Pipeline & Execution
Cummulative Projects Under Execution (km)
2 yr rolling execution (km)
Dedicated Freight Corridor
Mass Rapid Transit System
Investment cycle: The opportunity
• FDI in critical sectors like defense, media
• Policy for labor-intensive sectors like textiles
and construction are likely
Copyright Aditya Birla Nuvo Limited 2013
Birla Sun Life Asset Management Company Limited
New Government Report Card
• ‘Minimum Government, Maximum Governance’ on its way
a) Abolished several Group of Ministers (GoM) and Empowered GoM (EGoM)
b) Downsized the cabinet
c) Emphasized time-bound and transparent decision-making and sharply
increased the accountability of bureaucrats and ministers alike.
• Kick-starting the investment cycle
a) Government promised to achieve 25km/day of road construction in FY15
b) Issues with 3 critical railway links for coal transportation – stuck for a long time
on various issues – are being resolved with at least one project now on track.
• Inflation Control: The road is long
• Measures to address inflation in the short term
• Exhorting states to delist trade of fruits and vegetables through the Agriculture
Produce Market Committees (APMCs)- so farmers can sell directly
• The budget also promised a restructuring of the Food Corporation of India
(FCI)
10

Copyright Aditya Birla Nuvo Limited 2013
Birla Sun Life Asset Management Company Limited
11
• Both the inflation matrix have registered a sharp decline in the month of June. Favorable base effects
will continue to provide lower inflation prints till November.
• More importantly the momentum of Core inflation in case of both wholesale and retail has been
trending down vs. its historical average.
• Going forward we expect inflation to atleast achieve RBI glide path thus creating a headroom for
monetary easing eventually.
Source: Bloomberg, BSLAMC
Inflation and Rates to cool down further
-4%
-2%
0%
2%
4%
6%
8%
10%
12%
Ap
r-0
5
Oct
-05
Ap
r-0
6
Oct
-06
Ap
r-0
7
Oct
-07
Ap
r-0
8
Oct
-08
Ap
r-0
9
Oct
-09
Ap
r-1
0
Oct
-10
Ap
r-1
1
Oct
-11
Ap
r-1
2
Oct
-12
Ap
r-1
3
Oct
-13
Ap
r-1
4
WPI Core WPI
5.00%
6.00%
7.00%
8.00%
9.00%
10.00%
11.00%
12.00%
Jan
-12
Mar
-12
May
-12
Jul-
12
Sep
-12
No
v-1
2
Jan
-13
Mar
-13
May
-13
Jul-
13
Sep
-13
No
v-1
3
Jan
-14
Mar
-14
May
-14
CPI
Core CPI

Copyright Aditya Birla Nuvo Limited 2013
Birla Sun Life Asset Management Company Limited
• Industrial activity has shown green shoots since the beginning if the fiscal. High frequency data
such as automobile sales freight traffic etc. has also registered positive growth rates.
• The PMI for both manufacturing and services is back to expansionary mode. The business
expectation index also hits at revival continuation.
• The nascent sign of recovery in PMI and IIP reflect a cyclical upturn in GDP growth rate.
12
40.0
45.0
50.0
55.0
60.0
65.0
70.0
De
c-0
5
Jul-
06
Feb
-07
Sep
-07
Ap
r-0
8
No
v-0
8
Jun
-09
Jan
-10
Au
g-1
0
Mar
-11
Oct
-11
May
-12
De
c-1
2
Jul-
13
Feb
-14
PMI ManufacturingPMI Services
-10.0%
-5.0%
0.0%
5.0%
10.0%
15.0%
20.0%
25.0%
Ap
r'0
6
Sep
'06
Feb
'07
Jul'0
7
De
c'0
7
May
'08
Oct
'08
Mar
'09
Au
g'0
9
Jan
'10
Jun
'10
No
v'1
0
Ap
r'1
1
Sep
'11
Feb
'12
Jul'1
2
De
c'1
2
May
'13
Oct
'13
Mar
'14
IIP
IIP and PMI pick up .. Early signs of recovery

Copyright Aditya Birla Nuvo Limited 2013
Birla Sun Life Asset Management Company Limited
13
• Dramatic reduction seen in India’s trade deficit
due to falling imports and rising imports
• Gold imports are down 70%. Non Oil, Non Gold
imports also down. Current account deficit for
quarter ended March 14 is the lowest in 4 years
• Indian Rupee is amongst the best performing in
the past 9 months
Source: Bloomberg, BSLAMC
Current Account and Currency have stabilized Policy responses have worked..
-
5,000
10,000
15,000
20,000
25,000
30,000
35,000
40,000
45,000
50,000
Jan
-05
Jul-
05
Jan
-06
Jul-
06
Jan
-07
Jul-
07
Jan
-08
Jul-
08
Jan
-09
Jul-
09
Jan
-10
Jul-
10
Jan
-11
Jul-
11
Jan
-12
Jul-
12
Jan
-13
Jul-
13
Jan
-14
Imports, 3mma
Exports, 3mma
90
95
100
105
110
115
120
125
130
Mar
-13
Apr-1
3
May
-13
Jun-
13
Jul-1
3
Aug-
13
Sep-
13
Oct-1
3
Nov-
13
Dec-
13
Jan-
14
Feb-
14
Mar
-14
Apr-1
4
May
-14
Indian Rupee
Brazilian Real
S. African Rand
Indo Rupiah
-8%
-6%
-4%
-2%
0%
2%
4%
6%
8%
10%
12%
14%
Ma
r-0
1
Ma
r-0
2
Ma
r-0
3
Ma
r-0
4
Ma
r-0
5
Ma
r-0
6
Ma
r-0
7
Ma
r-0
8
Ma
r-0
9
Ma
r-1
0
Ma
r-1
1
Ma
r-1
2
Ma
r-1
3
Ma
r-1
4
Current Account
Capital Account
% of GDP,
quarterly annualised

Copyright Aditya Birla Nuvo Limited 2013
Birla Sun Life Asset Management Company Limited
14
Source: Bloomberg, BSLAMC
Budget The guiding post
Budget Overview 2014-15
GDP growth estimated between 5.4 - 5.9% as per the economic survey
Fiscal deficit budgeted at 4.1 % of GDP- and fiscal path 3.6% in FY16 and 3% in FY17.
Current account deficit expected at 2.1% of GDP
Revenue deficit projected at 2.9% of GDP
Net market borrowing to be Rs. 4.6 lakh crores
Road Map expected
Market expected clarity on Road map for GST & reforms for Subsidy rationalization.
Lack of clarity on the application of GAAR created uncertainty for a host of entities.

Copyright Aditya Birla Nuvo Limited 2013
Birla Sun Life Asset Management Company Limited
FY14 Deficit The fiscal deficit for FY14 was finally pegged at 4.5% of GDP v/s budget
estimates of 4.8% of GDP
Sharp cut in planned expenditure key reason (10.8% growth vs BE of 29.4%)
Revenues were running below budget estimates due to slowdown in economic activity and shortfall in divestment receipts
FY15 budget math: More realistic The fiscal arithmetic is based on nominal GDP growth of 13.4%, total
revenues rising 15.6% and expenditure rising 12.9%
GDP growth assumption moderately optimistic, expect receipts targets to be met on account of non-tax revenues
Higher expenditure budgeted for an investment starved economy
Upside risks to fiscal deficit unlikely
Budget Math and Our View
15

Copyright Aditya Birla Nuvo Limited 2013
Birla Sun Life Asset Management Company Limited
16
Source: Bloomberg, BSLAMC
Budget Key Sector announcements
Sector Impact Announcements
Infrastructure
Positive for all Road
developers/ Asset
Owners
NHAI allocation, Plan to construct 8000Km road,
Increase in planned Expenditure, REIT
Capital Goods Positive for T&D
companies New Feeder separation scheme
Capital Goods Positive for all
Industrial companies
Investment allowance of 15% for investments made
above Rs250mn as compared to Rs1bn earlier for a
period of 3 years.
Power Utilities
Positive for entire
sector
Govt. to oversee that all power companies to get
adequate coal supply
Banking Positive for Infra-
Finance
Banks to be permitted to raise long term funds for
lending to infrastructure sector
Banking and
Insurance
Positive for insurance
companies
Proposed to increase foreign ownership limit in the
insurance sector from 26% to 49% through the FIPB
route

Copyright Aditya Birla Nuvo Limited 2013
Birla Sun Life Asset Management Company Limited
17
India Inc: On the path to recovery

Copyright Aditya Birla Nuvo Limited 2013
Birla Sun Life Asset Management Company Limited
0%
2%
4%
6%
8%
10%
12%
FY91
FY92
FY93
FY94
FY95
FY96
FY97
FY98
FY99
FY00
FY01
FY02
FY03
FY04
FY05
FY06
FY07
FY08
FY09
FY10
FY11
FY12
FY13
FY14
Q1
FY14
Q2
FY14
Q3
FY14
Q4
FY15
E
FY16
E
FY17
E
GDP Growth Rate
Avg ('91-'13) = 6.63%
South
East
Asian
Crisis
18
Since ‘91 India’s growth has averaged 6.6%. We believe GDP growth has bottomed out in 2014
BoP
Crisis
Dot.Com
Bust & 9/11
Global
Financial
Crisis
Source: Bloomberg, BSLAMC
We expect cyclical bottom in GDP growth rates
Copyright Aditya Birla Nuvo Limited 2013
Birla Sun Life Asset Management Company Limited
19
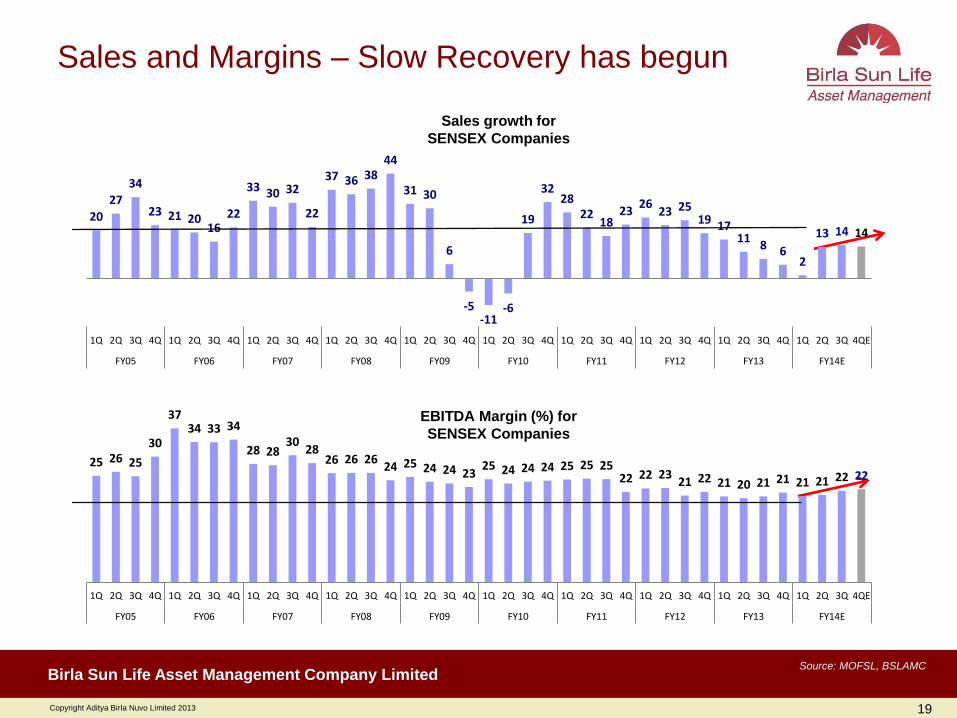
Sales and Margins – Slow Recovery has begun
Source: MOFSL, BSLAMC
Sales growth for
SENSEX Companies
EBITDA Margin (%) for
SENSEX Companies
20
27
34
23 21 20 16
22
33 30 32
22
37 36 38 44
31 30
6
-5 -11
-6
19
32 28
22 18
23 26
23 25 19 17
11 8 6
2
13 14 14
1Q 2Q 3Q 4Q 1Q 2Q 3Q 4Q 1Q 2Q 3Q 4Q 1Q 2Q 3Q 4Q 1Q 2Q 3Q 4Q 1Q 2Q 3Q 4Q 1Q 2Q 3Q 4Q 1Q 2Q 3Q 4Q 1Q 2Q 3Q 4Q 1Q 2Q 3Q 4QE
FY05 FY06 FY07 FY08 FY09 FY10 FY11 FY12 FY13 FY14E
25 26 25
30
37 34 33 34
28 28 30
28 26 26 26
24 25 24 24 23 25 24 24 24 25 25 25
22 22 23 21 22 21 20 21 21 21 21 22 22
1Q 2Q 3Q 4Q 1Q 2Q 3Q 4Q 1Q 2Q 3Q 4Q 1Q 2Q 3Q 4Q 1Q 2Q 3Q 4Q 1Q 2Q 3Q 4Q 1Q 2Q 3Q 4Q 1Q 2Q 3Q 4Q 1Q 2Q 3Q 4Q 1Q 2Q 3Q 4QE
FY05 FY06 FY07 FY08 FY09 FY10 FY11 FY12 FY13 FY14E
Copyright Aditya Birla Nuvo Limited 2013
Birla Sun Life Asset Management Company Limited
20
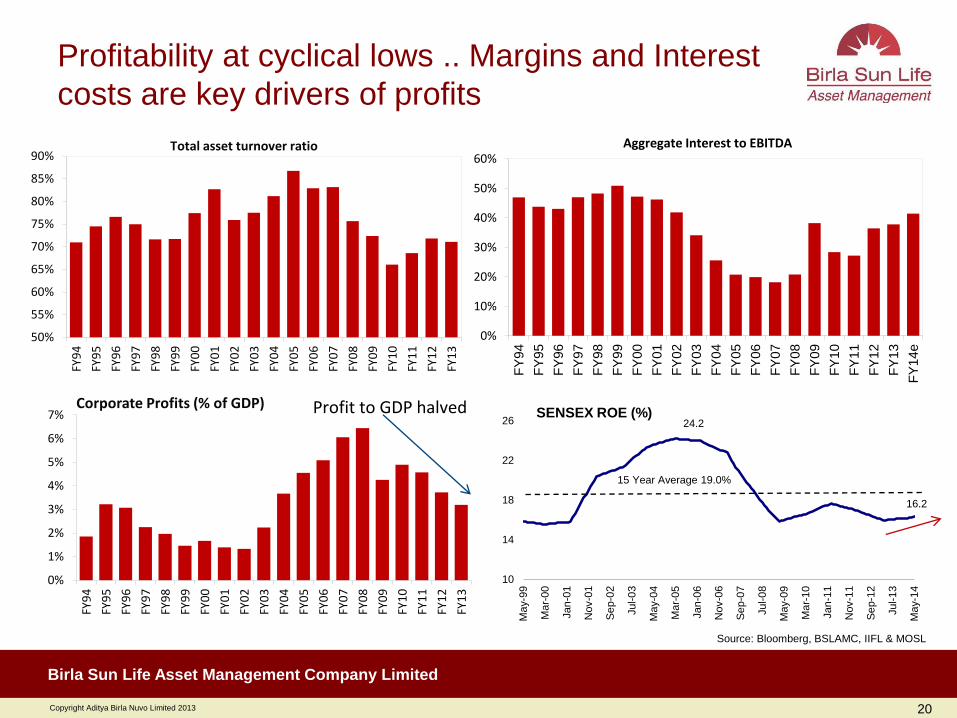
Profitability at cyclical lows .. Margins and Interest
costs are key drivers of profits
24.2
16.2
10
14
18
22
26
Ma
y-9
9
Ma
r-00
Jan
-01
Nov-0
1
Se
p-0
2
Jul-0
3
Ma
y-0
4
Ma
r-05
Jan
-06
Nov-0
6
Se
p-0
7
Jul-0
8
Ma
y-0
9
Ma
r-10
Jan
-11
Nov-1
1
Se
p-1
2
Jul-1
3
Ma
y-1
4
15 Year Average 19.0%
SENSEX ROE (%)
50%
55%
60%
65%
70%
75%
80%
85%
90%
FY9
4
FY9
5
FY9
6
FY9
7
FY9
8
FY9
9
FY0
0
FY0
1
FY0
2
FY0
3
FY0
4
FY0
5
FY0
6
FY0
7
FY0
8
FY0
9
FY1
0
FY1
1
FY1
2
FY1
3
Total asset turnover ratio
0%
10%
20%
30%
40%
50%
60%
FY
94
FY
95
FY
96
FY
97
FY
98
FY
99
FY
00
FY
01
FY
02
FY
03
FY
04
FY
05
FY
06
FY
07
FY
08
FY
09
FY
10
FY
11
FY
12
FY
13
FY
14e
Aggregate Interest to EBITDA
Source: Bloomberg, BSLAMC, IIFL & MOSL
0%
1%
2%
3%
4%
5%
6%
7%
FY9
4
FY9
5
FY9
6
FY9
7
FY9
8
FY9
9
FY0
0
FY0
1
FY0
2
FY0
3
FY0
4
FY0
5
FY0
6
FY0
7
FY0
8
FY0
9
FY1
0
FY1
1
FY1
2
FY1
3
Corporate Profits (% of GDP) Profit to GDP halved

Copyright Aditya Birla Nuvo Limited 2013
Birla Sun Life Asset Management Company Limited
Consensus expectations are still low
• Over the last four years we have seen an earning decline cycle. In FY12,FY13, FY14 we say
sharp cuts in Sensex earnings estimates.
• From Dec 2013 we saw consensus earning revision towards the positive side.
• Historically, analyst estimates for earning growth tends to lag in accelerating GDP growth
environment,. Over the course of next few years we expect upwards revision in estimates
21
Source: Morgan Stanley Research
1277
1129
1483
1287
1497
1352
1684
1576
1806
1834
1000
1150
1300
1450
1600
1750
1900
Apr2010 Oct2010 Apr2011 Oct2011 Apr2012 Oct2012 Apr2013 Oct2013 Apr2014
FY12
FY13
FY14
FY15E
FY16E
Copyright Aditya Birla Nuvo Limited 2013
Birla Sun Life Asset Management Company Limited
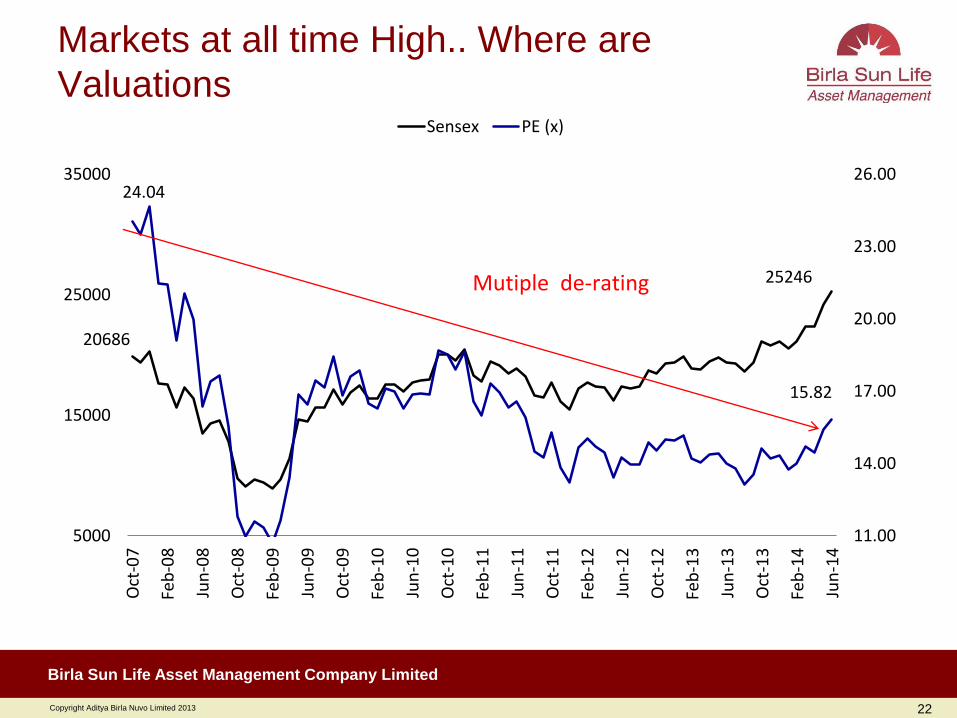
Markets at all time High.. Where are
Valuations
22
20686
25246
24.04
15.82
11.00
14.00
17.00
20.00
23.00
26.00
5000
15000
25000
35000
Oct
-07
Feb
-08
Jun
-08
Oct
-08
Feb
-09
Jun
-09
Oct
-09
Feb
-10
Jun
-10
Oct
-10
Feb
-11
Jun
-11
Oct
-11
Feb
-12
Jun
-12
Oct
-12
Feb
-13
Jun
-13
Oct
-13
Feb
-14
Jun
-14
Sensex PE (x)
Mutiple de-rating
Copyright Aditya Birla Nuvo Limited 2013
Birla Sun Life Asset Management Company Limited
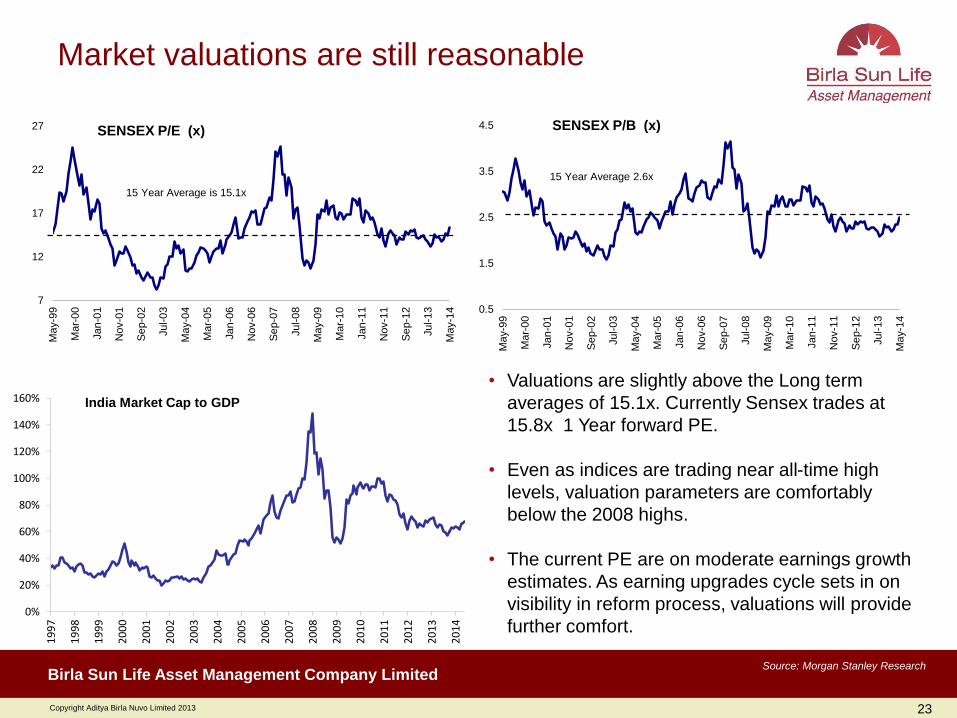
• Valuations are slightly above the Long term
averages of 15.1x. Currently Sensex trades at
15.8x 1 Year forward PE.
• Even as indices are trading near all-time high
levels, valuation parameters are comfortably
below the 2008 highs.
• The current PE are on moderate earnings growth
estimates. As earning upgrades cycle sets in on
visibility in reform process, valuations will provide
further comfort.
23
Source: Morgan Stanley Research
0%
20%
40%
60%
80%
100%
120%
140%
160%
19
97
19
98
19
99
20
00
20
01
20
02
20
03
20
04
20
05
20
06
20
07
20
08
20
09
20
10
20
11
20
12
20
13
20
14
India Market Cap to GDP
7
12
17
22
27
Ma
y-9
9
Ma
r-00
Jan
-01
Nov-0
1
Se
p-0
2
Jul-0
3
Ma
y-0
4
Ma
r-05
Jan
-06
Nov-0
6
Se
p-0
7
Jul-0
8
Ma
y-0
9
Ma
r-10
Jan
-11
Nov-1
1
Se
p-1
2
Jul-1
3
Ma
y-1
4
15 Year Average is 15.1x
SENSEX P/E (x)
0.5
1.5
2.5
3.5
4.5
May-9
9
Ma
r-00
Jan
-01
Nov-0
1
Se
p-0
2
Jul-0
3
Ma
y-0
4
Ma
r-05
Jan
-06
Nov-0
6
Se
p-0
7
Jul-0
8
Ma
y-0
9
Ma
r-10
Jan
-11
Nov-1
1
Se
p-1
2
Jul-1
3
Ma
y-1
4
15 Year Average 2.6x
SENSEX P/B (x)
Market valuations are still reasonable

Copyright Aditya Birla Nuvo Limited 2013
Birla Sun Life Asset Management Company Limited
24
Opportunities in valuation gaps, cyclical more
headroom..
Source: MOFSL, BSLAMC
Defensives vs Sensex P/B Cyclicals vs Sensex P/B
4.0
0.0
1.0
2.0
3.0
4.0
5.0
6.0
May
-04
No
v-0
4
May
-05
No
v-0
5
May
-06
No
v-0
6
May
-07
No
v-0
7
May
-08
No
v-0
8
May
-09
No
v-0
9
May
-10
No
v-1
0
May
-11
No
v-1
1
May
-12
No
v-1
2
May
-13
No
v-1
3
May
-14
FMCG-Sensex P/B +2 SD -2 SD Average
1.7
0.0
0.5
1.0
1.5
2.0
2.5
3.0
May
-04
No
v-0
4
May
-05
No
v-0
5
May
-06
No
v-0
6
May
-07
No
v-0
7
May
-08
No
v-0
8
May
-09
No
v-0
9
May
-10
No
v-1
0
May
-11
No
v-1
1
May
-12
No
v-1
2
May
-13
No
v-1
3
May
-14
Pharma-Sensex P/B +2 SD -2 SD Average
1.3
0.0
0.5
1.0
1.5
2.0
2.5
3.0
May
-04
No
v-0
4
May
-05
No
v-0
5
May
-06
No
v-0
6
May
-07
No
v-0
7
May
-08
No
v-0
8
May
-09
No
v-0
9
May
-10
No
v-1
0
May
-11
No
v-1
1
May
-12
No
v-1
2
May
-13
No
v-1
3
May
-14
Cap Goods-Sensex P/B +2 SD -2 SD Average
0.5
0.2
0.4
0.6
0.8
1.0
1.2
May
-04
No
v-0
4
May
-05
No
v-0
5
May
-06
No
v-0
6
May
-07
No
v-0
7
May
-08
No
v-0
8
May
-09
No
v-0
9
May
-10
No
v-1
0
May
-11
No
v-1
1
May
-12
No
v-1
2
May
-13
No
v-1
3
May
-14
Metals-Sensex P/B +2 SD -2 SD Average
Cyclical sectors trading below their LT average levels makes a compelling case for
mean reversion as outlook improves.

Copyright Aditya Birla Nuvo Limited 2013
Birla Sun Life Asset Management Company Limited
25
Sensex Historical Earnings Growth
Source: MOFSL, BSLAMC
81 129 181 250 266 291 278 280 216 236 272
348 450 523
718 833 820 834
1,024 1,123 1,184
1,338
1,525
1,802
FY9
3
FY9
4
FY9
5
FY9
6
FY9
7
FY9
8
FY9
9
FY0
0
FY0
1
FY0
2
FY0
3
FY0
4
FY0
5
FY0
6
FY0
7
FY0
8
FY0
9
FY1
0
FY1
1
FY1
2
FY1
3
FY1
4E
FY1
5E
FY1
6E
FY93-96: 45% CAGR
FY96-03: 1% CAGR
FY03-08: 25% CAGR
FY08-14: 8% CAGR
FY14-16E: 16% CAGR
FY93-FY14: 14% CAGR
15.8
17.651 19.38
17.65
8
14
20
26Sensex PE (x)
Sensex CAGR -1%
Sensex CAGR 14%
Sensex CAGR 39% Sensex CAGR -1%
Correlation
of Earning
growth
and
PE Re-rating
Copyright Aditya Birla Nuvo Limited 2013
Birla Sun Life Asset Management Company Limited
Outlook
Equity markets have rallied on decisive election outcome leading to hopes of improving
pace and quality of economic recovery.
• A pro-reform government coupled with decisive leadership will accelerate the reforms
and growth process.
• The depressed corporate profitability will improve over the next 3 to 5 of years as the
economy sees a cyclical uptick, clocking CAGR of 18% - driven by higher revenues,
operating leverage and interest costs savings.
• Even post the sharp run up- Sensex trades at 1year forward PE of 16.8x. Earning
upgrades cycle on visibility in reform process will provide further support to market and
valuations.
• We expect cyclical recovery in economy with average GDP growth of 6% over the next
5years with exit GDP of 7.5 to 8%. - equity returns will be driven both by earning
growth and valuation re-rating providing investor a good investment opportunity.
• In the current scenario, equity investments provide a compelling case over other asset
classes. Indian investors should increase their equity allocations and benefit from
Indian growth story.
26

Copyright Aditya Birla Nuvo Limited 2013
Birla Sun Life Asset Management Company Limited
27
Thank You

Copyright Aditya Birla Nuvo Limited 2013
Birla Sun Life Asset Management Company Limited
Internal views, estimates, opinions of BSLAMC expressed herein may or may not materialize. These views, estimates,
opinions alone are not sufficient and should not be used for the development or implementation of an investment strategy.
The portfolio of the scheme is subject to changes within the provisions of the Scheme Information Document(SID) of the
scheme. Please refer to the SID for asset allocation, investment strategy and scheme specific risk factors. Forward looking
statements are based on internal views and assumptions and subject to known and unknown risks and uncertainties which
could materially impact or differ the actual results or performance from those expressed or implied under those statements.
This document is strictly confidential and meant for private circulation only and should not at any point of time be construed
to be an invitation to the public for subscribing to the units of Birla Sun Life Mutual Fund. Please note that this is not an
advertisement. The document is solely for the information and understanding of intended recipients only. If you are not the
intended recipient, you are hereby notified that any use, distribution, reproduction or any action taken or omitted to be taken
in reliance upon the same is prohibited and may be unlawful. Views expressed herein should not be construed as
investment advice to any party and are not necessarily those of Birla Sun Life Asset Management Company Ltd.(BSLAMC)
or any of their officers, employees, personnel, directors and BSLAMC and its officers, employees, personnel, directors do
not accept responsibility for the editorial content. Wherever possible, all the figures and data given are dated, and the same
may or may not be relevant at a future date. Further the opinions expressed and facts referred to in this document are
subject to change without notice and BSLAMC is under no obligation to update the same. While utmost care has been
exercised, BSLAMC or any of its officers, employees, personnel, directors make no representation or warranty, express or
implied, as to the accuracy, completeness or reliability of the content and hereby disclaim any liability with regard to the
same.
Recipients of this material should exercise due care and read the scheme information document (including if necessary,
obtaining the advice of tax/legal/accounting/financial/other professional(s) prior to taking of any decision, acting or omitting
to act. Further, the recipient shall not copy/circulate contents of this document, in part or in whole, or in any other manner
whatsoever without prior and explicit approval of BSLAMC.
28
Disclaimers

Copyright Aditya Birla Nuvo Limited 2013
Birla Sun Life Asset Management Company Limited
Statutory Details: Constitution: Birla Sun Life Mutual Fund (BSLMF) has been set up as a Trust under the Indian
Trusts Act, 1882. Sponsors: Aditya Birla Financial Services Private Limited and Sun Life (India) AMC Investments Inc.
(liability restricted to seed corpus of 1 Lac). Trustee: Birla Sun Life Trustee Company Pvt. Ltd. Investment Manager:
Birla Sun Life Asset Management Company Ltd.
Risk Factors: Mutual Funds and securities investments are subject to market risks and there can be no
assurance or guarantee that the objectives of the Scheme will be achieved. As with any investment in
securities, the NAV of the Units issued under the Scheme may go up or down depending on the various
factors and forces affecting capital markets and money markets. Past performance of the Sponsor / Investment
Manager / Mutual Fund does not indicate the future performance of the Schemes and may not necessarily provide a
basis of comparison with other investments. The names of the Schemes do not, in any manner, indicate either the
quality of the Schemes or their future prospects or returns. Unitholders in the schemes are not being offered any
guaranteed/assured returns. Investors should read the Statement of Additional Information / Scheme Information
Document/ Key Information Memorandum available at Investor Service Centers and with distributors carefully
before investing.
The Material provided in this communication cannot be reproduced or quoted anywhere without express permission
from Birla Sun Life Asset Management Company Ltd.
Statutory Details & Risk Factors
29


![British Columbia Labour Market Outlook 2010 - 2020 · Labour Market OutlookLabour Market Outlook British Columbia Labour Market Outlook: 2010-2020 [2] B.C. Labour Market Outlook,](https://static.fdocuments.in/doc/165x107/5e167e8e481eae63a43f8127/british-columbia-labour-market-outlook-2010-2020-labour-market-outlooklabour-market.jpg)